open source security logging on the cheap (well, cheaper anyway)
TRANSCRIPT

Open Source Security LoggingON THE CHEAP
(WELL, CHEAPER ANYWAY)

[/home]# whoami
Scott Gerlach [[email protected], @sgerlach]
Director InfoSec Engineering and Architechture @ GoDaddy
Ran the SOC for 6 years
12yrs experience in InfoSec. EnVision customer (Hi Tena!)

WHAT THIS IS
Ideas we are looking at within GoDaddy to solve our logging and scalability issues using ELK stack and Hadoop
Discussion on our experience.
Tons of reference links at the end (ask me for the preso if you want them)
Potential ramblings of a mad man

WHAT THIS IS NOT
Technical discussion on how to run, tune, maintain ElasticSearch
Gospel on how to run your shop
Expert training on any of these tools. I’m a n00b and I admit it but I haz a search engine!

WHY ELK
Cuz they’re sassy?

Free Open Source Software – This can also be the #1 drawback based on where management like to put boots when stuff breaks
elasticsearch - Distributed and Scalable. Multiple Compute nodes handling storage and search
Logstash – Dead easy log parsing *groking*, enrichment and outputs to make you happy. And a cool hipster logo
Kibana – Visualize your data and do it fast

THE PLAN

DATA TYPES and EPS (so far)
IPS Logs – 150eps IDS Logs – 10eps FTP Logs – 400eps SSHD Logs – 15eps Customer-SSHD Logs – 30eps Windows Executables (in house developed) – 1500eps

LOGSTASH & GROK
Ships with ~120 different patterns you can extend Simple regex and data naming %{IPORHOST:src_address} - Matches 192.168.1.1 OR euripides01 Shouldn’t need to know this
IPV4 (?<![0-9])(?:(?:25[0-5]|2[0-4][0-9]|[0-1]?[0-9]{1,2})[.](?:25[0-5]|2[0-4][0-9]|[0-1]?[0-9]{1,2})[.](?:25[0-5]|2[0-4][0-9]|[0-1]?[0-9]{1,2})[.](?:25[0-5]|2[0-4][0-9]|[0-1]?[0-9]{1,2}))(?![0-9])
IPV6 ((([0-9A-Fa-f]{1,4}:){7}([0-9A-Fa-f]{1,4}|:))|(([0-9A-Fa-f]{1,4}:){6}(:[0-9A-Fa-f]{1,4}|((25[0-5]|2[0-4]\d|1\d\d|[1-9]?\d)(\.(25[0-5]|2[0-4]\d|1\d\d|[1-9]?\d)){3})|:))|(([0-9A-Fa-f]{1,4}:){5}(((:[0-9A-Fa-f]{1,4}){1,2})|:((25[0-5]|2[0-4]\d|1\d\d|[1-9]?\d)(\.(25[0-5]|2[0-4]\d|1\d\d|[1-9]?\d)){3})|:))|(([0-9A-Fa-f]{1,4}:){4}(((:[0-9A-Fa-f]{1,4}){1,3})|((:[0-9A-Fa-f]{1,4})?:((25[0-5]|2[0-4]\d|1\d\d|[1-9]?\d)(\.(25[0-5]|2[0-4]\d|1\d\d|[1-9]?\d)){3}))|:))|(([0-9A-Fa-f]{1,4}:){3}(((:[0-9A-Fa-f]{1,4}){1,4})|((:[0-9A-Fa-f]{1,4}){0,2}:((25[0-5]|2[0-4]\d|1\d\d|[1-9]?\d)(\.(25[0-5]|2[0-4]\d|1\d\d|[1-9]?\d)){3}))|:))|(([0-9A-Fa-f]{1,4}:){2}(((:[0-9A-Fa-f]{1,4}){1,5})|((:[0-9A-Fa-f]{1,4}){0,3}:((25[0-5]|2[0-4]\d|1\d\d|[1-9]?\d)(\.(25[0-5]|2[0-4]\d|1\d\d|[1-9]?\d)){3}))|:))|(([0-9A-Fa-f]{1,4}:){1}(((:[0-9A-Fa-f]{1,4}){1,6})|((:[0-9A-Fa-f]{1,4}){0,4}:((25[0-5]|2[0-4]\d|1\d\d|[1-9]?\d)(\.(25[0-5]|2[0-4]\d|1\d\d|[1-9]?\d)){3}))|:))|(:(((:[0-9A-Fa-f]{1,4}){1,7})|((:[0-9A-Fa-f]{1,4}){0,5}:((25[0-5]|2[0-4]\d|1\d\d|[1-9]?\d)(\.(25[0-5]|2[0-4]\d|1\d\d|[1-9]?\d)){3}))|:)))(%.+)?

SSHD Log Sample and GROK
SSHD_AUTH <%{INT:pri}>%{SYSLOGTIMESTAMP:eventtimestamp} %{IPORHOST:dst_address} %{SYSLOGPROG:prog}\[%{INT:pid}\]: %{GREEDYDATA:action} password for %{D ATA:user_id} from %{IPORHOST:src_address} port %{INT:src_port} ssh2
<86>Jan 6 16:07:43 a2nlswlb01 sshd[60856]: Failed password for root from 117.21.191.197 port 1243 ssh2

Suricata Log Sample and GROK
IDS <%{INT:pri}>%{SYSLOGTIMESTAMP:eventtimestamp} %{IPORHOST:sensor_name} %{SYSLOGPROG:prog}\[%{INT:pid}\]: \[%{INT:id}:%{INT:sid}:%{INT:rev}\] %{GREEDYDATA:filtername} \[Classification: %{GREEDYDATA:classification}\] \[Priority: %{INT:priority}\] \{%{DATA:protocol}\} %{IPORHOST:src_address}:%{INT:src
_port} -> %{IPORHOST:dst_address}:%{INT:dst_port}
<182>Jan 6 16:09:53 p3plnlids04 suricata[32600]: [1:4100009:3] Security Content - Excessive WordPress xmlrpc.php POST Requests (10/60s threshold) [Classification: Web Application Attack] [Priority: 1] {TCP} 93.174.93.61:50551 -> 173.201.1.128:80

Logstash Config – Input/Filter
input { udp { port => 51000 type => "sshd" } udp { port => 51001 type => "cust-sshd" } udp { port => 51002 type => "ids" }}
filter { if [type] == "cust-sshd"{ grok { patterns_dir => "/etc/logstash/grok/patterns/infosec_patterns.conf" match => [ "message", "%{CUST_SSHD_AUTH_MULTI_FAIL}" ] } }
else { drop {} } if ! [hit_count] { mutate { add_field => { "hit_count" => 1 } } } mutate { convert => ["hit_count", "integer"] } geoip { source => "src_address" }}

elasticsearch
One node.◦ Umm, don’t do that in prod… Data loss, performance bottlenecks, cats befriending dogs and other bad things
Our setup◦ 3 virtual nodes – 40GB disk, 4GB RAM (not even close to what you *should* run)◦ 3 data nodes, 1 master node, all sharing search◦ Handles around 100eps
Another cluster handles 2box cluster with 48Gb Ram and 4x300GB R10 Config handles ~800eps
Estimating about 1000eps in a real cluster

KIBANA
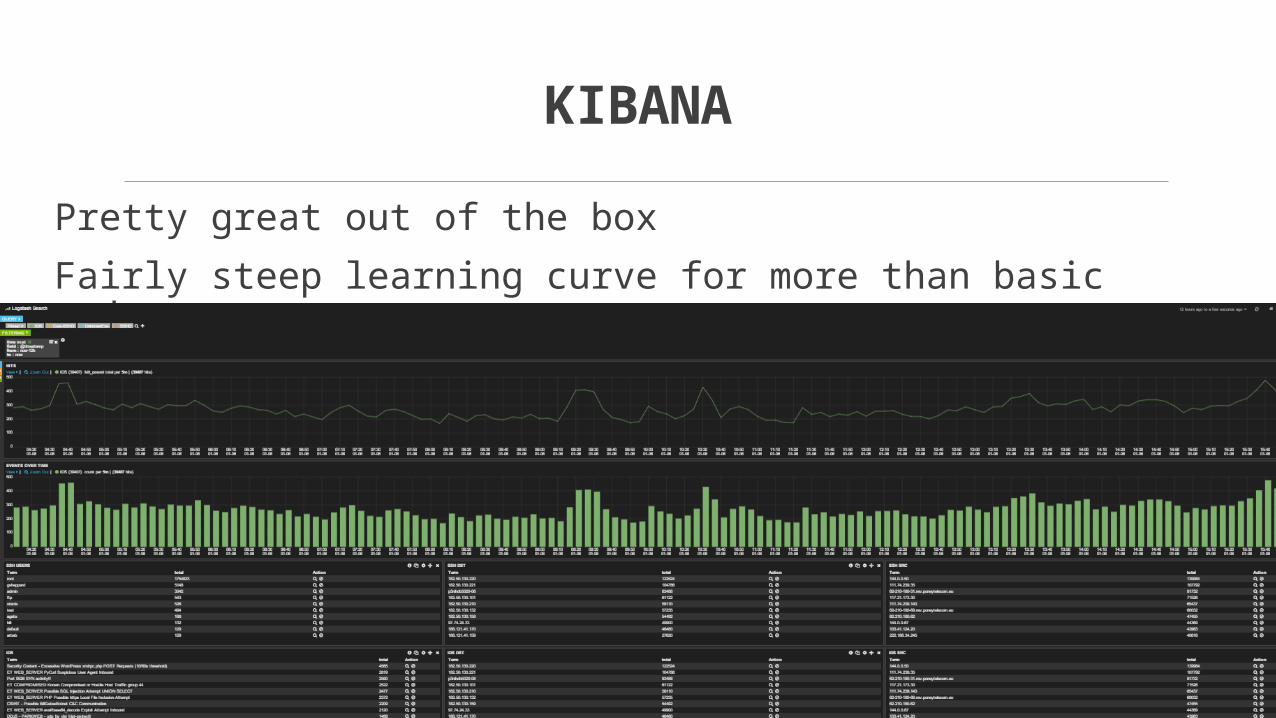
KIBANA
Pretty great out of the box Fairly steep learning curve for more than basic tasks

KIBANA
LIVE DEMO
(hopefully)

RESOURCES
ElasticSearch http://www.elasticsearch.org/guide https://www.loggly.com/blog/nine-tips-configuring-elasticsearch-for-high-performance/ http://edgeofsanity.net/article/2012/12/26/elasticsearch-for-logging.html http://www.elasticsearch.org/guide/en/elasticsearch/guide/current/_important_configuration_changes.html
Logstash http://grokdebug.herokuapp.com/ http://logstash.net/docs/1.4.2/
Kibana http://www.elasticsearch.org/guide/en/kibana/current/ http://www.rittmanmead.com/2014/11/analytics-with-kibana-and-elasticsearch-through-hadoop-part-3-visualising-the-data-in-kibana/