open research online filethe most important factor; the greater the depth, the greater the pathway...
TRANSCRIPT
Open Research OnlineThe Open University’s repository of research publicationsand other research outputs
Sound propagation through forests and tree beltsConference or Workshop ItemHow to cite:
Attenborough, Keith and Taherzadeh, Shahram (2016). Sound propagation through forests and tree belts. In:Proceedings of the Institute of Acoustics, 38(1) pp. 114–125.
For guidance on citations see FAQs.
c© [not recorded]
Version: Version of Record
Copyright and Moral Rights for the articles on this site are retained by the individual authors and/or other copyrightowners. For more information on Open Research Online’s data policy on reuse of materials please consult the policiespage.
oro.open.ac.uk

Proceedings of the Institute of Acoustics
Vol. 38. Pt. 1. 2016
SOUND PROPAGATION THROUGH FORESTS AND TREE BELTS K Attenborough Engineering and Innovation, The Open University, Milton Keynes MK7 6AA S Taherzadeh Engineering and Innovation, The Open University, Milton Keynes MK7 6AA
1 INTRODUCTION
The potential of forests or narrow belts of trees alongside surface transport corridors for reducing noise is often dismissed. Partly this is a consequence of conflicting experimental evidence. But also it is the result of incomplete understanding of the various attenuation mechanisms involved and, therefore, of how they could be exploited and used together in tree planting schemes. First experimental evidence supporting the use of forests or tree belts for noise abatement is presented. Subsequently the principal attenuation mechanisms and models for them are reviewed and resulting predictions are compared with data. Finally numerical simulations showing the potential for traffic noise reduction by narrow tree belts are outlined. The United States Department of Agriculture National Agroforestry Center has published guidelines for the planting of trees and bushes for noise control based on extensive data collected in the 1970s
1,2. Another study in the USA found a reduction of 8 dB in the A-weighted Leq from road traffic
due to propagation through 100 m of red pine forest compared with open grassland3. In this study,
the edge of the forest was 10 m from the edge of the highway and the trees occupied a gradual downward slope from the roadway extending about 325 m in each direction along the highway from the measurement site. A TRRL study in the UK found an extra 6 dB reduction in A-weighted L10 index of traffic noise propagating through 30 m of dense spruce compared with the same depth of grassland
4. Also this study found that the effectiveness of the vegetation was greatest closest to the
road. Measurements made with broadband source 2m high and receiver height 1.5 m through 500m of coniferous woodland have shown significant extra attenuation compared with CONCAWE predictions for propagation over acoustically-soft ground particularly in 63 Hz (3.2 dB), 125 Hz (9.7 dB), 2 kHz (21.7 dB) and 4 kHz (24.7 dB) octave bands
5. A relative reduction of 5 dB in the A-
weighted L10 index was found after transmission through 10 m of vegetation. In an investigation of the attenuation of sound by 35 different tree belts
6, a point source was placed in front of the tree
belts and sound pressure levels inside the tree belts were measured at different positions. Attenuation was found to depend on the width, height, length and density of tree belts. Large shrubs and densely populated tree belts were found to give more than 6 dBA attenuation, medium size shrubs and tree belts attenuated the sound by between 3 and 6 dBA and sparsely distributed tree belts and shrubs attenuated the sound by less than 3 dBA. The depth of vegetation was found to be the most important factor; the greater the depth, the greater the pathway of sound through the vegetation resulting in higher sound absorption and diffusion. The shrubs were considered to be the most effective in reducing noise due to scattering from dense foliage and branches at lower source-receiver heights. It was concluded that tree belts and shrubs should be planted together to provide best attenuation performance.
The propagation of sound through forests and tree belts involves ‘soft’ ground effect due to decaying leaf litter, reverberant scattering out of the direct source-to-receiver path by trunks and branches, absorption by tree bark, loss of coherence between ground-reflected and direct sound due to scattering, acoustically-induced vibrations of leaves and visco-thermal scattering by foliage. On the basis of calculations made in this paper and elsewhere, acoustically-induced leaf vibration and bark absorption do not contribute much to the overall attenuation whereas ground effect, the influence on ground effect of scattering by trunks and branches and attenuation by foliage appear to be relatively important. Ways of modelling these more important contributions are considered in the next section.
114
Proceedings of the Institute of Acoustics
Vol. 38. Pt. 1. 2016
2 MECHANISMS AND MODELS
2.1 Ground effect
During sound propagation through trees, as long as both the direct and ground-reflected sound components are able to reach the receiver coherently, they will interfere causing ground effect. Destructive interference gives rise to a frequency-dependent attenuation in excess of that due to distance and air absorption. AS well as source-receiver geometry it depends on the ground impedance. Fallen and decaying leaves beneath mature trees, shrubs and hedges have an important influence on the acoustical properties of ground. Fallen leaves create a leaf litter layer which, if undisturbed, decays to form a humus layer. A 0.025 m deep layer of decaying foliage (litter and humus layers) above the soil has been observed
7,8 during measurements of sound
transmission through 16 m tall red pine trees with mean trunk diameter 0.23 m and a mean spacing of 3.3 m. Similar layers have been observed during measurements in other types of forests
9,10.
Table 1 lists (non-acoustically) measured flow resistivity and porosity values for litter and humus layers
11.
Table 1 Measured flow resistivity and porosity of litter and humus layers
Ground Type Flow resistivity (kPa s m
-2)
Porosity – total or (air-filled / water-filled)
Litter layer on mixed deciduous forest floor
(0.02 0.05 m thick)
30 ± 31 -----
Beech forest litter layer (0.04 - 0.08 m thick) 22 ± 13 0.825 Pine forest litter (0.06 - 0.07 m thick) 9 ± 5 0.389/0.286 Humus on pine forest floor 233 ± 223 0.581/0.161
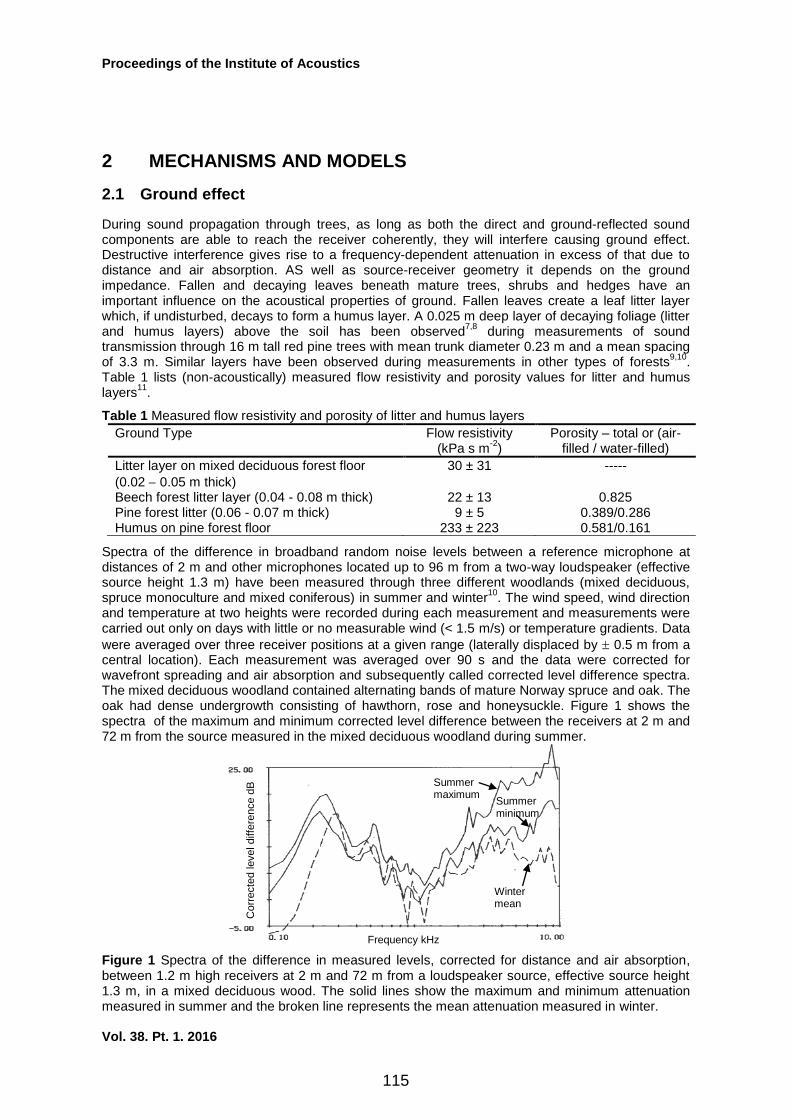
Spectra of the difference in broadband random noise levels between a reference microphone at distances of 2 m and other microphones located up to 96 m from a two-way loudspeaker (effective source height 1.3 m) have been measured through three different woodlands (mixed deciduous, spruce monoculture and mixed coniferous) in summer and winter
10. The wind speed, wind direction
and temperature at two heights were recorded during each measurement and measurements were carried out only on days with little or no measurable wind (< 1.5 m/s) or temperature gradients. Data
were averaged over three receiver positions at a given range (laterally displaced by 0.5 m from a central location). Each measurement was averaged over 90 s and the data were corrected for wavefront spreading and air absorption and subsequently called corrected level difference spectra. The mixed deciduous woodland contained alternating bands of mature Norway spruce and oak. The oak had dense undergrowth consisting of hawthorn, rose and honeysuckle. Figure 1 shows the spectra of the maximum and minimum corrected level difference between the receivers at 2 m and 72 m from the source measured in the mixed deciduous woodland during summer.
Figure 1 Spectra of the difference in measured levels, corrected for distance and air absorption, between 1.2 m high receivers at 2 m and 72 m from a loudspeaker source, effective source height 1.3 m, in a mixed deciduous wood. The solid lines show the maximum and minimum attenuation measured in summer and the broken line represents the mean attenuation measured in winter.
Summer maximum
Summer minimum
Winter mean
Corr
ecte
d level diffe
rence d
B
Frequency kHz
115

Proceedings of the Institute of Acoustics
Vol. 38. Pt. 1. 2016
The mean corrected level difference spectrum measured between the same receiver locations in the same woodland on several days in winter is shown also. The peaks in the corrected level difference spectra between 100 Hz and 300 Hz are due to destructive interference between direct and ground-reflected sound components while the dips near 1 kHz are due to constructive interference. The destructive interference peak in the mean winter spectrum is at a higher frequency than in either of the summer spectra. This is consistent with the seasonal variation that has been observed in the acoustical properties of grassland surfaces
12. Ground surfaces are wetter in winter
which makes them acoustically-harder. The measured high frequency attenuation in the mixed deciduous forest is higher in summer than in winter. This can be attributed to the fact that here were no leaves on the oak trees or on the deciduous shrubs in the understory during the winter measurements, t. Above 1 kHz attenuation by foliage appears to be important.
Destructive interference effects between 100 and 300 Hz measured in woodlands10
have been fitted by the classical Weyl-van der Pol theory for a point source above an impedance plane (see 2.2.2) using either a semi-empirical one parameter impedance model or its two parameter hard-backed layer version. These empirical impedance models are not physically admissible
13,14 since they lead
to predictions of negative real parts of complex density and surface impedance at low frequencies. Alternative physically admissible models give at least as good fits to ground effect data in forests
15.
One such model is the two parameter variable porosity impedance model given by
f
ic
f
RiZ eoe
o
8
1
, /)2( ne
, (1)
where 0 and c0 are the density and adiabatic sound speed in air respectively, Re is effective flow
resistivity, e is the effective porosity rate (/m), the (assumed exponential) rate of change of porosity with depth can be negative in which case it represents a porosity that increases with depth,
n is a grain shape factor and f is frequency. Another such impedance model assumes a
microstructure of parallel tortuous slit-like pores14,15
and is given by
)tanh()(1)(
1 ii ss
os
,
)tanh(
)1(1)()( 1
spr
spr
os iNiN
PC
,
s=
s
o
R
T
3 (2a)
)()( CTk , )(
)(12
C
T
cZ
oo
(2b)
where is porosity, Rs is flow resistivity, T is tortuosity, is the ratio of specific heats, P0 is static
atmospheric pressure, Npr is the Prandtl number and = 2f. The hard-backed layer version of this model is given by
(2c)
where d is the layer thickness. Figure 2 compares predictions of ground effect, using the variable porosity and slit pore impedance models, with corrected level difference spectra measured in mixed deciduous woodland and a spruce monoculture containing trees 11 m to 13 m tall having only dead branches below 4 m.
Figure 2 Corrected level difference spectra (open squares) measured using a 1.3 m high source (a) between 1.2 m high receivers at distances of 2 m and 48 m from the source respectively in mixed deciduous woodland and (b) between 1.2 m high receivers at source-receiver distances of 2 m and 96 m in a spruce monoculture and predictions including only ground effect and using the variable porosity (solid lines) and slit pore (broken lines) impedance models.
spruce monoculture
Loudspeaker source 1.3m high, receivers 1.2m high, separation 96m
100 1 103
1 104
30
20
10
0
10
Frequency Hz
Woodland (mixed oak and spruce in summer)
Loudspeaker source at 1.3 m height, receivers at 1.2m height, separation 48m
100 1 103
1 104
30
20
10
0
10
Frequency Hz
Co
rrecte
d le
ve
l d
iffe
ren
ce d
B
(a) (b)
116

Proceedings of the Institute of Acoustics
Vol. 38. Pt. 1. 2016
The plots show the negative of the corrected level difference to be consistent with convention used in plotting excess attenuation spectra. The variable porosity parameter values used in the
predictions shown in Figure 2 are effective flow resistivity 12 kPa s m2 and porosity rate 0 /m. The
slit pore model parameters are flow resistivity 35 kPa s m2, porosity 0.6 and, by assuming that
tortuosity = 1/porosity the three parameters required by the slit pore model are reduced to two. In
general tortuosity may be related to porosity by T = -n'
where n = 0.5 for spherical particles. Up to
1 kHz, predictions that include only ground effect agree with the level difference data in these two woodlands fairly well. Above this frequency other mechanisms are more important. Although the two impedance models described enable similar fits to these woodland data, the slit pore model has been found to give better fits to short range level difference spectra measured over other forest floors
15. Several other three-parameter models give more or less identical predictions to the slit pore
model and can be reduced to two-parameter forms in the same way15
. The variable porosity impedance model has been found to enable better fits than other models to data for sound propagation over grassland
15. Non-acoustical measurements such as those in Table 1 and fits to
sound propagation data show that mature forest floor surfaces have relatively low effective flow
resistivity (10 and 100 kPa s m2) compared with grassland (100 kPa s m2
and 2000 kPa s m2).
When source and receiver heights are near 1 m, the lower flow resistivity typical of a mature forest floor results in a first destructive interference at frequencies on the order of 200 to 300 Hz as shown in Fig.2. However, for sources at lower heights, corresponding for example to tyre/road interaction, the ground effect due to a tree belt with decaying leaf litter may be in a frequency range (500 Hz to 1 kHz) useful for reducing traffic noise. Moreover, as discussed in section 3.1, 'sonic crystal' effects may contribute if the planting is regular or almost regular.
2.2 Scattering by trunks and branches
2.2.1 Attenuation due to reverberant scattering
In the original analysis of the woodlands data10
, a theory for multiple scattering by a random array of cylinders due to Twersky
16 was used to account for attenuation associated with scattering of sound
energy out of the direct source-receiver path by trunks and larger branches (Ascatt). According to this theory
,
,
(3a)
, (3b)
where Z is the surface normal impedance of the cylinders with radius a, N is the number per unit area, J and H are the Bessel and Hankel functions of the first kind and order n and primes indicate first derivatives. To fit the measured attenuation above 1 kHz it was found necessary to reduce the measured area density of trunks by 60%. Figure 3 compares the range of measured attenuation per 24 m above 1 kHz in a spruce monoculture with predictions using both the measured and adjusted planting density.
Figure 3 Maximum and minimum measured attenuation (dB per 24 m - solid lines) in the spruce monoculture compared with predictions (equations (3)) of attenuation due to multiple scattering by 0.059 m radius trunks using, respectively, the measured number of scatterers per unit area of 0.303
m (broken line) and the adjusted (i.e. reduced by 60%) value of 0.1212 m (dash dot line).
117
Proceedings of the Institute of Acoustics
Vol. 38. Pt. 1. 2016
Even after adjusting to fit the measured attenuation magnitude, there was poor agreement with the measured attenuation above 1 kHz which increases more rapidly with frequency than predicted by equations (3). Nevertheless, the results of data fitting indicated that scattering by trunks accounted for a considerably higher proportion of the attenuation in the spruce monoculture and the mixed woodland in winter than in a mixed coniferous woodland or the mixed deciduous woodland in summer. The proportionately higher contributions to the attenuation above 1 kHz from reverberant scattering in the spruce monoculture and the deciduous woodland in winter is consistent with the smaller density and extent of the foliage. The young mixed coniferous stand containing alternate rows of red cedar, Norway spruce and Corsican pine with foliage along the whole length of the pine trunks i.e. down to ground level thereby forming a denser barrier of branches and foliage than offered by the other two sites. The mixed deciduous woodland had considerably more undergrowth and foliage (in summer). In any case the measured and predicted attenuation of sound attributable to reverberant scattering by trunks and branches is small compared to visco-thermal attenuation due to foliage which is discussed in section 2.3.
2.2.2 Incoherence due to scattering
While scattering of sound by trunks and branches out of the path between source and receiver contributes slightly to the overall attenuation, it has a more important effect in reducing the coherence between direct and ground-reflected sound thereby weakening their interference. In NORD 2000 the loss of coherence is predicted by introducing two adjustable parameters
18. The first
represents the fraction of coherent sound that is transformed into incoherent sound. It increases with the frequency and trunk diameter but is zero if there is no scattering. The second parameter depends on the density of planting and the average trunk diameter. This relates the scattering-induced incoherence to tree diameter and planting density and improves agreement between predictions and data at the destructive interference frequencies of ground effect. But the lack of explicit allowance for foliage attenuation means that there is consistently poor overall agreement between forest data and predictions at high frequencies
18.
Scattering by atmospheric turbulence is known also to reduce the coherence between direct and ground-reflected sound. Consequently an alternative approach to calculating the influence of the trunk and branch scattering is to model it as 'frozen turbulence'. A convenient analytical method for calculating the influence of turbulence on propagation from a point source near the ground due to Clifford and Lataitis
17 leads to an expression for the mean square pressure given by equation (4a).
TRRkRR
Q
R
Q
Rp 12
21
2
2
2
2
1
2 cos21 , (4a)
where k is the wave number, R1 and R2 are the direct and image path lengths respectively and Q (=
|Q|ei
) is the complex, spherical wave reflection coefficient (a function of source and receiver
geometry and ground impedance), being its phase, and, T, the coherence factor associated with the effect of turbulence having a Gaussian spectrum, is given by
12
eT . (4b)
In Eq. 4b, 2 is the variance of the phase fluctuation along a path given by,
0
222 RLkA , (4c)
where L0 is the outer scale of turbulence, R is the range, 2 is the variance of the index of
refraction and the coefficient A is given by,
A = 0.5, R > kL02 or A = 0, R < kL0
2 , (4d)
is the phase which is given as a function of L0 and h, the maximum transverse path separation in the absence of refraction, by
0
0 erf2 L
h
h
L , (4e)
rs hhh
11121 , (4f)
hs and hr are the source and receiver heights respectively, and erf(x) is the error function defined by,
118

Proceedings of the Institute of Acoustics
Vol. 38. Pt. 1. 2016
x
t dtex0
22erf
. (4g)
The Sound Pressure Level, Lp, is calculated from the mean square sound pressure using
Lp = 10 log10 (p2) (5)
Studies of outdoor propagation near the ground have suggested that a typical value for L0 is the
source height and that typical values of 2 for atmospheric turbulence are between 210 and
10. When predicting sound propagation through 0.5 m tall crops, the loss of coherence due to
scattering by stems has been modelled as an ‘enhanced turbulence' using values for 2 and L0
obtained by best fit to data19
.
2.3 Foliage attenuation
As well as converting some of the incident sound energy into leaf and stem vibrations, foliage and stems in vegetation scatter some of the incident sound energy away from its original direction and convert some sound energy into heat by viscous and thermal processes at leaf surfaces. The original analysis of woodlands data
10 considered the observed high frequency attenuation in
woodland to be the sum of scattering by two independent cylinder arrays; an acoustically-hard array corresponding to trunks and larger branches, and an acoustically-soft array of small cylinders
corresponding to foliage. Although this enables predictions of attenuation rates comparable in
magnitude to the measured values, the predicted dependence on frequency (see Fig. 3 for example) differs that observed. Figure 4 shows log(frequency) fits to measured attenuation above 1 kHz in three woodlands (mixed deciduous (Summer), spruce monoculture and mixed conifers)
20.
Also shown in Fig.4 is the foliage attenuation correction according to values tabulated in ISO9613-2
21 based on a Danish study
22 which made measurements through tree belts between 15 m and 41
m wide and found relative attenuations of only 3 dB in the A-weighted Leq due to traffic noise. Both the data shown in Fig.4 and other data (see Introduction) indicate that the ISO9613-2 foliage correction significantly underestimates attenuation due to foliage.
Figure 4 Measured attenuation (dB/m) above 1 kHz and best fit log(frequency) predictions: in mixed conifers (open squares) fitted by 0.81log(f/1000); in mixed deciduous woodland in Summer (open circles) fitted by 0.38log(f/1000) (solid line) and in a spruce monoculture (open diamonds) fitted by 0.29log(f/1000). The dotted line represents foliage attenuation per m predicted by ISO9613-2. On the basis of measurements of transmission loss through dense corn, hemlock, red pine trees, hardwood brush and dense reeds in water, Aylor
7,8 has suggested that the normalised excess
attenuation divided by the square root of the product of foliage area per unit volume or leaf area density (F per m) and the propagation path length (L m) is related to the product of wavenumber (k
= 2f/c0) and a mean leaf width (a m). A formula that fits Aylor's data is18
)(5.03.0exp1)(
kaAFL
dBEA , ka 0.6 (6)
mdfoliagej
if fj
1000 0 48 mdpredj
Totattmdj
HLDTwd1j
mdfoliagej
1 103
1 104
0
0.2
0.4
0.6
0.8
p
Att
enuatio
n d
B/m
Frequency Hz
119

Proceedings of the Institute of Acoustics
Vol. 38. Pt. 1. 2016
where EA(dB) represents the excess attenuation due to foliage in dB and A is a constant, the value A = 3 giving best fit to Aylor’s data. The lower limit on ka avoids negative values of EA. Equation (6) implies that attenuation depends on the square root of path length. Although equation (6) has been used successfully in fitting data for sound propagation through crops
18 it predicts that (a) the
increase in attenuation with frequency due to foliage has a limit and (b) a leaf size below which it cannot be used. An alternative fit to Aylor's data for attenuation through crops, without these deficiencies, is given by:
]9.0[1.0)(
kakaFL
dBEA (7)
Figure 5(a) compares the fits to Aylor's data provided by equations (6) and (7) and figure 5(b) compares various data for foliage attenuation with predictions using equation (7).
Figure 5 (a) Aylor's data for sound attenuation through corn and reeds normalised by the square root of the product of leaf area density and path length [open circles, squares and triangles] compared with predictions of equations (6) [broken line] and (7) [solid line] (b) data for attenuation in dB per m in dense corn (open circles)
8, a mixed coniferous woodland (open squares)
10, a mixed
deciduous woodland in Summer (open diamonds)10
and an evergreen forest (crosses)23
and corresponding fits using equation (7) [dash-dot line F = 3/m, a = 0.074 m (corn); solid line F = 2/m, a = 0.024 m (mixed conifers); dotted line F = 1.5/m, a = 0.012 m (mixed deciduous); thick solid line F = 1.4/m, a = 0.01 m (evergreen forest)]. The thin (brown) solid line represents foliage attenuation per m predicted by ISO9613-2. Predictions of foliage attenuation using log(frequency) relationships or either of the empirical formulae (6) and (7) yield reasonably good agreement with data at frequencies above 1 kHz but below 1 kHz the data are influenced by ground effect. Predictions that are compared with data for sound propagation in forests in the next section are made using only equation (7).
2.4 Addition of ground effect, reverberant scattering and foliage attenuation
Apart from the incoherence resulting from scattering by trunks and branches, the question arises of how ground and scattering effects can be combined. This depends on the total cross section of scatterers per unit area, known as the filling fraction. Laboratory measurements on sparse arrays of vertical cylinders on soft ground
26,27 and numerical simulations
28 have shown that, for the low filling
fractions expected in tree plantings, scattering and ground effects can simply be added. Indeed, a study of sound propagation through crops has shown that a reasonably accurate simplified prediction scheme adds only ground effect and foliage attenuation
19.
Figure 6(a) compares data for the maximum and minimum corrected level difference between 1.2 m high receivers at 2 m and 72 m from a 1.3 m high source in a mixed deciduous woodland
10 with
predictions of the sum of scattering-modified ground effect and foliage attenuation calculated according to eqn. (7). Foliage attenuation is predicted to contribute throughout the frequency range. Figure 6(b) compares data for the corrected level difference between 1.2 m high receivers at 2 m and 96 m from a 1.3 m high source in a spruce monoculture woodland
10 with predictions of the sum
FL
dBEA )(
scattering parameter ka
Atte
nuatio
n (
dB
per
m)
Frequency Hz
(a) (b)
120

Proceedings of the Institute of Acoustics
Vol. 38. Pt. 1. 2016
of ground effect and foliage attenuation (thin dash-dot line) without and scattering-induced incoherence modelled as the effect of 'frozen turbulence'. The latter is predicted to be important.
Figure 6 (a) Maximum and minimum differences in levels measured at 1.2 m high receivers 2 m and 72 m from a 1.3 m high source in a mixed deciduous woodland in Summer corrected for distance and air absorption (solid lines)
10 compared with predictions of the sum of ground effect
modified by scattering-induced incoherence (2 =10, L0 = 1.3 m) and foliage attenuation
calculated from equation (7) (F = 4.5 /m, a = 0.09 m). The broken line is the result of using the slit
pore layer model for ground impedance ( = 0.6, Rs = 30 kPa s m2, d = 0.12 m) and the dash dot
line is the result of using the variable porosity model (Re = 15 kPa s m2, e = 40 /m). (b) Corrected
level difference spectrum measured in a spruce monoculture woodland10
compared with the sum of
ground effect (slit pore layer: = 0.6, Rs = 30 kPa s m2, d = 0.12 m) and foliage attenuation (F =
1.8 /m, a = 0.1 m) (dotted line) and these plus scattering-induced incoherence (2 = 10, L0 = 1.3
m) (broken line). Measurements have been carried out with a loudspeaker source at 0.8 m height, six 1.2 m high receivers at horizontal source-to-receiver distances of between 2 m and 80 m in forests of poplars, pines and oaks
18. Measured excess attenuation spectra were compared with predictions of the
NORD2000 model which includes incoherence due to scattering by trunks calculated from the mean trunk diameter and basal area. All measurements were carried out on days with very little wind and a homogeneous atmosphere was assumed in the predictions. It was found that while the measured excess attenuation spectra agree tolerably well with predictions of ground effect alone at a range of 10 m, they departed from the data at longer ranges. Typically the measured minima associated with the first destructive interference were less pronounced than in the predictions. Except in the oak forest where the inclusion of scattering-induced incoherence improved agreement between predictions and data significantly, the predictions with and without the incoherence due to scattering by trees were found to be more or less the same. To obtain the best ground effect fits it was found necessary to vary the effective flow resistivity (in the physically inadmissible single parameter model) with range.
Figures 7(a) and (b) show excess attenuation data (black solid lines) at 10 m and 80 m, respectively, in the pine forest
18. In Fig. 7(a), also shown are predictions of ground effect alone
using the slit pore layer model (red solid line: Rs = 120 kPa s mand d 0.04 m)
and the variable porosity model (blue broken line: Re = 35 kPa s m-2
) modified by scattering-induced
incoherence (eqns. (4) 2 = 10, L0 = 0.8 m) and foliage attenuation (eqn. (7) F = 1.8/m and a =
0.1 m). In Figure 7(b) parameters Rs = 80 kPa s mand d 0.05 m give a better fit
using slit pore layermodel and e = -40 /m gives a better fit at 80 m than e = 10 /m which gives a
good fit at 10 m using the variable porosity model.The contribution of foliage attenuation at 80 m range is indicated by the difference between predictions without (thin broken line) and with it (thick broken line). The predicted contribution of foliage attenuation at 10 m range (blue broken line) appears to be an overestimate. Even after 'tuning' the impedance model parameters to fit near the first destructive interference, the poor fit to the frequency of the second destructive interference,
Corr
ecte
d level diffe
rence d
B
Frequency Hz Frequency Hz
(a) (b)
121

Proceedings of the Institute of Acoustics
Vol. 38. Pt. 1. 2016
which is very sensitive to the source-receiver geometry, suggests that there during these measurements there may have been differences from the nominal measurement geometry.
Excess a
ttenu
ation d
B
Frequency Hz Frequency Hz
Figure 7 Excess attenuation in a pine forest measured by 1.2 m high receivers (a) at 10 m and (b) at 80 m (black solid lines) from a loudspeaker source at 0.8 m height
19. Predictions include ground
effect using the slit pore layer impedance model (red solid lines): (a) d 0.04 m, Rs
= 120 kPa s m(b)d 0.05 m Rs = 80 kPa s m) and the variable porosity model
(blue broken lines) Re = 35 kPa s m-2
(a) e = 10 /m (b) e = -40 /m; scattering-induced incoherence
modelled as frozen turbulence (2 = 10, L0 = 0.8 m) and empirically-predicted foliage attenuation
(eqn.(7) with F = 1.8 /m and a = 0.1 m. Predictions without foliage attenuation are shown by the red solid line in (a) and the brown dash-dot line in (b).
3 TREE BELTS AS NOISE BARRIERS
3.1 'Sonic crystal' effects
Many tree plantings may be considered to consist of regular arrays of vertical circular cylinders. Coherent multiple scattering (sometimes called Bragg scattering) by regular cylinder arrays results in constructive and destructive interference effects. In the frequency domain destructive interference is associated with band gaps i.e. frequency ranges with zero or reduced transmission. If a sound wave is normally incident on a regular scatterer array (sonic crystal) with a centre-to-centre separation (lattice constant) of d, the frequency at which the band gaps occur are given by
d
ncf
2
0 , (8a)
The first band gap corresponds to n = 1; the frequencies of subsequent higher order band gaps are obtained by substituting higher values of n. Constructive interferences or pass bands occur between the band gaps and their frequencies are predicted in a similar way. The magnitude of the insertion loss peaks in the band gaps depends on the filling fraction. In a square array of cylinders of radius R with lattice constant d the filling fraction is given by
. (8b)
Studies of insertion loss due to regular arrays of cylinders have been made with the aim of designing sonic crystal noise barriers (SCNB)
24,25,26. Relatively few of these studies have
considered the interaction between ground and scattering effects. Laboratory measurements have been made of sound transmission through regular 5×10 arrays of PVC pipes, each of which having outer diameter 0.04 m, wall thickness 0.002 m and length 0.5 m, on acoustically-hard and acoustically-soft surfaces
24,25. The distance between the point source and
the nearest-to-source row of pipes was 0.51 m, the array was 0.44 m wide and the receiver was 5 cm from the nearest-to-receiver row of pipes. Figures 8(a) and (b) show insertion loss spectra measured with source-receiver separation 1.0 m, receiver height 0.1 m and a source height of 0.02 m and 5×10 vertical PVC pipe arrays located on (a) a felt layer and (b) MDF. The insertion loss peaks near 1.7 kHz, 3.4 kHz and between 6 and 7 kHz correspond to 1st, 2nd and 3rd order band
(a) (b)
122

Proceedings of the Institute of Acoustics
Vol. 38. Pt. 1. 2016
gaps respectively. The insertion loss (IL) measurements are with respect to free field. So the negative insertion losses observed at low frequencies over both surfaces corresponds to pressure doubling due to the introduction of the ground surface. The negative insertion loss in the data between 2 and 3 kHz above MDF (Figure 8(b)) corresponds to the first pass band. Over MDF, with a source height of 0.02 m, the lowest attenuation peak due to destructive interference between direct and ground-reflected components is above 20 kHz and the IL peaks associated with band gaps are more or less unaltered. A broader destructive interference is observed over the felt surface near 3 kHz (Figure 8(a)) this enhances the 1st, 2nd, 3rd and 4th band gaps thereby indicating that, near grazing, scattering and ground effects add together usefully in the frequency range of the first ground effect destructive interference. The spectra in Figures 8(a) and (b) show also the measured results of perturbing each cylinder location by the cylinder diameter. The perturbation has a beneficial effect over a wide frequency range. Essentially for the low filling fraction used (0.13) the perturbation enhances the 2
nd and higher order band gap peaks in attenuation and suppresses the
pass bands.
Figure 8 Measured insertion loss spectra due to 5×10 arrays of PVC pipes, having outer diameter 0.04 m, wall thickness 0.002 m and length 0.5 m resting vertically on (a) acoustically-soft (thin felt layer) and (b) acoustically-hard (MDF) surfaces
24,25 placed between a 0.02 m high point source and
a 0.1 m high receiver at a distance of 1 m from the source. The upper solid lines represent the insertion loss spectra due a regularly spaced (0.1 m centre-to-centre) [black] array and a perturbed spacing [red] array respectively. The lowest solid [blue] lines represent insertion loss spectra measured in the absence of any array (due to ground effect only).
'Sonic crystal' effects such as those appearing in Figure 8 have been observed in measurements of transmission through arrays of nursery trees in flower pots placed in regular patterns over hard ground
27. However, in these experiments the trees were placed closer together than would be
viable in a healthy plantation. The tree filling fractions (0.47) leading to observed sonic crystal effects in these measurements exceed those commonly used in tree belts and orchards. Measurements made in pre-existing plantations with much lower filling fractions (0.07 - 0.1) did not show any sonic crystal effects in the transmission loss spectra.
3.2 Designing tree belts for noise reduction
The total area of ground occupied by tree trunks is a first indication of biomass and the likely acoustical shielding of a tree belt. As the fractional area of ground occupied by trunks, called the stem cover fraction or basal area fraction, increases, the acoustical shielding increases. High stem cover fractions correspond to high stem diameters and short distances between adjacent trees. Nevertheless, whatever the stem cover fraction, numerical investigations have shown that the use of a specific trunk spacing/diameter combination assisted by a judicious distribution of supporting poles around the trees (when young) can contribute to the noise shielding by a tree belt
28,29. An
example series of numerical calculations assumes a coherent line source representation of road traffic and a 15 m wide rectangular array of tree trunks. The insertion loss from Finite Difference Time Domain (FDTD) computations of multiple scattering by tree trunks (infinitely long 0.22 m diameter cylinders on a 1 m × 2 m (normal to road) rectangular grid) in the absence of the ground plane is added to the insertion loss accounting for discontinuous ground effect between the
1 03
1 04
-1 0
0
1 0
2 0
3 0
4 0
5 0
F re q u e n cy (H z)
Ins
erti
on
Lo
ss
(d
B)
P e rio d ic S .C . o n F e lt
P e rtu rb S .C . (S .D . = 2 .0 *R )
F e lt G ro u n d E ffe c t
(b )
L .C . = 0 .1 m
H s = 0 .0 2 m , H r = 0 .1 m
1st band gap (1.7 kHz)
2nd
band gap (3.4 kHz)
1st ground effect dip/peak
(a)
1 03
1 04
-1 0
0
1 0
2 0
3 0
4 0
F re q u e n cy (H z)
Ins
erti
on
Lo
ss
(d
B)
P e rio d ic S .C . o n M D F
P e rtu rb S .C . (S .D . = 2 .0 *R )
M D F G ro u n d E ffe c t
(b )
L .C . = 0 .1 m
H s = 0 .0 2 m , H r = 0 .1 m
(b)
123

Proceedings of the Institute of Acoustics
Vol. 38. Pt. 1. 2016
acoustically-hard and forest floor surfaces at the road edge and between forest floor and grassland, calculated using a Green's Function Parabolic Equation (GFPE) method. Absorption by tree bark is included through a frequency and angle independent purely real impedance relative to air of 51 at the cylinder surfaces. As long as the supporting poles (0.06 to 0.08 m diameter, 3 per trunk) are more absorbing than the tree trunks, then the predicted insertion loss at a receiver 30 m from a 4-lane road with uniform traffic moving at 70 km/h containing 15% heavy vehicles due to a rectangular (1m spacing parallel to the road and 2 m spacing normal to the road) distribution of trees and poles (total basal area 1.5%) can exceed 10 dBA to which the supporting poles contribute about 4 dB compared with about 3 dB due to ground effect. These numerical simulations do not include foliage attenuation. Also they do not include meteorological influences which are discussed elsewhere
30.
4 CONCLUSIONS
Apart from meteorological effects, the most important mechanisms that influence sound propagation in forests and mature tree stands are 'soft' ground effect and visco-thermal attenuation in foliage. Typically the ground covering formed by leaf litter and decayed leaf litter is more acoustically-soft than grassland. Nevertheless the first destructive interference part of ground effect can be in a useful frequency range for reducing tyre/road noise. Incoherent scattering by trunks and branches can be modelled as 'enhanced turbulence', decreasing the first destructive interference due to 'soft' ground effect and reducing higher order interference but not contributing much to the overall attenuation. Foliage attenuation contributes over a broad frequency range but most significantly above 1 kHz and can be modelled tolerably well using an empirical formula relating attenuation to leaf area density and mean leaf size. The arrangement of the trees can be designed to add higher order band gaps and enhance the ground effect. Predicted effects of the various mechanisms can be added to give an insertion loss exceeding 6 dBA for a 15 m wide tree belt compared with the same width of grassland.
5 ACKNOWLEDGEMENT
Part of the research reported in this paper has received funding from the European Community's Seventh Framework Programme (FP7/2007-2013) under grant agreement n° 234306, collaborative project HOSANNA.
6 REFERENCES
1. Overstory #60, Trees as noise buffers http://agroforestry.org/overstory-back-issues/203-overstory-60-trees-as-noise-buffers 1998 (last viewed 2/7/16)
2. D. I. Cook and D.F. Van Haverbeke, 'Tree covered land forms for noise control', UNIV. NEBR. AGRIC. EXP. STAT. RES. BULL. 263, 47p (1974)
3. G. M. Heisler, O. H. McDaniel, K. K. Hodgdon, J. J. Portelli and S. B. Glesson, Highway Noise Abatement in Two Forests, Proc. NOISE-CON 87, PSU, USA (1987)
4. L. R. Huddart, “The use of vegetation for traffic noise screening” TRRL Research Report 238 (1990).
5. G. A. Parry, J. R. Pyke, and C. Robinson, 'The excess attenuation of environmental noise sources through densely planted forest', Proc. IOA., 15(3), 1057 - 1065 (1993)
6. C.-F. Fang and D.-L. Ling, 'Investigation of the noise reduction provided by tree belts', Landscape and Urban Planning 63(4) 187–195 (2003).
7. D. Aylor, 'Noise reduction by vegetation and ground', J. Acoust. Soc. Am. 51 197-205 (1972)
8. D. E. Aylor, “Sound transmission through vegetation in relation to leaf area density, leaf width and breadth of canopy”, J.Acoust. Soc. Am., 51(1) 411 -414 (1972).
9. W. H. T. Huisman, 'Sound Propagation over vegetation-covered ground', Ph.D. Thesis, University of Nijmegen, The Netherlands (1990).
10. M. A. Price, K. Attenborough and N. W. Heap, 'Sound attenuation through trees: Measurements and Models', J. Acoust. Soc. Am., 84(5), 1836-1844 (1988).
124

Proceedings of the Institute of Acoustics
Vol. 38. Pt. 1. 2016
11. M. J. M Martens, L.A.M. van der Heijden, H. H. J. Walthaus and W.J.J.M. van Rens. 'Classification of soils based on acoustic impedance, air flow resistivity and other physical soil parameters'. J. Acoust. Soc. Am. 78 970-980 (1985).
12. G. Guillaume, F. Faure, B. Gauvreau, F. Junker, and M. Berengier, 'Estimation of impedance model input parameter from in situ measurements: Principles and applications', Appl. Acoust. 95 27–36 (2015). 13. D. Dragna and P. Blanc-Benon, 'Physically admissible impedance models for time-domain computations of outdoor sound propagation', Acta Acust. united Ac., 100, 401–410 (2014). 14. D. Dragna, K. Attenborough and P. Blanc-Benon, 'On the inadvisability of using single parameter models for representing the acoustical properties of ground surfaces', J. Acoust. Soc. Am. 138, 2399 - 2413 (2015). 15. K. Attenborough, I. Bashir and S. Taherzadeh, 'Outdoor ground impedance models', J. Acoust. Soc. Am., 129, 2806-2819 (2011). 16. V. F. Twersky, 'On the scattering of waves by random distributions. 1 Free space scatterer formalism', J. Math. Phys., 3, 700 - 715 (1962). 17. S. F. Clifford and R. T. Lataitis, 'Turbulence effects on acoustic wave propagation over a smooth surface', J. Acoust. Soc. Am. 73, 1545-50 (1983). 18. A. I. Tarrero, M. A. Martín, J. González, M. Machimbarrena, and F. Jacobsen, Sound propagation in forests: A comparison of experimental results and values predicted by the Nord 2000 model, Appl. Acoust., 69, 662–671 (2008). 19. I. Bashir, S. Taherzadeh, H-C. Shin and K. Attenborough, 'Sound propagation over soft ground without and with crops and potential for surface transport noise attenuation', J. Acoust. Soc. Am. 137, 154 - 164 (2015). 20. K. Attenborough, K. M. Li and K. Horoshenkov, 'Predicting Outdoor Sound', Taylor and Francis, London, (2007). 21. ISO, Acoustics—Attenuation of Sound During Propagation Outdoors—Part 2: A General Method of Calculation (ISO 9613-2). ISO, Geneva, Switzerland, (1996). 22. J. Kragh, 'Road traffic noise attenuation by belts of trees and bushes', Danish Acoustical Laboratory Report no.31 (1982). 23. F. M. Wiener and D. N. Keast, 'Experimental study of the propagation of sound over the
ground' J. Acoust. Soc. Am. 31(6), 724-733 (1959). 24. S. Taherzadeh, I. Bashir and K. Attenborough, 'Aperiodicity effects on sound transmission
through arrays of identical cylinders perpendicular to the ground', J. Acoust. Soc. Am. 132 (4), EL323 – EL328 (2012).
25. I. Bashir, Acoustical exploitation of rough, mixed impedance and porous surfaces outdoors, Ph.D. dissertation, The Open University, Milton Keynes, UK, 2013 (Ch. 10)
26. Y. B. A. Chong, 'Sonic Crystal Noise Barriers', PhD Thesis, The Open University, UK, 2013. 27. R. Martínez-Sala, C. Rubio, L. M. García-Raffi, J. V. Sánchez-Pérez, E. A. Sánchez-Pérez,
and L. Llinares. 'Control of noise by trees arranged like sonic crystals', Journal of Sound and Vibration, 291 100-106 (2006).
28. T. van Renterghem, D. Botteldooren, and K. Verheyen, Road traffic noise shielding by vegetation belts of limited depth, J. Sound Vib. 331 2404–2425 (2012).
29. T. van Renterghem, Exploiting Supporting Poles to Increase Road Traffic Noise Shielding of Tree Belts, Acta Acustica united with Acustica, 101 1 - 7 (2015).
30. T van Renterghem, K. Attenborough and P. Jean, 'Designing vegetation and tree belts along roads', Chapter 5 of Environmental Methods for Transport Noise Reduction, Ed. M. Nilsson, M Bengtsson and R. Klaeboe, Taylor and Francis, (2015).
125