open-mode debonding analysis of curved sandwich panels ... · open-mode debonding analysis of...
TRANSCRIPT

NASA/TP-1999-206580
Open-Mode Debonding Analysis of Curved Sandwich Panels Subjected to Heating and Cryogenic Cooling on Opposite Faces
William L. KoDryden Flight Research CenterEdwards, California
June 1999

The NASA STI Program Office . . . in Profile
Since its founding, NASA has been dedicatedto the advancement of aeronautics and space science. The NASA Scientific and Technical Information (STI) Program Office plays a keypart in helping NASA maintain thisimportant role.
The NASA STI Program Office is operated byLangley Research Center, the lead center forNASA’s scientific and technical information.The NASA STI Program Office provides access to the NASA STI Database, the largest collectionof aeronautical and space science STI in theworld. The Program Office is also NASA’s institutional mechanism for disseminating theresults of its research and development activities. These results are published by NASA in theNASA STI Report Series, which includes the following report types:
• TECHNICAL PUBLICATION. Reports of completed research or a major significantphase of research that present the results of NASA programs and include extensive dataor theoretical analysis. Includes compilations of significant scientific and technical data and information deemed to be of continuing reference value. NASA’s counterpart of peer-reviewed formal professional papers but has less stringent limitations on manuscriptlength and extent of graphic presentations.
• TECHNICAL MEMORANDUM. Scientificand technical findings that are preliminary orof specialized interest, e.g., quick releasereports, working papers, and bibliographiesthat contain minimal annotation. Does notcontain extensive analysis.
• CONTRACTOR REPORT. Scientific and technical findings by NASA-sponsored contractors and grantees.
• CONFERENCE PUBLICATION. Collected papers from scientific andtechnical conferences, symposia, seminars,or other meetings sponsored or cosponsoredby NASA.
• SPECIAL PUBLICATION. Scientific,technical, or historical information fromNASA programs, projects, and mission,often concerned with subjects havingsubstantial public interest.
• TECHNICAL TRANSLATION. English- language translations of foreign scientific and technical material pertinent toNASA’s mission.
Specialized services that complement the STIProgram Office’s diverse offerings include creating custom thesauri, building customizeddatabases, organizing and publishing researchresults . . . even providing videos.
For more information about the NASA STIProgram Office, see the following:
• Access the NASA STI Program Home Pageat
http://www.sti.nasa.gov
• E-mail your question via the Internet to [email protected]
• Fax your question to the NASA Access HelpDesk at (301) 621-0134
• Telephone the NASA Access Help Desk at(301) 621-0390
• Write to:NASA Access Help DeskNASA Center for AeroSpace Information7121 Standard DriveHanover, MD 21076-1320

NASA/TP-1999-206580
Open-Mode Debonding Analysis of Curved Sandwich Panels Subjected to Heating and Cryogenic Cooling on Opposite Faces
William L. KoDryden Flight Research CenterEdwards, California
June 1999
National Aeronautics andSpace Administration
Dryden Flight Research CenterEdwards, California 93523-0273

NOTICE
Use of trade names or names of manufacturers in this document does not constitute an official endorsementof such products or manufacturers, either expressed or implied, by the National Aeronautics andSpace Administration.
Available from the following:
NASA Center for AeroSpace Information (CASI) National Technical Information Service (NTIS)7121 Standard Drive 5285 Port Royal RoadHanover, MD 21076-1320 Springfield, VA 22161-2171(301) 621-0390 (703) 487-4650

iii
CONTENTS
Page
ABSTRACT . . . . . . . . . . . . . . . . . . . . . . . . . . . . . . . . . . . . . . . . . . . . . . . . . . . . . . . . . . . . . . . . . . . . . . . 1
NOMENCLATURE . . . . . . . . . . . . . . . . . . . . . . . . . . . . . . . . . . . . . . . . . . . . . . . . . . . . . . . . . . . . . . . . 1
INTRODUCTION . . . . . . . . . . . . . . . . . . . . . . . . . . . . . . . . . . . . . . . . . . . . . . . . . . . . . . . . . . . . . . . . . . 2
DESCRIPTION OF PROBLEM . . . . . . . . . . . . . . . . . . . . . . . . . . . . . . . . . . . . . . . . . . . . . . . . . . . . . . . 3Geometry . . . . . . . . . . . . . . . . . . . . . . . . . . . . . . . . . . . . . . . . . . . . . . . . . . . . . . . . . . . . . . . . . . . . . . 3Boundary Conditions . . . . . . . . . . . . . . . . . . . . . . . . . . . . . . . . . . . . . . . . . . . . . . . . . . . . . . . . . . . . . 4Thermocryogenic Loading . . . . . . . . . . . . . . . . . . . . . . . . . . . . . . . . . . . . . . . . . . . . . . . . . . . . . . . . . 4
FINITE-ELEMENT ANALYSIS . . . . . . . . . . . . . . . . . . . . . . . . . . . . . . . . . . . . . . . . . . . . . . . . . . . . . . 4Finite-Element Modeling . . . . . . . . . . . . . . . . . . . . . . . . . . . . . . . . . . . . . . . . . . . . . . . . . . . . . . . . . . 5Material Properties . . . . . . . . . . . . . . . . . . . . . . . . . . . . . . . . . . . . . . . . . . . . . . . . . . . . . . . . . . . . . . . 5
RESULTS . . . . . . . . . . . . . . . . . . . . . . . . . . . . . . . . . . . . . . . . . . . . . . . . . . . . . . . . . . . . . . . . . . . . . . . . 6Panel Deformations . . . . . . . . . . . . . . . . . . . . . . . . . . . . . . . . . . . . . . . . . . . . . . . . . . . . . . . . . . . . . . 6Core Depth Changes . . . . . . . . . . . . . . . . . . . . . . . . . . . . . . . . . . . . . . . . . . . . . . . . . . . . . . . . . . . . . 7Open-Mode Stresses . . . . . . . . . . . . . . . . . . . . . . . . . . . . . . . . . . . . . . . . . . . . . . . . . . . . . . . . . . . . . 8Face-Sheet Stresses . . . . . . . . . . . . . . . . . . . . . . . . . . . . . . . . . . . . . . . . . . . . . . . . . . . . . . . . . . . . . 10
DISCUSSION . . . . . . . . . . . . . . . . . . . . . . . . . . . . . . . . . . . . . . . . . . . . . . . . . . . . . . . . . . . . . . . . . . . . 11
CONCLUSIONS . . . . . . . . . . . . . . . . . . . . . . . . . . . . . . . . . . . . . . . . . . . . . . . . . . . . . . . . . . . . . . . . . . 12
REFERENCES . . . . . . . . . . . . . . . . . . . . . . . . . . . . . . . . . . . . . . . . . . . . . . . . . . . . . . . . . . . . . . . . . . . 13
FIGURES . . . . . . . . . . . . . . . . . . . . . . . . . . . . . . . . . . . . . . . . . . . . . . . . . . . . . . . . . . . . . . . . . . . . . . . . 15

ABSTRACT
Increasing use of curved sandwich panels as aerospace structure components makes it vital to fullyunderstand their thermostructural behavior and identify key factors affecting the open-mode debondingfailure. Open-mode debonding analysis is performed on a family of curved honeycomb-core sandwichpanels with different radii of curvature. The curved sandwich panels are either simply supported orclamped, and are subjected to uniform heating on the convex side and uniform cryogenic cooling on theconcave side. The finite-element method was used to study the effects of panel curvature and boundarycondition on the open-mode stress (radial tensile stress) and displacement fields in the curved sandwichpanels. The critical stress point, where potential debonding failure could initiate, was found to be at themidspan (or outer span) of the inner bonding interface between the sandwich core and face sheet on theconcave side, depending on the boundary condition and panel curvature. Open-mode stress increases withincreasing panel curvature, reaching a maximum value at certain high curvature, and then decreasesslightly as the panel curvature continues to increase and approach that of quarter circle. Changing theboundary condition from simply supported to clamped reduces the magnitudes of open-mode stresses andthe associated sandwich core depth stretching.
NOMENCLATURE
cross-sectional area of honeycomb cell (normal to honeycomb cell generatrix), in
2
cross-sectional area of honeycomb cell wall (normal to the honeycomb cell generatrix), in
2
E
Young’s modulus of face-sheet material, lb/in
2
, , effective moduli of elasticity of honeycomb core, lb/in
2
E22 beam element for which the intrinsic stiffness matrix is given
E41 quadrilateral membrane element
E43 quadrilateral combined membrane and bending element
G
shear modulus of face-sheet material, lb/in
2
, , effective shear moduli of honeycomb core, lb/in
2
h
depth of honeycomb core, in.
JLOC joint location (grid point) of finite-element model
l
half-span curved length along center line of curved sandwich panel, in.
r
= 57.3 (
l
/
θ
), radius of curved sandwich panel, in.
SPAR Structural Performance And Resizing finite-element computer program
TPS thermal protection system
temperature of concave (lower) surface of curved sandwich panel, °F
temperature of convex (upper) surface of curved sandwich panel, °F
thickness of face sheets, in.
α
coefficients of thermal expansion of face sheets, in/in-°F
, , coefficients of thermal expansion of honeycomb core, in/in-°F
Ac
Aw
E11 E22 E33
G12 G23 G31
Tl
Tu
ts
α1 α2 α3

2
radial displacement of middle surface at midspan of curved sandwich panel, in.
∆
h
change of honeycomb core depth
h
(positive for stretching), in.
maximum value of
∆
h
, in.
θ
curvature angle (or half-span angle), deg
ν
Poisson’s ratio
ρ
weight density of material used for face sheets and honeycomb core, lb/in
3
effective weight density of honeycomb core structure, lb/in
3
radial tensile stress (open-mode stress) in honeycomb core cell wall, lb/in
2
tangential stress in concave side (lower) face sheet, lb/in
2
tangential stress in convex side (upper) face sheet, lb/in
2
effective radial tensile stress in honeycomb core, lb/in
2
local maximum value of in a distribution of along core depth at a tangential station, lb/in
2
maximum value of , lb/in
2
Subscripts
1, 2, 3 radial, tangential, and axial (longitudinal) directions
INTRODUCTION
Since the well-known successful aerospace application of sandwich structures in the all-wood-constructed British Mosquito fighter-bomber aircraft during World War II (refs. 1–
4), the use ofsandwich structural technology has become widespread in various aerospace structural applications (e.g.,wings, tails, wall panels, webs of beams). The typical sandwich structure in panel form is fabricated withtwo relatively thin, high-strength face sheets separated by and bonded to opposite sides of relativelythick, low-density, low-strength core. The resulting sandwich structures are lightweight and have highflexural stiffness.
In most aerospace applications, the sandwich panels are curved (e.g., fuselage glove of space shuttleorbiter, certain landing gear doors) or flat with constant core depth or variable core depths to formaerodynamic shapes (e.g., rotary wing blades, T-38 horizontal stabilizers). When applied to hypersonicflight vehicles such as space shuttle orbiter structures that are subjected to severe aerodynamic heating,the sandwich structures are protected with a thermal protection system (TPS) so that the structures canoperate in warm temperatures with low thermal gradient across the sandwich core depth (ref. 5). If thethermal gradients across the core depth are too severe, the induced thermal moment could become strongenough to bend the sandwich panel and disturb the original panel shapes. Ko (ref. 6) studied this problemin great detail.
The most extensively used sandwich structure in aerospace technology is the honeycomb-coresandwich structure. Because the honeycomb cell generatrix (a line whose motion generates a honeycombcell wall) is perpendicular to the face sheets, only line contact ensures proper bonding between the facesheets and the honeycomb core. Corrosion or excess open-mode deformation (moving apart of two face
δo
∆h( )max
ρhc
σr
σθl
σθu
σr( )eff
σr( )d σr σr
σr( )max σr( )d

3
sheets because of bending) can cause the line-contact bonding to lose its integrity—a major drawback ofthe honeycomb sandwich structure. For titanium alloys, the so-called superplastically-formed/diffusion-bonding fabrication process could be used to form sandwich panels with a variety of core geometries andachieve diffusion-bonded surface contact between the face sheets and sandwich core.
If the sandwich panel is curved, the mechanical or thermal bending in the direction of reducing thepanel curvature could induce tensile stress (called
open-mode stress
) in the sandwich core depth directionbecause the two face sheets tend to separate from each other, causing potential debonding between theface sheets and sandwich core. For the solid curved beams (monolithic or laminated composites)subjected to open-mode bending, the open-mode stress distribution in the curved beam depth direction isarch-shaped; that is, zero values occur at the inner and outer boundaries and the maximum value occursinward of the middle surface (refs. 7 through 15). The location of the maximum open-mode stress pointmoves toward the middle surface as the curved beam depth decreases (refs. 7, 8, 15). For a curved(horse-shoe-shaped or semi-elliptic-shaped) sandwich beam subjected to open-mode mechanical bending,however, distribution of the open-mode stress along the core depth direction is almost linear, with thevalue reaching a maximum at the inner bonding interface (between the sandwich core and face sheets),and tapering down slightly toward the outer bonding interface (ref. 16).
If the open-mode bending is too severe, this unfavorable location of the maximum open-mode stresspoint in the curve sandwich panel will be the debonding crack nucleation site for inducing the catastrophicdebonding failure of the panels. One of the past catastrophic failures of the curved sandwich panelsoccurred in the honeycomb landing gear door panels of a certain rotary-wing aircraft. During the landingapproach when the landing gear doors were wide open, a strong gust of wind induced excess open-modebending, and caused a catastrophic debonding failure, resulting in the total loss of one of the landing geardoors. Recently, the curved sandwich panels have been designed to reinforce the nozzle ramps of certainnonconventional rocket engines. In such application, the curved sandwich panels will be subjected toopen-mode thermocryogenic bending because the convex side of the curved sandwich panels will beexposed to higher temperatures, and the concave side to cryogenic temperatures.
Increasing use of curved sandwich panels as aerospace structure components makes it vital tofully understand their thermostructural behavior and identify key factors affecting the open-modedebonding failure.
This report concerns the finite-element, open-mode debonding analysis of curved honeycomb-coresandwich panels subjected to thermocryogenic bending. The results of the analysis show how the open-mode stress distributions and sandwich panel deformations vary with the panel curvature and boundarycondition. The information in this report could serve as guidelines in the effective design of failure-freecurved sandwich panels that must function under thermocryogenic environment.
DESCRIPTION OF PROBLEM
The following sections describe the geometry of the family of curved sandwich panels, boundaryconditions, and thermocryogenic loading condition used in the analysis.
Geometry
Figure 1 shows a cross-section of the curved honeycomb-core sandwich panel with core depth
h
,identical face-sheet thickness , half-span curve length
l
(measured along the center line), radiusof curvature
r
, and the curvature angle (or half-span angle)
θ
. Panels with different curvatures arets

4
generated by simply changing
θ
and keeping
h
,
l
, and
constant. Dimension
r
automatically changeswith
θ
according to
r
= 57.3(
l
/
θ
) because
l
is constant. Table 1 lists the dimensions of the analyzedsandwich panels.
The linear dimensions in table 1 (
θ
excluded) are similar to those of the curved honeycomb-coresandwich panels proposed for reinforcing the nozzle ramps of certain nonconventional rocket engines forfuture space transportation systems. In the range of 15° >
θ
> 0°, panel deformed shapes for additionalcurvature angles
θ
= 2.5°, 6.25°, 7.5°, 10°, and 12.5° also were examined to find the critical curvatureangle
θ
at which the panel deformed modal shape changes.
Boundary Conditions
The edges of the curved sandwich panels are either simply supported (fig. 2(a)) or clamped (fig. 2(b)).The method of simply supporting a sandwich panel is slightly different from the conventional way ofsimply supporting a solid panel. At the sandwich panel edges (fig. 2(a)), transverse rigid bars are attachedand pin-joined to the sandwich edges, with the bar midpoints pinned to fixed points lying in the middlesurface of the sandwich panel. This method of edge support allows (1) panel edges to rotate freely withrespect to the horizontal axes (i.e., edges of middle surface), (2) panel edge depth to remain straight afterdeformation, and (3) maximum transverse shear deformation to take place at the panel edges. For theclamped boundary condition (fig. 2(b)), the two face sheets and sandwich core at the panel edgesare clamped.
Thermocryogenic Loading
The curved sandwich panel is subjected to thermocryogenic loading. The convex side (upper surface)of the sandwich panel is uniformly heated to temperature = 280 °F, and the concave side (lowersurface) uniformly cooled to cryogenic temperature = –320 °F. This temperature range is typical forlaboratory testing the structural integrity of curved sandwich panels designed to reinforce the nozzleramps of certain nonconventional rocket engines. Such thermocryogenic loading certainly inducesopen-mode bending, and raises concern about potential open-mode debonding failure of the curvedsandwich panels.
FINITE-ELEMENT ANALYSIS
The following sections describe the finite-element modeling of the curved sandwich panels, and thematerial properties used for the face sheets and honeycomb core elements.
Table 1. Geometry of curved sandwich panels.
h
= 1.4 in.
l
= 31 in.
= 0.032 in.
θ
= 90° (
r
= 19.74 in.), 75° (
r
= 23.68 in.), 60° (
r
= 29.60 in.), 45° (
r
= 39.47 in.),
30° (
r
= 59.21 in.), 15° (
r
= 118.41 in.), 5° (
r
= 355.23 in.), 0° (
r
=
∞
, flat)
ts
ts
TuTl

5
Finite-Element Modeling
The open-mode linear elastic debonding analysis used the Structural Performance And Resizing(SPAR) finite-element computer code (ref. 17). For simplicity, only a segment of each curvedhoneycomb-core sandwich panel was considered. Thus, the problem became two dimensional. Becauseof symmetry with respect to the y-axis (fig. 1), only a semi-span of the curved sandwich panel segmentwas modeled. Each face sheet was modeled with one layer of isotropic quadrilateral combined membraneand bending E43 elements, and the sandwich core with eight layers of anisotropic quadrilateral membraneE41 elements.
To simulate the pinned rigid rod at the panel edge (fig.2(a)), each node at the edge of the semispanmodel was pin-connected to the fixed supporting point lying in the middle surface using beam E22element (for which the intrinsic stiffness matrix is given). The stiffness of the E22 elements was madevery large to simulate the rigid rods. Temperature distribution along the sandwich core depth wasassumed to be linear. Figure 3 shows a semi-span, finite-element model generated for curved sandwichpanel segment with curvature angle
θ
= 90°. Finite-element models for different panel curvatures weregenerated from the
θ
= 90° model by simply changing the curvature angle
θ
and the associated radius ofcurvature
r
without disturbing other dimensions. Thus, the total number of joint locations (JLOC) and offinite elements remained unchanged. Table 2 lists the size of the finite-element model for any curvatureangle
θ
.
Material Properties
The material properties of the face sheets and the honeycomb core used for the finite-element modelsare of certain age-hardened steel, and are given, respectively, in tables 3 and 4.
Table 2. Size of finite-element model for any curvature angle
θ
.
JLOC 2211
E41 elements 1600
E43 elements 400
E22 elements (simply supported case only) 10
Table 3. Material properties of face sheets (age-hardened steel).
70 °F 280 °F –320 °F
E
, lb/in
2
29.1
×
10
6
28.05
×
10
6
30.05
×
10
6
G
, lb/in
2
10.4
×
10
6
10.04 × 10⁶ 10.6 × 10⁶
ν 0.302 0.31 0.285
α, in/in-°F 9.17 × 10⁻⁶ 9.17 × 10⁻⁶ 9.17 × 10⁻⁶*
ρ, lb/in3 0.287 0.287 0.287
*Actual data not available.

6
In table 4, the subscripts {1, 2, 3} denote the radial, tangential, and axial (longitudinal) directions.Data for the effective Poisson’s ratios for the honeycomb core were not available at the time of analysis.The effective Poisson’s ratios for the honeycomb core are usually negligibly small (on the order of 10–3 to10–7; ref. 2); therefore, they are assumed to be zero in the analysis.
The finite-element analysis computes the effective radial tensile stress for the honeycomb core.This stress is then converted to the actual radial tensile stress (defined as open-mode stress) induced inthe honeycomb core cell wall according to the following relationship:
= = (1)
where and are, respectively, the cross-sectional areas of the honeycomb cell and cell wall (normalto the honeycomb cell generatrix); ρ and are, respectively, the weight densities of the honeycombcore material and core structure.
RESULTS
This section presents the results of finite-element, open-mode analysis of curved honeycomb-coresandwich panels subjected to thermocryogenic bending, including panel deformations, core depthchanges, open-mode stresses, and face-sheet stresses.
Panel Deformations
Figures 4 through 11 show the deformed shapes of the curved sandwich panels with differentcurvatures supported under different boundary conditions. The undeformed shapes are superimposed onthe deformed shapes to show the relative positions of both. In all plots, the panel displacements aremagnified for the sake of visualization. In the figures, values of radial displacement at the midspan ofthe middle surface of each sandwich panel is indicated. The sign of is defined as positive for upward(outward) displacement and negative for downward (inward) displacement. For θ = 15° only (fig. 9(a)), in
Table 4. Effective material properties ofhoneycomb core (age-hardened steel).
= 0.1 × 10⁴ lb/in2
= 0.1 × 10³ lb/in2
= 0.1 × 10³ lb/in2
= 0.75 × 10⁵ lb/in2
= 0.1 × 10³ lb/in2
= 0.4 × 10⁵ lb/in2
= = = 8.1 × 10⁻⁶ in/in-°F
= 0.432 × 10⁻² lb/in3
E11
E22
E33
G12
G23
G31
α1 α2 α3
ρhc
σeffσr
σr σeff
Ac
Aw------- σeff
ρρhc--------
Ac Awρhc
δoδo

7
addition to the value of midspan radial displacement (no longer maximum), the maximum radialdisplacements at two outer-span points are shown.
For the simply supported panels with curvature angles varying from θ = 90° to θ =15° (figs. 4(a)through 9(a)), the midspan regions of the sandwich panels move inwardly ( = negative), and the outerspan regions bulge out. At θ = 45°, 30°, 15° (figs. 7(a) through 9(a)), the panel deforms into shallowM shapes. For curvature angles θ = 5° and θ = 0°, (figs. 10(a), 11(a)), the panel bows upward deforminginto arch shapes without cave-in regions. The causes of M-shaped and arch-shaped deformations will bediscussed later in the section, “Face Sheet Stresses.” For the simply supported curved panels, the coredepth stretching ∆h (i.e., pulling apart of two face sheets) is maximum at the midspan, and graduallytapers down in tangential direction, and becomes zero at the panel supported edges because of constraint.
For the clamped panels, the midspan radial is positive at θ = 90° (fig. 4(b)) and then becomesnegative as the curvature angle decreases (figs. 5(b) through 11(b)). At a curvature angle of θ = 5°(fig. 10(b)), the midspan region appears cave-in because of the magnified displacement plot. When thepanel is flat, θ = 0°, (fig. 11(b)), the midspan downward displacement becomes infinitesimal. For theclamped curved panels (figs. 4(b) through 10(b)), the core depth stretching appears almost uniform overthe entire span (except for the supported panel edges). As will be shown shortly, the core depth stretching∆h becomes maximum at the midspan or at the outer spans depending on the value of curvature angle θ.
Figure 12 shows radial displacements at the midspan of the middle surface of the curved sandwichpanel plotted as functions of curvature angle θ for the two different boundary conditions. The simplysupported case induced markedly larger magnitude of midspan displacements (a maximum of 1,357times larger at θ = 0°) than the clamped case. For the simply supported case, the downward displacementof the midspan ( = negative) is maximum at θ = 90°, decreases monotonically with decreasing θ, turnsto upward displacement ( = positive) at approximately θ = 14°, and finally increases steeply as θapproaches zero (flat panel).
For the clamped case, the midspan displacement is slightly upward ( = positive) at curvatureangle θ = 90°, and turns downward ( = negative) at around θ = 85°. The downward displacementcontinues to increase with decreasing θ, reaching a peak at about θ =10°, and then decreases to a verysmall negative value at θ = 0°.
Core Depth Changes
Figure 13 shows the maximum sandwich core depth changes plotted as functions of thecurvature angle θ for the two cases of boundary conditions. For the simply supported case, isalways at the midspan of the curved sandwich panels (flat panel excluded). For the clamped case,however, is at the midspan only for the panels with low-curvature angles 45° > θ > 5°. For thehigh-curvature angles 90° > θ > 45°, the location of shifts to the outer spans (near the edges) ofthe panel.
The simply supported boundary condition induces higher values of (a maximum of22 percent higher at θ = 45°) than the clamped case. As the curvature angle θ decreases from θ = 90°,values of increase slightly and reach their peak (indicated on the figures with downward arrows)at θ = 75° for both boundary conditions, and then gradually decrease to very small negative values(contraction) at θ = 0°. When the panel becomes flat (θ = 0°), no curvature effects can induce corestretching, and the sandwich core contracts slightly, because the cryogenic contraction of the sandwich
δo
δo
δo
δo
δo
δoδo
δo δoδo
∆h( )max∆h( )max
∆h( )max∆h( )max
∆h( )max
∆h( )max

8
core depth overcomes the effect of its thermal expansion. Table 5 lists the numerical values of used in plotting figure 13.
Figure 14 shows the distribution of the sandwich core depth changes ∆h (positive for stretching) forthe simply supported case in the l-θ space, where l is defined in figure 1. The distribution surface of ∆hforms a distorted dome shape, with the apex at the midspan of θ = 75° panel. The peak value of ∆h isindicated with a downward arrow. For any curved sandwich panel, ∆h is maximum at the panel midspanand gradually approaches zero toward the panel edge. The curve for connecting the midspan values of∆h (= ) for different θ is indicated in figure 14. This curve is identical to the curve forthe simply supported case shown in figure 13. At θ = 0° (flat panel), the tangential distribution of ∆hbecomes flat with slightly negative values (contraction) over the entire span except for panel edgesreflecting the overbalanced cooling of sandwich core as explained earlier.
Figure 15 shows the distribution of sandwich core depth changes ∆h in the l-θ space for the clampedcase. The distribution surface of ∆h for the clamped case is cascade shaped with the apex (peak value of∆h = ) at the outer span of θ = 75° panel as indicated with a downward arrow. For high-curvatureangles 90° > θ > 45°, the value of ∆h tapers up slightly (almost linearly) from its midspan minimum valuetoward the outer span, reaching its peak before suddenly dropping to zero at the panel edges. Forlow-curvature angles 45° > θ > 5°, ∆h is maximum at the midspan and decreases infinitesimally andpractically linearly toward the outer span and then drops suddenly to zero at the panel edges because ofedge constraints. The curve shown in figure 13 for the clamped case is actually a compositecurve consisting of a segment of the curve at the outer span (curve with arrow sign attached) over thecurvature angle range 90° > θ > 45° where ∆h = , and a segment of the curve at the midspan overthe range 45° > θ > 5° where ∆h = (fig. 15). When the panel is flat (θ = 0°), ∆h becomes slightlynegative (contraction) and is practically constant over the entire panel span (except for the panel edges)because of overbalanced cooling as mentioned earlier.
Open-Mode Stresses
Figures 16 through 21 show the tangential distributions of local maximum open-mode stresses induced in the curved sandwich panels with different curvature angles θ. As will be seen later, is atthe inner bonding interface between the inner face sheet and the sandwich core.
Table 5. Maximum sandwich core depth changes for different curvature angles θ.
θ, deg 90 75 60 45 30 15 5 0
, in.
Simply supported
0.08736 0.08949 0.08838 0.08198 0.06413 0.03497 0.00841 –0.00028
Clamped 0.07203* 0.07383* 0.07267* 0.06629* 0.05320 0.03053 0.01042 –0.00028
*Located at outer span; all others are located at midspan.
∆h( )max
∆h( )max
∆h( )max
∆h( )max ∆h( )max
∆h( )max
∆h( )max
∆h( )max∆h( )max
σr( )dσr( )d

9
For the simply supported case, the maximum open-mode stress = is always at themidspan of the curved sandwich panel. The values of decrease monotonically (convex downward)in the tangential direction from its midspan maximum values , and down to zero at the panel edges.
For the clamped cases shown in the figures with dashed curves, the tangential distribution of remains almost constant over the span up to the panel edges where drops rapidly to zero because ofclamping. The maximum open-mode stress is at the midspan of the panel of low-curvatureangle; 45° > θ > 5°; and its location shifts to outer spans of the panel with high curvature angle90° > θ > 45°.
Figure 22 shows the plots of maximum open-mode stresses as functions of the curvatureangle θ for the two cases of boundary conditions. For the simply supported case, is at themidspan of the inner bonding interface. For the clamped case (similar to in figure 13), however,
is at the midspan of the inner bonding interface for the curvature range 45° > θ > 5°, or at theouter spans of the inner bonding interface for the curvature angle range 90° > θ > 45°. The simplysupported case induces higher values of than the clamped case, with a maximum of 32 percenthigher at θ = 90°. The peak values of occur at θ = 75° for both boundary conditions. The shapesof the curves and the locations of peak values directly reflect characteristics of the curves shown in figure 13. Table 6 lists the numerical values of used in plotting figure 22.
Figure 23 shows the distribution of the local maximum open-mode stresses in the l-θ space forthe simply supported case. The distribution of , like that of ∆h (fig. 14), also forms a distorted domeshape, with its apex (peak value of = ) indicated with a downward arrow, at the midspanof the θ = 75° panel. For any curvature angle θ, the values of reach their peak = atthe midspan, and gradually taper down to zero toward the panel edge. The curve for connecting themidspan values is indicated in the figure. This curve is identical to the curve for thesimply supported case shown earlier in figure 22. At θ = 0° (flat), is zero over the span.
Figure 24 shows the local maximum open-mode stresses plotted in the l-θ space for theclamped case. The surface of distribution for the clamped case looks similar to a cascade, with itsapex (peak value of = ) at the outer span of θ = 75° panel (indicated on figure with a down-ward arrow). For any curvature angle θ, the value of appears almost constant over the panel span,and then suddenly drops to zero at the panel edge. When the panel is flat (θ = 0°), is zeroeverywhere. The segment of curve at the outer span (curve with vertical arrow sign attached) over the
Table 6. Maximum open-mode stress for different curvature angles θ.
θ, deg 90 75 60 45 30 15 5 0
,
lb/in2
Simply supported
4,434 4,533 4,480 4,134 3,330 1,940 611 0
Clamped 3,550* 3,619* 3,544* 3,220* 2,574 1,489 530 0
*Located at outer span; all others are located at midspan.
σr( )d σr( )maxσr( )d
σr( )max
σr( )dσr( )d
σr( )max
σr( )maxσr( )max
∆h( )max
σr( )max
σr( )maxσr( )max
σr( )max ∆h( )maxσr( )max
σr( )max
σr( )max
σr( )dσr( )d
σr( )d σr( )maxσr( )d σr( )d σr( )max
σr( )max σr( )maxσr( )d
σr( )dσr( )d
σr( )d σr( )maxσr( )d
σr( )d

10
curvature angle range 90° > θ > 45° where = and the segment of curve at the midspan overthe range 45° > θ > 5° where = form the composite curve for the clamped caseshown earlier in figure 22.
Figures 25 and 26, respectively, show the radial distributions of open-mode stress along the y-axis(i.e., along the midspan core depth direction) for the simply supported and the clamped boundaryconditions. For both types of boundary conditions, the radial distribution of for any curvature angleθ (θ ≠ 0°) is almost linear, and tapers down very little toward the outer bonding interface. For the flatpanel (θ = 0°), is zero everywhere in the core.
For the simply supported case (fig. 25), = is at the inner bonding interface (between theinner face sheet and the sandwich core), and the curve indicated in the figure is identical to the curve shown earlier in figure 22 for the simply supported case.
For the clamped case (fig. 26), the segment of curve lying in the region θ < 45° is themidspan curve segment shown earlier in figure 22 for the clamped case.
Face-Sheet Stresses
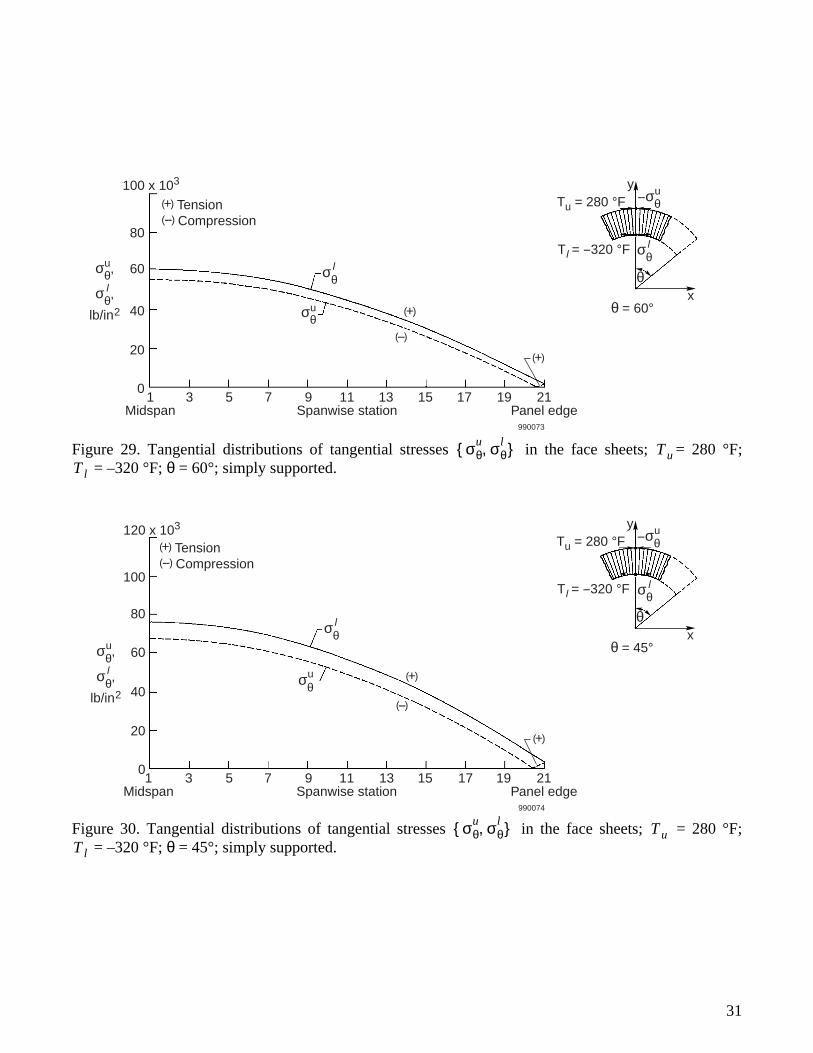
Figures 27 through 34 show the tangential distributions of tangential stresses { , } induced in theconcave (lower) and convex (upper) face sheets for different curvature angles θ for the simply supportedcase. The plus (+) and minus (–) signs alongside the { , } curves imply tension and compression,respectively. The concave face sheet is under tension ( = positive) because of restrained cryogeniccontraction, and the convex face sheet (except for the panel edge regions, figs. 29 through 33) is undercompression ( = negative) because of restrained thermal expansion. For a given curvature angle θ,the magnitude of is always larger than that of because of panel curvature and the unequal thermo-cryogenic loading condition. As θ decreases from θ = 90°, the difference between the magnitudes of { ,
} grows larger (figs. 27 through 33), and then becomes practically zero at θ = 0° (fig. 34). Also, as θdecreases, in the convex face sheet near the panel edges begins to grow from negative to positive(figs. 29 through 33) because of the load transfer from the concave face sheet through the edge rigid rods.These panel edge tensile zones in the convex face sheet continue to grow larger as θ becomes smaller, andfinally extend to the entire panel span at θ = 0° (fig. 34).
The tangential stresses of opposite signs induced in the two face sheets (figs. 27 through 33) generatethermal moments [= ( – )h/2] that tend to bend the curved panels downward, thus appearing to becaved in. For a given curvature angle θ, the cave-in thermal moments reach maximum intensity at themidspan and gradually taper down toward the panel edges. At θ = 0° (flat panel, fig. 34), the cave-inthermal moments diminish because both { , } have practically identical small positive values thatare constant over the entire panel span.
Figure 35 shows the midspan magnitudes of { , } plotted as functions of curvature angle θ for
the simply supported case. The stress magnitude ( – )/2 of the cave-in thermal moments
[= ( – )h/2] is also plotted. The value of ( – )/2 increases as θ decreases from θ = 90°,
σr( )d σr( )maxσr( )d σr( )max σr( )max
σr
σr
σr
σr σr( )maxσr( )max
σr( )maxσr( )max
σθl σθ
u
σθl σθ
u
σθl
σθu
σθl σθ
u
σθl
σθu
σθu
σθl σθ
u
σθl σθ
u
σθl σθ
u
σθl σθ
u
σθl σθ
u σθl σθ
u

11
reaching a maximum at θ = 15° where the M-shaped deformation is the most pronounced (fig.9(a)), and
then decreases rapidly toward zero at θ = 0°. At θ = 3°, changes sign from negative to positive and
then reaches a small positive value practically identical to the value of (fig. 34) as θ approaches θ = 0°.
Figure 36 shows the causes of the shallow M-shaped deformation of a typical θ = 15°, (fig. 9(a))simply supported curved panel. Because of the cryogenic contraction of the concave face sheet and thethermal expansion of the convex face sheet, the simply supported panel edges are forced to rotate aboutthe fixed support points, causing upward bowing of the panel. Simultaneously, the induced cave-inthermal moments (maximum at the midspan) try to bend the panel downward, resulting in the M-shapeddeformation. At lower curvature angles (e.g., θ = 5°), the upward bowing effect begins to overshadow thecave-in bending effect, causing the curved panel to deform into a shallow arch shape (fig. 10(a)). Thetransition from M-shaped to arch-shaped deformation occurs in the neighborhood of θ = 7° for thepresent study.
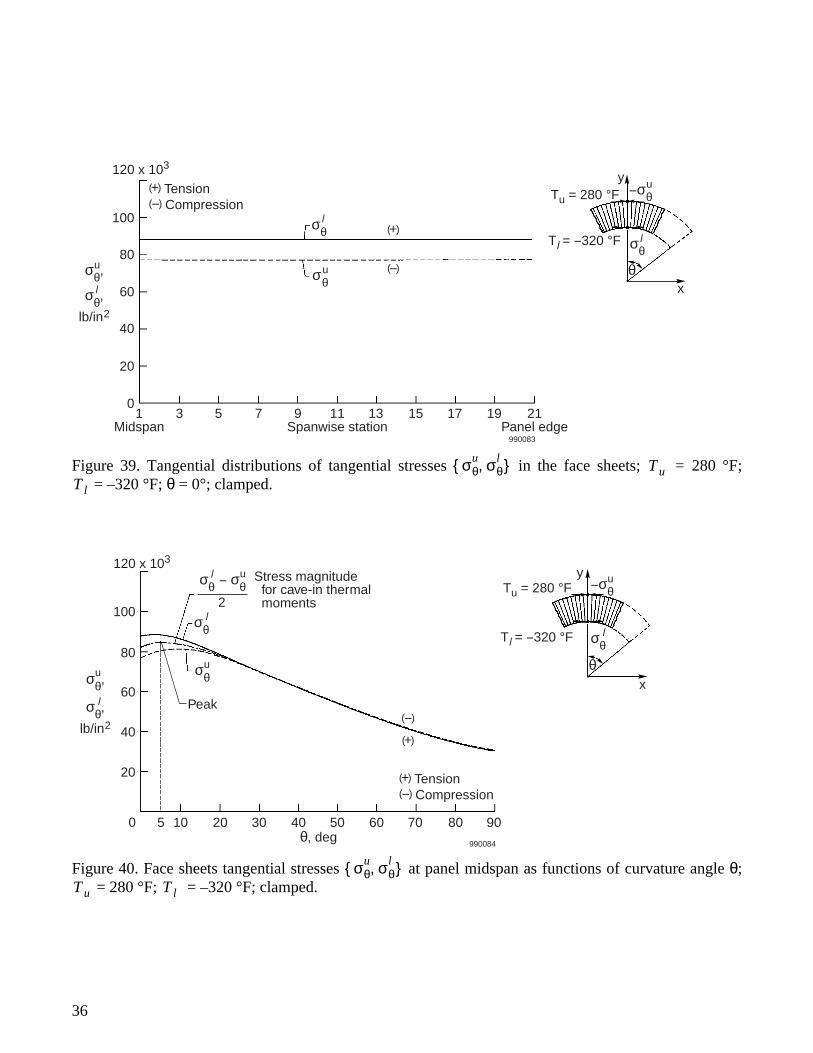
Figures 37 through 39 show the tangential distributions of tangential stresses { , } induced in theconcave and convex face sheets for different curvature angles θ for the clamped case. The distributions of{ , }[or the cave-in thermal moments = ( – )h/2] are almost constant over the panel span forthe larger curvature angles between θ = 90° and θ = 30° (fig. 37), and starts to taper down slightly towardthe panel edges at smaller curvature angles θ = 15° to θ = 5° (figs. 37 and 38). The differences in themagnitudes of { , } are almost inconspicuous for θ = 90° to θ = 30° panels, and start to grow largerwith decreasing curvature angle θ. At θ = 0° (fig. 39), the magnitudes of both { , } are constanteverywhere over the panel span (i.e., constant cave-in thermal moments, fig. 11(b)).
Figure 40 shows the midspan magnitudes of { , } plotted as functions of curvature angle θ forthe clamped case. The stress magnitude ( – )/2 for the cave-in thermal moment [= ( – )h/2] isalso plotted. The value of ( – )/2 increases as θ decreases from θ = 90°, reaching a maximum atθ = 5° where the most pronounced cave-in deformation occurs, (fig.10(b)), and then decreases slightly asθ approaches θ = 0°.
Figure 41 shows the causes of cave-in deformation of a typical clamped panel (θ = 5°). Because of theclamped edges without rotations, upward bowing effect is constrained, and the cave-in thermal moments(almost constant over the entire panel span) bend the panel downward into the cave-in shape.
DISCUSSION
The near-linear radial distribution of across the core depth is typical for the curved honeycomb-core sandwich panels, and was observed also in horseshoe- and elliptic-curved honeycomb-core sandwichbars subjected to open-mode mechanical bending (ref. 15). For a classical solid curved beam on the otherhand, the radial distribution of at any tangential cross-section is arch shaped, with zero values at theinner and the outer boundaries, and the local maximum value at a point slightly inward of the middlesurface of the curved beam (refs. 7 through 15).
For the present cases of curved sandwich panels (θ ≠ 0°) under thermocryogenic loading, the innerbonding interface at the midspan or at the outer spans is, therefore, the potential debonding failureinitiation region. The deformed shapes of curved sandwich panels presented (figs. 4 through 11) show that
σθu
σθl
σθl σθ
u
σθl σθ
u σθl σθ
u
σθl σθ
u
σθl σθ
u
σθl σθ
u
σθl σθ
u σθl σθ
u
σθl σθ
u
σr
σr

12
the midspan and outer spans of the curved sandwich panels are the critical high deflection points. Thus, inusing the curved sandwich panels as reinforcing structures operating under thermocryogenic environment,those critical high deflection points must be properly constrained (in addition to the panel edges) topreserve the original shapes. Because the clamped boundary condition induces smaller panel deflectionsand lower levels of open-mode stress field, by supporting the curved panel edges as close as the theoreticalclamped condition, concerns of excess panel deflections and of the open-mode debonding failure couldbe minimized.
CONCLUSIONS
Finite-element open-mode debonding analysis was performed on a family of curved honeycomb-coresandwich panels subjected to thermocryogenic bending. The effects of panel curvature and boundarycondition on the open-mode stress distributions and the deformation fields were studied in detail. The keyfindings may be summarized in the following:
1. The peak panel deflection occurs at the midspan of the curved sandwich panel under both simplysupported and clamped boundary conditions (exception: simply supported curved panel withcurvature angle θ = 15°, for which the peak panel deflections occur at outer spans).
2. The radial distribution of open-mode stress in the core of a curved sandwich panel is practicallylinear, with local maximum and minimum values located, respectively, at the inner and outerbonding interfaces. The minimum value is only slightly lower than the maximum value.
3. For a simply supported curved sandwich panel, the maximum open-mode stress point (ormaximum core stretching point—the potential debonding failure initiation point) is always at themidspan of the inner bonding interface.
4. For the clamped case, the maximum open-mode stress point (or maximum core stretching point)is at the midspan of the inner bonding interface for low-curvature panels only, and shifts to theouter spans of the inner bonding interface for high-curvature panels.
5. The magnitude of the maximum open-mode stress (or maximum sandwich core stretching)increases with increasing panel curvature, reaching maximum at curvatures angle θ = 75°, andthen decreases slightly as the panel turns to a quarter circle (θ = 90°) under both simply supportedand clamped boundary conditions.
6. In general, clamping a curved sandwich panel induces smaller panel deflections, lower open-modestresses, and less core depth stretching than simply supporting the panel.
Dryden Flight Research CenterNational Aeronautics and Space AdministrationEdwards, California, February 3, 1999

13
REFERENCES
1. Rhodes, Tom, “History of the Airframe, Part III,” Aerospace Engineering, Sept. 1989, pp. 27–32.
2. Simons, Graham M., “Mosquito: The Original Multi-Role Aircraft,” Arms and Armor, London,1990.
3. Bishop, Edward, “Mosquito: The Wooden Wonder,” Smithsonian Institute Press, Washington, D. C.,1990.
4. Hardy, Michael John, “The de Havilland Mosquito,” Arco Pub. Co., 1977.
5. Ko, William L., Robert D. Quinn, and Leslie Gong, Finite-Element Reentry Heat Transfer Analysisof Space Shuttle Orbiter, NASA TP-2657, Dec. 1996.
6. Ko, William L., Thermostructural Behavior of a Hypersonic Aircraft Sandwich Panel Subjected toHeating on One Side, NASA TM-4769, April 1997.
7. Kedward, K. T., R. S. Wilson and S. K. McLean, “The Flexure of Simply Curved CompositeShapes,” Composites, vol. 20, no. 6, Nov. 1989, pp. 527–536.
8. Jackson, Wade C. and Roderick H. Martin, An Interlaminar Tension Strength Specimen, NASATM-107623, May 1992.
9. Martin, R. H. and W. C. Jackson, Damage Prediction in Cross-Plied Curved Composite Materials,NASA TM-104089, July 1991.
10. Hiel, Clement C., Mark Sumich and David P. Chappell, “A Curved Beam Test Specimen forDetermining the Interlaminar Tensile Strength of a Laminated Composite,” J. Composite Materials,vol. 25, July 1991, pp. 854–868.
11. Mao, T. H. and M. J. Owen, “Through-the-Thickness Tensile Strength of Fiber-Reinforced Plastics,”Composite Materials: Testing and Design (Sixth Conference), ASTM STP 787, American Societyfor Testing Materials, 1982, pp. 5–18.
12. Lagace, P. A. and D. B. Weems, “A Through-the-Thickness Strength Specimen for Composites,”presented at the second ASTM Symposium on Test Methods and Design Allowables, Phoenix,Arizona, 1986.
13. Ige, D. and P. Sargent, “An Apparatus for Determining the Interlaminar Tensile Strength of LaminatedComposites Using the Curved Specimen Geometry,” presented at the European Conference onComposites Testing and Standardisation, Amsterdam, The Netherlands, Sept. 8–10, 1992.
14. Ko, William L. and Raymond H. Jackson, Multilayer Theory for Delamination Analysis of aComposite Curved Bar Subjected to End Forces and End Moments, NASA TM-4139, Sept. 1989.
15. Ko, William L., Delamination Stresses in Semicircular Laminated Composite Bars, NASATM-4026, Jan. 1988.

14
16. Ko, William L. and Raymond H. Jackson, Open-Mode Delamination Stress Concentrations inHorseshoe and Elliptic Composite Curved Bars Subjected to End Forces, NASA TM-4164,Jan. 1990.
17. Whetstone, W. D., SPAR Structural Analysis System Reference Manual, System Level 13A, vol. 1,Program Execution, NASA CR-158970-1, Dec. 1978.

15
Figure 1. Curved honeycomb-core sandwich panel subjected to heating and cryogenic cooling onopposite sides.
(a) Simply supported. (b) Clamped.
Figure 2. Two types of edge support conditions for the sandwich panel.
θ θr
y
l - measured along tangential centerline
x
h = 1.4 in.l = 31 in.ts = 0.032 in.
θ = 0° ~ 90°r = 57.3 (l /θ) in.Tl = --320 °F
Tu = 280 °F
Tu
ts
tsh
Tl
990036
l l
Pin joint
Rigid bar
Maximum shear strain
990054
Zero slope990037

16
Figure 3. Semi-span finite-element model for the curved honeycomb-core sandwich panel; θ = 90°.
y
JLOCE41 elementsE43 elements
22111600400
θ = 90°
x990038

17
(a) Simply supported.
(b) Clamped.
Figure 4. Deformed shapes of curved honeycomb-core sandwich panel; = 280 °F; = –320 °F;θ = 90°.
Deformed
δo = --0.09814 in.Undeformed
990039
Deformed
δo = 0.00150 in.
Undeformed
990040
Tu Tl

18
(a) Simply supported.
(b) Clamped.
Figure 5. Deformed shapes of curved honeycomb-core sandwich panel; = 280 °F; = –320 °F;θ = 75°.
Deformed
δo = --0.09127 in.Undeformed
990041
Deformed
δo = --0.00152 in.
Undeformed
990042
Tu Tl

19
(a) Simply supported.
(b) Clamped.
Figure 6. Deformed shapes of curved honeycomb-core sandwich panel; = 280 °F; = –320 °F;θ = 60°.
Deformed
δo = --0.08623 in.Undeformed
990043
Deformed
δo = --0.00543 in.
Undeformed
990044
Tu Tl

20
(a) Simply supported.
(b) Clamped.
Figure 7. Deformed shapes of curved honeycomb-core sandwich panel; = 280 °F; = –320 °F;θ = 45°.
(a) Simply supported.
(b) Clamped.
Figure 8. Deformed shapes of curved honeycomb-core sandwich panel; = 280 °F; = –320 °F;θ = 30°.
Deformed
δo = --0.08097 in.Undeformed
990045
Deformed
δo = --0.01072 in.Undeformed
990046
Tu Tl
Deformed δo = --0.07015 in.
Undeformed990047
Deformed
δo = --0.01858 in.Undeformed
990048
Tu Tl

21
(a) Simply supported.
(b) Clamped.
Figure 9. Deformed shapes of curved honeycomb-core sandwich panel; = 280 °F; = –320 °F;θ = 15°.
(a) Simply supported.
(b) Clamped.
Figure 10. Deformed shapes of curved honeycomb-core sandwich panel; = 280 °F; = –320 °F;θ = 5°.
Deformedδo = --0.00788 in.
0.08749 in.
Undeformed 990049
Deformed
δo = --0.03212 in.Undeformed
990050
Tu Tl
Deformed δo = 0.50800 in.
Undeformed990051
Deformed
δo = --0.03327 in.Undeformed
990052
Tu Tl

22
˙
(a) Simply supported.
(b) Clamped.
Figure 11. Deformed shapes of curved honeycomb-core sandwich panel; = 280 °F; = –320 °F;θ = 0° (flat).
Figure 12. Plots of radial displacements (positive upward) at midspan of curved sandwich panel asfunctions of curvature angle θ; = 280 °F; = –320 °F.
Deformed δo = 1.84606 in.
Undeformed990053
Deformed
δo = --0.00136 in.Undeformed
990055
Tu Tl
Deformed
990056
δo,in.
δo
Clamped
Simply supported
0--.1
0
.1
.2
.3
.4
.5
1.8
1.9
10 20 30 40 θ, deg
50 60 70 80 90
θ
δoTu Tl

23
Figure 13. Plots of honeycomb core maximum depth changes (at midspan or outer span, positivefor stretching) of curved sandwich panel as functions of curvature angle θ; = 280 °F; = –320 °F.
Figure 14. Distributions of honeycomb core depth change ∆h (positive for stretching) in the l-θ space; = 280 °F; = –320 °F; simply supported.
θ
Peak value
y
x
990057
12 x 10--2
(∆h)max,in.
8
10
6
4
2
Midspan
Midspan
Outer span
Clamped
Simply supported
0
0
--110 20 30 40
θ, deg50 60 70 80 90
Tu = 280 °F
Tl = --320 °F
(∆h)max
(∆h)maxor
∆h( )maxTu Tl
Deformed∆h
θ
Tu = 280 °F
Tl = --320 °F
y
x
Peak value
990058
8
9 x 10--2
7
6
5
5 15 30 θ, deg
∆h,in.
(∆h)max curve
45 60 7590
4
3
2
1
--1
Panel midspan
Panel edge0
0
l = 31 in.
Tu Tl

24
Figure 15. Distributions of honeycomb core depth change ∆h (positive for stretching) in the l-θ space; = 280 °F; = –320 °F; clamped.
Figure 16. Tangential distributions of local maximum open-mode stress in curved honeycombcore; = 280 °F; = –320 °F; θ = 90°.
Deformed∆h
θ
y
x
990059
8
9 x 10--2
7
6
5
5 15 30 θ, deg
∆h,in.
(∆h)max curve segment(∆h)max curve segment
45 60 7590
4
3
2
1
--1
Panel midspan
Panel edge
0
0
l = 31 in.
Tu = 280 °F
Tl = --320 °F
Peak value
Tu Tl
θ = 90°
θ = 90°
Simply supported
4 x 10³
Tl = --320 °F
Tu = 280 °F
2 31(σr)d, lb/in2
0
990060
Clamped
σr( )dTu Tl

25
Figure 17. Tangential distributions of local maximum open-mode stress in curved honeycombcore; = 280 °F; = –320 °F; θ = 75°.
Figure 18. Tangential distributions of local maximum open-mode stress in curved honeycombcore; = 280 °F; = –320 °F; θ = 60°.
θ = 75°
θ = 75°
Simply supported
4 x 10³
Tl = --320 °F
Tu = 280 °F
23
1 (σr)d,
lb/in20
990061
Clamped
σr( )dTu Tl
θ = 60°
θ = 60°
Simply supported
4 x 10³
Tl = --320 °F
Tu = 280 °F
23
1 (σr)d,
lb/in20
990062
Clamped
σr( )dTu Tl

26
Figure 19. Tangential distributions of local maximum open-mode stress in curved honeycombcore; = 280 °F; = –320 °F; θ = 45°.
Figure 20. Tangential distributions of local maximum open-mode stress in curved honeycombcore; = 280 °F; = –320 °F; θ = 30°.
θ = 45°
θ = 45°
Simply supported
4 x 10³
Tl = --320 °F
Tu = 280 °F
2
3
1(σr)d,
lb/in2
0
990063
Clamped
σr( )dTu Tl
θ = 30°
θ = 30°
Simply supported
4 x 10³
Tl = --320 °F
Tu = 280 °F
2
3
1
(σr)d,
lb/in2
0
990064
Clamped
σr( )dTu Tl

27
Figure 21. Tangential distributions of local maximum open-mode stress in curved honeycomb core; = 280 °F; = –320 °F; θ = 15°.
Figure 22. Plots of maximum open-mode stress (at midspan or outer span) as function of curva-ture angle θ; = 280 °F; = –320 °F.
θ = 15°
Clamped
Simply supported 3 x 10³ Tl = --320 °F
Tu = 280 °F
2
1
(σr)d,
lb/in2
0
θ = 15°
990065
σr( )dTu Tl
θ
Peak value
y
x
or
990066
6 x 10³
(σr)max,
lb/in2
(σr)max
4
5
3
2
1
Midspan
Midspan
Outer span
Clamped
Simply supported
0 10 20 30 40 θ, deg
50 60 70 80 90
Tu = 280 °F
Tl = --320 °F
σr( )maxTu Tl

28
Figure 23. Distribution of local maximum open-mode stress in the l-θ space; = 280 °F; = –320 °F; simply supported.
Figure 24. Distribution of local maximum open-mode stress in the l-θ space; = 280 °F; = –320 °F; clamped.
990067
5 x 10³
5 15 30θ, deg
(σr)max curve
(σr)d,
lb/in2
45 6075 90
4
3
2
1Panel midspan
Panel edge0
0
l = 31 in.
x
Peak value
θ
(σr)d
Tu = 280 °F
Tl = --320 °F
y
σr( )d TuTl
990068
5 x 10³
5 15 30θ, deg
(σr)max curve segment (σr)max curve segment
(σr)d,
lb/in2
45 60 75 90
4
3
2
1Panel midspan
Panel edge
0
0
l = 31 in.
x
Peak value
θ
(σr)d
Tu = 280 °F
Tl = --320 °F
y
σr( )d TuTl

29
Figure 25. Radial distribution of open-mode stress along y-axis as a function of curvature angle θ; = 280 °F; = –320 °F; simply supported.
Figure 26. Radial distribution of open-mode stress along y-axis as a function of curvature angle θ; = 280 °F; = –320 °F; clamped.
990069
5 x 10³
5 15 30θ, deg
(σr)max curve
σr,
lb/in2
4560
7590
4
3
2
1Cold side
Hot side0
0
Honecombcore
θ
σr
y
x
Tu = 280 °F
Tl = --320 °F
Peak value
σrTu Tl
990070
5 x 10³
5 1530
θ, deg
(σr)max curve segment
σr,
lb/in2
4560 75
90
4
3
2
1Cold side
Hot side0
0
Honecombcore
θ
σr
y
x
Tu = 280 °F
Tl = --320 °F
Peak value
σrTu Tl

30
Figure 27. Tangential distributions of tangential stresses in the face sheets; = 280 °F; = –320 °F; θ = 90°; simply supported.
Figure 28. Tangential distributions of tangential stresses in the face sheets; = 280 °F; = –320 °F; θ = 75°; simply supported.
990072
100 x 103
(--)σθ
σθ
531Midspan
0
20
40
80
60
7 9 11Spanwise station
13 15 17 19 21Panel edge
σθ,
σθ,
lb/in2
(+) Tension(--) Compression
(+)u
θ
y
x
--σθTu = 280 °F
Tl = --320 °F σθ
θ = 90°
u
u
l l
l
σθu σθ
l,{ } TuTl
990071
100 x 103
(--)
σθ
531Midspan
0
20
40
80
60
7 9 11Spanwise station
13 15 17 19 21Panel edge
σθ,
σθ,
lb/in2
θ
y
x
--σθ(+) Tension(--) Compression
Tu = 280 °F
Tl = --320 °F σθ
(+) θ = 75°σθu
u
u
l
l l
σθu σθ
l,{ } TuTl
31
Figure 29. Tangential distributions of tangential stresses in the face sheets; = 280 °F; = –320 °F; θ = 60°; simply supported.
Figure 30. Tangential distributions of tangential stresses in the face sheets; = 280 °F; = –320 °F; θ = 45°; simply supported.
990073
100 x 103
(--)
σθ
σθ
531Midspan
0
20
40
80
60
7 9 11Spanwise station
13 15 17 19 21Panel edge
σθ,
σθ,
lb/in2
(+) Tension(--) Compression
(+)
(+)
θ
y
x
--σθTu = 280 °F
Tl = --320 °F σθ
θ = 60°
u
u
u l
l
l
σθu σθ
l,{ } TuTl
990074
120 x 103
(--)
σθ
σθ
531Midspan
0
20
40
80
100
60
7 9 11Spanwise station
13 15 17 19 21Panel edge
σθ,
σθ,
lb/in2
(+) Tension(--) Compression
(+)
(+)
θ
y
x
--σθTu = 280 °F
Tl = --320 °F σθ
θ = 45°
u
u
u
l
l
l
σθu σθ
l,{ } TuTl

32
Figure 31. Tangential distributions of tangential stresses in the face sheets; = 280 °F; = –320 °F; θ = 30°; simply supported.
Figure 32. Tangential distributions of tangential stresses in the face sheets; = 280 °F, = –320 °F; θ = 15°; simply supported.
990075
120 x 103
(--)
σθ
σθ
531Midspan
0
20
40
80
100
60
7 9 11Spanwise station
13 15 17 19 21Panel edge
σθ,
σθ,
lb/in2
(+) Tension(--) Compression
(+)
(+)
θ
y
x
--σθTu = 280 °F
Tl = --320 °F σθ
θ = 30°
u
u
u
l l
l
σθu σθ
l,{ } TuTl
990076
140 x 103
(--)
σθ
σθ
531Midspan
0
20
40
80
100
120
60
7 9 11Spanwise station
13 15 17 19 21Panel edge
σθ,
σθ,
lb/in2
(+) Tension(--) Compression
(+)
(+)
θ
y
x
--σθTu = 280 °F
Tl = --320 °F σθ
θ = 15°
u
u
u
l
l
l
σθu σθ
l,{ } TuTl

33
Figure 33. Tangential distributions of tangential stresses in the face sheets; = 280 °F; = –320 °F; θ = 5°; simply supported.
Figure 34. Tangential distributions of tangential stresses in the face sheets; = 280 °F; = –320 °F; θ = 0°; simply supported.
990077
140 x 103
(--)
σθ
σθ
531Midspan
0
20
40
80
100
120
60
7 9 11Spanwise station
13 15 17 19 21Panel edge
σθ,
σθ,
lb/in2
(+) Tension(--) Compression
(+)
(+)
θ
y
x
--σθTu = 280 °F
Tl = --320 °F σθ
θ = 5°
u
u
u
l
l
l
σθu σθ
l,{ } TuTl
990078
120 x 103
σθσθ
531Midspan
0
20
40
80
100
60
7 9 11Spanwise station
13 15 17 19 21Panel edge
σθ,
σθ,
lb/in2
(+) Tension(--) Compression
(+)(+)
θ
θ = 0°
y
x
--σθTu = 280 °F
Tl = --320 °F σθ
u
u
u
l
l
l
σθu σθ
l,{ } TuTl

34
Figure 35. Face sheets tangential stresses at panel midspan as functions of curvature angle θ; = 280 °F; = –320 °F; simply supported.
Figure 36. M-shaped deformation of the simply supported curved sandwich panel caused by thecombined effect of the cave-in thermal moments induced in the panel and the bowing rotations at thepanel edges; = 280 °F; = –320 °F; θ = 15°.
140 x 103
0
20
40
80
100
120
60
σθ,
σθ,
lb/in2
θ
y
x
--σθTu = 280 °F
Tl = --320 °F σθ
σθ
σθ
σθ
990079
Stress magnitude for cave-in thermal moments
-- σθ
(+) Tension(--) Compression
2
10 20
Peak
30 40 θ, deg
50 60 70 80 90
(+)
(--)
(+)
u
u
u
u
l
l
l
l
σθu σθ
l,{ }Tu Tl
Tension
Compression
Tu = 280°
Tl
= --320°Contraction
Contraction
ExpansionExpansion
Simply supported
Direction ofpanel edge
rotationCave-in thermal moments at midspanSimply
supported
Direction ofpanel edge
rotation990080
--σθ --σθ
σθσθ
u u
l l
Tu Tl

35
Figure 37. Tangential distributions of tangential stresses in the face sheets; = 280 °F; = –320 °F; θ = 90°~15°; clamped.
Figure 38. Tangential distributions of tangential stresses in the face sheets; = 280 °F; = –320 °F; θ = 5°; clamped.
990081
140 x 103
531Midspan
0
20
40
80
100
120
60
7 9 11Spanwise station
13 15 17 19 21Panel edge
σθ,
σθ,
lb/in2
θ
y
x
--σθTu = 280 °F
Tl = --320 °F σθ
σθ
σθ Tension
Compression
θ, deg153045607590
u
u
u
l
l
l
σθu σθ
l,{ } TuTl
990082
120 x 103
(--)
σθ
531Midspan
0
20
40
80
100
60
7 9 11Spanwise station
13 15 17 19 21Panel edge
σθ,
σθ,
lb/in2
θ
y
x
--σθ(+) Tension(--) Compression
Tu = 280 °F
Tl = --320 °F σθ(+)
σθu
u
u
l
l
l
σθu σθ
l,{ } TuTl
36
Figure 39. Tangential distributions of tangential stresses in the face sheets; = 280 °F; = –320 °F; θ = 0°; clamped.
Figure 40. Face sheets tangential stresses at panel midspan as functions of curvature angle θ; = 280 °F; = –320 °F; clamped.
990083
120 x 103
(--)σθ
σθ
531Midspan
0
20
40
80
100
60
7 9 11Spanwise station
13 15 17 19 21Panel edge
σθ,
σθ,
lb/in2
θ
y
x
--σθ(+) Tension(--) Compression
Tu = 280 °F
Tl = --320 °F σθ
(+)
uu
u
l
l
l
σθu σθ
l,{ } TuTl
120 x 103
0
20
40
80
100
60σθ,
σθ,
lb/in2
θ
y
x
--σθTu = 280 °F
Tl = --320 °F σθ
σθ
σθ
σθ
990084
Stress magnitude for cave-in thermal moments
-- σθ
(+) Tension(--) Compression
2
105 20
Peak
30 40 θ, deg
50 60 70 80 90
(+)
(--)
u u
uu
l
l
l
l
σθu σθ
l,{ }Tu Tl

37
Figure 41. Cave-in deformation of the clamped curved sandwich panel caused by the cave-in thermalmoments induced in the panel; = 280 °F; = –320 °F; θ = 5°.
Tension
Compression
σθ σθ
Tu = 280°
Tl = --320°
Clamped Clamped
Cave-inthermalmoment
Cave-inthermalmoment
990085
--σθu
--σθu
l l
Tu Tl

REPORT DOCUMENTATION PAGE Form ApprovedOMB No. 0704-0188
Public reporting burden for this collection of information is estimated to average 1 hour per response, including the time for reviewing instructions, searching existing data sources, gathering andmaintaining the data needed, and completing and reviewing the collection of information. Send comments regarding this burden estimate or any other aspect of this collection of information,including suggestions for reducing this burden, to Washington Headquarters Services, Directorate for Information Operations and Reports, 1215 Jefferson Davis Highway, Suite 1204, Arlington,VA 22202-4302, and to the Office of Management and Budget, Paperwork Reduction Project (0704-0188), Washington, DC 20503.
1. AGENCY USE ONLY (Leave blank) 2. REPORT DATE 3. REPORT TYPE AND DATES COVERED
4. TITLE AND SUBTITLE 5. FUNDING NUMBERS
6. AUTHOR(S)
8. PERFORMING ORGANIZATION REPORT NUMBER
7. PERFORMING ORGANIZATION NAME(S) AND ADDRESS(ES)
9. SPONSORING/MONITORING AGENCY NAME(S) AND ADDRESS(ES) 10. SPONSORING/MONITORING AGENCY REPORT NUMBER
11. SUPPLEMENTARY NOTES
12a. DISTRIBUTION/AVAILABILITY STATEMENT 12b. DISTRIBUTION CODE
13. ABSTRACT (Maximum 200 words)
14. SUBJECT TERMS 15. NUMBER OF PAGES
16. PRICE CODE
17. SECURITY CLASSIFICATION OF REPORT
18. SECURITY CLASSIFICATION OF THIS PAGE
19. SECURITY CLASSIFICATION OF ABSTRACT
20. LIMITATION OF ABSTRACT
NSN 7540-01-280-5500 Standard Form 298 (Rev. 2-89)Prescribed by ANSI Std. Z39-18298-102
Open-Mode Debonding Analysis of Curved Sandwich Panels Subjectedto Heating and Cryogenic Cooling on Opposite Faces
WU 242-33-02-00-23-00-TA1
William L. Ko
NASA Dryden Flight Research CenterP.O. Box 273Edwards, California 93523-0273
H-2332
National Aeronautics and Space AdministrationWashington, DC 20546-0001 NASA/TP-1999-206580
Increasing use of curved sandwich panels as aerospace structure components makes it vital to fullyunderstand their thermostructural behavior and identify key factors affecting the open-mode debonding failure.Open-mode debonding analysis is performed on a family of curved honeycomb-core sandwich panels withdifferent radii of curvature. The curved sandwich panels are either simply supported or clamped, and aresubjected to uniform heating on the convex side and uniform cryogenic cooling on the concave side. The finite-element method was used to study the effects of panel curvature and boundary condition on the open-modestress (radial tensile stress) and displacement fields in the curved sandwich panels. The critical stress point,where potential debonding failure could initiate, was found to be at the midspan (or outer span) of the innerbonding interface between the sandwich core and face sheet on the concave side, depending on the boundarycondition and panel curvature. Open-mode stress increases with increasing panel curvature, reaching amaximum value at certain high curvature, and then decreases slightly as the panel curvature continues toincrease and approach that of quarter circle. Changing the boundary condition from simply supported toclamped reduces the magnitudes of open-mode stresses and the associated sandwich core depth stretching.
Curved sandwich panels, Debonding stresses, Open-mode debonding,Thermo-cryogenic loading A03
44
Unclassified Unclassified Unclassified Unlimited
June 1999 Technical Paper
Unclassified—UnlimitedSubject Category 39