open hole basic presentation
TRANSCRIPT


2
Why are we Logging Wells ?Wireline logging can be used in a number of ways by a number
of people to provide solutions to questions they have about a particularwell. Some of the ways different people in an office will use these logsare:
Geophysics look to logs for:– Where are my tops (as predicted?)– Does seismic interpretation agree with log data?– How is my synthetic doing with this new information?
Geologists look to logs for:– Where are my tops ?– Do I have any reservoir ?– Is there any Hydrocarbon in the well ?– What type of Hydrocarbon(s) is there ?– How good is my reservoir ?– What kind of reserves do I have ?– How does this tie in to my offsets ?
Drilling Engineers are looking for:– What is my hole volume (cement) ?– What is my dog leg severity ?– Where can I get a good packer seat for testing ?– Where can I set up my whipstock ?
Production Engineers are looking for:– Where should complete this well ?– What will be my expected production rates ?– Will I have to deal with water ?– How should I complete this well ?– Do I need to stimulate this well ?– How should I stimulate it ?

3
In this course, we are going to be concentrating on reservoircharacterization and quality aspect of these uses. Specifically, we will belearning a method to quickly interpret open hole wireline logs to determineif there is a potential reservoir and then how to evaluate it for hydrocarbonproduction. To do this, we will look at the basic tools used in open holelogging, and then find out how to interpret the readings from these toolsand combine them to evaluate your well. The first step along this path willbe looking at open hole logs and determining if we could possibly have areservoir.
The Gamma Ray LogOne of the first things we need to look for when we look at a log is
a suitable reservoir. Preferably this will be a ‘clean’ (little to no shale)formation. The Gamma Ray log can help give an indication of this. Thetool itself reads the natural gamma radiation in the formation adjacent tothe detector. Since clays and shales tend to accumulate radioactivematerials, the gamma ray (GR) log is used as a shale indicator with a highgamma ray indicating shale (around 100 GAPI) and low gamma rayindicating clean formation (~30 GAPI in sands, and about ~15 GAPI incarbonates). Some typical GR values are shown below.
0 150GAPI
Shaly Sand
Shale
Clean Sand
Sandy Shale
LimestoneVolcanic Ash
CoalAnhydrite / SaltGypsum
Dolomite
4
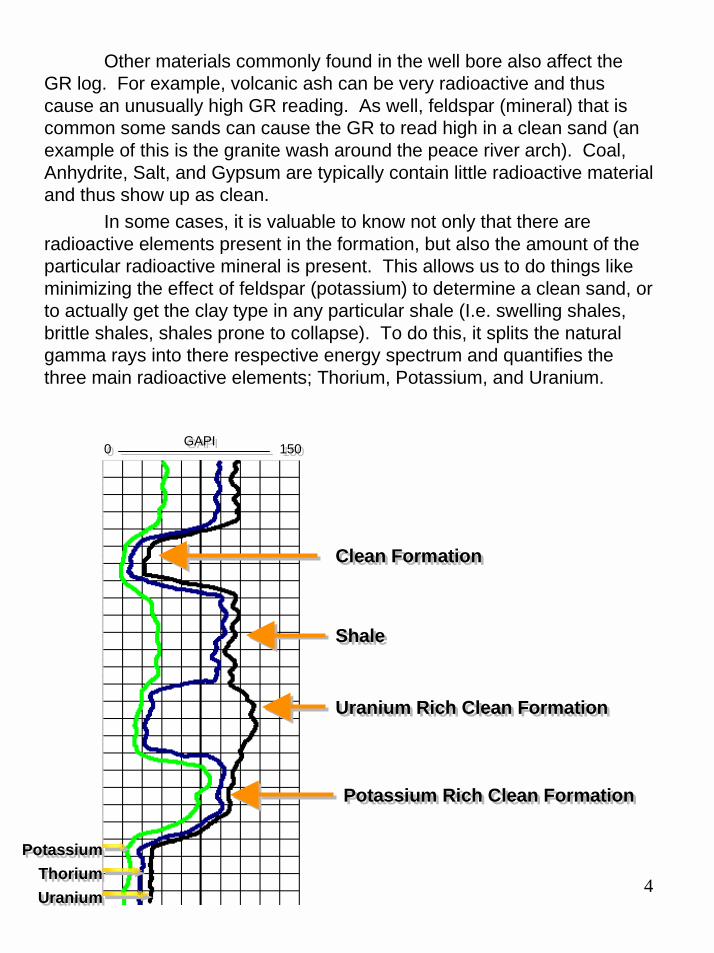
Other materials commonly found in the well bore also affect theGR log. For example, volcanic ash can be very radioactive and thuscause an unusually high GR reading. As well, feldspar (mineral) that iscommon some sands can cause the GR to read high in a clean sand (anexample of this is the granite wash around the peace river arch). Coal,Anhydrite, Salt, and Gypsum are typically contain little radioactive materialand thus show up as clean.
In some cases, it is valuable to know not only that there areradioactive elements present in the formation, but also the amount of theparticular radioactive mineral is present. This allows us to do things likeminimizing the effect of feldspar (potassium) to determine a clean sand, orto actually get the clay type in any particular shale (I.e. swelling shales,brittle shales, shales prone to collapse). To do this, it splits the naturalgamma rays into there respective energy spectrum and quantifies thethree main radioactive elements; Thorium, Potassium, and Uranium.
00 150150GAPIGAPI
PotassiumPotassiumThoriumThoriumUraniumUranium
Clean FormationClean Formation
ShaleShale
Uranium Rich Clean FormationUranium Rich Clean Formation
Potassium Rich Clean FormationPotassium Rich Clean Formation

5
Now that we know how to identify clean formations, the next thingto look at is weather or not these formations have any storage space.
Porosity Logs
In any reservoir, we need to have a certain amount of open spaceso that hydrocarbons have some where to exist. We call this storagespace porosity, and typically use three basic tools to determine whatporosity (Φ) might be. These are the Neutron tool, the Density tool, andthe Sonic tool. While all of these tools give a porosity output, they onlyinfer this from different properties of the rock and fluid in the rock.
The Sonic LogThe Sonic log, as the name implies, uses the travel time of sound
through the formation to infer porosity. That is, it sends a sound pulse ora ‘click’ out from a transmitter, and then measures the time it takes totravel through the formation and back to a receiver on the tool. Bycomparing how fast the ‘click’ travels through the rock to how fast itshould travel if there were no porosity, and knowing how fast sound willtravel through fluid, we can infer a liquid filled porosity. Since soundtravels at different speeds through different types of rock, it is important toknow rock type (sandstone, limestone, or dolomite). Also, it is importantto note that whatever is in the pore space (porosity) will also have a smallaffect on the porosity (for example, sound travels through gas at lowerrates than through fluid, therefore porosity estimates in gas will appearhigh). The equation for finding porosity (commonly we use the WyllieTime-Average Equation which is based on laboratory measurements) is afollows;
Where: Φ = porositytLOG =sonic travel time read from the logtma =sonic travel time in a clean 0 porosity matrixtfl =sonic travel time in the wellbore fluid
ΦΦΦΦ=(tLOG-tma)/(tf-tma)ΦΦΦΦ=(tLOG-tma)/(tf-tma)

6
Some common values for sonic travel times (∆t) are:
Sand ∆t = 182 µs/mLimestone ∆t = 156 µs/mDolomite ∆t = 143 µs/mAnhydrite ∆t = 164 µs/mFresh muds ∆t = 620 µs/m
In sand, you can have formations that are not fully compacted.That is, the sand grains are not perfectly packed on top of each other asthey were in Wyllie’s measurements. To correct for this, we look atadjacent shale beds (where sound velocity is highly effected bycompaction) and divide the sonic velocity read from the log by 328 µs/m.The porosity from the Wyllie equation is then divided by this BulkCompaction Factor (Bcp) to give a more realistic porosity.
Alternately, we can use the Raymer - Hunt transform from chartPor -3m (the red ‘field observations’ lines). This chart is actually an easyway to calculate porosity from a sonic log using either method. Theadvantage to using the ‘field observations’ is that they have used atransform based on field data to eliminate bulk compaction factor from theequation.
Use chart Por-3m and/or the equation above to find porosity in the cleanzones below.
500500 100100
GRGR ∆∆∆∆t∆∆∆∆t
00 150150GAPIGAPI µµµµs/mµµµµs/m

7
Since we only infer porosity from sonic travel time measurements,a number of factors can affect the sonic porosity:
– Fluid type; since the depth of investigation of the sonic log is fairly shallow,most of the fluid seen by the sonic will be mud filtrate. Residual gas will causethe sonic to read slightly high porosity's.
– Compaction; lack of compaction will cause the porosity reading to be highunless compaction is factored in, either using the Bcp or field observationtransform.
– Secondary porosity; secondary porosity (such as vugy porosity) will not bedetected by the sonic because there is always a travel path for the sound wavespast the pore space. This fact actually benefits us by allowing us to determinehow much secondary porosity there is by comparing the sonic porosity to theporosity from another tool.
– Borehole; The condition of the borehole is usually corrected for with moderntools however highly rugose boreholes will affect the sonic travel time and causeunreliable sonic porosity's.
The Neutron LogThe second porosity tool we will look at is the Neutron porosity
tool. The neutron tool uses the amount of hydrogen in a formation to inferporosity. Since water / oil has a relatively constant amount of hydrogenatoms by volume, the amount of hydrogen can be used to infer theamount of fluid in a formation, which in a clean formation is the porosity.
Neutron tool theory can be summed up as follows. Neutrons areelectrically neutral particles having a mass almost identical to the mass ofa hydrogen atom. High energy (fast) neutrons are continuously emittedfrom a radioactive source within the tool. These neutrons collide with thenuclei of the formation materials in what may be thought of as elasticbilliard ball collisions. With each collision the Neutron looses some of itsenergy. The amount of energy lost per collision depends on the relativemass of the nucleus with which the neutron collides. The greater energyloss occurs when the neutron strikes a nucleus of equal (or almost equal)mass ( Hydrogen). Since collisions with larger or smaller nuclei do notaffect the energy of the Neutron much, the slowing of the neutron islargely due to the amount of Hydrogen in the formation. Within a fewmicro seconds, the neutrons have been slowed through successivecollisions to energies of about 0.025 eV. They then float around until theyare captured by the nuclei of atoms such as Chlorine, Hydrogen, or

8
Silicon. By using a detector that measures the amount of low energyNeutrons, and by knowing what quantity of neutron capture elements(Chlorine, Silicon, etc.) in the formation material, we can say how muchhydrogen is in the formation. The amount of hydrogen in the formation isalso known as the Hydrogen Index (HI), which is the measurement of theamount of Hydrogen per unit volume of formation.
The Neutron log is presented in porosity units based on aparticular matrix type (sandstone, limestone, or dolomite). Since theamount of neutron absorbers in the formation greatly affect the porosityreadings of the log, it is essential that the correct matrix be used.
The factors that may affect the neutron log are are:– Lithology; A single known matrix must be present to accurately determine
porosity’s. Large errors may occur if matrix selection is incorrect.– Shale; The presence of chemically bound water in shales causes the the
neutron log to read high porosity’s in shales or shaly formations.– Fluid Type; since liquid hydrocarbons contain similar hydrogen concentration to
water, they do not affect the porosity readings. Gas hydrogen concentration ismuch lower than that of water and therefore will give low porosity’s.
Chart Por-13b allows you to convert between different matrices to arriveat a true porosity for the particular matrix type present.
Use Chart Por-13b to convert the following to both sandstone and dolomite porosity’s.
00 150150 6060 00GAPIGAPI %%
GRGR NPORNPORLimestoneLimestone

9
The Density Log
The third common type of porosity tool is the Density tool. Thedensity tool, as its name implies, uses the electron density of theformation to infer a porosity. It makes use of a radioactive source whichemits medium energy gamma rays into the formation. The amount ofnumber of gamma rays that are received at the detector indicates theformation density. This density that the tool reads is a combination of thedensity of the matrix (solid portion of the formation), the porosity of theformation, and the density of the fluid in the pore space. So, for a cleanformation of known matrix density (ρma), and having a porosity (Φ) thatcontains a fluid of density (ρf), the formation bulk density (ρb) will be:
ρρρρb = ΦρΦρΦρΦρf + (1-ΦΦΦΦ)ρρρρma
or, re writing this for porosity, we can use:
ΦΦΦΦD = ρ ρ ρ ρma - ρρρρb / ρρρρma - ρρρρfl
Where:ΦD = Density porosityρma = density of matrix materialρb = measured by density toolρfl = density of fluid in the borehole
Some common Densities ( ρ ) are:Sandstone - 2650 Kg/m3Limestone - 2710 Kg/m3Dolomite - 2870 Kg/m3Fresh Water - 1000 Kg/m3Oil - 850 Kg/m3
Appendix B in the Chart book has density values for various rocks. Aswell, Chart Por-5 may be used to calculate porosity from bulk density.

10
Convert the following bulk densities to porosity. Calculate for sandstone, limestone,and dolomite. Fluid is fresh water.
Typically, the bulk density will be converted to porosity and presented withthe neutron porosity log. The matrix density used for the porositycalculation should be noted on the bottom and top of the logs.
In addition to the bulk density measurement, the toll alsomeasures the photoelectric absorption index, which can be related tolithology. The photoelectric absorption factor is presented on the log as aPEF curve and can be used in conjunction with the bulk density toindicate the matrix type. Appendix B in the chart book gives differentvalues of bulk density and PEF values. The values for the commonmatrix types are:Sandstone PEF ~ 1.8 RHOB ~ 2650 Kg/m3Limestone PEF ~ 5.1 RHOB ~ 2710 Kg/m3Dolomite PEF ~ 3.1 RHOB ~ 2850 Kg/m3
On the following log, check the lithology and determine the proper porosity readings.Assume fluid density of 1000 Kg/m3.
00 150150 20002000 30003000GAPIGAPI K/m3K/m3
GRGR rhobrhob

11
Factors that may effect the Density Log are:– Lithology; the correct matrix density must be known to get a correct porosity.– Shale; the density of shale ranges from 2200 to 2650 Kg/m3 but is usually close
to 2650. This means the shale appears as matrix to the density tool and it givesa good indication of effective porosity
– Fluid type; since the depth of investigation of the density tool is shallow, the fluidgenerally seen is the mud filtrate. If residual fluid is in the area of investigation,it will have the following effect;
• Oil; residual oil will drive the density porosity high.• Salt water will drive the density porosity low• Gas; residual gas will drive the porosity reading high.
– Borehole effect; in very rough boreholes, the density tool may lift off theformation wall causing incorrect bulk density readings. (Density porosity will behigh)
00 1010PEFPEF
00 1501506060 00
%%GAPIGAPI
GRGR PEFPEF DPHIDPHI
MDEN=2650MDEN=2650

12
Total Porosity Determination
We have now seen that the basic porosity measurements areinferred from measurements of bulk density, hydrogen concentration, andacoustic travel time. These porosity’s are valid under the followingconditions:
– The porosity type is intergranular, not fractured or secondary.– The matrix type is known and constant– The rock is clean (I.e. no shale present)– The porosity is filled with fluid
If any one of these conditions are not met, the porosity measurements willdisagree in one fashion or another. This difference can be used todetermine a number of factors including: lithology, primary/secondaryporosity, gas vs. liquid filled porosity, etc. The following is a table of theresponses of the basic tools in various situations.
00 150150 6060 00GAPIGAPI %%
Gamma RayGamma Ray Total PorosityNeutron PorosityTotal PorosityNeutron Porosity
Density PorositySonic PorosityDensity PorositySonic Porosity
UncompactedShale
UncompactedShale
UncompactedClean Sand
UncompactedClean Sand
CompactedShalySand
CompactedShalySand
CompactedCleanSand
CompactedCleanSand
Compacted ShaleCompacted Shale
Carbonate
Carbonate
IntercrystalineIntercrystaline
VugyVugy
GasGas
Oil / WaterOil / Water
GasGas
Oil / WaterOil / Water
GasGas
Oil / WaterOil / Water
GasGas
Oil / WaterOil / Water
GasGas
Oil / WaterOil / Water

13
So, which porosity measurement should be used? Depending onthe formation and the tools available, we use the following.
In a sand shale sequence, for initial computations:– If ΦD is available, use ΦΦΦΦTotal = ΦΦΦΦN– If only ΦN and ∆t are available, use ΦΦΦΦTotal = ΦΦΦΦS with compaction
corrections.
In a carbonate, for initial computations:– If ΦN and ΦD are available, then use ΦΦΦΦTotal = (ΦΦΦΦN+ΦΦΦΦD)/2– If only ∆t is available, use ΦΦΦΦTotal = ΦΦΦΦS + Estimated ΦΦΦΦVugs
So now we can pick a clean formation and we can determineweather or not the formation has any pore space to contain hydrocarbon.Now, how do we tell if the formation fluid can actually move?
Permeability Indicators
Permeability is the measurement of how well fluid moves througha formation. The greater the permeability, the easier it is for fluid to movein the formation. Although there are quantitative ways to determine anactual number for permeability, we will only deal with relative permeabilityin this course.
Spontaneous PotentialOne of the first indicators of permeability we look at is the
Spontaneous Potential (SP) curve. A spontaneous potential is createdwhen fluids of different salinity come in contact with each other, eitherdirectly, or through a permeable membrane such as a shale. Ion transferbetween the fluids causes a electric potential to be created at theboundary. Because Ion movement must occur, this becomes a goodindicator of permeable zones. The difference between the mud filtrateresistivity and the formation fluid resistivity will affect the amount anddirection of the SP deflection.

14
As well as the SP, some other common logs can be used for permeabilityindication.
Microlog
The Microlog tool measures resistivity at two depths, thencompares them to indicate permeability. If there is permeability, thenmudcake should build up. Therefore, the shallow reading on the microlog(Microinverse) will read the mud cake (generally lower) and the deeperreading (Micronormal) will read the invaded formation (generally higher)producing a positive curve separation.
Caliper
Another good indicator of permeability is the caliper device. Sincepermeability produces mudcake, the borehole should be constrictedwhere a permeable formation is. So if we look at the caliper curve and itis smaller than the bit size in a porous zone, than that zone is most likelypermeable.
ShaleShale
SandSand
ShaleShale
Rmf = RwRmf = Rw Rmf < RwRmf < Rw Rmf > RwRmf > Rw
Salt mudSalt mud Fresh mud(most common)
Fresh mud(most common)

15
On the following logs, pick the apparently permeable zones.
So, we now have a clean, porous, permeable formation. All wehave to do now is find out what will come out of it.
Water Saturation Calculations
To find out weather pore space will contain water or hydrocarbon,we need to look at a few of the physical properties of the formation andthe fluids it may contain.1) Rock does not conduct electricity2) Hydrocarbon does not conduct electricity3) Water does conduct electricity
So, to begin looking at what it is in the pore space, we need to look atwhat we can measure, the water saturation or Sw. We measure it usingthe Archie equation. It can be derived as follows:
MicorinverseMicorinverse
MicronormalMicronormal
GRGR
SPSP
CaliperCaliper
Bit SizeBit Size
00 2020OHMmOHMm

16
Consider a cube of water (Φ = 100%, Sw = 100%). If we measure theresistance across it, we get a resistivity we will call Rt. If we vary theresistivity of the water in the cube, the total resistivity of the cube will varyproportionately.
Rt α Rw
Now, take the cube and put some rock in it. Since rock is an insulator, aswe add rock (decrease Φ) we increase the total resistivity.
Rt α 1/Φ
If we replace some of the fluid with hydrocarbon (an insulator) we areeffectively decreasing Sw. Since rock is an insulator, a decrease in Swwill increase Rt.
Rt α 1/Sw
So if we combine these equations, we get; Rt a Rw * 1/ΦΦΦΦ * 1/Swor re-writing it for Sw
Sw αααα Rw / ΦΦΦΦ Rt

17
Archie did some laboratory work and placed a few constants in theequation to remove the proportionality and provide a solvable formula.
Where:Sw = water saturationRw = water resistivityRt = total resistivityF = porositym = cementation factorn = saturation exponenta = constant of proportionality
For basic interpretation, we use a n of 2.Depending on the formation, we use different values for a & m.For sands a = .62 m = 2.15or a = .81 m = 2
For carbonates a = 1 m = 2
So, we know how to find Φ for this equation, what we need to find is Rtand Rw.
Resistivty Tools
Resistivity tools are tools that directly or indirectly measure theresistivity of a formation. Tools that measure this directly are generallycalled Laterolog tools, and tools that induce current to flow in theformation are called Induction tools. The primary constraint for using oneor the other is the mud fluid type. In order to carry current directly to theformation, we need to have a conductive mud. The more conductive, the
Swn = a * Rw / ΦΦΦΦm * RtSwn = a * Rw / ΦΦΦΦm * Rt

18
better the readings. If there is not a good conductive path (fresh water,invert mud system, foam, gas, etc.) than we need to read the resistivity inanother fashion. Since the basic principle of the laterolog (direct currentdevice) is fairly simple (you measure the resistivity between twoelectrodes) we will skip to the Induction device.
The induction device uses a coil to create a magnetic field. Themagnetic field created from current passing through this coil causescurrent to flow in the formation in ground loops. These ground loops inturn create a magnetic field that causes current to flow in a receiver coil inthe tool. Since the strength of the current in the receiver coil is directlyrelated to how much current is flowing in the formation, and we know howstrong a current was used to create the current flow in the formation, wecan get the resistivity of the formation.
The resistivity of the formation, if read deep enough to eliminateany effects of the borehole and invasion, is then the Rt in the Archieequation. Generally, we use the deepest reading of the induction orlaterolog tool to estimate Rt.
The last step, then, is to find the last piece of the Archie equation,the formation water resistivity (Rw)
Formation Water Resistivity
One of the keys to identifying hydrocarbon in the formation is knowing thecorrect water resistivity (Rw). There are a number of ways to find thisnumber.
One of the most common ways (in Western Canada) is to use theFormation Water Resistivities Catalogue. This is a compilation of waterresistivities from formations all over the Western Canadian SedimentaryBasin. To use this, you find the formation you want an Rw for, turn to thepage that the formation is mapped on, and then use the location to findthe Rw. You then need to correct the Rw to the temperature of theformation you are looking at. To do this, Chart Gen-9 is helpful. First goto the bottom and mark a vertical line at 25C. Then mark your

19
resistivity from the catalogue on the left hand side (careful with thescales). The point at which they intersect will be the salinity of theformation. We use salinity because it is fixed for a given water despitetemperature. Mark another point on the bottom where your formationtemperature is (I.e. 40C) and draw a vertical line. Now take your pointfrom the Rw catalogue and follow it down the blue lines (constant salinity)until it intersects the formation temperature line (vertical). Take this pointa draw a line straight to the left edge and read the Rw at your formationtemperature. If you prefer to use a calculator, you can use the equation
R2 = R1 [(T1+21.5)/(T2+21.5)]where R2 = Rw at formation temperature
R1 = Rw from the water catalogueT1 = Temperature in water catalogueT2 = Formation temperature
Another method of finding Rw is by using actual water samplefrom the well. Be careful that this reading is at the correct temperature aswell.
One more method can be used if there is a clean, 100% wet zonepresent nearby. In this case (using the Archie equation)
Rw = ΦΦΦΦm * Rt
We now know how to pick a clean zone, check for porosity andpermeability, and evaluate it for Hydrocarbon content. In other words, wenow can start do quick look evaluations of Open Hole logs. One thing toremember, however, is that this is only a quick look method. As seenthrough the beginning of this course, many things can affect the logs andthrow the interpretation off. Even so, you now have a place to start from.
The next page summarizes a method of performing quick lookevaluations in the Western Canadian Sedimentary Basin.

20
1) Pick out all the zones that are not shale using the GR
2) Use the porosity log to pick the zones in step 1 that are porousSandstone - use the density log if possible
- eliminate all zones with <9% porosityCarbonate - use the neutron and density porosity's
- eliminate all zones with <3% porosity
3) For zones left from step 2, pick the zones that are permeable usingthe SP (and / or any of the other methods)
4) From the zones left from step 3, pick out the zones with highresistivity. These should be your Hydrocarbon bearing zones.
5) We now have our zones of interest. The Neutron and Density (orneutron/sonic) logs can be used to identify gas zones (cross over).
6) Water Saturation Calculations
for sands Sw = (.62 * Rw)/(ΦΦΦΦ2.15 * Rt)
for carbonates Sw = (1 * Rw) / (ΦΦΦΦ2 * Rt)
Quick Look Method for Evaluating Wireline Logs in theWestern Canadian Sedimentary Basin

21
Will it Produce ??
In SandstonesIf Sw > 0.35 Usually no water will be produced; only
hydrocarbon.
If Sw = 0.6 - 1.0 The Zone will produce only water.
In Carbonates with Vugy PorosityIf Sw = 0.1 The zone will produce only hydrocarbon.
If Sw = 0.35 - 1.0 The zone will produce only water.
In Carbonates with Intergranular or Intercrystaline porosityIf Sw < 0.35 Usually no water will be produced; only
hydrocarbon.
If Sw = 0.60 - 1.0 The zone will produce only water.