open for innovation - abpi · the uk gets serious about collaborative science and innovation? -...
TRANSCRIPT

UniversitySpin-outs
VentureCapital
Seed Funds
HospitalsNIHR
Pharmacists
Industry
Academia
Collaborations
Business, Energy &
Industrial Strategy (BEIS)Department of
International Trade
SMEs
Biotech
Pharma
PublicMarkets
DoctorsNurses
Innovate UKCorporate
Venture Capital
Academic
Research
UNIVERSITIESRESEARCHCHARITIES
AGENCIES RESEARCHCOUNCILS
GOVERNMENT
INVESTORS NHS
Med Tech
Start-ups
MHRA
No. 10 No. 11
Parliament
LIFE SCIENCE
INDUSTRY
Patients
Office forLife Sciences
DH & Devolved
Nations
EMANICE
HRA
MRC BBSRCEPSRC
Open for InnovationUK Biopharma R&D Sourcebook 2016

i Preface – Editor
1. Introduction: ‘Open for Innovation’
Dr Neil Weir, UCB
2. Viewpoint
Open science, collaboration and accelerated development: translation at the Crick - David Roblin
Brokers and boundary spanners: will this be the year the UK gets serious about collaborative science and innovation? - James Wilsdon
3. Global health and the role of biopharma
3.1 Global health expenditure as a share of GDP
3.2 Global pharmaceutical expenditure as a share of Health expenditure
3.3 Top 10 pharmaceutical markets by value (USD)
3.4 Shares of the global pharmaceutical markets
3.5 Market shares for medicines launched in the previous 5 years
3.6 Number of biopharma companies operating in the UK
3.7 BiopharmaemploymentfiguresintheUK
3.8 Gross Value Added in the UK
3.9 Gross Value Added in the UK, selected industries
4. Investing in innovation
4.1 Global public funding of health R&D
4.2 UK health research expenditure
4.3 Worldwide biopharma R&D expenditure
4.4 PhRMA members’ R&D expenditure in total and in the US only
4.5 UK biopharma R&D expenditure and R&D intensity
4.6 Biopharma R&D expenditure by therapeutic area
4.7 Biopharma R&D expenditure along the development cycle
5. Driving clinical research
5.1 Industry sponsored experimental medicine trials
5.2 Collaborative industrial-academic experimental medicine trials
5.3 Experimental medicine trials by therapeutic area
5.4 UK Clinical Trial Applications, commercial and non-commercial
5.5 UK Commercial Clinical Trial applications by Phase
5.6 Number of Phase 1 trials, EU countries
5.7 Number of Phase 2 trials, EU countries
5.8 Number of Phase 3 trials, EU countries
5.9 Number of cardiovascular clinical trials, EU countries
5.10 Number of oncology clinical trials, EU countries
5.11 Number of nervous system clinical trials, EU countries
5.12 New molecular entities authorised, chemical and biological
5.13 Probability of success to market
5.14 Regionsoffirstlaunchofnewmolecularentities
6. Collaborating for innovation
6.1 UK academic-industry collaborations of ABPI members #
6.2 Biopharma external R&D expenditure, 2015
6.3 Change in number of UK drug discovery employees *
6.4 UK investment in collaborative and outsourced drug discovery *
6.5 UK pattern of collaboration (partners, partnership types) *
6.6 UK and international pattern of collaboration across drug discovery process *
6.7 UK participation in Innovative Medicines Initiative +
6.8 Co-authorship and funding of papers by pharmaceutical companies
6.9 Location of pharmaceutical companies collaborating with UK organisations
6.10 Researchfieldswiththehighestnumberofcollaborative publications, UK organisations and biopharma
6.11 UK organisations with the highest number of collaborative papers with biopharma, by type and organisation
# excerpts from Developing talent and partnerships to create new medicines
* excerpts from The Changing UK Drug Discovery Landscape
+ excerpts from UK Participation in IMI
Contents

3
PrefaCe
”In times of change learners inherit the earth; while the learned find themselves beautifully equipped to deal with a world that no longer exists.”
Eric Hoffer, 20th century American philosopher and (I’m told) longshoreman, is credited with this clever insight. Others have
gone further to clarify what he means by a “learner” as opposed to the “learned”. Apart from the obvious, I like one blogger’s description that learners are “open to others’ views”1. The learner is someone collaborative and open in exploration and action.
As the UK prepares to embark on a new path outside of the EU, we will need plenty of learners and the best policies and resources to foster open innovation. ‘Open Innovation’isapracticefirstcoinedbyglobalmanagementthinker, Dr Henry Chesbrough, in 20032. Henry was reflectingonachangeinpracticebyfirmsinthewaythat they brought ideas in from outside to innovate and commercialise, as well as sharing ideas externally. This “outsidein/insideout”flowofideaswasacontrasttopreviously closed R&D corporate labs. Regardless of when thispracticestarted(wecanfindexamplesacrosshistory),for innovation in medicines, the practice has become evermoreestablishedandrefined.Our2016ABPIreportcommissioned with consultancy TBR, The Changing UK Drug Discovery Landscape, documents how this practice has progressed in the UK, and signals how life science innovation in the UK provides a community of “learners” which should continue to be fostered3.
This is why ‘Open for Innovation’ is our theme for this year’s UK Biopharma R&D Sourcebook. The Sourcebook aims to provide a snapshot of some of the key measures by which our industry develops medicines and the context in which this takes place. We have these data grouped in four sections: Global health and the role of biopharma, Investing in innovation, Driving clinical research to deliver medicines and Collaborating for innovation.Weplantorefineandextendthisanalysisover the coming years, and so we would welcome feedback on the data shared and the format for the report.
In addition to the core data sections, each year we invite essays from leading experts to contribute their Viewpoints. We are thrilled to have David Roblin, Chief OperatingOfficerandDirectorofScientificTranslationat the Crick, setting out their unique approach to open innovation, as well as James Wilsdon, Professor of
ResearchPolicyattheUniversityofSheffield,exploringthe policies and incentives that drive that elusive goal – academic-industry collaboration.
Each year, we will try and introduce new evidence and insightsonspecificthemesthatmattertothefuturefordiscovery and development of medicines. We hope you willfindthisyear’seditionagoodreadandareasontocome back for more.
Dr Virginia AchaExecutive Director, Research, Medical & Innovation, Association of the British Pharmaceutical Industry
ABPI would like to thank Clarivate Analytics for their data and analysis used in the UK Biopharma R&D Sourcebook.
About Clarivate Analytics
Clarivate Analytics accelerates the pace of innovation by providing trusted insights and analytics to customers around the world, enabling them to discover, protect and commercialize new ideas faster. Formerly the Intellectual Property and Science business of Thomson Reuters, we own and operate a collection of leading subscription-based businessesfocusedonscientificandacademicresearch,patent analytics and regulatory standards, pharmaceutical and biotech intelligence, trademark protection, domain brand protection and intellectual property management. Clarivate Analytics is now an independent company with over 4,000 employees, operating in 100 countries and owns well-known brands that include Web of Science, Cortellis, Thomson Innovation, Derwent World Patents Index, Thomson CompuMark, MarkMonitor, Thomson IP Manager and Techstreet, among others. For more information, please visit us at clarivate.com.
References1. Ericson, J., Knowers and Learners, in Conversation Kindling.
2009, blogspot.co.uk: Minneapolis, MN.
2. Chesbrough, H., Open Innovation: The New Imperative for Creating and Profiting from Technology. 2003, Boston, MA: Harvard Business School Press.
3. http://www.abpi.org.uk/our-work/library/industry/Pages/ The-changing-UK-drug-discovery-landscape.aspx
Dr Neil Weir Senior Vice President, Discovery, UCB
The UK has a long tradition of acting as the world’s crucible for new ideas in science and philosophy. When one walks through the capital cities of the UK, one gets a rich sense of the history of science,
where scientists and industrialists both clashed and came together to advance our technologies and our worldview. This is perfectly illustrated in the life sciences, where many of the medical interventions we use today trace their invention to a pioneer in the UK.
However, as any pioneer knows, the routes that brought you to where you are today may be very different to the ones you need to follow in the future. That has been the focal challenge for all biopharmaceutical companies over the past decade. We are embarking on new areas of science using the new tools of genomics, advanced analytical technologies and techniques, bioprocessing, bioinformation, gene editing and cell-based treatments. Although this is the frontier of science and failures have to be anticipated, the recent results in terms of new breakthroughs published and new molecular entities approved are reassuring. The number of new molecular entities approved by the FDA in 2015 reached a new high, with 45 new medicines approved in comparison with the average of 28 per year over the previous period,2006–2014.1 Of these approvals, over one-third were for medicines considered to be“firstinclass”,andnearlyhalfwere for treatments for rare disease.
These results are the fruits ofscientificendeavourandinvestment to which our biopharmaceutical companies contribute substantially, both globally and in the UK. The
figurespresentedinthisyear’sUKBiopharmaR&DSourcebook reveal increases in global R&D investment overthelastdecade-fromUSD$108.1billionin2006to $149.8 billion in 20152 – whilst R&D in the UK by the biopharmaceutical industry had increased to £4.2 billion in 20153, breaking the trend of recent years. However, this investment does not tell the whole of the story of the progress in the discovery and development of medicines that we have witnessed in these past years. Equally important is how we have changed how we innovate. Although the biopharmaceutical industry has a long history of collaboration with academia to advance our science and our treatments, we are witnessing both an increase in the scale of engagement as well as innovations in the modalities by which we engage. The ABPI recently published The Changing UK Drug Discovery Environment which highlighted that many biopharma companies have increased overall investment in discovery activities in the UK through a collaborative and sometimes “open innovation” approach,withover60%increasingoutsourcing and collaborative working over the past decade.4 The future for innovation in life sciences, here in the UK and globally, will depend on how well we continue to innovate and collaborate, and what it means to be “open”.
1. IntroduCtIon: oPen for InnovatIon

5
A vital element that has aided this collaborative innovation is the role of the Research Councils and Innovate UK, and the Government’s commitment to them. For example, in the recent Autumn Statement the Government committed an additional £2 billion for R&D over and above previously announced funding, much of which will be available to the Research Councils and Innovate UK and will enable, as an example, Innovate UK to substantially increase grant funding. This follows a previous announcement to extend the biomedical catalyst with an additional £100m until 2020-2021. The continued enhancement and evolution of the funding and capability within these organisations is a key element in a strong and vibrant ecosystem for life sciences innovation.
It is not all uniformly good news, however. Over the last ten years almost all large biopharmaceutical companies havesignificantlydecreasedtheiremploymentinin-house discovery in the UK. Since these companies havebeenshowntoaccountforaround75%ofallemployment in the sector4 the impact of this loss is substantial. Indeed, more companies - particularly the biggest - have increased and prioritised R&D investment in the US and continental Europe, as well as new markets in Asia, when compared to the UK. This is a worrying trend for the future of UK medicines research, particularly relating to the training and development of the next generation of discovery scientists given the breadth and scale of research that larger companies have previously offered.
The Government has announced the intention to use the forthcoming industrial strategy to mark our path forward for the UK, particularly given the decision to leave the European Union. We believe that life sciences should be central to that industrial strategy, and that critical to that strategy will be an exploration about how the UK can be a global leader in the practices that will help us to be open for innovation, building on the strengths that we currently have whilst addressing some of the more concerning trends that recent data and reports point to. Some of the clues to how we might achieve this for the life sciences are found in the analysis presented in this Sourcebook, and we look forward to sharing our views on the shape of industrial strategy in the months to come.
References1 CenterofDrugEvaluationandResearch,NovelDrugs2015Summary.2016,USFoodandDrugAdministration,:Washington,DC.p.20.
2 EvaluatePharma,WorldPreview2016:Outlookto2022.2016:London.p.48.
3 OfficeforNationalStatistics,Businessenterpriseresearchanddevelopment,UK:2015,RandD,Editor.2016,ONS:London.p.42.
4 Nair,S.,M.Marshall,andM.Nicholds,TheChangingUKDrugDiscoveryLandscape.2016,TBRandCSBL,:London.p.54.

2. vIewPoInt: oPen sCIenCe, CollaboratIon and aCCelerated develoPment: translatIon at the CrICk
David Roblin ChiefOperatingOfficerandDirectorofScientificTranslation at the Francis Crick Institute
London Zoo is a great place for a day out. But early last year, away from the animal enclosures and the tourists, it was the surprising setting for a very fruitful meeting indeed. We
had organised something approaching a match-making event for researchers from the newly formed Francis Crick Institute, a large biomedical discovery institute in London, and the pharmaceutical company GSK.
On both sides, the organisers had worried that speed-dating just wouldn’t work. What would the researchers findtotalkabout,wouldtheyhaveanythingincommon,would they have anything interesting to say, would they even stay for long? I had maintained the need for an openmeetingandsonoconfidentialdisclosureswere in place.
We needn’t have worried. It turns out many Crick researchers and GSK scientists have everything to talk about, have lots in common and want to share their different approaches and experiences. It has led to many new ideas for investigating the basic biological processes involved in disease. Over a glass or two of wine, we found soulmates, united in the desire to understand the basics of human health and disease better.
AndsowasborntheCrick’sfirstproper‘openscience’partnership with a large pharmaceutical company. We’re hoping there will be many more.
Fourteen joint projects are now underway with GSK in areas from HIV and malaria to cancer, with a further two projects being developed. These see Crick researchers working right alongside scientists from GSK in the lab every day – both at the new Crick laboratory in London and at GSK in Stevenage - sharing equipment, resources and expertise. GSK scientists are so embedded they are suggesting avenues for blue-sky exploration.
This open collaboration in early-stage research is one example of the way the Francis Crick Institute has placed an emphasis on ‘translation’ as a key strategic goal from the start.
The£650millionFrancisCrickInstitute,nexttoStPancras in London, is the biggest biomedical research institute under one roof in Europe, perhaps the world. Research at the Crick aims to discover how and why diseasedevelopsinordertofindnewwaystoprevent,diagnose and treat conditions such as cancer, heart disease and stroke, infections and neurodegenerative conditions like motor neurone disease.
I’ve been leading the development of the Crick’s innovationstrategyasDirectorofScientificTranslation,having had extensive experience in running research programmes for some of the largest pharmaceutical firms.MycareerhastravelledfrombedsideintheNHSas a doctor through development and research in industry whereIworkedinPfizer,Bayerandbiotechtothebenchat the Crick. A few ideas have moved in the opposite direction and become important medicines for patients; ciprofloxacin,moxifloxacin,selzentry,sildenafilandafewmore still to come I hope.
In this role at the Crick I have turned from poacher to game-keeper! The UK is acknowledged to be world-leading in its bioscience research but really hasn’t punched its weight in translating that into new treatments for patients, new companies, new investment and returns. This needs to change. We need to make the most of our outstanding science research and turn it into new health andwealthbenefitsforsociety.
At the Crick, we are pursuing an approach to translation that we think offers something new, offers the best chanceofsuccessinprovidingbenefitstopatientssooner and can play a role in demonstrating the way to boost innovation arising out of UK science.
It’s based on three core principles: open science; accelerating the development of that science into “capable hands” where advanced testing can occur; and keeping patients at the centre of our work. I published recentlyonthis(‘TheFrancisCrickInstitute:ScientificDiscovery Open to Translation’. Pharmaceutical Medicine,2016;30(3),133-135)butreflectfurtherhere.

7
Open scienceSociety needs better treatments for many pressing health conditions: cancer, neurodegenerative disease and dementia, autoimmune conditions and infectious disease. And it is the basic understanding of the science causing these diseases that is required in order to improve the success rate and speed of developing new treatments.
Through my career I’ve seen the pharmaceutical industry increasingly collaborating with academia to achieve a better understanding of the underlying biology of disease. Various models have been used in forming these research partnerships.
What we want to do at the Crick is to collaborate openly in the very earliest, pre-competitive stages of research. Andwe’refindingcompaniesarelookingforthesameand are very willing to form partnerships. It makes sense. It’s at this stage that pharma and academia can bring their sometimes different but complementary approaches
and expertise together and make great strides in understanding the fundamental biology involved.
The idea is that only by working closely together will we know more about biological processes that can be targeted with treatment. This is best done - and has most chance of success - if the skills, talents and capabilities from both sectors are applied together in an open way, sharing knowledge.
Atthisearlystage,it’sfirstandforemostaboutmakingdiscoveriesaboutthebasicbiologyratherthanfilingpatents, which usually comes somewhat later. It may be that new treatments could be developed from such work but this is somewhat downstream. That much later stage of research is where pharma and biotech companies come into their own, with their expertise in optimising compounds and taking them through clinical studies.Thenweallbenefit:theCrickwillbenefitfromitsinvolvement,thedrugfirmwillbenefitandinthefuturesociety will have better treatments available to it.
2. vIewPoInt: oPen sCIenCe, CollaboratIon and aCCelerated develoPment: translatIon at the CrICk

Accelerating developmentThe Francis Crick Institute is very lucky to have core funding from its founding partners – the UK Medical Research Council, Cancer Research UK, Wellcome, UCL (University College London), Imperial College London and King’s College London.
This funding means we are better able to move potential innovations further along the path towards patients. By getting to a later stage of development and ensuring that the biology of disease is better understood before needing to findinvestment,thisshouldincreasethechances of success.
I believe that the current technology transfer approach taken by some other institutions can lead to a pressure to do deals early on, perhaps too early on when technologies are as-yet unproven. In addition there is a focus often on early value, with upfronts and early milestones. This is perhapsdrivenbytheneedtopaysalariesandofficecostsof independent tech transfer organisations. This together creates a perverse set of incentives which has driven long and time-consuming negotiations.
The Crick’s dedicated funding and long-term view means scientists can get on with experiments that provide confidenceinaconceptinstead.
Discoveries can be accelerated further towards clinical studies, learning from each round of research, without feeling investment deals need to be done to suit short-term needs and incentives. So, deals can come later with late milestones and royalties. Our focus is acceleration into the most capable hands, rather than the deal with the highest up-fronts.
The Crick has established a programme to identify a pipeline of research projects ripe for translation. Seed funding from the Medical Research Council is available to carry out pilot investigations. Research group leaders work with the Crick’s translation team and submit proposals which are reviewed by a translational advisory group. Some are selected to go forward, others with potential continue to be monitored or developed. Nine projects are currently underway with a further four projects in cancer, malaria and tuberculosis being developed.
Patient benefitOf course in translation and innovation, there is still one aim: to improve outcomes and quality of life for patients.
I strongly believe that clinical insight – from doctors and patients – is key for progress. For me, translation isn’t just the way in which discoveries in the lab become developed into safe and effective new therapies for patients. The process also works in the other direction too, with clinical and patient insight informing basic science in the laboratory – a truly two-way process.
So at the Crick, we are making moves to increase the clinical expertise we have available. Many of our partnerships with the London universities of UCL, Imperial and King’s involve working with clinicians. Peter Ratcliffe, our Clinical Research Director, is overseeing the support for clinical academic training provided by the Crick. And we aim to recruit more research group leaders with a clinical background.
We are also looking to carry out more research in human cells and tissues. This is because there is evidence that higher probability of getting to later stage clinical trials goes hand in hand with studies involving the human organism!Sohavingevidenceandconfidencethattheputative drug target or pathway is important in human disease is very important and all efforts should be made to achieve this as early as possible.

9
Spinout investments take research closer to the clinicIf a biological discovery in the lab is to be developed into a potential new treatment or diagnostic test, it’ll need to be optimised and validated before it gets near a patient andclinicaltrials.Thatneedssignificantinvestment,of course, and one of many ways to achieve that is by forming a new company to develop the technology.
Intheautumn,thefirstspinoutcompanieswerelaunchedbased on research by Francis Crick Institute scientists.
Achilles Therapeutics is a new company formed by Syncona LLP and Cancer Research Technology with backing of £13.2 million. It brings together research by scientists from the Francis Crick Institute and UCL (University College London) which was funded by Cancer Research UK and the National Institute for Health Research (NIHR).
Charlie Swanton and colleagues discovered unique markers that are present on the surface of all cancer cells in an individual patient’s tumour, but not on healthy cells. These markers, or ‘truncal tumour neo-antigens’, can act asflagstotheimmunesystem.AchillesTherapeuticswilldesign lung cancer therapies that target these markers with the aim of destroying tumours without harming healthy tissues.
It could provide a personalised approach to lung cancer therapy, targeting markers that are present on all the patient’s cancer cells rather than just a subset of cells. That would make it far less easy for the cancer to escape or become resistant to the treatment.
The second Crick spinout is GammaDelta Therapeutics. Co-founded by Adrian Hayday and Oliver Nussbaumer at King’s College London and the Francis Crick Institute, the company aims to exploit the unique activities of gammadelta(γδ)Tcellsthatarefoundinthebody’stissueswherecancersandinflammatorydiseasestakehold. It has received seed funding from the life sciences investment group Abingworth, as well as support from Cancer Research Technology (CRT), King’s College London and the Francis Crick Institute.
A culture of successSo the Crick is making progress. But we think there is yet another element that is important to creating success. And that is about getting the culture of an institution right.
To that end, a translation team has been appointed to put the support in place at the Crick for all these efforts. A Translation Advisory Group has been formed with a number of external experts and entrepreneurs in residence to help spark interest and run sessions for PhD students, postdocs and other interested scientists.
And when there are lots of examples of success for other researchers at the Crick to follow, this culture, this entrepreneurial mind-set, will become self-sustaining.
Will it work?What will the upshot of all this be? Will our approach based on collaboration and open science lead to new ideas and opportunities to pursue? Will developing potential new therapeutics further, faster make them any better investments? Will placing insight from patients and the clinic at the centre of what we do increase the chances of success?
Ifirmlybelieveso.Butinmanywaystheexperimentisjust starting and only time will tell. The Crick is open, the researchers have moved into the new building and the firstpartnershipsandspinoutshavebeenestablished.We’ll learn the outcome in due course and promulgate; we have a role in describing experiments in the way science is done as well as the science itself.
What I do know is: we provide an excellent basis for innovation. The Crick has world-leading science and great research partnerships, and is an attractive offer to investors. There is no shortage of ideas and projects here. We will be judged in the end on the breakthroughs in science we achieve and through delivering new therapieswithrealbenefitforpatients.Afterall,thatiswhy we do all of this.
David Roblin

James Wilsdon Professor of Research Policy and Director of Impact and Engagement in the Faculty of Social Sciences at the University ofSheffield,andchairoftheCampaign for Social Science. He is on Twitter @jameswilsdon
For a group of people dedicated to the pursuit of breakthrough ideas, the UK’s research community can be surprisingly conservative. There is a tendency among our leading universities, national academies and business groups to favour incremental tweaks over radical upheaval of the policies and structures for research funding and collaboration. Disruptive change seems to occur no more than once in a generation.
Soin1965,theScienceandTechnologyActestablishedtheprocedures for creating research councils by Royal Charter, as a contribution to Harold Wilson’s ambitions for the “white heatofthescientificandtechnologicalrevolution”.In1993,William Waldegrave as science minister published the Realising our Potential White Paper, which called for new partnership between public and private research, and the establishment of six new research councils.
And we’re now in a moment of equivalent – perhaps greater – change. The Higher Education and Research Bill – currently making its way through Parliament – will draw all seven research councils, Innovate UK and HEFCE’s quality-related funding under the new strategic umbrella of UK Research and Innovation (UKRI).
Informed by Sir Paul Nurse’s review of the research councils, and Lord Stern’s review of the research excellence framework, this nine-headed hydra will formally spring into life in April 2018. But detailed work is already underway to ensure that it delivers the step change in UK research and innovation performance that Jo Johnson MP, as minister for universities and science, and Sir John Kingman, as inaugural chair of UKRI, have promised.
Collaboration and cross-disciplinarity lie at the heart of the vision for UKRI, which the Government describes in terms of six objectives:
• a greater focus on cross-cutting issues that are outside the core remits of the current funding bodies, such as multi- and inter-disciplinary research;
• astrengthened,unifiedvoicefortheUK’sresearchandinnovation system;
• improved collaboration between the research base, business and the commercialization of discoveries;
• better mechanisms for the sharing of expertise and best practice – for example, around management of major projects and large capital investment;
• more time for research leaders to focus on strategic leadership through the centralisation of back and middle officefunctions;and
• improved quality of evidence on the UK’s research and innovation landscape through the pooling of multiple datasets.
Elsewhere, Sir John Kingman has spoken about the new funding agency as “nine brains in one body”. However, while UKRI’s objectives are laudable, there was – until recently – a nervousness in some quarters that they could be realised againstthebackdropoflargelyflatbudgets(withtheexceptionofthe Global Challenges Research Fund, which will inject an extra £1.5 billion of DfID money into development-linked research by 2020). The grinding uncertainties of Brexit have added to the downbeat mood, casting a shadow over the prospects for EU-funded collaborative research (which in 2014-2015 brought£836millionofresearchfundingintoUKuniversities).
Lord Rees, former president of the Royal Society, gave voice to the UKRI-sceptic case in a GuardianarticleinJune2016.“While there are already so many pressures in the higher education and research environment,” Rees argued, “surely we should avoid the risk and distraction of a wholesale and controversial reorganisation. Our research system is working wellandneedsnomorethanalittlefine-tuning.”1
But the context for these debates has been altered profoundly by November’s Autumn Statement, with its unexpected multi-billion pound boost to R&D funding. By 2020, government spending on R&D will grow by £2 billion above existing spending, with a total additional investment of £4.7 billion by 2020-21 – the largest increase in R&D expenditure in any Parliament since 1979.
Thisnewfundingwillflowthroughtwostreams:anewIndustrialStrategy Challenge Fund (ISCF) for collaborative research between industry and academia, targeted at priority technologies; and a broader boost to UK capacity in research and innovation. The challenge-led approach of the ISCF represents the culmination of a revival of interest in activist technology policy intheUK,whichhasbeenbuildingsincethefinancialcrisis.Earlier steps were tentative and criticised for being sub-scale.
Beyond the headlines, there are plenty of details still to be worked out. How much of the new investment will go to the research councils, and how much to the ISCF, via Innovate UK?Howwillnewchallengesandprioritiesbedefined,andwith what mix of government, academic, disciplinary and user input?
2. vIewPoInt: brokers and boundary sPanners:wIll thIs be the year the uk gets serIous about CollaboratIve sCIenCe and InnovatIon?

11
More will become clear when the Government publishes its industrial strategy in the coming weeks. But there’s no doubt that the Autumn Statement represents a transformative statementofintent.Itssignificancewasunderlinedby Lord Willetts, Jo Johnson’s predecessor-but-one as science minister, who described in the Financial Times how “gradually the Conservatives came to see that there is asignificantroleforgovernmentinthelongjourneyofatechnology from lab to market.”
So the prospects for UKRI to deliver real change in the UK’s research and innovation performance now look genuinely exciting. And any lingering resistance to the plans is likely to evaporate. To demonstrate the value of UKRI, Jo Johnson simply needs to smile and utter the words “£4.7 billion”.
The architecture is clear, the legislation to enable it is proceeding at pace, and the resources to deliver it are secure. Job done?
Unfortunately not; this is where the real work begins. To date, debates about UKRI have been characterised by an enthusiastic, well-intentioned, yet decidedly fuzzy commitment to new forms of collaboration – across disciplines, across sectors and between researchers and research users in business, government or civil society.
Now we have to get serious about new ways of working. To realise the potential of the UKRI reforms, themselves made more acute by the indeterminacies of Brexit, we need to invest time, effort and resource in developing connective tissue across the research and innovation system.
As Gillian Tett reminds us in her recent book The Silo Effect: “Silos exist in structures. But they exist in our minds too.” Genuinely interdisciplinary research escapes the constraints of our theoretical and methodological prejudices, and highlights the sheer diversity of ways to understand and tackle most problems. Getting users involved in the design phase of
research questions and projects further expands our horizons.
Working in these ways isn’t easy. Academic reward systems still tend to privilege mono-disciplinary work. Metrics and evaluation systems are underdeveloped. Career paths are less predictable and more risky.
In recent months, there have been several efforts to address these challenges in a UK context. Work by the Academy of Medical Sciences on “team science” and the British Academy’s Crossing Paths report stand out as particularly helpful. The best – and certainly the most honest – contribution I’ve enjoyed is Rethinking Interdisciplinarity, a short book by Felicity Callard and Des Fitzgerald, based on their experiences, as social scientists, of collaborating with neuroscientists through the Hub at the Wellcome Collection.
As Callard and Fitzgerald describe, they tried to start “from what interdisciplinarity looks like, on the ground, rather than in bureaucratic daydreams. We set out to write about things that usually get pushed under the carpet: the often deeply-etched disparities in institutional power across the social sciences, humanities and neurosciences ... the day-to-day, here-and-now relations and feelings through which collaborative work gets done.”2
Such issues need far more attention and discussion as UKRI moves from idealised blueprint to operational reality. And our focus needs to turn to the people who can make collaborations work; and the skills, training and capacity which they and others like them will need.
Some of these people are researchers in universities; others work in knowledge exchange, or in funding agencies. Many more will be found in the businesses, public bodies and NGOs that academics need to partner with, if the UK is to succeed in scaling up the volume and intensity of collaborative, problem-oriented activity across its research and innovation system.
All of them are brokers and boundary-spanners – the “T-shaped people” on which the success or failure of UKRI will ultimately rest. 2017 needs to be their year.
James Wilsdon
References1 Martin Rees “The proposed reforms to UK research are needlessly
drastic”.TheGuardian,15June2016
2 Felicity Callard and Des Fitzgerald (2015) Rethinking interdisciplinarity across the social sciences and neurosciences. Palgrave Pivot.
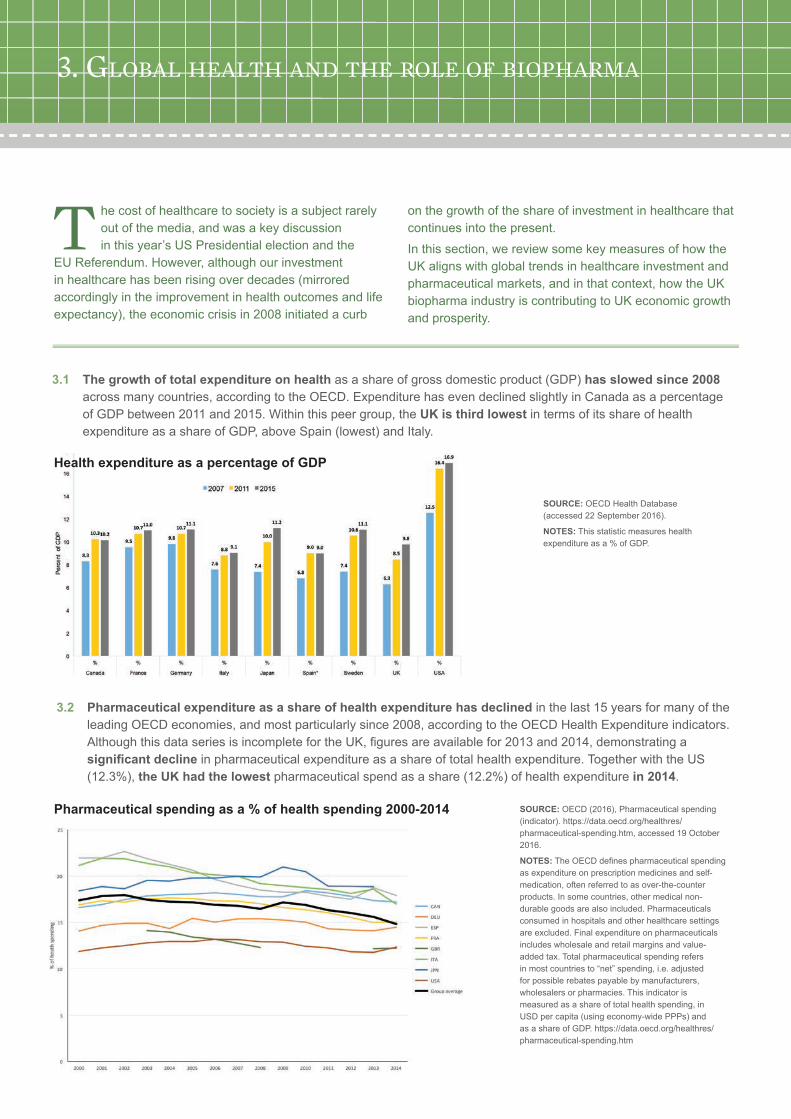
3.1 The growth of total expenditure on health as a share of gross domestic product (GDP) has slowed since 2008 across many countries, according to the OECD. Expenditure has even declined slightly in Canada as a percentage of GDP between 2011 and 2015. Within this peer group, the UK is third lowest in terms of its share of health expenditure as a share of GDP, above Spain (lowest) and Italy.
T he cost of healthcare to society is a subject rarely out of the media, and was a key discussion in this year’s US Presidential election and the
EU Referendum. However, although our investment in healthcare has been rising over decades (mirrored accordingly in the improvement in health outcomes and life expectancy), the economic crisis in 2008 initiated a curb
on the growth of the share of investment in healthcare that continues into the present.
In this section, we review some key measures of how the UK aligns with global trends in healthcare investment and pharmaceutical markets, and in that context, how the UK biopharma industry is contributing to UK economic growth and prosperity.
SOURCE: OECD Health Database (accessed22September2016).
NOTES: This statistic measures health expenditureasa%ofGDP.
SOURCE:OECD(2016),Pharmaceuticalspending(indicator). https://data.oecd.org/healthres/pharmaceutical-spending.htm, accessed 19 October 2016.
NOTES:TheOECDdefinespharmaceuticalspendingas expenditure on prescription medicines and self-medication, often referred to as over-the-counter products. In some countries, other medical non-durable goods are also included. Pharmaceuticals consumed in hospitals and other healthcare settings are excluded. Final expenditure on pharmaceuticals includes wholesale and retail margins and value-added tax. Total pharmaceutical spending refers in most countries to “net” spending, i.e. adjusted for possible rebates payable by manufacturers, wholesalers or pharmacies. This indicator is measured as a share of total health spending, in USD per capita (using economy-wide PPPs) and as a share of GDP. https://data.oecd.org/healthres/pharmaceutical-spending.htm
Pharmaceutical spending as a % of health spending 2000-2014
3.2 Pharmaceutical expenditure as a share of health expenditure has declined in the last 15 years for many of the leading OECD economies, and most particularly since 2008, according to the OECD Health Expenditure indicators. AlthoughthisdataseriesisincompletefortheUK,figuresareavailablefor2013and2014,demonstratingasignificant decline in pharmaceutical expenditure as a share of total health expenditure. Together with the US (12.3%),the UK had the lowestpharmaceuticalspendasashare(12.2%)ofhealthexpenditure in 2014.
3. global health and the role of bIoPharma
Health expenditure as a percentage of GDP

13
SOURCE: IMS World Review Analyst, accessed20September2016.
NOTES: IMS estimates sales through all distribution channels in all countries, whether these channels are audited by IMS Health or not. These estimates are intended to include both prescription and most non-prescription products. These data are provided in millions of US dollars, current values, at list prices.
Worldwide pharmaceutical markets – top 10 countries
3.3 Of the top 10 largest markets for pharmaceuticals worldwide, the United States continues to lead by a widening margin. However, important growth is also seen in China, which swapped places with Japan over 2013 to 2014 in terms oftheoverallvalueofthemarket.Ofcourse,thevalueofthemarketpercapitaisstillmoresignificantinJapanthaninChina, but the Japanese market for pharmaceuticals has declined in terms of total sales. The other leading markets are much more closely grouped with less change in overall sales.
SOURCE: IMS World Review Analyst, accessed 20 September2016.
NOTES: IMS estimates sales through all distribution channels in all countries, whether these channels are audited by IMS Health or not. These estimates are intended to include both prescription and most non-prescription products. These data are provided in millions of US dollars, current values, at list prices.
Percentage share of global pharmaceutical sales for leading markets, by sales
3.4 Considering the top 10 markets as a share of the total worldwide pharmaceutical market gives an easier view ofthedynamics,particularlyifwecontrastthefiguresfrom2011,2013and2015.Asashareoftheworldwidemarket, the share of the US marketaspartofthetotalhasgrownconsiderably(40.44%),ashastheChinese pharmaceuticalmarket(10.75%).TheUK was the only EU “Big 5” (UK, France, Germany, Italy, Spain) market for pharmaceuticals whose share in the total market increased, although growth was modest and the overall share(2.65%)remainslowerthanFrance(2.99%),Germany(3.98%)andJapan(7.59%).

SOURCE: IMS World Review Analyst, Accessed20September2016.
NOTES: IMS estimates sales through all distribution channels in all countries, whether these channels are audited by IMS Health or not. These estimates are intended to include both prescription and most non-prescription products. These data are provided in millions of US dollars, current values at list prices.
Share of the global medicines market
2011 2012 2013 2014 2015
UNITED STATES 34.31% 33.81% 34.35% 36.55% 40.44%
CHINA 6.93% 8.82% 9.83% 10.32% 10.75%
JAPAN 11.64% 11.52% 9.43% 8.25% 7.59%
GERMANY 4.64% 4.36% 4.62% 4.56% 3.98%
FRANCE 4.15% 3.83% 3.78% 3.61% 2.99%
UNITED KINGDOM 2.40% 2.41% 2.45% 2.62% 2.65%
ITALY 2.98% 2.72% 2.81% 2.71% 2.54%
BRAZIL 3.29% 3.10% 3.10% 3.01% 2.39%
SPAIN 2.36% 2.07% 2.09% 2.00% 1.91%
CANADA 2.32% 2.29% 2.16% 1.97% 1.79%
INDIA 1.48% 1.45% 1.42% 1.43% 1.55%
SOURCE: IMS World Review Analyst, accessedSeptember2016.
NOTES: The analysis above uses list prices andtheIMSMidasdefinitionfornewproducts,which is broader than new molecular entities (NMEs) and, for example, will include branded generics. Where possible new branded generics have been excluded (these will be formulations withsignificantsales). ThefigureforGermanyfor2013hasbeenomitted due to data issues.
Market share for products launched in the previous five years
3.5 Considering only recently launched medicines (within the previous 5 years), the relative shares of different countries show differences both within the peer group and across the years 2009, 2013 and 2015. Across this period, all of the OECD countries included in the analysis increased their relative share for newly launched medicines in 2015, with the exception of France. Although the UK’s market share for products launched in the previous 5 years is the lowest in this group, the share increasedin2015.Thisislargelyexplainedbylaunchesofsignificantnewclasses of medicines, notably new treatments for Hepatitis C, cancer, diabetes and anticoagulation.

15
SOURCE: OfficeforNationalStatisticsAnnualBusinessSurvey2016.
NOTES: The data relate to the manufacture of basic pharmaceutical products and pharmaceutical preparations, SIC (2007) 21.EnterprisesherearedefinedasVAT-registered organisations self-referring as a manufacturer of basic pharmaceutical products and pharmaceutical preparations.
Number of pharmaceutical enterprises in the UK
SOURCE: Number of jobs at industry level (manufacturing) are available at: https://www.ons.gov.uk/employmentandlabourmarket/peopleinwork/employmentandemployeetypes/datasets/employeejobsbyindustryjobs03 [accessedonNovember17,2016],andnumber of jobs at industry level (R&D) are available at: http://www.ons.gov.uk/economy/governmentpublicsectorandtaxes/researchanddevelopmentexpenditure/datasets/ukbusinessenterpriseresearchanddevelopment/current[accessedonNovember17,2016].
NOTES: These total employment and R&D employmentfiguresaredifferentlydefinedtothose presented in the 2015 UK Biopharma R&D Sourcebook. We have provided the full time series here to allow assessment of trends. ThesefiguresaredrawnfromadifferentONSdataset which allows for a more robust estimate for jobs in the pharmaceutical industry. Although these are always approximations, this dataset we believe provides a better estimate for our purposes. Also note that the number of jobs is rounded to the thousand.
UK pharmaceutical industry employees (000s) 1995 - 2014
3.7 In the UK, the biopharmaceutical industry continues to represent an important employer for high value jobs. Thegreatestchallengeinreportingthefiguresisdefiningtherightdatasourcesandwhattoinclude.Thedifferencebetweenthefigureswearepublishingthisyearandlastyear’sfiguresisduetoachangeinthesource;weareusingtheOfficeforNationalStatistics“EmployeesbyJobs”whichwebelieveprovidesamorerobustsamplingandmethodology, as a best approximation of employment in the pharmaceutical industry in the UK. By this assessment, the number of jobs in 2015 was 62,000, with 24,000 of those jobs dedicated to R&D.
3.6 In the UK, the biopharmaceutical industry represents an important sector for economic growth. The number of pharmaceutical enterprises has been increasingsince2008.AccordingtotheOfficeforNationalStatistics, by2014thenumberofenterprisesoperatingintheUKwas536.

SOURCE:OfficeforNationalStatistics (ONS) per annum GVA figuresatindustrylevelareavailableat: https://www.ons.gov.uk/economy/grossdomesticproductgdp/datasets/ukgdpolowlevelaggregates , Accessed onAugust2016.
NOTES: ONS estimates the GVA by two independent approaches, Current Price (CP) and Chain Volume Measures (CVM). Differences between both approaches are explained in the spreadsheet available at the link above. The analysis above corresponds with the CP approach calculated for the reference year 2013. This is a different approach than was used for the UK Biopharma R&D Sourcebook 2015. A longer note explaining gross value added analysis (overall and on a per worker basis) is provided in Box 3.1.
Gross value added (GVA) – current price reference year 2013
3.8 In terms of Gross Value Added (GVA) to the UK economy, the pharmaceuticals industry remains a leading sector contributing to wealth. However, this contribution has been in decline since 2010,reflectingthelossofoperationsand manufacturing activity from the UK.
BOX 3.1 Methodological note on change in use from Chain Volume Measurements (CVM) to Current Prices (CP) for Gross Value Added (GVA) figuresTheOfficeforNationalStatistics(ONS)publishesannualandquarterlydetailedindustryleveldataofUKoutputgross value added (GVA), “UK GDP(O) low level aggregates”, on a constant and current price basis, in an index and pounds million format. Figures of GVA are broken down by industries following Standard International Classification(SIC)codes.Forpharmaceuticalstherearethefollowingcategories:
• Division 21 Pharmaceutical products and preparations:
• Group 21.1 Basic pharmaceutical products (broadly active pharmaceutical ingredient manufacturing)
• Group 21.2 Pharmaceutical preparations (broadly packaged medicines)
Bothapproachesaresubjecttorevisionsinreportedfiguresasthereferenceyearforcalculatingpriceschanges. For instance, the update in 2015 shifted the reference year for prices to 2013 (from 2011). When comparingtheimpactonthetwoapproachesformeasuringGVA,theabsolutechangeinhistoricfigureswassmaller using current price (CP) rather than constant price (CVM). This report has therefore switched to using CP in anticipation that future revisions will be minimised. It should be noted that although the absolute values reported using the two approaches are different, the annual trends are comparable.

17
SOURCE:OfficeforNationalStatistics(ONS)PerannumGVAfiguresatindustrylevel are available at: https://www.ons.gov.uk/economy/grossdomesticproductgdp/datasets/ukgdpolowlevelaggregates, Accessed on August31,2016.ONSestimatestheGVAby two independent approaches, CP and CVM. Differences between both approaches are explained in the spreadsheet available at the link above. Figures in table and on chart correspond with the CP approach at the reference year 2013. Employment figuresathttps://www.ons.gov.uk/employmentandlabourmarket/peopleinwork/employmentandemployeetypes/datasets/employeejobsbyindustryjobs03, average of four quarters used to calculate an annualfigure.
NOTES: “Other transport equipment” includes manufacturing of air and spacecraft. GVA per worker has been calculated as the ratio of GVA (numerator) and year average employment (denominator excludes employment in R&D).
SOURCE: Eurostat
NOTES: The data for France were not available for 2008. 2009 and 2011 have been omitted because of data availability issues.
GVA (constant prices) per worker (£000s) for selected industries
Relative performance of pharmaceuticals in the UK compared to other major EU economies: GVA per worker (€000s per person)
3.9 GVA per worker across comparative sectors in the UK, pharmaceuticals provides the highest GVA per worker, followed by motor vehicles. Although there was a decline in pharmaceutical GVA per worker between 2010 and 2012, this value has recovered and has increased in the following years.
3.10 GVA per worker in the pharmaceutical industry across the European “Big 5” countries (UK, France, Germany, Italy, Spain), the UK retains the highest GVA per worker. Between 2012 and 2014, GVA per pharmaceutical worker in the UK grew to reach €191,000 per worker. Although not at the previous values seen in 2008, it is a welcome increase for the British pharmaceutical industry.

A: Break in series with previous year for which data are available B: Secretariat estimate or projection based on national sources C: National estimate or projectionH: Federal or central government only S: Unrevised breakdown not adding to the revised total V: The sum of the breakdown does not add to the total
4.1 Medicines are only one part of investment in research in healthcare. Global investment in healthcare research is an importantcomponent,butadifficultmetrictoobtainbecauseofthevariationinfundingtypesandorganisationssupportingthisworkglobally.Suchameasureincludesgovernment,theprivatesectorandtheacademic/non-profitsectors.ItiseasiesttoidentifygovernmentfundingforR&Drelatedtopublichealth,asdefinedbytheOECDFrascatiManual.
The United States leads by far the amount of government expenditure on health R&D expenditure, followed by the United Kingdom (it is roughly one-tenth of the US expenditure). The UK increased the investment by government in health R&D steadily since 2000, but this tapered off between 2010 and 2014(particularlynotingthatthesearecurrentvaluefigures).
Government funding in health R&D, selected countries
Canada France Germany Italy Japan Spain Sweden UK US
US Dollar, millions current prices
2000 517 785 602 624 823 292 23 1,499 18,766
2001 706 918 708 733 902 132 15 1,623 21,741
2002 856 993 731 .. 964 492 15 1,688 24,754
2003 943 921 793 .. 1,032 575 24 1,819 27,335
2004 966 937 817 .. 1,040 751 24 1,940 29,346
2005 1,084 1,060 859 1,093 1,076 763 24 1,977 29,871
2006 1,141 963 945 1,121 1,133 1,302 31 2,225 29,702
2007 1,336 1,049 1,062 1,664 1,178 1,529 18 2,279 31,080
2008 1,336 1,090 1,056 1,554 1,250 1,380 18 2,507 31,054
2009 1,427 1,283 1,237 1,296 1,246 1,373 30 2,777 43,926
2010 1,471 1,354 1,253 1,274 1,466 1,564 60 2,749 34,206
2011 1,355 1,353 1,394 1,254 1,480 1,500 45 2,756 33,536
2012 1,408 1,326 1,612 1,204 1,663 947 45 2,711 33,924
2013 1,369 1,389 1,637 1,092 1,673 1,308 63 3,193 32,454
2014 1,328 1,729 1,040 1,633 1,276 62 3,196 33,451
2015 1,235 1,703 1,059 76 33,745
SOURCE: OECD STAN database (Science, Technology and Patents) accessed 27 October, 2015.
NOTES: The OECD Structural Analysis (STAN)databasedefinestotalexpenditureon health as the sum of expenditure on activities that – through application of medical, paramedical and nursing knowledge and technology – has goals of: promoting health and preventing disease, curing illness and reducing premature mortality, caring for persons affected by chronic illness who require nursing care, caring for persons with health-related impairments, disability and handicaps who require nursing care, assisting patients to die with dignity, providing and administering public health, providing and administering health programmes, health insurance and other funding arrangements. The key below the diagram provides notes for the different data series, as provided by the OECD.
I nnovation in medicines above all requires commitment – commitment of time, resources and continuous endeavour – because this is one of the
most uncertain of investments. Biopharma companies have been evolving their approach to drug discovery anddevelopment,followingthescientificbreakthroughsthat allow better understanding of human biology and the biology of disease. As the evidence in this section describes, we are already seeing the success of some of these efforts in new candidate medicines and technologies; but the extent of unmet need for treatment is such that there remains so much yet to discover and deliver.
Any candidate medicine begins with the research and investment in discovery research to understand the diseasebiology,targetidentificationandvalidation,proof of principle and proof of concept efforts for a lead compound,followedbyrefinementsoftheleadcompoundand pre-clinical safety testing. These candidate treatments are then explored in clinical settings and beyond to
establish how best to further develop and then use these valued treatments. However, the journey from idea to implementation of a treatment for care is fraught with considerablescientificuncertaintyandrisk,andmostideasnever make it through to a patient, although they do play a role in the progress of science.
It takes a long time to make this journey, on average 10 to 12 years, with clinical trials alone taking six to seven years on average1. Some industry analysts have calculated average costs for developing and licensing a new medicine at well over £1 billion2. A recent Tufts Center for the Study of Drug Development (CSDD) study estimated costs could reach$2.6billion3. Overall, in 2014, the estimate was that the research-based pharmaceutical industry collectively spentnearly$141.6billiononR&Dannually4.
In this section, we will review the investment made into R&Dforhealth,andspecificallymedicines,andwhatrolethe UK plays in this broader global activity.
4. InvestIng In InnovatIon

19
4.2 In the UK, the total national expenditure on all R&D (the Gross Domestic Expenditure on R&D, or GERD) reached £30.6 billionin2014,accordingtotheOfficeforNationalStatistics.Thisrepresented1.67% of GDP, unchangedfromthe2013estimate,andwellbelowtheLisbontargetof3%ofGDP5.Ofthis£30.6billion,businessexpenditureonR&D(BERD)accountedfor65%ofthetotal.
The most recent data available on UK health research expenditure by performing sector were for 2014. As published inlastyear’sUKBiopharmaR&DSourcebook,thefigurebelowdescribesthecomponentcontributionsoftheoverall£8.5 billion health research expenditure by the performing sector. Business expenditure represented almost half of that total.
4.3 According to EvaluatePharma6, the worldwide biopharmaceutical industry invested over $1.3 trillion in R&D inthedecadefrom2006to2015andtheyforecastanannualinvestmentof$182billionby2022.Thefiguresbelowdemonstrate that this investment is growing moderately, but steadily. The R&D intensity (R&D expenditure as a share of sales) however had been declining, but has recovered in 2015 to the period high value (20.2%). At20.2%,thebiopharmaindustryhasoneofthehighestR&Dintensitymeasuresofanysectorglobally,reflectingthat R&D remains at the core of our innovation. The US retains the highest share of R&D expenditure. In Europe, the UK has the highest share if we exclude exchange rate effects.
UK health research expenditure by performing sector, 2014
Worldwide biopharma companies R&D expenditure
SOURCE: UK Clinical Research Collaboration (CRC), 2015. “UK Health Research Analysis, 2014”, pp 21-22. http://www.ukcrc.org/research-coordination/health-research-analysis/uk-health-research-analysis/
NOTES: For this analysis, the UK CRC team followed a “top down” approach, using information on total research and development activity across the research performing sectors. This is the second estimation of these figures,followingthepreviousanalysisinthe2009/10 report. The estimation is modelled on the GERD, and is detailed in Appendix 4 of the report.
SOURCE: EvaluatePharma, WORLD PREVIEW2016:OUTLOOKTO2022,p.27.
NOTES: EvaluatePharma date this analysis asAugust2016.Industrysalesarebasedon the top 500 pharmaceutical and biotech companies.

4.4 The Pharmaceutical Research and Manufacturers of America (PhRMA) association surveys its members annually and it explores the trend in PhRMA members’ total expenditure on R&D.Thefigurebelowdescribesamoderategrowth in total R&D expenditure from 2010 to 2015 by these biopharma companies (growth averages at 3% across the6yearsofdata).TheR&Dintensityisalsoincreasing,ratherthandecreasingoverthatperiod,suggestingthatthe amount of sales for these companies has declined relative to the relatively small growth in R&D expenditure.
The survey also explores the R&D expenditure of PhRMA members which is spent in the US (PhRMA US R&D), generally leading global multinational biopharmaceutical companies. For this group of companies, the US retains the great majority of R&D expenditure and this US share is increasing(growthaveragesat3%acrossthe6yearsofdata).
SOURCE: ABPI/Officeofhealtheconomics calculations based on national trade association reported expenditurefigures.
NOTES: Thechartfiguresarebasedupon national trade association reported expenditure levels and may notreflectofficialstatistics.Thechartusesexchangeratesfixedat2000levels. If actual exchange rates are used, the relative shares of European countries change, with the UK declining in relative value.
R&D expenditure for PhRMA member companies
Share of the total pharmaceutical R&D expenditure of leading pharma R&D countries
SOURCE:PhRMA2016Profile;accessedNovember18,2016.http://phrma.org/sites/default/files/pdf/biopharmaceutical-industry-profile.pdfhttp://www.phrma.org/sites/default/files/pdf/annual-membership-survey-results.pdf
NOTES: PhRMA collects this information through its Annual Membership Survey. Allfiguresincludecompany-financedR&Donly.USR&D(referredtointheProfileas Domestic R&D) includes all R&D expenditures within the US by all PhRMA member companies. A list of PhRMA member companies is available online (http://www.phrma.org/about/member-companies).

21
4.5 In the UK, biopharmaceuticals remains the highest R&D spending sector, and the level of investment grew by 8% over the previous year to £4.2 billion. The sector reached a peak in its share of overall UK business expenditureonR&Din2010,withashareof29%ofthetotal.Accordingtothe2015survey,thebiopharmaceuticalindustry spent £4.2 billion in the UK on R&D7. The next largest spending sectors are motor vehicles and parts and computer programming & information services. Aerospace has also seen a return to growth in R&D after a decline. Overall, pharmaceutical R&D represents 20% of all business expenditure on R&D in the UK in 2015.
The UK is a relatively R&D intensive country for pharmaceuticals, with an intensity (that is, UK R&D expenditure as a share of UK sales) of 38% in 2015. The only sector with a higher R&D intensity is consumer electronics and communications equipment, which has grown substantially since 2010.
SOURCE:UKOfficeforNationalStatistics(ONS), Business Enterprise Research and Development (BERD) survey 2015.
NOTES: The BERD survey is conducted annually by ONS. As part of the 2015 survey, approximately 5,400 (4,000 Great Britain and 1,400 Northern Ireland) questionnaires were sent to businesses known to perform R&D. This included around 400 of the largest R&D spenders, which accounted for approximately 75%ofthe2015totalR&Dexpenditureestimate. Smaller R&D performers and others believed to be performing R&D were selected using various sampling fractions. Industry product group and business employmentsizewerethestratificationvariables. Completed questionnaires were returnedby4,600businesses,representingaresponserateof85%.Thedataarereportedirrespective of the residence of the ultimate owner,butoverseasactivitiesofaffiliatesofUK businesses are not included.
Leading industries for UK R&D expenditure
Pharmaceutical R&D as a percentage of all industry R&D

4.6 R&D expenditure by therapeutic area in 2015, drawn from the Clarivate Analytics CMR Pharmaceutical R&D Factbook 2016,reflectsthecontinuingleadingshare(28.0%)investedinanti-cancer and immunomodulators treatments.Theshareisvirtuallyunchangedfromitsvaluein2014(28.7%,see UK Biopharma R&D Sourcebook 2015). What has grown significantly as a share of investment is the “other” category(16.7%in2014,now22.7%)and anti-infectives(3.7%in2014,now5.6%).Thisreflectsaresponsebybiopharmacompaniestoareasofunmetneed, and therefore investing in a growing range of treatment areas, including areas for rare disease, and in support of the global priority for anti-infectives, including antibiotics. PhRMA calculates that biopharma companies have more than 7,000 medicines in development globally8.
SOURCE:UKOfficeforNationalStatistics(ONS), Business Enterprise Research and Development (BERD) survey 2015.
NOTES: The BERD survey is conducted annually by ONS. As part of the 2015 survey, approximately 5,400 (4,000 Great Britain and 1,400 Northern Ireland) questionnaires were sent to businesses known to perform R&D. This included around 400 of the largest R&D spenders, which accounted for approximately 75%ofthe2015totalR&Dexpenditureestimate. Smaller R&D performers and others believed to be performing R&D were selected using various sampling fractions. Industry product group and business employment size werethestratificationvariables.Completedquestionnaireswerereturnedby4,600businesses, representing a response rate of 85%.Thedataarereportedirrespectiveoftheresidence of the ultimate owner, but overseas activitiesofaffiliatesofUKbusinessesarenotincluded.
SOURCE:2016CMRFactbookfromClarivate Analytics; Drawn from the Industry R&D Investment Programme and reproduced with permission.
NOTES: Clarivate Analytics undertakes a comprehensive benchmarking of international performance metrics, and some of this evidence is reproduced in its annual CMR Pharmaceutical R&D Factbook. For details, please refer to http://ipscience.thomsonreuters.com/. Presented is the distribution of total R&D expenditure in 2015 by therapeutic area calculated from data provided by 10 companies (seven Major and three Mid and Other). The total R&DexpenditurerepresentedbythefigureisUS$32.26billion.Majorcompaniesaredefinedasthosespending≥US$2billionin2015 on ethical pharmaceutical R&D. Mid companiesaredefinedasthosespending≥US$0.7billionand<US$2billionin2015 on ethical pharmaceutical R&D. Othercompaniesaredefinedasthosespending<US$0.7billionin2015onethicalpharmaceutical R&D.
UK R&D intensity by industry
Total R&D expenditure in 2015 by therapeutic area

23
References1 Pharmaceutical Research and Manufacturers of America
(PhRMA). Biopharmaceutical Research & Development: the Process Behind New Medicines. 20 (Washington, DC, 2015).
2 Mestre-Ferrandiz, J., Sussex, J. & Towse, A. The R&D cost of a newmedicine.(OfficeofHealthEconomics,London,2012).
3 DiMasi, J. A., Grabowski, H. G. & Hansen, R. W. The Cost of Drug Development. New England Journal of Medicine 372, 1972-1972,doi:doi:10.1056/NEJMc1504317(2015).
4 International Federation of Pharmaceutical Manufacturers and Associations (IFPMA). The Pharmaceutical Industry and Global Health Facts and Figures 2015. 87 (Geneva, 2015).
5 OfficeforNationalStatistics.Statisticalbulletin: 26(ONS,London,2016).
6 EvaluatePharma.WorldPreview2016:Outlookto2022. 48(London,2016).
7 OfficeforNationalStatistics.Statisticalbulletin(edRandD) 42(ONS,London,2016).
8 PharmaceuticalResearchandManufacturersofAmerica.2016biopharmaceuticalresearchindustryprofile.86 (PhRMA,WashingtonDC,2016).
4.7 The structure of R&D expenditure by phase of development continues to change annually, reflecting the different stages of the pipeline.Incontrasttothefiguresfor2009and2014presentedinlastyear’sUK Biopharma R&D Sourcebook,thesharesofexpenditureinresearch(15.3%in2014,now16.1%)andPhase1(8.5%in2014,now12.1%)haveincreased.Althoughthesharecategorisedas“Research”islessthanitwasin2009(25.5%),theshareofPhase1researchtodayishigherthanitwasin2009(7.3%).Theshareofinternationalrolloutandlineextensionscontinuestobesignificant,althoughless(26.1%in2014,now21.7%),ascompaniesseektoextendthevalue of the medicine beyond the original indication(s).
Definitions: Research: Phase of R&D up to the ‘First toxicity dose for the active substance’.Preclinical: Phase of R&D from ‘First toxicity dose for the active substance’ to ‘First human dose’Phase 1: Phase of R&D from ‘First human dose’ to ‘First patient dose’Phase 2: Phase of R&D from ‘First patient dose’ to ‘First pivotal dose’Phase 3: Phase of R&D from ‘First pivotal dose’ to ‘First submission’Submission: Phase of R&D from ‘First submission’ to ‘First launch’International roll out (including Line Extensions): Phase of R&D from ‘First launch in first core market’ onwards (eg Phase 4 expenditure, regulatory fees, etc for further work to support the launch for the same indication in other markets).
SOURCE: 2016CMRFactbookfromClarivate Analytics; Drawn from the Industry R&D Investment Programme and reproduced with permission.
NOTES: Clarivate Analytics undertakes a comprehensive benchmarking of international performance metrics, and some of this evidence is reproduced in its annual CMR Pharmaceutical R&D Factbook. For details, please refer to http://ipscience.thomsonreuters.com/. Presented is the proportion of R&D expenditure in 2015 by phase of R&D calculated as an aggregate of the data supplied by 13 companies (10 Major and 3 Mid and Other). Major companies are definedasthosespending≥US$2billionin 2015 on ethical pharmaceutical R&D. Midcompaniesaredefinedasthosespending≥US$0.7billionand<US$2billion in 2015 on ethical pharmaceutical R&D.Othercompaniesaredefinedasthosespending<US$0.7billionin2014on ethical pharmaceutical R&D.
Proportion of total R&D expenditure in 2015 by phase or R&D

5. drIvIng ClInICal researCh to delIver medICInes
A ny candidate medicine has to undertake extensive studiesinhumanstodemonstrateitssafetyprofileandefficacybeforeitcanbelicensedforuse
in the UK. Traditionally, there are three key phases of clinical research which collectively provide the evidence tosupportadecisionontherelativebenefitsofamedicinefor clinical use in comparison with its risks. Phase 1 clinical trials are typically conducted with a small number of healthy volunteers to determine the safety, tolerability and how the candidate medicine behaves in the body and the relationship between its molecular structure and effects on volunteers. Phase 2 clinical trials generally involve patients (eg between 100 and 500 volunteers) to assess theefficacyanddoseresponseofthecandidatemedicine,aswellasidentificationofpotentialsideeffects.Phase 3 clinical trials then continue assessment of the candidate medicine with a much greater number of patients (eg between 1,000 – 5,000 volunteers) and several clinical trial sites, usually global. A fourth phase of clinical research study is also undertaken more commonly these days as part of the post-approval research and monitoring of a medicine, to gather information on the drug’s effect in various populations and to monitor safety and long-term side effects in patients using the medicine.
Globally, the biopharma industry undertakes the greatest share of clinical research trials, and this investment makes possible the provision of innovative, novel treatments for a wide range of disease and ill-health as well as for prevention. In addition, the investment in clinical research providessubstantialbenefitstothehealthsystemsandeconomies in which it is undertaken. A recent study by Battelle investigated the impact of industrial-sponsored clinical research in the United States. They found that in
2013, the biopharmaceutical industry sponsored 6,199 clinical trials of medicines in the US, involving a total of 1.1 million participants and delivering direct expenditure of $10 billion in the conduct of trials, and yielding through indirect and induced effects a total of $25 billion in economic activity in those communities1.
Industry-sponsored clinical research represents an important share of clinical research in the UK as well. Companies will work with physician researchers to conducttheresearchwiththemtoaspecificplan(thestudy protocol). Often these studies will be held in several countries around the world simultaneously to collectively provide an evidence base for the medicine. From start to finish,theclinicaldevelopmentphasetakesanaverageof6to7years,andhistorically we have seen less than 12% of candidate medicines that enter clinical testing (at Phase 1) make it to approval2, although data presented later in this chapter show a slightly lower likelihood(9%)whichmayreflectadifferenceinestimation.Theauthorsofthe12%estimationalsonotedasignificantdecline since their previous analysis a decade ago3; this declinereflectsboththesignificantscientificchallengesthat face innovation in medicines today as well as growing complexity in clinical design itself4.
Clinical research is important to countries as a measure of the translational capacity of a healthcare system to bring concepts for new medicinal treatments into care. In the UK, the health research authorities in England, Scotland, Wales and Northern Ireland have been working to improve the environment and procedures for conducting clinical research, and progress is being made. In this section, we will review the measures for clinical research and medicine authorisations, using publicly available measures for the UK and globally.
5.1 Before a medicine reaches a Phase 1 trial, research on the candidate medicine is undertaken to establish “proof of concept” and “proof of mechanism”. This research can involve a small number of volunteers with the aim of determining dose-response, effect size and tolerability. These studies, described as experimental medicine trials, often involve state-of-the-art techniques in imaging, biomarkers and genomics. Experimental medicine has been a focus for investment in the UK clinical research environment, with the UK Clinical Research Collaboration partners dedicating over £134 million in investment to improve infrastructure, provide funding and develop research networks5.
Using Cortellis Clinical Trial Intelligence data, the evidence for the number of experimental trials conducted by industry clearly shows the strength of the US, relative to EU countries including the UK. In 2015, the US ran five times more industry-sponsored experimental trials than the UK.
The overwhelming share of trials undertaken in the US obscures the landscape in Europe. If we consider the peer group for the UK in Europe, the UK is competitive for experimental clinical trials. It is a close second to Germany over the time period 2010-2015. Interestingly Spain has increased the number of these trials consistently over the period.

25
5.2 Experimental medicine trials are an important area of development within British universities, and they have been identifiedasanopportunityforgreateracademic-industrycollaboration.Inabsoluteterms,thetotalnumberofcollaborative experimental studies between industry and academia is low, according to the Clarivate Analytics analysis. The UK is competitive within Europe for these studies and has increased its share of collaborative research since 2010.
SOURCE: Cortellis Clinical Trial Intelligence from ClarivateAnalyticsaccessedSeptember2016.
NOTES: Data were collected from the Cortellis Clinical Trial Intelligence from Clarivate Analytics using the following criteria: trial start date (1st January 2010 – 31st December 2015), phase (Phase 0, Phase 1, Phase 1a, Phase 1b, Phase 1/2 and Phase 2a clinical studies) but excluding healthy volunteer studies, and country (UK, Germany, France, Italy, Spain, US). Trials related to pharmaceutical drug development and molecular/ biological entities and pathophysiology and biomarkers studies were included. Only commercially-sponsored trials were included. All therapeutic areas were included in this analysis including oncology.
SOURCE: Cortellis Clinical Trial Intelligence from ClarivateAnalyticsaccessedSeptember2016.
NOTES: Data were collected from the Cortellis Clinical Trial Intelligence from Clarivate Analytics using the following criteria: trial start date (1st January 2010 – 31st December 2015), phase (Phase 0, Phase 1, Phase 1a, Phase 1b, Phase 1/2 and Phase 2a clinical studies) but excluding healthy volunteer studies, and country (UK, Germany, France, Italy, Spain). Trials related to pharmaceutical drug development and molecular/ biological entities and pathophysiology and biomarkers studies were included. Only commercially-sponsored trials were included. All therapeutic areas were included in this analysis including oncology.
Definition: Experimental medicine trials involve “investigation undertaken in humans, relating where appropriate to model systems, to identify mechanisms of pathophysiology or disease, or to demonstrate proof-of-concept evidence of the validity and importance of new discoveries or treatments.”6
SOURCE: Cortellis Clinical Trial Intelligence from ClarivateAnalyticsaccessedSeptember2016.
NOTES: Data were collected from the Cortellis Clinical Trial Intelligence from Clarivate Analytics using the following criteria: trial start date (1st January 2010 – 31st December 2015), phase (Phase 0, Phase 1, Phase 1a, Phase 1b, Phase 1/2 and Phase 2a clinical studies) but excluding healthy volunteer studies, and country (UK, Germany, France, Italy, Spain, US). Trials related to pharmaceutical drug development and molecular/ biological entities and pathophysiology and biomarkers studies were included.
Trials were only included as collaborative if they were industry-sponsored and one or more partners were an academic organisation or were academia sponsored and one or more partners were a commercial organisation. All therapeutic areas were included in this analysis including oncology.
Industry sponsored experimental medicine trials, by year (core EU & US, 2010-2015)
Industry sponsored experimental medicine trials, European peer group
Collaborative industrial-academic experimental medicine trials, by year 2010 - 2015
Num
ber o
f Tria
lsN
umbe
r of T
rials
Num
ber o
f Tria
ls

SOURCE: Cortellis Clinical Trial Intelligence from Clarivate Analytics accessed September2016.
NOTES: Data were collected from the Cortellis Clinical Trial Intelligence from Clarivate Analytics using the following criteria: trial start date (1st January 2010 – 31st December 2015), phase (Phase 0, Phase 1, Phase 1a, Phase 1b, Phase 1/2 and Phase 2a clinical studies) but excluding healthy volunteer studies, and country (UK, Germany, France, Italy, Spain, US). Trials related to pharmaceutical drug development and molecular/ biological entities and pathophysiology and biomarkers studies were included. Only commercial trials were included. Collaborative trials were only included if one or more partners were a commercial organisation. Number of trials identifiedthetop10therapyareasforeachcountry, all therapeutic areas were included in this analysis including oncology.
We present the data for oncology trials separately to allow for clearer analysis of trends amongst the other therapeutic areas.
Oncology experimental medicine trials, 2010 - 2015
Top 10 experimental medicine trial therapy areas, by country (Core EU & US, 2010 - 2015) - excluding oncology
5.3 According to the Clarivate Analytics analysis, oncology was the top therapy area for experimental trials for all countriesexamined.Thismayreflectthefactthatalloncologytrialsareroutinelycarriedoutinpatientsandnot healthy volunteer studies. The UK is competitive across Europe in a number of other therapy areas and demonstrates expertise in respiratory studies, which was not a top 10 therapy area for the US.
5.4 In the UK, the Department for Business, Innovation and Skills published the second annual series of Life Science Competitiveness Indicators7, which reviewed the relative shares of patients recruited to global studies across all trial phases. This evidence revealed that the share of patients recruited to global studies in the UK, rose from 1.6% in 2010 to 2.7% in 2014.The UK share remains substantially less than the US share, lower than Germany and Poland, and greater than France and the Czech Republic7. However, the data reveal that any analysis has to look at trends over a longer period, as there is considerable volatility in the numbers by year.
One way to measure clinical research is to review the clinical trial applications received by the UK regulator, the MedicinesandHealthcareproductsRegulatoryAgency(MHRA).AccordingtotheMHRA’sfigures,thenumber of applications for clinical trials in the UK has declined since 2005 with the lowest ebb in 2010. Recent years show a recovery in application numbers. In 2015, 842 commercial clinical trial applications were received, which is close to the number of applications seen a decade ago.
Num
ber o
f Tria
lsN
umbe
r of T
rials

27
The UK National Institute for Health Research (NIHR) statistics show that nearly 35,000 participants were recruited to650newcommercialcontractstudiestakingplacethroughtheNetworkin2015-168. It is important to take into account a number of factors that could contribute to the differences between the MHRA data and the NIHR statistics. Firstly, not all applications would have been successful – either being totally unsuccessful or requiring further amendments with subsequent delay and secondly, not all commercial research is necessarily conducted via the NIHR clinical research network. However, the conclusion that can be drawn is that both MHRA and the NIHR analyses indicate a continued competitive performance for clinical research in the UK.
5.5 The MHRA data for clinical trial applications by Phase 1 are a good proxy for clinical trial activity in the UK. If we look at the period as a whole (2005-2015) for commercially sponsored applications, there is a marked decline inPhase2(-6%)andnogrowthinPhase4applications.However,since2011,thedeclineislessmarked,withadeclineof4%inPhase1trialapplicationsandgrowthof6%inPhase4applications.However,between 2011 and 2015, applications for Phase 2 and 3 trials grew by 7%, surpassing in 2015 the number of applications seen in 2007.
SOURCE: Adapted from MHRA Clinical Trials for Medicines: authorisation assessment performance.
https://www.gov.uk/government/uploads/system/uploads/attachment_data/file/564942/10_Oct_2016.pdf lastaccessedNovember2016.
NOTES: MHRA last updated the data inNovember2016.Thedatasetout the number of applications assessed by MHRA split out by phase and commercial and non-commercial sponsors between 2005 and 2015 for all clinical trial phases.
Adapted from MHRA Clinical Trials for Medicines: authorisation assessment performance
https://www.gov.uk/government/uploads/system/uploads/attachment_data/file/564942/10_Oct_2016.pdf lastaccessedNovember2016
NOTES:In2005and2006,Phase4trials were included together with Phase 2 and III trials. MHRA last updated the datainNovember2016.Thedatasetoutthe number of applications assessed by MHRA split out by phase for commercial sponsors only.
UK clinical trial applications received
UK commercial clinical trial applications by phase

5.6 Using Cortellis Clinical Trial Intelligence data from Clarivate Analytics, the evidence for the number of trials for Phase 1 clinical research clearly shows the continued strong performance of the UK, relative to other EU countries including Germany, although in 2015 both Germany and the UK show a decline from the 2014 performance.
5.7 The UK is competitive for Phase 2 clinical trials in Europe, according to the Clarivate Analytics Cortellis analysis. By 2015, the number of Phase 2 trials in the UK is roughly matched to that of the leading country, Germany (which has seen a decline in the number of Phase 2 clinical trials over the past few years).
SOURCE: Cortellis Clinical Trial Intelligence from Clarivate Analytics, accessedJuly2016.
NOTES: Data were collected from Cortellis Clinical Trial Intelligence, Clarivate Analytics using the following criteria: trial start date (1st January 2010 – 31st December 2015), phase (1, 2, 3), and country (UK, Germany, France, Belgium, Spain, Poland, Czech Republic and Italy). Only trials related to pharmaceutical drug development and molecular/biological entities were included. Only commercial trials were included. Collaborative trials were only included if one or more partners were a commercial organisation. All therapeutic areas were included in this analysis.
Phase 1 clinical trials UK vs Europe
SOURCE: Cortellis Clinical Trial Intelligence from Clarivate Analytics, accessedJuly2016.
NOTES: Data were collected from Cortellis Clinical Trial Intelligence, Clarivate Analytics using the following criteria: trial start date (1st January 2010 – 31st December 2015),phase(1,2,3,unspecified)and country (UK, Germany, France, Belgium, Spain, Poland, Czech Republic and Italy). Only trials related to pharmaceutical drug development and molecular/biological entities were included. Only commercial trials were included. Collaborative trials were only included if one or more partners were a commercial organisation. All therapeutic areas were included in this analysis.
Phase 2 clinical trials UK vs Europe

29
5.8 According to these data, the UK is continuing to demonstrate competitive performance in Europe for Phase 3 trials and has even moved ahead of Spain this year. What is interesting about this evidence is that the decline, seen in 2014 for all compared countries in Europe, seems to have picked up this year. It will be essential over the next few years to monitor whether this is an isolated year or whether it is the beginning of an upward trend for Phase 3 clinical trials in Europe.
5.9 Exploringthedataforclinicaltrialsbytherapeuticfocus,wecanseeareaswherespecificcountriesmayhavecompetitiveadvantagebasedonscientificexcellenceandclinicalopportunity.Forcardiovascular treatments, Germany and the UK are both significant sites for clinical research; however, we are seeing an overall downward trendinresearchinthisdiseaseareawhichisalikelyreflectionofproductpipelineratherthana result of global competition for trials in cardiovascular disease.
SOURCE: Cortellis Clinical Trial Intelligence from Clarivate Analytics, accessedJuly2016.
NOTES: Data were collected from Cortellis Clinical Trial Intelligence, Clarivate Analytics using the following criteria: trial start date (1st January 2010 – 31st December 2015), phase (1, 2, 3) and country (UK, Germany, France, Belgium, Spain, Poland, Czech Republic and Italy). Only trials related to pharmaceutical drug development and molecular/biological entities were included. Only commercial trials were included. Collaborative trials were only included if one or more partners were a commercial organisation. All therapeutic areas were included in this analysis.
Phase 3 clinical trials UK vs Europe
SOURCE: Cortellis Clinical Trial Intelligence from Clarivate Analytics, accessedJuly2016.
NOTES: Data were collected from Cortellis Clinical Trial Intelligence, Clarivate Analytics using the following criteria: trial start date (1st January 2010 – 31st December 2015), phase (1, 2, 3, and 4), and country (UK, Germany, France, Belgium, Spain, Poland, Czech Republic and Italy). Only trials related to pharmaceutical drug development and molecular/biological entities were included. Only commercial trials were included. Collaborative trials were only included if one or more partners were a commercial organisation. This analysis focused on cardiovascular treatment trials only. Trials across multiple therapy areas were only included once. The therapy area in which they were included was determined by the trial’s main purpose for study.
Clinical trials for cardiovascular treatments

5.10 Oncology clinical trials represent a higher share of clinical trials in the dataset for all countries. The leadership position in Europe for oncology trials is clearly contested, with an interesting increase in the number of trials in Spain overtheperiod.Withalltypesandphasesoftrialsincluded,itisdifficulttoexplorewhetherthereisanydifferentiation amongst countries in their comparative advantage for oncology clinical research. However, we note that the UK remains competitive for oncology trials and is on par with Germany and France, with a sustained increase in the number of trials in the UK over the period.
5.11 This year has seen a notable increase broadly across Europe, in trials for treatments related to diseases of the nervous system. Where the preceding years showed a decline which was particularly marked in Germany and France, this yearhasshownasharpupturnfortheUK,whichforthefirsttimeconductedmoretrialsinthisareathanGermany.Overall, the number of trials reported was fewer than for oncology, but more than for cardiovascular disease.
SOURCE: Cortellis Clinical Trial Intelligence from Clarivate Analytics, accessedJuly2016.
NOTES: Data were collected from Cortellis Clinical Trial Intelligence, Clarivate Analytics using the following criteria: trial start date (1st January 2010 – 31st December 2015), phase (1, 2, 3, and 4), and country (UK, Germany, France, Belgium, Spain, Poland, Czech Republic and Italy). Only trials related to pharmaceutical drug development and molecular/biological entities were included. Only commercial trials were included. Collaborative trials were only included if one or more partners were a commercial organisation. This analysis focused on oncology treatment trials only. Trials across multiple therapy areas were only included once. The therapy area in which they were included was determined by the trial’s main purpose for study.
Clinical trials for oncology treatments
SOURCE: Cortellis Clinical Trial Intelligence from Clarivate Analytics, accessedJuly2016.
NOTES: Data were collected from Cortellis Clinical Trial Intelligence, Clarivate Analytics using the following criteria: trial start date (1st January 2010 – 31st December 2015), phase (1, 2, 3, and 4), and country (UK, Germany, France, Belgium, Spain, Poland, Czech Republic and Italy). Only trials related to pharmaceutical drug development and molecular/biological entities were included. Only commercial trials were included. Collaborative trials were only included if one or more partners were a commercial organisation. This analysis focused on central nervous treatment trials only. Trials across multiple therapy areas were only included once. The therapy area in which they were included was determined by the trial’s main purpose for study.
Clinical trials for treatments related to the central nervous system

31
5.12 The aim for all clinical research is to provide the evidence needed to secure marketing authorisation. Over the period 2009 to 2015, industry has seen a growth in the number of new molecular entities (NMEs), both chemical and biological, launched worldwide. This is a good measure of the innovative activity of the industry,andtheconfirmationofwelcomenewtreatmentsforpatients.Overthepasttwoyears,thenumberofnewbiopharmaceutical molecular entities has increased in particular, and this is anticipated as more of the pipeline includes these technologies.
5.13 The drug development cycle continues to be challenging and highly uncertain, but there has been some improvement. IfwecomparethefiguresfromtheCMR Factbook 2015,tolastyear’sfigures(seeUK Biopharma R&D Sourcebook 2015for2014),thedifficultperiodthatprecedesthefirstpivotaldosetomarketnowshowsagreaterprobabilityofsuccess.Theincreasesaresmallbutareanimportanttrend(from5%to6%forfirsttoxicitydosetomarket,from7% to 9%forfirsthumandosetomarket,andfrom17%to20%forfirstpatientdosetomarket).
Probability of successfully reaching market authorisation remains unchanged for the last two stages. Upon reaching the first pivotal dose (eg Phase 3), almost two-thirds of active substances are expected to make it through to market authorisation, but a third will not progress.
SOURCE:2016CMRFactbookfromClarivateAnalytics; Drawn from the Annual Survey of New Molecular Entity First Launches / New Medicine Launches 2015. A complete guide to New Molecular Entities (NMEs) launched worldwide and reproduced with permission.
NOTES: To compile this analysis, annual surveys of the global pharmaceutical industry were undertaken to identify all new molecular entitieslaunchedforthefirsttimeanywhereinthe world between 2005 and 2015.
New Biopharmaceutical Entity (NBE): A biological substance that has been produced or extracted from a biological source for therapeutic, prophylactic or in vivo diagnostic use in humans. This includes i) a substance isolated directly from animal tissues eg hormones; ii) a naturally occurringormodifiedpolypeptide,protein,DNAor RNA product (produced by recombinant DNA or hybridoma technology and expressed in cell lines, transgenic animals or transgenic plants).
New Chemical Entity (NCE): A chemical substance that has been created or synthesised using physical or chemical manufacturing methods capable of a high degree of consistency.
SOURCE:2016CMRFactbookfromClarivate Analytics; Drawn from the Global R&D Performance Metrics Programme and reproduced with permission.
NOTES: Between-phase success rates were calculated using the CMR methodology. The fate (progressed/terminated) of active substances that entered phase between 2009 and 2011 were assessed as of 31st December 2014. Displayed are the probability of success to market values, which are a product of the between-phase success rates from the start milestone to market.
Number of first NME launches between 2005 - 2015 by active substance type
Probability of success to market for active substances

5.14 Comparingacrossregionsovertheperiod2006-2015,theUnited States has remained the principal region for the first launch of New Molecular Entities (NME) and this trend has been more pronounced since 2009. The United States retains a key innovative draw for new medicines over other regions around theworld.Afterincreasingitsshareoffirstlaunchesupto2009,Europe now sees very few, with only 7% of NMEs first launched in Europe in 2015.
Region of first launch for new molecular entities 2006 - 2015 SOURCE:2016CMRFactbookfromClarivate Analytics; Drawn from the Annual Survey of New Molecular Entity First Launches / New Medicine Launches 2015. A complete guide to New Molecular Entities (NMEs) launched world-wide and reproduced with permission.
NOTES: Annual surveys of the global pharmaceutical industry were undertaken to identify all new molecular entities introducedforthefirsttimeanywhereinthe world. Presented is the proportion ofeachyear’soutputbetween2006and 2015 according to the geographical regionofthefirstlaunch.
References1 Battelle Technology Partnership Practice, Biopharmaceutical
Industry-Sponsored Clinical Trials: Impact on State Economies. 2015: Washington DC. p. 22.
2 PharmaceuticalResearchandManufacturersofAmerica,2016biopharmaceuticalresearchindustryprofile.2016,PhRMA:WashingtonDC.p.86.
3 DiMasi, J.A., H.G. Grabowski, and R.W. Hansen, Innovation in the pharmaceutical industry: New estimates of R&D costs. Journal of HealthEconomics,2016.47:p.20-33.
4 Getz, K.A., R.A. Campo, and K.I. Kaitin, Variability in protocol design complexity by phase and therapeutic area. Drug Information Journal, 2011. 45(4): p. 413-420.
5 UK Clinical Research Collaboration. Experimental Medicine: Joint FundingInitiatives.2016[cited2016November21];Availablefrom:http://www.ukcrc.org/research-infrastructure/experimental-medicine/joint-funding-initiatives/.
6 MedicalResearchCouncil.ExperimentalMedicine.2016[cited2016November21];Availablefrom:http://www.mrc.ac.uk/research/initiatives/experimental-medicine/.
7 OfficeforLifeSciences,LifeScienceCompetitivenessIndicators,I.a.S.B.UKBusiness,Editor.2016,HMGovernment:London.p.37.
8 National Institute for Health Research, Research delivery in theNHS2015-2016,NHS,Editor.2016:London.p.1.

33
T he theme of this year’s Sourcebook is “Open for Innovation”. We say this very much in parallel to the more often used phrase, “Open for business”.
But our goal sets out a change in how we discover, develop, manufacture and deliver new medicines, and, as the analysis in this chapter demonstrates, the change is well underway.
Open innovation isn’t a new concept, but, as the Introduction from our Innovation Board chair, Dr Neil Weir, explains, it is also not a static concept. The practices to deliver open innovation, and the infrastructure to support these, continue to evolve and adapt to the opportunities
and the challenges we face. Moreover, open innovation inspires (and is inspired by) a culture and a mind-set that have to be fostered, and leadership that makes the goal clear. Our two Viewpoint essays illustrate these points eloquently.
WhatwewillcoverinthisfinalsectionoftheUK Biopharma R&D Sourcebook 2016 is some of the evidence of how the UK is “open for innovation” today. We will include here some new research using bibliometrics to illustrate collaboration, as well as evidence from recently published research by the ABPI on collaboration and the drug discovery environment in the UK.
6. CollaboratIng for InnovatIon
6.1 Lastyear’sreportfromProfessorAnnDowlingfortheGovernmentidentifiedareasforimprovementtoencourage greater collaboration1.Thestudynotedthat“[t]heUKhasavibrantresearchenvironment,witharange of collaborations taking place between universities and business across many disciplines, but there is more to be done to help existing efforts evolve from short-term, project-based collaborations to longer-term partnerships focussed on use-inspired research.”1: p.3
This year, the ABPI undertook its own survey of members to identify links between industry and academia. These links range right across academia from interactions with undergraduates to postdoctoral researchers, fellows and professors.
We collect these data every two years to assess trends in this important work. In this year’s survey, data were collected on the number of academic links that were in place as of 31 December 2015 and those that started andfinishedduring2015(forexample,placementsunderoneyearinlength).
Overall top 20 academic institutions SOURCE: Developing talent and partnerships to create new medicines. Published September 15,2016.http://www.abpi.org.uk/our-work/library/industry/Pages/Developing-talent-and-partnerships-to-create-new-medicines.aspx
NOTES: The ABPI survey was sent out to all ABPIfullmembersandresearchaffiliatesandwas intended to capture both R&D and non-R&D interactions, for example those in HR, IT, Finance and other roles across all company sites. The data were collected and analysed by the ABPI.

Thebarchartandfiguresbelowarereproducedfromthepublishedreport,Developing talent and partnerships to create new medicines, and they show some areas of strength but also opportunities that need addressing. The increase in undergraduate industrial placements in research and development (294 placements) was particularly noteworthy,incomparisonwiththefigurein2013of250placementsinR&D),andanevengreaterincreaseinnon-R&Dplacements(300placementsin2015,upfrom169in2013)inmanufacturingandotherbusinessareas.Thisincrease in industrial placements stands in contrast to the number of PhDs supported by industry, which is now at its lowest level since 2003. This decline is likely to be driven by a lack of supervisory capacity within pharmaceutical company sites in the UK, many of which have closed or downsized their R&D operations based here.
Moreover,asthefirstgraphdemonstrates,thesepartnershipsarehappeningwithawiderangeofinstitutionsacross the UK. The University of Strathclyde has the highest number of PhD students in partnership with industry (75 PhDs), followed by the next highest-ranked institutions, UCL, Manchester and Cambridge.
The report also illustrates partnerships that are related to collaborative research. For example, the Dundee Division of Signal Transduction Therapy has been continuously supported by several pharmaceutical companies sinceitwascreatedin1998.Otherpartnershipsarefocusedonaspecificdiseaseareaormoregeneralpurposeresearch, such as validation of therapeutic targets for medicines. The ABPI survey illustrated that the number of major collaborative projects and initiatives is increasing as industry shifts towards long-term open partnerships with academia, charities and other funders.
References1 The Dowling Review of Business-University Research Collaborations, Department for Business Innovation & Skills, Editor. 2015,
HM Government: London. p. 84.

35
6.2 Biopharmaceutical companies have been increasing collaboration and extending R&D investment to external projects and partners. In last year’s UK Biopharma R&D Sourcebook 2015, we presented data from the Thomson Reuters CMR International for 2009 and 2014 that demonstrated an increase in the share of external spend within total R&D expenditurefromanaverageof35%toanaverageof41.8%acrosssurveyedcompanies.Thistrendhascontinuedwiththeupdatedfigurefor2015givenas44.7%. Although the share of external spend in 2014 was greatest for the smaller biopharmaceutical companies (“Mid and other” companies spend less than $2 billion on R&D), at an average of 54.9%,thedifferencebetween“major”and“midandother”companieswasmuchlessin2015.
Internal and external spend by company size in 2015
Change in number of UK drug discovery employees
SOURCE:2016CMRFactbookfromClarivateAnalytics; Drawn from the Industry R&D Investment Programme and reproduced with permission.
NOTES: Presented is the proportion of total R&D expenditure in 2015 allocated either internally or externally, calculated as a median of the data providedbyaminimumoffivecompanies.Dataarealso shown for Major or Mid and Other companies where at least three companies are represented. The data presented in this graph are based on data from 15 companies (11 Major and 4 Mid and Other). Majorcompaniesaredefinedasthosespending≥US$2billionin2015onethicalpharmaceuticalR&D.Midcompaniesaredefinedasthosespending≥US$0.7billionand<US$2billionin2015onethical pharmaceutical R&D. Other companies are definedasthosespending<US$0.7billionin2015on ethical pharmaceutical R&D.
SOURCE:2016TheChangingUKDrugDiscoveryEnvironment, TBR and CBSL for the ABPI. http://www.abpi.org.uk/our-work/library/industry/Documents/the-changing-UK-drug-discovery-landscape.pdf
NOTES: Change in number of UK drug discovery employees in the last 5 years across all organisations:1-9n=21(as%of26),10-24n=18(as%of20),25-49n=5(as%of6),50-99n=7(as7of7),100-249n=5(as%of5),250-499n=3(as%of3),500+n=2(as%of2).Wherecolumnsdonotsumto100%itisbecausesomefirmswerenotableto answer or had not traded for 5 years.
6.3 To explore such trends in R&D investment further, the ABPI commissioned economic consultants TBR and CSBL to generate a robust evidence base of the shifting drug discovery landscape in the UK, where there is a particular lackofpubliclyavailabledataduetodifficultiesinisolatingdrugdiscoveryfrombroadertrendsinpreclinicalandclinical development. They made use of a combination of quantitative surveys and expert interviews involving almost 80 organisations across the drug discovery landscape (pharmaceutical companies, biotech companies, contract research organisations (CROs), and academia).
The research shows that there has been a shift from in-house drug discovery employment in large pharmaceutical companies, to increased employment in smaller and mid-sized companies, CROs, and academia. The majority oflargecompanieshavesignificantlydecreasedtheirnumberofin-housedrugdiscoveryemployeesintheUKinthelast 5 years, whilst there has been an increase in employment in many small and mid-sized organisations.

6.4 Almost all organisations have increased their absolute level of investment in collaborative and outsourced drug discovery in the UK in the last 10 years, demonstrating a shift towards more open ways of working, and consistent with the trends in overall external R&D spend.
SOURCE: 2016TheChangingUKDrugDiscovery Environment, TBR and CBSL for the ABPI. http://www.abpi.org.uk/our-work/library/industry/Documents/the-changing-UK-drug-discovery-landscape.pdf
NOTES: Change in UK investment in collaborative and outsourced drug discovery by initiatorfirmsinlast10years.ForCollaborativeinvestment:1-49n=18(as%of28),50-249n=3(as%of4),250+n=8(as%of10).ForOutsourcedinvestment:1-49n=22(as%of28),50-249n=4(as%of4),250+n=9(as%of10).Wherecolumnsdonotsumto100%itisbecausesomefirmswerenotabletoanswerorhad not traded for 10 years.
Change in UK drug discovery collaboration investment
Change in UK drug discovery outsourcing investment
6.5 Companies work collaboratively with a broad range of organisations in the UK including academia, CROs, biotech companies, and research charities. Organisations work via a variety of collaborative models. One-to-one commercial collaborations are the most common. However, almost as many companies report participating in pre-competitive collaborations with academia or industry as having traditional commercial collaborations.
Mirroring the increase in outsourced drug discovery investment shown above, the large majority of service providers (CROs and some academic units) have seen an increase in commissioned discovery work in the last 5-10 years. As many service providers report clients from the EU and US as the UK, but interestingly few report working for clients based in Asia.

37
SOURCE:2016TheChangingUKDrugDiscovery Environment, TBR and CBSL for the ABPI. http://www.abpi.org.uk/our-work/library/industry/Documents/the-changing-UK-drug-discovery-landscape.pdf
NOTES: For Partnership by size of organisation, number of respondents is 48. For Types of Partnership, number of respondents is 77. For CRO graphs, number of respondents is 28.
Partnerships made by initiator organisations by size of organisation (total employment) n=48
Types of partnership entered into across all organisations n=77
Percentage of CROs reporting change in commissioned activity in the last 5 years, n=28

6.6 Companies conduct different parts of the drug discovery process in different ways and in different parts of the world. Notably, many companies outsource non-GLP safety studies in the UK, whilst many companies conduct target identificationandvalidationincollaborationintheUK,likelyreflectingthehighqualityofUKbiologicalacademicresearch.Almost60%ofcompaniesundertakehighthroughputscreeningoutsideoftheUK.
SOURCE: 2016TheChangingUKDrug Discovery Environment, TBR and CBSL for the ABPI. http://www.abpi.org.uk/our-work/library/industry/Documents/the-changing-UK-drug-discovery-landscape.pdf
NOTES: Percentage of initiator organisations conducting work for customers in each way, n=44.
Change in UK collaboration investment
Percentage of CROs reporting they work for customers in different global regions, n=28

39
6.7 One important framework for collaboration in Europe has been the Innovative Medicines Initiative (IMI), which is one of the world’s largest collaborative medical research initiatives. This Public Private Partnership brings together the pharmaceutical industry with academia, small and medium sized enterprises (SMEs), and others, to accelerate medicines discovery and development. It has a total budget of over €5 billion between 2008 and 2024, provided jointly by European Commission research funding, and in-kind contribution from pharmaceutical companies, and more recently, other industrial sectors.
The ABPI undertook research this year to assess the patterns of collaboration in IMI, and this publication is available to read in full on our website (link below). The UK has received 28% of total IMI funding from the EU Commission, the largest amount of any country. This totals €302.8 million to date. Both UK academic institutions and SMEs receive thehighestlevelsofIMIfundingofanycountry;30%ofallfundingreceivedbyUKacademicinstitutionsand22%ofallfunding received by UK SMEs. The UK also has the highest number of participants in both academia and SMEs (each with21%ofparticipantsintheircategory),indicatingthatthehighproportionoffundingreceivedbytheUKisnotduetoattractingafewlargeprojects,butreflectshighlevelsofparticipationbyUKinstitutionsacrosstheIMI.
The UK has attracted funding in IMI projects across a wide range of research fields and therapeutic areas. The UK has leveraged particularly high proportions of funding in respiratory diseases, vaccine development, infectious diseases, and diabetes. Proportionally less-well funded areas include training, antimicrobial resistance andoncology.TosomeextentthisreflectsstrengthsoftheUK’sscientificbase.
SOURCE: 2016UKParticipationintheInnovative Medicines Initiative. http://www.abpi.org.uk/our-work/library/industry/Documents/UK_Participation_in_IMI.pdf
NOTES: IMI funding (from EU Commission) for top 10 country recipients, with all other participating countries collated in “other”. Data provided directly by EFPIA for all participating IMI countries.
SOURCE:2016UKParticipationintheInnovative Medicines Initiative. http://www.abpi.org.uk/our-work/library/industry/Documents/UK_Participation_in_IMI.pdf
NOTES: Proportion of IMI monies received by the UK split by research area. IMI projects were allocated a therapeutic/research area, and data were calculated using UK and total project data.
Total IMI funding per country
IMI funded UK research areas as a percentage of IMI total

SOURCE: Data provided by Clarivate Analytics
NOTES: Number of papers, normalised citationimpact,and%highlycitedpapers,produced by UK organisations and either co-authored by pharmaceutical companies (top) or acknowledging funding from pharmaceutical companies (bottom) between2006and2015.Onlythe10pharmaceutical companies with the highest number of collaborative papers are shown.
UK co-authored publications were selected by using Web of Science address data. Funding information comes from the Web of Science funding acknowledgement data. Someautomaticandmanualunificationwas done on organisation names.
Normalised citation impact: citation rates varybetweenresearchfieldsandwithtime,consequently, analyses must take both fieldandyearintoaccount.Inaddition,thetypeofpublicationwillinfluencethecitationcount. The standard normalisation factor is the world average citations per paper for the year and journal category in which the paper was published.
Highly cited papers: highly cited work is recognised as having a greater impact; the high citation rates are correlated with other qualitative evaluations of research performance, such as peer review. Papers thatareinthetop10%intermsofcitationfrequency, taking into account year of publicationandfield,areconsideredtobehighly cited.
6.8 Animportantwayofmappingscientificcollaborationsisthroughthestudyoftheirpublishedpapers.Wehaveworkedwith Clarivate Analytics this year to map the current collaboration patterns between the pharmaceutical industry and academia in the UK for the life sciences, using this important technique. The analysis that follows further illustrates the strength of academic-industry collaboration in the life sciences in the UK.
Thefollowingfiguresshowthatpharmaceuticalcompaniesco-authored over 16,000 papers with UK organisations between 2006 and 2015, and were acknowledged as providing funding for research on over 38,000 papers. These include companieswithlittleornoin-houseR&DfootprintintheUK,aswellasthosewithsignificantin-houseworkintheUK.
Both papers co-authored by pharmaceutical companies and those acknowledging company funding were on average more highly cited than the global average, suggesting they have a higher than average impact.
Pharmaceutical companies with highest number of co-authored UK papers, by number of papers and citation impact
Pharmaceutical companies with highest number of funded UK papers, by number of papers and citation impact

41
6.9 The table and map below show the location of pharmaceutical companies collaborating with UK organisations between 2011 and 2015, as indicated through co-authorship of publications. These show that UK organisations collaborate with pharmaceutical industry researchers located not only in the UK, but across the world, particularly in Europe, North America, and Asia. Only four of the top ten cities for industry location were based in theUK,withfiveofthetenintheUSA.
SOURCE: Data provided by Clarivate Analytics
NOTES: Proportion of publications (which includes papers, meeting abstracts, book reviews, editorial material, and other publications recorded in Web of Science) both co-authored and funded, co-authored, or funded, by the pharmaceutical companies collaborating on the highest number of publications with UKorganisations,2006-2015.
UK co-authored publications were selected by using Web of Science address data. Funding information comes from the Web of Science funding acknowledgement data. Someautomaticandmanualunificationwas done on organisation names.
Only the pharmaceutical companies with the highest number of collaborative papers are shown.
Top pharmaceutical collaborators of UK research split by type of collaborative activity
Top 10 cities for location of pharmaceutical companies collaborating with UK organisations
Rank City Country Number of publications
1 Basel Switzerland 1,575
2 Macclesfield UK 1,083
3 Stevenage UK 846
4 San Francisco USA 676
5 Indianapolis USA 662
6 Cambridge USA 627
7 Cambridge UK 606
8 Uxbridge UK 584
9 Res Triangle Pk USA 562
10 E Hanover USA 561
SOURCE: Data provided by Clarivate Analytics
NOTES: Top 10 most frequently occurring city names in the addresses of top 25 pharmaceutical companies - collaborators of UK research, between 2011 and 2015.

6.10 ThepharmaceuticalindustrycollaborateswithUKorganisationsonabroadrangeofresearchfields,echoing the strength shown above of the UK in attracting collaborative funding from the IMI across broad research topics (figure6.7).Themostcommoncollaborationsbetween2006and2015wereinpharmacology & pharmacy, oncology, neurosciences, and endocrinology & metabolism.
Collaborative research between the industry and UK organisations showed a higher than average citation impact across all research fields, but this was particularly high in oncology and rheumatology,whichmayreflectacademicstrengthoftheUKinthesefields.
SOURCE: Data provided by Clarivate Analytics
NOTES: Map of countries from addresses of the authors from top 25 pharmaceutical companies within the publications from collaboration with UK authors between 2011 and 2015. Countries with 10 or more publications are shown.
SOURCE: Data provided by Clarivate Analytics, NCI = Average normalised citation impact
NOTES: Number of publications produced by top 25 pharmaceutical companies in collaboration with UK research by biomedical research field.Thereare254WebofSciencejournal categories. Journals are assigned to one or more categories, and every article within that journal is subsequently assigned to that category. Papers from prestigious, ‘multidisciplinary’ and general medical journalsareassignedtospecificcategories based on the journal categories of the references cited in thearticle.36WebofSciencesubjectcategories were chosen to represent biomedicalresearchfieldandpublications within these categories were included in analysis.
Global locations of pharmaceutical companies collaborating with UK organisations
Research fields with highest number of collaborative publications between UK organisations and pharmaceutical industry
6.11 The pharmaceutical industry collaborates with a broad range of institutions in the UK, including universities, hospitals, and public research institutions. The graph below shows the number of papers, and average normalised citation impact, for UK organisations publishing more than 1000 collaborative papersbetween2006and2015.For each of these organisations, papers published in collaboration with industry were on average much more highly cited than the global average.
Universities published the highest number of papers in collaboration with industry, but on average hospitals and other public research institutes published a slightly higher proportion of highly cited papers.

43
SOURCE: Data provided by Clarivate Analytics
NOTES: Number of papers, normalised citation impact,and%highlycitedpapers,producedby UK organisations acknowledging funding from the pharmaceutical industry, for the top 25 pharmaceutical company collaboration funders, 2006-2015.OnlyUKorganisationswithmorethan 1000 papers published in this period are shown. See previous notes on citation impact and%highlycitedpapers.
SOURCE: Data provided by Clarivate Analytics
NOTES: Top 50 UK organisations by number of publications acknowledging funding from the pharmaceutical industry, for the top 25 pharmaceutical company collaboration funders, 2006-2015.Organisationswereallocatedasuniversities, hospitals, or other organisations (mostly charity or public research institutes). Seepreviousnoteson%highlycitedpapers.
UK organisations with highest number of collaborative papers with the pharmaceutical industry
Types of organisation in the top 50 UK organisations collaborating with the pharmaceutical industry
Number of collaborative papers and highly cited papers by organisation type

UniversitySpin-outs
VentureCapital
Seed Funds
HospitalsNIHR
Pharmacists
Industry
Academia
Collaborations
Business, Energy &
Industrial Strategy (BEIS)Department of
International Trade
SMEs
Biotech
Pharma
PublicMarkets
DoctorsNurses
Innovate UKCorporate
Venture Capital
Academic
Research
UNIVERSITIESRESEARCHCHARITIES
AGENCIES RESEARCHCOUNCILS
GOVERNMENT
INVESTORS NHS
Med Tech
Start-ups
MHRA
No. 10 No. 11
Parliament
LIFE SCIENCE
INDUSTRY
Patients
Office forLife Sciences
DH & Devolved
Nations
EMANICE
HRA
MRC BBSRCEPSRC
The Association of the British Pharmaceutical IndustryA company limited by guarantee registered inEngland&Wales(number09826787)
Registered office: 7th Floor, Southside,105 Victoria Street, LondonSW1E6QT
T +44 (0)20 7930 3477 [email protected]
RMI-0067-1216