open access research prediction of liver disease …prediction of liver disease in patients whose...
TRANSCRIPT

Prediction of liver disease in patientswhose liver function tests have beenchecked in primary care: modeldevelopment and validation usingpopulation-based observational cohorts
David J McLernon,1 Peter T Donnan,2 Frank M Sullivan,3 Paul Roderick,4
William M Rosenberg,5 Steve D Ryder,6 John F Dillon7
To cite: McLernon DJ,Donnan PT, Sullivan FM,et al. Prediction of liverdisease in patients whoseliver function tests have beenchecked in primary care:model development andvalidation using population-based observational cohorts.BMJ Open 2014;4:e004837.doi:10.1136/bmjopen-2014-004837
▸ Prepublication history andadditional material isavailable. To view please visitthe journal (http://dx.doi.org/10.1136/bmjopen-2014-004837).
Received 10 January 2014Revised 2 May 2014Accepted 13 May 2014
For numbered affiliations seeend of article.
Correspondence toDr David J McLernon;[email protected]
ABSTRACTObjective: To derive and validate a clinical predictionmodel to estimate the risk of liver disease diagnosisfollowing liver function tests (LFTs) and to convert themodel to a simplified scoring tool for use in primarycare.Design: Population-based observational cohort study ofpatients in Tayside Scotland identified as having theirLFTs performed in primary care and followed for 2 years.Biochemistry data were linked to secondary care,prescriptions and mortality data to ascertain baselinecharacteristics of the derivation cohort. A separatevalidation cohort was obtained from 19 general practicesacross the rest of Scotland to externally validate the finalmodel.Setting: Primary care, Tayside, Scotland.Participants: Derivation cohort: LFT results from310 511 patients. After exclusions (including: patientsunder 16 years, patients having initial LFTs measured insecondary care, bilirubin >35 μmol/L, liver complicationswithin 6 weeks and history of a liver condition), thederivation cohort contained 95 977 patients with noclinically apparent liver condition. Validation cohort: afterexclusions, this cohort contained 11 653 patients.Primary and secondary outcome measures:Diagnosis of a liver condition within 2 years.Results: From the derivation cohort (n=95 977), 481(0.5%) were diagnosed with a liver disease. The modelshowed good discrimination (C-statistic=0.78). Given thelow prevalence of liver disease, the negative predictivevalues were high. Positive predictive values were low butrose to 20–30% for high-risk patients.Conclusions: This study successfully developed andvalidated a clinical prediction model and subsequentscoring tool, the Algorithm for Liver FunctionInvestigations (ALFI), which can predict liver disease riskin patients with no clinically obvious liver disease whohad their initial LFTs taken in primary care. ALFI can helpgeneral practitioners focus referral on a small subset ofpatients with higher predicted risk while continuing toaddress modifiable liver disease risk factors in those atlower risk.
BACKGROUNDGeneral practitioners (GPs) commonlyrequest liver function tests (LFTs), but theresults rarely identify cases of liver disease.1
Abnormal LFTs can be indicators of manydifferent diseases besides those of the liver,such as metastatic malignancy, congestiveheart failure and inflammatory or infectiveconditions.2–5 It can therefore be difficult fora GP to identify a specific liver disease inpatients with abnormal LFTs, particularly inthose who do not have pathognomonic signsor symptoms. This leads to variation inapproaches to further investigation withsome patients being inadequately investi-gated and others at low risk of disease havinginvasive tests with attendant morbidity and
Strengths and limitations of this study
▪ Our study has successfully developed and vali-dated the first risk prediction model and subse-quent user-friendly scoring tool, the Algorithmfor Liver Function Investigations, for liver condi-tion diagnosis in patients with no obvious livercondition at the time of incident liver functiontesting in primary care.
▪ This model can be used to facilitate general prac-titioner decision-making about whom to refer tosecondary care.
▪ γ-Glutamyltransferase (GGT) was found to be apowerful predictor of liver disease, over andabove alkaline phosphatase and transaminase.Since some laboratories do not routinely test forGGT, its use should be re-evaluated.
▪ The observational data lacked some potentialpredictors of liver disease, for example, alcoholintake and body mass index. However, otheravailable predictors such as liver function testsand deprivation may act as surrogate markers forsuch factors.
McLernon DJ, Donnan PT, Sullivan FM, et al. BMJ Open 2014;4:e004837. doi:10.1136/bmjopen-2014-004837 1
Open Access Research
on July 5, 2020 by guest. Protected by copyright.
http://bmjopen.bm
j.com/
BM
J Open: first published as 10.1136/bm
jopen-2014-004837 on 2 June 2014. Dow
nloaded from

cost.6 The size of this problem is huge with 22% ofpatients having their initial panel of LFTs performed ingeneral practice with at least one abnormality in Tayside,Scotland.7 Referral of all these patients to secondarycare would place a large burden on healthcare systemresources, so guidance is needed to ensure that care isfocused on those most in need.The primary care management of these types of
patients might be facilitated through the use of a clinicalprediction model which estimates the risk of a specificoutcome adjusted for patient characteristics.8 Thesemodels, such as the Framingham cardiovascular diseaserisk score,9 and FRAX for osteoporotic fracture, areregularly used in primary care.10 It is important that clin-ical prediction models are assessed for their predictiveability, preferably on an external cohort.11
This population-based historical cohort study followedup two separate cohorts of patients living in Scotlandwith no clinically recognised liver disease who initiallyhad LFTs undertaken in primary care.12 The aims of thestudy were:1. To derive a clinical prediction model using a cohort
of patients from Tayside that would estimate the riskof a liver disease over the 2 years following LFTstaken in primary care;
2. To validate this model geographically and temporallyusing a different cohort of patients from 19 generalpractices in Scotland;
3. To convert this model into a user-friendly clinicalscoring tool that will allow the GP to easily calculatethe risk of liver disease diagnosis at 6 months and2 years.
METHODSSeparate populations were used to develop the prognos-tic model (derivation cohort) and then validate it (valid-ation cohort).
Derivation cohortThe study population was initially derived from a labora-tory database which contains all electronically availableLFT results from patients within Tayside during the15-year period from January 1989 to December 2003linked to hospital admission and GP prescribing data.12
LFTs included bilirubin, albumin, alkaline phosphatase(ALP), γ-glutamyltransferase (GGT), alanine transamin-ase and aspartate aminotransferase. Since many labora-tories only measure either alanine transaminase oraspartate aminotransferase, these two tests were com-bined as one test and are referred to as transaminasesthroughout.Patients aged 16 and above with no obvious or
reported clinical signs of a liver disease on presentationto their GP, and with at least two different LFTsrequested from the index appointment between 1989and 2003, were eligible for inclusion. The followingexclusion criteria ensured that the study population of
patients had no clinically recognised liver disease at pres-entation in primary care:▸ Bilirubin greater than 35 µmol/L at baseline, suggest-
ing jaundice.▸ Diagnosis of ascites, encephalopathy, varices or portal
hypertension within 6 weeks of their first LFTs.▸ History of any liver disease before baseline.
DatabasesThe databases relevant to this study are described brieflyin box 1 and in further detail elsewhere.12–18 InScotland, all individuals registered with a GP have aunique identifier, the Community Health Index(CHI).14 This number is used for all health encounters
Box 1 Databases record linked to create the Taysidederivation cohort
1. Death registry from the General Register Office for Scotlandincluding date and causes of death.
2. Deprivation score was assessed by the Carstairs method.13
The score was divided into two categories of affluent anddeprived.
3. Tayside Community Health Index (CHI) files: Contains CHInumber,14 name, address and date of birth for all individualsregistered with a general practitioner in Tayside. It also holdsmigration dates to and from Tayside. The database was pseu-donymised before release to the researcher.
4. Regional biochemistry database: All liver function tests (LFTs)came from the largest hospital laboratory in the Taysideregion, Ninewells. Two smaller hospital laboratories contribu-ted electronic LFT results later, one from 1998 and the otherfrom 2003.
5. Scottish Morbidity Records 1 (SMR01) database: Patient-spe-cific morbidity data are routinely collected in Scotland, and col-lectively these are known as SMR. SMR01 contains hospitaladmissions and procedures for all hospitals in Scotland and isone of the oldest and most complete national health datasets inthe world.15 Major comorbidity groups at baseline were identifiedusing this database, and the Diabetes Audit and ResearchTayside Scotland (DARTS) and Heart disease Evidence-basedAudit and Research Tayside Scotland (HEARTS) databases fordiabetes and chronic heart disease, respectively.16
6. SMR04 database: Holds all inpatient and day case episodesfor mental health specialties, which identified patients admit-ted/discharged with diagnoses of alcohol dependency or drugmisuse.
7. Pharmacist dispensed prescription database: A community-based database that holds encashed prescriptions in Tayside,17
and allowed identification of patients on some potentially hep-atotoxic drugs including statins, antibiotics and non-steroidalanti-infammatory drugs.
8. Epidemiology of Liver Disease In Tayside (ELDIT) database:Contains all Tayside patients with liver diseases who havebeen ‘electronically’ diagnosed using record linkage of bio-medical datasets, including virology and immunology.18
ELDIT was used for the study exclusion criteria (ie, previousliver disease, liver disease complications within 6 weeks) andfor the outcome of liver disease diagnosis during the 2-yearfollow-up period.
2 McLernon DJ, Donnan PT, Sullivan FM, et al. BMJ Open 2014;4:e004837. doi:10.1136/bmjopen-2014-004837
Open Access
on July 5, 2020 by guest. Protected by copyright.
http://bmjopen.bm
j.com/
BM
J Open: first published as 10.1136/bm
jopen-2014-004837 on 2 June 2014. Dow
nloaded from

and is contained within all of the databases used in thisstudy. Since it contains person identifiable information,the CHI was mapped to a project-specific pseudonymous10-digit code by the data protection officer at the HealthInformatics Centre, University of Dundee, before remov-ing the CHI and releasing the data to the researcher. Allof the electronic databases were electronicallyrecord-linked deterministically using this project-specificpseudonymous code.
Ethics statementWritten informed consent from patients was waived bythe Tayside Committee for Medical Research Ethicsbecause the databases were anonymised so that nopatient identifiable information was accessible. The data-bases used in this study (see box 1) covered the entirestudy period and were used in accordance with proce-dures approved under the Caldicott Guardian and theData Protection Act UK (1998), in line with theEuropean directive of 1995.
Baseline characteristicsAs well as the five analysed LFTs, baseline characteristicsincluded age, gender, deprivation,13 comorbidities(including cancer, diabetes, ischaemic heart disease(IHD), stroke, renal disease, respiratory disease andbiliary disease), diagnosed alcohol and drug dependency,methadone use, and the use of statins, non-steroidal anti-inflammatory drugs (NSAIDs) or antibiotics in the3 months before LFTs. Since patients with bilirubin>35 µmol/L were excluded, bilirubin was categorisedinto normal and mildly raised (<18 and 18–35 µmol/L,respectively, for male patients; <16 and 16–35 µmol/L,respectively, for female patients).
OutcomeThe primary outcome for this study was liver diseasediagnosis during the 2 years following the initial analysisof LFTs in primary care. Liver diseases were identifiedfrom the Epidemiology of Liver Disease in Tayside(ELDIT) database (box 1), described in further detailelsewhere.18 A detailed table of the liver diseasesincluded and their source database is presented inonline supplementary appendix 1.
Model derivationSurvival analysis was conducted using parametric regres-sion models to estimate the risk of liver disease within2 years. The starting point was taken as the date of theinitial LFT test and the endpoint for each patient waswhichever one of the following events came first: end offollow-up (ie, 2 years later), death, end of study period(ie, 31 December 2003), date of emigration or liverdisease diagnosed. All patients whose endpoint was notliver disease diagnosis were censored in the model.The Weibull regression model was used for model
building using potential predictors at baseline. Amanual stepwise technique was used to arrive at a model
that contained only significant predictive characteristics.The functional form of continuous characteristics (age,albumin, ALP, GGT and transaminase) was assessed byplotting each against the Martingale residuals and, sub-sequently, appropriate transformations were carried outwhere necessary. Clinically important two-way predictorinteractions were also investigated and were included inthe final model if they were statistically significant. Thesignificant predictors from the Weibull model were thenrefitted to different parametric model distributionsincluding the generalised γ, log-logistic, log-normal andexponential distributions to find the one that fittedbest.19 The Akaike’s information criterion (AIC) wasused to select the optimal model. Covariates which werejust outside the significance level for the Weibull modelwere also added to these other models to check whetherthey became significant. If they did, then they wereincluded in that model.The problem of missing data occurs in almost all retro-
spective studies using routine health databases. The sim-plest way of dealing with this is to use only cases withcomplete data in the analysis. However, this leads to theloss of potentially valuable information from the incom-plete cases (and hence loss of power), and introducesbias, especially if there are systematic differences betweenthe complete and incomplete cases. Therefore, the find-ings from an analysis using only the complete cases maynot be a true reflection on what would be found if all thecases were analysed. To analyse only the complete dataassumes that the missing data are missing completely atrandom (MCAR), which is unlikely.20 21 A weaker versionof the MCAR assumption is the missing at random(MAR) assumption. This differs from MCAR in that itassumes that the missing data are dependent on one ormore variables in the observed data.21 Assuming MAR, amultiple imputation technique using the Markov chainMonte Carlo method was conducted to impute missingvalues for the LFTs using PROC MI in SAS.22 Everymodel was fitted to 30 imputed datasets and the 30 sets ofparameter estimates and covariances were combined toproduce inferential results using PROC MIANALYZE. Allbaseline characteristics, time to liver disease (or censoredevent) and liver disease diagnosis outcome were includedin the procedure. The complete data were also analysedseparately as a sensitivity analysis.The integrated discrimination index (IDI) was used to
measure the improvement in the final model for eachindividual covariate.23 The IDI for a covariate is essen-tially the difference between the proportion of varianceexplained by the full model (ie, adjusted for all covari-ates) and the model without the covariate of interest.The sensitivity, specificity, positive predictive value (PPV)and negative predictive value (NPV) were also calculatedfor different risk cut-offs, accounting for censoring.23
Model validationA separate cohort of patients was obtained from thePrimary Care Clinical Informatics Unit (PCCIU),
McLernon DJ, Donnan PT, Sullivan FM, et al. BMJ Open 2014;4:e004837. doi:10.1136/bmjopen-2014-004837 3
Open Access
on July 5, 2020 by guest. Protected by copyright.
http://bmjopen.bm
j.com/
BM
J Open: first published as 10.1136/bm
jopen-2014-004837 on 2 June 2014. Dow
nloaded from

University of Aberdeen,24 and was used to externally val-idate the final model. The validation cohort containedall patients registered with 19 practices from acrossScotland excluding Tayside. The practices were partici-pating in the Practice Team Information project oper-ated by the Information Services Division of the NationalHealth Service National Services Scotland, and contribu-ted data to PCCIU. The patient population within thePCCIU database is broadly representative of the Scottishpopulation with respect to age, sex and social depriv-ation.25 The validation cohort contained patients havingtheir initial LFTs measured in primary care betweenJanuary 2004 and August 2008. All eligible patients hadto have test results for ALP, bilirubin, albumin and trans-aminase. All baseline characteristics and outcome dataobtained for the derivation cohort were also obtainedfor the validation cohort. The same exclusion criterialisted above were also applied to the validation cohort.The parameter estimates of the final model from the
derivation cohort were applied to the validation cohortto assess its predictive ability. The C-statistic was used asa measure of discrimination.26 Discrimination assessesthe model’s ability to correctly distinguish betweenpatients who develop liver disease (for whom the modelassigns a high risk) and do not develop liver disease (forwhom the model assigns a low risk). The model’s pre-dicted probabilities were assessed for accuracy using cali-bration plots.27 A calibration slope test was conducted totest for overfitting of the model and true differences inthe effects of predictors.27 This was done by fitting thelinear predictor of the final model in a model by itselfand testing its slope. A significant deviation from onesignifies overfitting. The sensitivity, specificity, PPV andNPV of the model were also calculated for the validationcohort. These assessments were calculated using the val-idation cohort with the average GGT values across the30 imputed datasets used for those patients who did nothave a GGT measurement.
Decision curve analysisDecision curve analysis was used to determine a range ofthreshold predicted probabilities of liver disease wherethe primary care decision to refer a patient to secondarycare would be better than assuming all patients aredisease free (ie, not referring anyone) and assuming thatall patients have liver disease (ie, referring everyone).28
The method involves plotting the net benefit of themodel against the threshold probability. The net benefitis defined as the difference between the proportion ofpatients who are true positive and false positive weightedby the relative harm of a false-positive and false-negativeresult. The net benefit of the model is then comparedwith the scenario where everyone is assumed to bedisease free and therefore not referred (net benefitequals zero) and to the scenario where everyone isassumed to be disease positive and therefore referred.Threshold probabilities that have a higher net benefitthan both of these scenarios means that, for these
thresholds, the model is better than referring no one andreferring everyone. The analysis was conducted using thevalidation cohort and the predicted probabilities at themaximum follow-up time of 2 years were used.
Clinical scoring toolA point-based scoring tool was created from a simplerversion of the final model for potential use in primarycare.29 Continuous predictors from the model weredichotomised into clinically and statistically sensible cat-egories to create the tool. Mid-points of the categorieswere used to estimate the risk of liver disease for eachcategory. The tool estimated short-term risk at 6 monthsfollow-up and longer term risk at 2 years follow-up.Model development and validation were performed
using SAS (V.9.3) (SAS Institute, Cary, North Carolina,USA) and the decision curve analysis was performedusing the stdca() function in R V.3.0.1.30–32
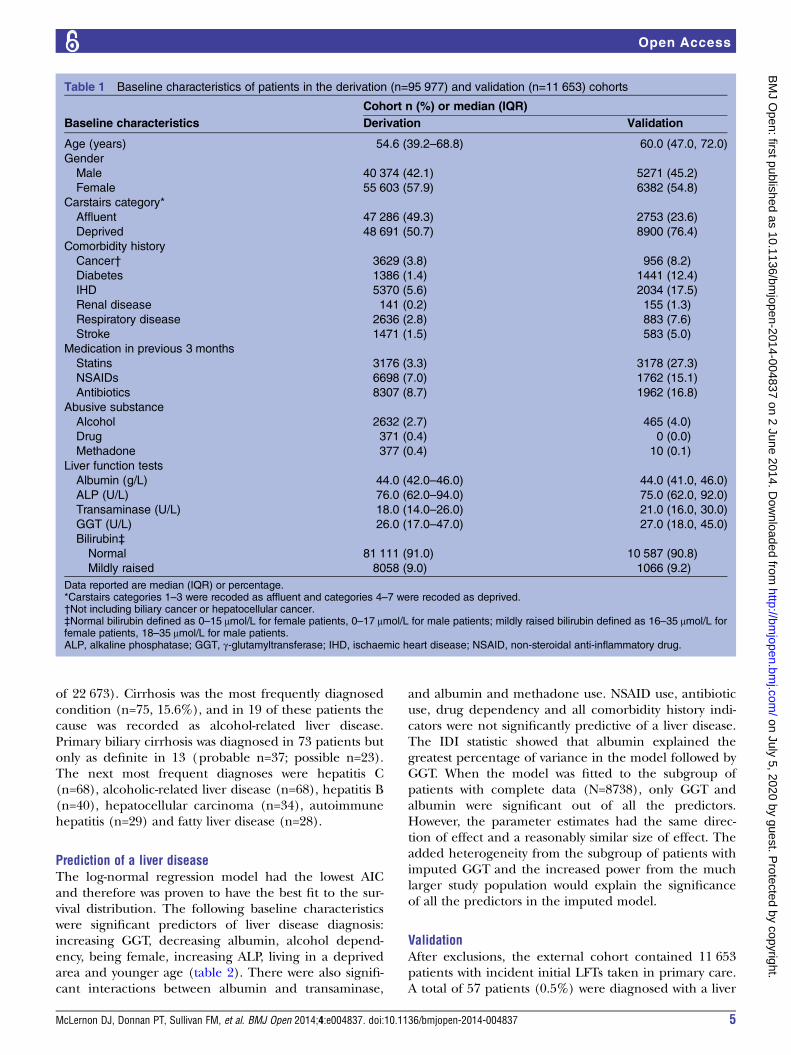
RESULTSBaseline characteristicsBefore applying the exclusion criteria, LFTs wereextracted for 310 511 patients. After excluding patientsunder 16 years of age, non-Tayside residents and thosewhose initial LFTs were measured in secondary care,99 165 patients remained. After excluding those with clin-ically recognised liver disease at baseline, the derivationcohort contained 95 977 patients with incident initialLFTs taken in primary care and with no obvious liverdisease. There were more female patients (57.9%) thanmale patients (42.1%), and the median (IQR) age was54.6 (39.2–68.8) years (table 1). The most frequentcomorbidity was IHD (5.6%), followed by cancer (3.8%).Only 8388 (8.7%) patients had all five LFTs. The per-
centage of complete data for each LFT was as follows:ALP (99.2%), albumin (99.2%), bilirubin (93.6%), trans-aminases (76.5%) and GGT (10.9%). There were moremale patients with complete data (ie, having all fiveLFTs) than female patients (54.6% vs 45.4%) comparedwith the incomplete data group (40.9% vs 59.1%). Thegroup with complete data was also more deprived andcontained more alcohol-dependent patients than theincomplete data group (see online supplementaryappendix 2). When those without GGT measurementswere compared with those with GGT measurements, theresults were similar to the above since those without GGTmeasurements comprised the majority of the incompletedata group. The group of patients without transaminasemeasurements contained a higher proportion of femalepatients (63.5% vs 36.5%) than the group with transamin-ase measurements (56.2% vs 43.8%) and had a highermedian ALP result (86 vs 73 U/L).
Liver disease diagnosisA total of 481 patients (0.5%) were diagnosed with aliver disease during the 2-year follow-up period. Ofthese, 339 (70.5%) had at least one abnormal LFT (out
4 McLernon DJ, Donnan PT, Sullivan FM, et al. BMJ Open 2014;4:e004837. doi:10.1136/bmjopen-2014-004837
Open Access
on July 5, 2020 by guest. Protected by copyright.
http://bmjopen.bm
j.com/
BM
J Open: first published as 10.1136/bm
jopen-2014-004837 on 2 June 2014. Dow
nloaded from
of 22 673). Cirrhosis was the most frequently diagnosedcondition (n=75, 15.6%), and in 19 of these patients thecause was recorded as alcohol-related liver disease.Primary biliary cirrhosis was diagnosed in 73 patients butonly as definite in 13 (probable n=37; possible n=23).The next most frequent diagnoses were hepatitis C(n=68), alcoholic-related liver disease (n=68), hepatitis B(n=40), hepatocellular carcinoma (n=34), autoimmunehepatitis (n=29) and fatty liver disease (n=28).
Prediction of a liver diseaseThe log-normal regression model had the lowest AICand therefore was proven to have the best fit to the sur-vival distribution. The following baseline characteristicswere significant predictors of liver disease diagnosis:increasing GGT, decreasing albumin, alcohol depend-ency, being female, increasing ALP, living in a deprivedarea and younger age (table 2). There were also signifi-cant interactions between albumin and transaminase,
and albumin and methadone use. NSAID use, antibioticuse, drug dependency and all comorbidity history indi-cators were not significantly predictive of a liver disease.The IDI statistic showed that albumin explained thegreatest percentage of variance in the model followed byGGT. When the model was fitted to the subgroup ofpatients with complete data (N=8738), only GGT andalbumin were significant out of all the predictors.However, the parameter estimates had the same direc-tion of effect and a reasonably similar size of effect. Theadded heterogeneity from the subgroup of patients withimputed GGT and the increased power from the muchlarger study population would explain the significanceof all the predictors in the imputed model.
ValidationAfter exclusions, the external cohort contained 11 653patients with incident initial LFTs taken in primary care.A total of 57 patients (0.5%) were diagnosed with a liver
Table 1 Baseline characteristics of patients in the derivation (n=95 977) and validation (n=11 653) cohorts
Baseline characteristics
Cohort n (%) or median (IQR)
Derivation Validation
Age (years) 54.6 (39.2–68.8) 60.0 (47.0, 72.0)
Gender
Male 40 374 (42.1) 5271 (45.2)
Female 55 603 (57.9) 6382 (54.8)
Carstairs category*
Affluent 47 286 (49.3) 2753 (23.6)
Deprived 48 691 (50.7) 8900 (76.4)
Comorbidity history
Cancer† 3629 (3.8) 956 (8.2)
Diabetes 1386 (1.4) 1441 (12.4)
IHD 5370 (5.6) 2034 (17.5)
Renal disease 141 (0.2) 155 (1.3)
Respiratory disease 2636 (2.8) 883 (7.6)
Stroke 1471 (1.5) 583 (5.0)
Medication in previous 3 months
Statins 3176 (3.3) 3178 (27.3)
NSAIDs 6698 (7.0) 1762 (15.1)
Antibiotics 8307 (8.7) 1962 (16.8)
Abusive substance
Alcohol 2632 (2.7) 465 (4.0)
Drug 371 (0.4) 0 (0.0)
Methadone 377 (0.4) 10 (0.1)
Liver function tests
Albumin (g/L) 44.0 (42.0–46.0) 44.0 (41.0, 46.0)
ALP (U/L) 76.0 (62.0–94.0) 75.0 (62.0, 92.0)
Transaminase (U/L) 18.0 (14.0–26.0) 21.0 (16.0, 30.0)
GGT (U/L) 26.0 (17.0–47.0) 27.0 (18.0, 45.0)
Bilirubin‡
Normal 81 111 (91.0) 10 587 (90.8)
Mildly raised 8058 (9.0) 1066 (9.2)
Data reported are median (IQR) or percentage.*Carstairs categories 1–3 were recoded as affluent and categories 4–7 were recoded as deprived.†Not including biliary cancer or hepatocellular cancer.‡Normal bilirubin defined as 0–15 μmol/L for female patients, 0–17 μmol/L for male patients; mildly raised bilirubin defined as 16–35 μmol/L forfemale patients, 18–35 μmol/L for male patients.ALP, alkaline phosphatase; GGT, γ-glutamyltransferase; IHD, ischaemic heart disease; NSAID, non-steroidal anti-inflammatory drug.
McLernon DJ, Donnan PT, Sullivan FM, et al. BMJ Open 2014;4:e004837. doi:10.1136/bmjopen-2014-004837 5
Open Access
on July 5, 2020 by guest. Protected by copyright.
http://bmjopen.bm
j.com/
BM
J Open: first published as 10.1136/bm
jopen-2014-004837 on 2 June 2014. Dow
nloaded from
disease within 2 years. The proportion of male andfemale patients was reasonably similar to the derivationcohort (45.2% vs 42.1% male patients), but the externalcohort was older, more deprived and had a greater pro-portion of comorbidities and medications (table 1).However, the median LFTs were similar between the twocohorts. GGT was missing for 4178 (35.9%) patients andwas imputed using the same method as for the deriv-ation cohort. The average GGT measure for eachpatient from the 30 imputed datasets was used wherethe original measure was missing so that the validationcould be performed in one dataset.The C-statistic for the final model parameter estimates
applied to the external cohort was 0.78 (95% CI 0.72 to0.84). The calibration plot (see online supplementaryappendix 3) showed some visible evidence of overfittingfor the highest risk group; however, the calibration slopeshowed no significant deviation from one (slope=0.871(95% CI 0.696 to 1.047); p=0.15).The sensitivity, specificity, PPV and NPV for different
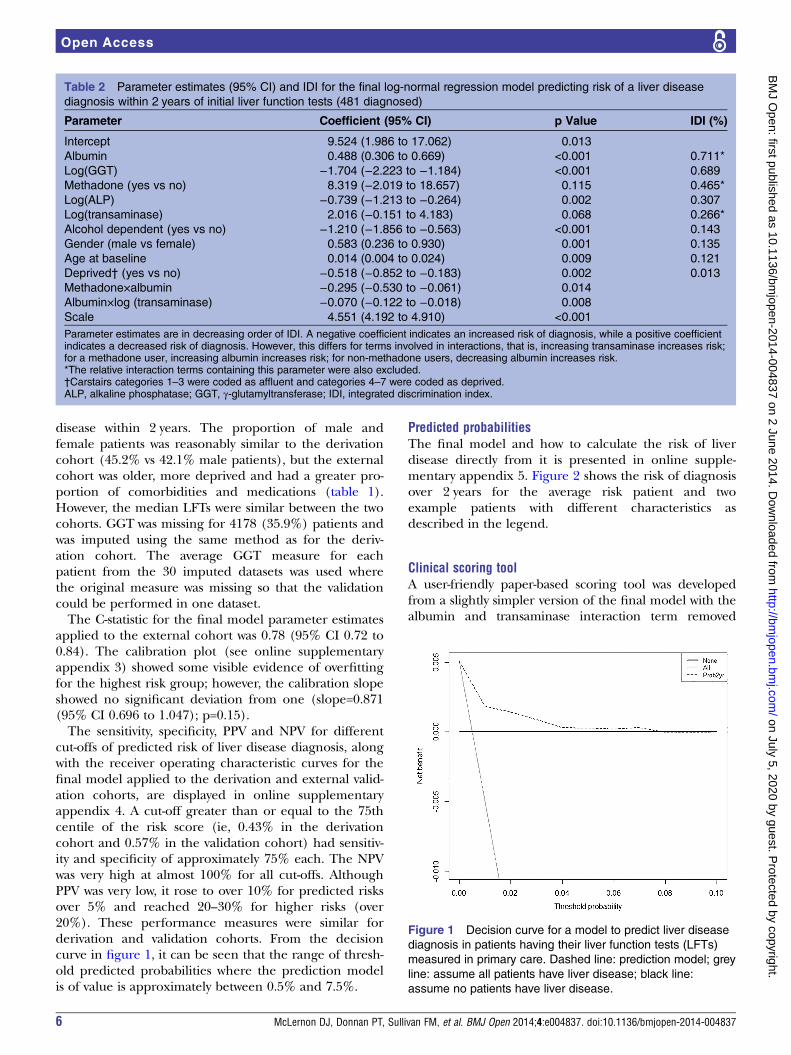
cut-offs of predicted risk of liver disease diagnosis, alongwith the receiver operating characteristic curves for thefinal model applied to the derivation and external valid-ation cohorts, are displayed in online supplementaryappendix 4. A cut-off greater than or equal to the 75thcentile of the risk score (ie, 0.43% in the derivationcohort and 0.57% in the validation cohort) had sensitiv-ity and specificity of approximately 75% each. The NPVwas very high at almost 100% for all cut-offs. AlthoughPPV was very low, it rose to over 10% for predicted risksover 5% and reached 20–30% for higher risks (over20%). These performance measures were similar forderivation and validation cohorts. From the decisioncurve in figure 1, it can be seen that the range of thresh-old predicted probabilities where the prediction modelis of value is approximately between 0.5% and 7.5%.
Predicted probabilitiesThe final model and how to calculate the risk of liverdisease directly from it is presented in online supple-mentary appendix 5. Figure 2 shows the risk of diagnosisover 2 years for the average risk patient and twoexample patients with different characteristics asdescribed in the legend.
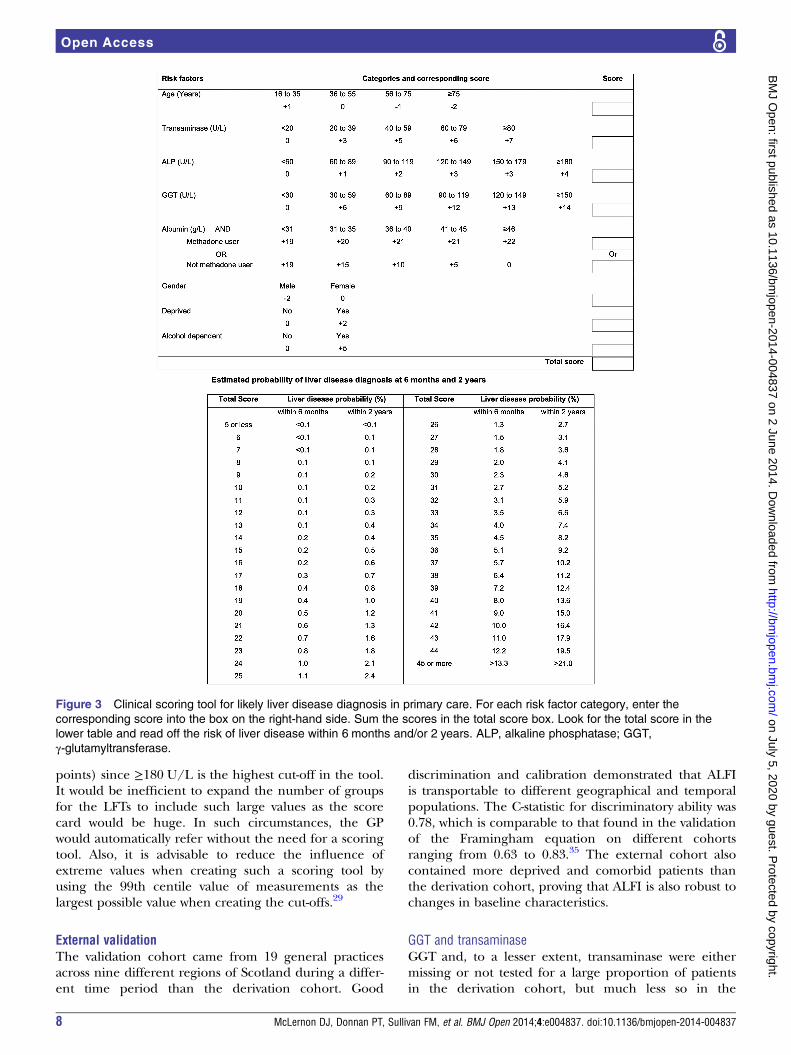
Clinical scoring toolA user-friendly paper-based scoring tool was developedfrom a slightly simpler version of the final model with thealbumin and transaminase interaction term removed
Table 2 Parameter estimates (95% CI) and IDI for the final log-normal regression model predicting risk of a liver disease
diagnosis within 2 years of initial liver function tests (481 diagnosed)
Parameter Coefficient (95% CI) p Value IDI (%)
Intercept 9.524 (1.986 to 17.062) 0.013
Albumin 0.488 (0.306 to 0.669) <0.001 0.711*
Log(GGT) −1.704 (−2.223 to −1.184) <0.001 0.689
Methadone (yes vs no) 8.319 (−2.019 to 18.657) 0.115 0.465*
Log(ALP) −0.739 (−1.213 to −0.264) 0.002 0.307
Log(transaminase) 2.016 (−0.151 to 4.183) 0.068 0.266*
Alcohol dependent (yes vs no) −1.210 (−1.856 to −0.563) <0.001 0.143
Gender (male vs female) 0.583 (0.236 to 0.930) 0.001 0.135
Age at baseline 0.014 (0.004 to 0.024) 0.009 0.121
Deprived† (yes vs no) −0.518 (−0.852 to −0.183) 0.002 0.013
Methadone×albumin −0.295 (−0.530 to −0.061) 0.014
Albumin×log (transaminase) −0.070 (−0.122 to −0.018) 0.008
Scale 4.551 (4.192 to 4.910) <0.001
Parameter estimates are in decreasing order of IDI. A negative coefficient indicates an increased risk of diagnosis, while a positive coefficientindicates a decreased risk of diagnosis. However, this differs for terms involved in interactions, that is, increasing transaminase increases risk;for a methadone user, increasing albumin increases risk; for non-methadone users, decreasing albumin increases risk.*The relative interaction terms containing this parameter were also excluded.†Carstairs categories 1–3 were coded as affluent and categories 4–7 were coded as deprived.ALP, alkaline phosphatase; GGT, γ-glutamyltransferase; IDI, integrated discrimination index.
Figure 1 Decision curve for a model to predict liver disease
diagnosis in patients having their liver function tests (LFTs)
measured in primary care. Dashed line: prediction model; grey
line: assume all patients have liver disease; black line:
assume no patients have liver disease.
6 McLernon DJ, Donnan PT, Sullivan FM, et al. BMJ Open 2014;4:e004837. doi:10.1136/bmjopen-2014-004837
Open Access
on July 5, 2020 by guest. Protected by copyright.
http://bmjopen.bm
j.com/
BM
J Open: first published as 10.1136/bm
jopen-2014-004837 on 2 June 2014. Dow
nloaded from
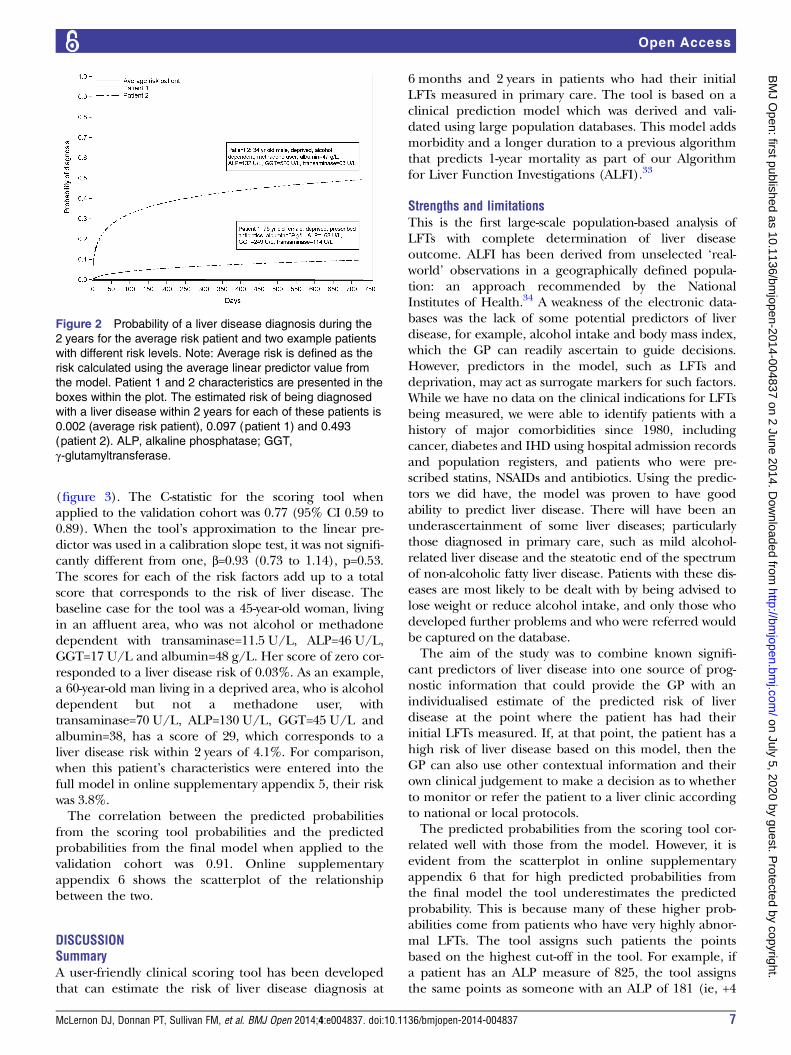
(figure 3). The C-statistic for the scoring tool whenapplied to the validation cohort was 0.77 (95% CI 0.59 to0.89). When the tool’s approximation to the linear pre-dictor was used in a calibration slope test, it was not signifi-cantly different from one, β=0.93 (0.73 to 1.14), p=0.53.The scores for each of the risk factors add up to a totalscore that corresponds to the risk of liver disease. Thebaseline case for the tool was a 45-year-old woman, livingin an affluent area, who was not alcohol or methadonedependent with transaminase=11.5 U/L, ALP=46 U/L,GGT=17 U/L and albumin=48 g/L. Her score of zero cor-responded to a liver disease risk of 0.03%. As an example,a 60-year-old man living in a deprived area, who is alcoholdependent but not a methadone user, withtransaminase=70 U/L, ALP=130 U/L, GGT=45 U/L andalbumin=38, has a score of 29, which corresponds to aliver disease risk within 2 years of 4.1%. For comparison,when this patient’s characteristics were entered into thefull model in online supplementary appendix 5, their riskwas 3.8%.The correlation between the predicted probabilities
from the scoring tool probabilities and the predictedprobabilities from the final model when applied to thevalidation cohort was 0.91. Online supplementaryappendix 6 shows the scatterplot of the relationshipbetween the two.
DISCUSSIONSummaryA user-friendly clinical scoring tool has been developedthat can estimate the risk of liver disease diagnosis at
6 months and 2 years in patients who had their initialLFTs measured in primary care. The tool is based on aclinical prediction model which was derived and vali-dated using large population databases. This model addsmorbidity and a longer duration to a previous algorithmthat predicts 1-year mortality as part of our Algorithmfor Liver Function Investigations (ALFI).33
Strengths and limitationsThis is the first large-scale population-based analysis ofLFTs with complete determination of liver diseaseoutcome. ALFI has been derived from unselected ‘real-world’ observations in a geographically defined popula-tion: an approach recommended by the NationalInstitutes of Health.34 A weakness of the electronic data-bases was the lack of some potential predictors of liverdisease, for example, alcohol intake and body mass index,which the GP can readily ascertain to guide decisions.However, predictors in the model, such as LFTs anddeprivation, may act as surrogate markers for such factors.While we have no data on the clinical indications for LFTsbeing measured, we were able to identify patients with ahistory of major comorbidities since 1980, includingcancer, diabetes and IHD using hospital admission recordsand population registers, and patients who were pre-scribed statins, NSAIDs and antibiotics. Using the predic-tors we did have, the model was proven to have goodability to predict liver disease. There will have been anunderascertainment of some liver diseases; particularlythose diagnosed in primary care, such as mild alcohol-related liver disease and the steatotic end of the spectrumof non-alcoholic fatty liver disease. Patients with these dis-eases are most likely to be dealt with by being advised tolose weight or reduce alcohol intake, and only those whodeveloped further problems and who were referred wouldbe captured on the database.The aim of the study was to combine known signifi-
cant predictors of liver disease into one source of prog-nostic information that could provide the GP with anindividualised estimate of the predicted risk of liverdisease at the point where the patient has had theirinitial LFTs measured. If, at that point, the patient has ahigh risk of liver disease based on this model, then theGP can also use other contextual information and theirown clinical judgement to make a decision as to whetherto monitor or refer the patient to a liver clinic accordingto national or local protocols.The predicted probabilities from the scoring tool cor-
related well with those from the model. However, it isevident from the scatterplot in online supplementaryappendix 6 that for high predicted probabilities fromthe final model the tool underestimates the predictedprobability. This is because many of these higher prob-abilities come from patients who have very highly abnor-mal LFTs. The tool assigns such patients the pointsbased on the highest cut-off in the tool. For example, ifa patient has an ALP measure of 825, the tool assignsthe same points as someone with an ALP of 181 (ie, +4
Figure 2 Probability of a liver disease diagnosis during the
2 years for the average risk patient and two example patients
with different risk levels. Note: Average risk is defined as the
risk calculated using the average linear predictor value from
the model. Patient 1 and 2 characteristics are presented in the
boxes within the plot. The estimated risk of being diagnosed
with a liver disease within 2 years for each of these patients is
0.002 (average risk patient), 0.097 (patient 1) and 0.493
(patient 2). ALP, alkaline phosphatase; GGT,
γ-glutamyltransferase.
McLernon DJ, Donnan PT, Sullivan FM, et al. BMJ Open 2014;4:e004837. doi:10.1136/bmjopen-2014-004837 7
Open Access
on July 5, 2020 by guest. Protected by copyright.
http://bmjopen.bm
j.com/
BM
J Open: first published as 10.1136/bm
jopen-2014-004837 on 2 June 2014. Dow
nloaded from
points) since ≥180 U/L is the highest cut-off in the tool.It would be inefficient to expand the number of groupsfor the LFTs to include such large values as the scorecard would be huge. In such circumstances, the GPwould automatically refer without the need for a scoringtool. Also, it is advisable to reduce the influence ofextreme values when creating such a scoring tool byusing the 99th centile value of measurements as thelargest possible value when creating the cut-offs.29
External validationThe validation cohort came from 19 general practicesacross nine different regions of Scotland during a differ-ent time period than the derivation cohort. Good
discrimination and calibration demonstrated that ALFIis transportable to different geographical and temporalpopulations. The C-statistic for discriminatory ability was0.78, which is comparable to that found in the validationof the Framingham equation on different cohortsranging from 0.63 to 0.83.35 The external cohort alsocontained more deprived and comorbid patients thanthe derivation cohort, proving that ALFI is also robust tochanges in baseline characteristics.
GGT and transaminaseGGT and, to a lesser extent, transaminase were eithermissing or not tested for a large proportion of patientsin the derivation cohort, but much less so in the
Figure 3 Clinical scoring tool for likely liver disease diagnosis in primary care. For each risk factor category, enter the
corresponding score into the box on the right-hand side. Sum the scores in the total score box. Look for the total score in the
lower table and read off the risk of liver disease within 6 months and/or 2 years. ALP, alkaline phosphatase; GGT,
γ-glutamyltransferase.
8 McLernon DJ, Donnan PT, Sullivan FM, et al. BMJ Open 2014;4:e004837. doi:10.1136/bmjopen-2014-004837
Open Access
on July 5, 2020 by guest. Protected by copyright.
http://bmjopen.bm
j.com/
BM
J Open: first published as 10.1136/bm
jopen-2014-004837 on 2 June 2014. Dow
nloaded from

validation cohort. From the database, it was not possibleto determine the exact reason for the non-presence ofthese two LFTs. However, in Tayside, the laboratories donot routinely include GGT with the other four LFTresults unless specifically requested by the primary carephysician. The demographics of the patients with com-plete data (ie, males, illicit drug users, alcohol depen-dants and patients living in deprived areas) suggestedthat some primary care physicians may have requestedGGT where they suspected substance abuse.7 Testingbone biochemistry may explain the reason for trans-aminase not being measured, since this group containeda higher proportion of female patients who are moresusceptible to bone disease, such as osteoporosis, andhad a higher median ALP, which is a marker for bonedisease. Furthermore, one of the hospitals in Taysideanalysed transaminase using a separate analyser forseveral years throughout the study and did not keepelectronic copies, which may also explain some of themissing values. Therefore it was assumed that themissing/untested LFT data depended on variables inthe observed data, the assumption required for multipleimputation,22 and that the appropriate guidelines forhandling this problem were followed.36
Implications for practice and researchAt a cut-off of 0.6% (the 75th centile) for liver diseaserisk, sensitivity and specificity were similar with values of73.7% and 75.3% in the validation cohort. However, thePPV for low cut-offs such as this was poor. The specificityat a cut-off of 1.2% risk is greater than 90% and rises to100% at the 10% cut-off. The NPV of the model is veryhigh even for reasonably small cut-offs of risk, meaningthat the model is good at ruling out risk of liver diseasewithin 2 years. However, this is not surprising, given thelow prevalence of liver disease in the sample of 0.5%.37
The PPV was low since liver disease diagnosis was rela-tively rare, but it rose to over 10% for predicted risks ofover 5% and in a small minority of patients with higherpredicted risk reached 20–30% with the NPV remainingvery high. Therefore, ALFI may be most accurate athigher predicted risk cut-offs with reasonable PPVs. Aswell as displaying reasonable accuracy, it is also import-ant to show that the model has the potential to improvedecision-making.The decision curve analysis showed that the model was
of value for threshold probabilities between 0.5% and7.5%. To determine whether the model is of clinicalvalue, we should consider the possible range of thresh-old probabilities of liver disease at which GPs woulddecide to refer the patient to secondary care. The deci-sion to refer is not a particularly risky intervention forthe patient. Initially, it will lead to further blood testsand possible ultrasound in secondary care. Theoutcome of these results will determine whether thepatient requires a liver biopsy which has some riskattached to it. However, if the patient gets to that stage,then the clinician must have a high suspicion of liver
disease, meaning that the decision to refer was correct.If the GP does not refer and the patient does have ordevelop liver disease, then the risk to the patient (ie, ofbeing a false negative) depends on the type and stage ofthe disease. Therefore, the GP may think that the inter-vention of referral is much less risky than not referringand decide that a probability threshold of, say, 5% isenough to refer. For thresholds between 5% and 7.5%,the model is also reasonably accurate. Therefore, ALFIcould help GPs focus referral on a small subset ofpatients with higher predicted risk and reasonable PPVswhile taking clinical factors that were not included inthe model (but which may have improved prediction)into account. However, where the risk is lower, the longtime frame of the development of many liver diseasesmeans that GPs can continue to address modifiable liverdisease risk factors (eg, alcohol misuse).The next step is to evaluate ALFI as a complex inter-
vention while taking into account the cost associatedwith referral of false positives.38
GGT should be considered just as important as otherLFTs in the prediction of liver disease since onlyalbumin explained more variation in the model. Properuse of ALFI in practice will depend on GGT being aroutine part of the LFT panel. Local health economieswill have to decide whether the additional cost of anextra test in the panel is worth it in terms of GGT’svalue in improving the ability to predict those patientswho are at high (or low) risk and, subsequently, changereferral practice. Before such decisions are made,further research is necessary involving cost-effectivenessanalysis.
CONCLUSIONSIn summary, this study has developed and externally vali-dated the ALFI model for prediction of liver diseasediagnosis in patients with no clinically obvious liverdisease having their LFTs taken within primary care.From this model, a simple scoring tool was developed tofacilitate GP decision-making with regard to retesting orreferring their patients. GP decisions regarding referralof patients to secondary care should be based on prob-ability thresholds where benefits outweigh harm.39 ALFIrequires further evaluation as a complex intervention,but it has the potential to save health service costs andprevent unnecessary further investigations andtreatments.
Author affiliations1Medical Statistics Team, Division of Applied Health Sciences, College of LifeSciences and Medicine, University of Aberdeen, Aberdeen, UK2Dundee Epidemiology and Biostatistics Unit, Division of Population HealthSciences, Medical Research Institute, University of Dundee, Dundee, UK3Department of Community and Family Medicine, University of Toronto,Toronto, Canada4Academic Unit of Primary Care and Population Sciences, Faculty of Medicine,University of Southampton, Southampton, UK5Centre for Hepatology, Division of Medicine and ULCH-UCL NIHR BiomedicalResearch Centre, University College London, London, UK
McLernon DJ, Donnan PT, Sullivan FM, et al. BMJ Open 2014;4:e004837. doi:10.1136/bmjopen-2014-004837 9
Open Access
on July 5, 2020 by guest. Protected by copyright.
http://bmjopen.bm
j.com/
BM
J Open: first published as 10.1136/bm
jopen-2014-004837 on 2 June 2014. Dow
nloaded from

6Department of Gastroenterology, Nottingham University Hospitals NHS Trustand Biomedical Research Unit, Nottingham, UK7Medical Research Institute, University of Dundee, Dundee, UK
Acknowledgements The authors wish to thank Alison Bell from HIC forextracting and pseudonymising all the datasets used. They thank Primary CareClinical Informatics Unit (PCCIU) at the University of Aberdeen for providingthe Practice Team Initiative cohort for external validation of the model.
Contributors DJM contributed to the design of the study, conducted theanalyses, drafted and finished the paper. JFD, FMS, PR, WMR and SDRcontributed to the design and conduct of the study, and the writing of thepaper. PTD contributed to and oversaw the design and conduct of the study,as well as contributing to the writing of the paper. He is the guarantor for thepaper. All authors read and approved the final manuscript.
Funding This work was supported by the UK National Health ServiceResearch & Development Programme Health Technology AssessmentProgramme (project number 03/38/02) and also by the Backett Weir RussellCareer Development Fellowship, University of Aberdeen.
Competing interests None.
Ethics approval Ethical approval was obtained from the Tayside Committeefor Medical Research Ethics in February 2005 (Ref No. 04/S1401/199).
Provenance and peer review Not commissioned; externally peer reviewed.
Data sharing statement No additional data are available.
Open Access This is an Open Access article distributed in accordance withthe terms of the Creative Commons Attribution (CC BY 3.0) license, whichpermits others to distribute, remix, adapt and build upon this work, forcommercial use, provided the original work is properly cited. See: http://creativecommons.org/licenses/by/3.0/
REFERENCES1. Pratt DS, Kaplan MM. Evaluation of abnormal liver-enzyme results in
asymptomatic patients. N Engl J Med 2000;342:1266–71.2. Schalk BW, Visser M, Bremmer MA, et al. Change of serum albumin
and risk of cardiovascular disease and all-cause mortality: LongitudinalAging Study Amsterdam. Am J Epidemiol 2006;164:969–77.
3. Sorensen HT, Moller-Petersen JF, Felding P, et al. Epidemiology ofabnormal liver function tests in general practice in a definedpopulation in Denmark. Dan Med Bull 1991;38:420–2.
4. Kim HC, Nam CM, Jee SH, et al. Normal serum aminotransferaseconcentration and risk of mortality from liver diseases: prospectivecohort study. BMJ 2004;328:983–6.
5. Roderick P. Commentary: liver function tests: defining what’s normal.BMJ 2004;328:987.
6. Sherwood P, Lyburn I, Brown S, et al. How are abnormal results forliver function tests dealt with in primary care? Audit of yield andimpact. BMJ 2001;322:276–8.
7. McLernon DJ, Donnan PT, Ryder S, et al. Health outcomes followingliver function testing in primary care: a retrospective cohort study.Fam Pract 2009;26:251–9.
8. Moons K, Royston P, Vergouwe Y, et al. Prognosis and prognosticresearch: what, why, and how? BMJ 2009;338:b375.
9. Fornasini M, Brotons C, Sellarès J, et al. Consequences of usingdifferent methods to assess cardiovascular risk in primary care. FamPract 2006;23:28–33.
10. Siris ES, Baim S, Nattiv A. Primary care use of FRAX: absolutefracture risk assessment in postmenopausal women and older men.Postgrad Med 2010;122:82–90.
11. Altman DG, Vergouwe Y, Royston P, et al. Prognosis and prognosticresearch: validating a prognostic model. BMJ 2009;338:b605.
12. Donnan PT, McLernon D, Dillon JF, et al. Development of a decisionsupport tool for primary care management of patients with abnormalliver function tests without clinically apparent liver disease: arecord-linkage population cohort study and decision analysis(ALFIE). Health Technol Assess 2009;13:iii–iv, ix–xi, 1–134.
13. Carstairs V, Morris R. Deprivation and mortality: an alternative tosocial class? Community Med 1989;11:210–19.
14. Evans JM, MacDonald TM. Record-linkage for pharmacovigilance inScotland. Br J Clin Pharmacol 1999;47:105–10.
15. NHS National Services Scotland. SMR01—General/Acute Inpatientand Day Case. http://www.datadictionary.scot.nhs.uk/isddd/9065.html
16. Morris AD, Boyle DI, MacAlpine R, et al. The diabetes audit andresearch in Tayside Scotland (darts) study: electronic record linkageto create a diabetes register. BMJ 1997;15:524–8.
17. Donnan PT, Wei L, Steinke DT, et al. Presence of bacteriuria causedby trimethoprium resistant bacteria in patients prescribed antibiotics:multilevel model with practice and individual patient data. BMJ2004;328:1297–301.
18. Steinke DT, Weston TL, Morris AD, et al. The epidemiology of liverdisease in Tayside database: a population-based record-linkagestudy. J Biomed Inform 2003;35:186–93.
19. Collett D. Modelling survival data in medical research. 2nd edn.Boca Raton: Chapman & Hall/CRC, 2003.
20. Rubin DB. Inference and missing data. Biometrika 1976;63:581–92.21. Rubin DB. Multiple imputation for nonresponse in surveys.
New York: Wiley, 1987.22. Yuan YC. Multiple imputation for missing data: concepts and new
development. SUGI Proceedings, 2000 Rockville, MD: SAS InstituteInc. http://support.sas.com/rnd/app/papers/multipleimputation.pdf
23. Chambless LE, Cummiskey CP, Cui G. Several methods to assessimprovement in risk prediction models: extension to survivalanalysis. Stat Med 2011;30:22–38.
24. University of Aberdeen. Primary Care Clinical Informatics Unit. http://www.abdn.ac.uk/pcciu/index.htm
25. Information Services Division Scotland. General practice—PracticeTeam Information (PTI). http://www.isdscotland.org/isd/1283.html#Background_to_PTI
26. Pencina MJ, D’Agostino RB. Overall C as a measure ofdiscrimination in survival analysis: model specific populationvalue and confidence interval estimation. Stat Med2004;23:2109–23.
27. Steyerberg EW. Clinical prediction models: a practical approach todevelopment, validation, and updating. New York: Springer, 2009.
28. Vickers AJ, Elkin EB. Decision curve analysis: a novel method forevaluating prediction models. Med Decis Making 2006;26:565.
29. Sullivan LM, Massaro JM, D’Agostino RB Sr. Tutorial in biostatistics:presentation of multivariate data for clinical use: the FraminghamStudy risk score functions. Stat Med 2004;23:1631–60.
30. R Core Team. R: a language and environment for statisticalcomputing. Vienna: R Foundation for Statistical Computing, 2014.http://www.R-project.org
31. Vickers AJ. Memorial Sloan Kettering Cancer Centre: Epidemiologyand Biostatistics: Decision curve analysis. http://www.mskcc.org/research/epidemiology-biostatistics/health-outcomes/decision-curve-analysis-0
32. Vickers AJ, Cronin AM, Elkin EB, et al. Extensions to decision curveanalysis, a novel method for evaluating diagnostic tests, predictionmodels and molecular markers. BMC Med Inform Decis Mak2008;8:53.
33. McLernon DJ, Dillon JF, Sullivan FM, et al. The utility of liverfunction tests for mortality prediction within one year in primary careusing the Algorithm for Liver Function Investigations (ALFI). PLoSONE 2012;7:e50965.
34. Dorans K. Pilot projects aim to ease access to clinical data. Nat Med2009;15:226.
35. D’Agostino RB, Grundy S, Sullivan LM, et al. Validation of theFramingham Coronary Heart Disease Prediction Scores. Results ofa multiple ethic groups investigation. JAMA 2001;286:180–7.
36. Sterne JA, White IR, Carlin JB, et al. Multiple imputation for missingdata in epidemiological and clinical research: potential and pitfalls.BMJ 2009;338:b2393.
37. Hawkins RC. The evidence based medicine approach to diagnostictesting: practicalities and limitations. Clin Biochem Rev2005;26:7–18.
38. Craig P, Dieppe P, Macintyre S, et al. Developing and evaluatingcomplex interventions: the new Medical Research Council guidance.BMJ 2008;337:a1655.
39. Goodwin N. Diagnostic delays and referral management schemes:how ‘integrated’ primary care might damage your health. Int J IntegrCare 2008;8:e78.
10 McLernon DJ, Donnan PT, Sullivan FM, et al. BMJ Open 2014;4:e004837. doi:10.1136/bmjopen-2014-004837
Open Access
on July 5, 2020 by guest. Protected by copyright.
http://bmjopen.bm
j.com/
BM
J Open: first published as 10.1136/bm
jopen-2014-004837 on 2 June 2014. Dow
nloaded from