open access research differences in research funding for...
TRANSCRIPT

Differences in research funding forwomen scientists: a systematic comparisonof UK investments in global infectiousdisease research during 1997–2010
Michael G Head,1 Joseph R Fitchett,2 Mary K Cooke,1 Fatima B Wurie,1 Rifat Atun3,4
To cite: Head MG, Fitchett JR,Cooke MK, et al. Differences inresearch funding for womenscientists: a systematiccomparison of UK investmentsin global infectious diseaseresearch during 1997–2010.BMJ Open 2013;3:e003362.doi:10.1136/bmjopen-2013-003362
▸ Prepublication history andadditional material for thispaper is available online. Toview these files please visitthe journal online(http://dx.doi.org/10.1136/bmjopen-2013-003362).
Received 7 June 2013Revised 12 October 2013Accepted 15 October 2013
For numbered affiliations seeend of article.
Correspondence toMichael G Head;[email protected]
ABSTRACTObjectives: There has not previously been a systematiccomparison of awards for research funding in infectiousdiseases by sex. We investigated funding awards to UKinstitutions for all infectious disease research from 1997to 2010, across disease categories and along theresearch and development continuum.Design: Systematic comparison.Methods: Data were obtained from several sources forawards from the period 1997 to 2010 and each studyassigned to—disease categories; type of science(preclinical, phases I–III trials, product development,implementation research); categories of fundingorganisation. Fold differences and statistical analysis wereused to compare total investment, study numbers, meangrant and median grant between men and women.Results: 6052 studies were included in the finalanalysis, comprising 4357 grants (72%) awarded to menand 1695 grants (28%) awarded to women, totalling£2.274 billion. Of this, men received £1.786 billion(78.5%) and women £488 million (21.5%). The medianvalue of award was greater for men (£179 389; IQR£59 146–£371 977) than women (£125 556; IQR£30 982–£261 834). Awards were greater for maleprincipal investigators (PIs) across all infectious diseasesystems, excepting neurological infections and sexuallytransmitted infections. The proportion of total fundingawarded to women ranged from 14.3% in 1998 to 26.8%in 2009 (mean 21.4%), and was lowest for preclinicalresearch at 18.2% (£285.5 million of £1.573 billion) andhighest for operational research at 30.9% (£151.4 millionof £489.7 million).Conclusions: There are consistent differences infunding received by men and women PIs: women havefewer funded studies and receive less funding in absoluteand in relative terms; the median funding awarded towomen is lower across most infectious disease areas, byfunder, and type of science. These differences remainbroadly unchanged over the 14-year study period.
INTRODUCTIONWomen are under-represented in biomedicalscience, yet few studies have systematically
explored the extent and reasons for theobserved differences between men andwomen scientists. Women comprise 50% ofthe European Union (EU) student popula-tion and 45% of doctoral students, but onlyone-third of career researchers are women—a figure that is lower for senior positions.1
In 2001, a Wellcome Trust survey concludedthat although women were as successful asmen in securing funding for biomedicalresearch, they were less likely to apply for grantfunds because of their status in scientific insti-tutions and the level of support they received.2
An analysis of Wellcome Trust awards in 2000–2008 revealed a significant gender differencein the amount of funding awarded, even afteradjusting for the seniority of the principalinvestigator (PI), concluding “the most likelyexplanation for the difference in amountsawarded to women and men is that women are
Strengths and limitations of this study
▪ This is the first study to present detailed dataand rigorously quantify funding differencesbetween men and women researchers in infec-tious disease research in the UK.
▪ Our results provides new and additional evidenceon differences on funding for men and womenresearchers highlighted in earlier studies andprovides a case for new research to explainthe source of these differences, especially giventhe government commitments to increase thenumber of women in science.
▪ We were unable to assess the success andfailure rates by gender and thus cannotcomment on the extent of inequalities or bias.As we could not feasibly access data on the aca-demic ranking of principal investigators, we werehence unable to adjust for levels of seniorityacross both genders. A follow-up study incorpor-ating these data would allow for more meaning-ful conclusions to be drawn about the nature ofany possible disparities.
Head MG, Fitchett JR, Cooke MK, et al. BMJ Open 2013;3:e003362. doi:10.1136/bmjopen-2013-003362 1
Open Access Research
group.bmj.com on December 10, 2013 - Published by bmjopen.bmj.comDownloaded from

systematically less ambitious in the amounts of fundingrequested in their grant applications.”3 In 2011, around44% of academics in UK universities were women, yet only39% of senior lecturers and 19% of professors werewomen.4 Furthermore, a number of studies from the USAhave shown that women in science are disadvantaged com-pared to men.5–7
The low numbers of women in science and thereasons for this anomaly are a matter of concern forscientists and policy-makers. Although the UK MedicalResearch Council (MRC) has a gender equality scheme,which briefly states that gender equality is reflectedin agreements with research organisations receivingMRC funding, it is not clear how the scheme isimplemented.8
While several initiatives have aimed to increase thenumbers of women involved in science, there are noaffirmative actions or binding policies in the UK orEurope to definitively ensure that women are betterrepresented in science. Indeed, some initiatives aimed atincreasing women in science have been criticised. Forexample, in 2012, the European Commission campaigntargeting 13-year-old to 18-year-old secondary school stu-dents9 was rebuked and described as an insult to womenin science,10 11 with the offending video clip removedfrom the EU campaign website. The effects of cam-paigns aimed at raising the profile of women inscience12 13 have not been assessed.We have previously undertaken a systematic analysis of
research funding awarded to UK institutions for all infec-tious disease research for the 14-year period from 1997 to2010.14 Here, we use the dataset gathered for this earlierstudy to examine trends over time, the distribution offunding awarded to men and women PIs across specificinfections, funder categories and along the research anddevelopment (R&D) continuum, extending from preclin-ical to clinical and operational research.
METHODSWe obtained data from several sources for infectiousdisease research studies where funding was awardedbetween 1997 and 2010. The methods for the originalstudy are elaborated in detail elsewhere14 and sum-marised here. We identified 325 922 studies for screen-ing that covered all areas of disease from severalfunders, and filtered these to identify funding for infec-tious diseases where the lead institution was in the UKin the period and the year of award 1997–2010. Weobtained data from publicly available sources and dir-ectly from the funders. We did not include private sectorfunding in the analysis, as pharmaceutical sector datawere not publicly available. Figure 1 shows the sources ofdata and the numbers of studies included and excludedat each stage of screening to reach the final set ofstudies for detailed analysis.Data collection and cleaning took place alongside
routine duties between 2006 and 2011, primarily by
MGH and assisted by JRF, MKC and FBW. Fundingrecords could feasibly be obtained going back to 1997,hence the decision to cover awards during 1997–2010.We assigned each study to primary disease categories,and within each category we documented topic-specificsubsections, including specific pathogen or disease. Weallocated studies to one of four categories along theR&D continuum: preclinical; phases I, II or III; productdevelopment; and operational research, and to 1 of the26 categories for funding organisations.Where the PI was named, we assigned them to men or
women categories. The studies where only an initial wasavailable for the forename were assigned as ‘unclear’ ifwe were unable to establish the PI’s gender from areview of the literature, institutional websites or publiclyavailable publications and documents.Reference to sexually transmitted infections excludes
HIV. Neglected tropical diseases were categorised accord-ing to the classification used by the WHO (http://www.who.int/neglected_diseases/diseases/en). Antimicrobialresistance includes antibacterial, antiviral, antifungal andantiparasitic studies.We converted grants awarded in a currency other than
pounds sterling to UK pounds using the mean exchangerate in the year of the award. We adjusted grant fundingamounts for inflation and reported in 2010 UK pounds.As well as excluding studies not immediately relevant
to infection, we excluded unfunded studies, veterinaryinfectious disease research studies (unless there was azoonotic component), those exploring the use of viralvectors to investigate non-communicable diseases, grantsfor symposia or meetings or studies with UK contribu-tions (eg, as a collaborator), but the funding wasawarded to a non-UK institution.We used Microsoft Excel versions 2000 and 2007 to
categorise studies. Where needed, data were exportedinto Microsoft Access (versions 2000 and 2007) and spe-cific keyword queries used to select precise sections ofthe data for analysis. We used Stata (V.11.0) for statisticalanalysis and to generate figures.We used fold differences to compare total investment,
number of studies, mean grant and median grantbetween men and women according to disease system,specific infection and funding organisation.We used the non-parametric Mann-Whitney rank-sum
test to assess the distribution of funding by gender.The non-parametric K-sample test on equality ofmedians was applied to compare the median fundingby gender, and reported as a χ2 statistic withoutYates’ correction for continuity. The non-parametricWilcoxon signed-rank test was applied when comparingmatched data, such as time trends by gender. The sig-nificance for all tests was defined at the 5% level (two-sided p=0.05).We present differences between gender and do
not attempt to investigate or imply bias or inequalities aswe could not access data on unsuccessful grantapplications.
2 Head MG, Fitchett JR, Cooke MK, et al. BMJ Open 2013;3:e003362. doi:10.1136/bmjopen-2013-003362
Open Access
group.bmj.com on December 10, 2013 - Published by bmjopen.bmj.comDownloaded from

RESULTSWe identified 6165 studies from the 325 922 studiesscreened that were suitable for inclusion in our analysis.Of these, we were unable to ascertain the gender of thePI for 30 studies (0.5%). We excluded 83 studies (1.3%)that did not specify the PI’s name or gender—thesewere funded by the Bill & Melinda Gates Foundation(Gates Foundation; 38 studies; 0.6%) and the UKDepartment for International Development (DFID; 22
studies; 0.4%), accounting for £321.2 million (12.3% ofthe total). We included 6052 studies in the final analysis,comprising 4357 grants (72%) awarded to men and1695 grants (28%) awarded to women, totalling £2.274billion, of which £1.786 billion (78.5%) were awarded tomen and £488 million (21.5%) to women.The median value of grant funding was greater for
men (£179 389; IQR £59 146–£371 977) than for women(£125 556; IQR £30 982–£261 834). Similarly, the mean
Figure 1 Methodology flow chart for filtering studies first by infectious disease and then by gender. BBSRC, Biotechnology and
Biological Sciences Research Council; ESRC, Economic and Social Research Council; PI, principal investigator; R&D, research
and development.
Head MG, Fitchett JR, Cooke MK, et al. BMJ Open 2013;3:e003362. doi:10.1136/bmjopen-2013-003362 3
Open Access
group.bmj.com on December 10, 2013 - Published by bmjopen.bmj.comDownloaded from
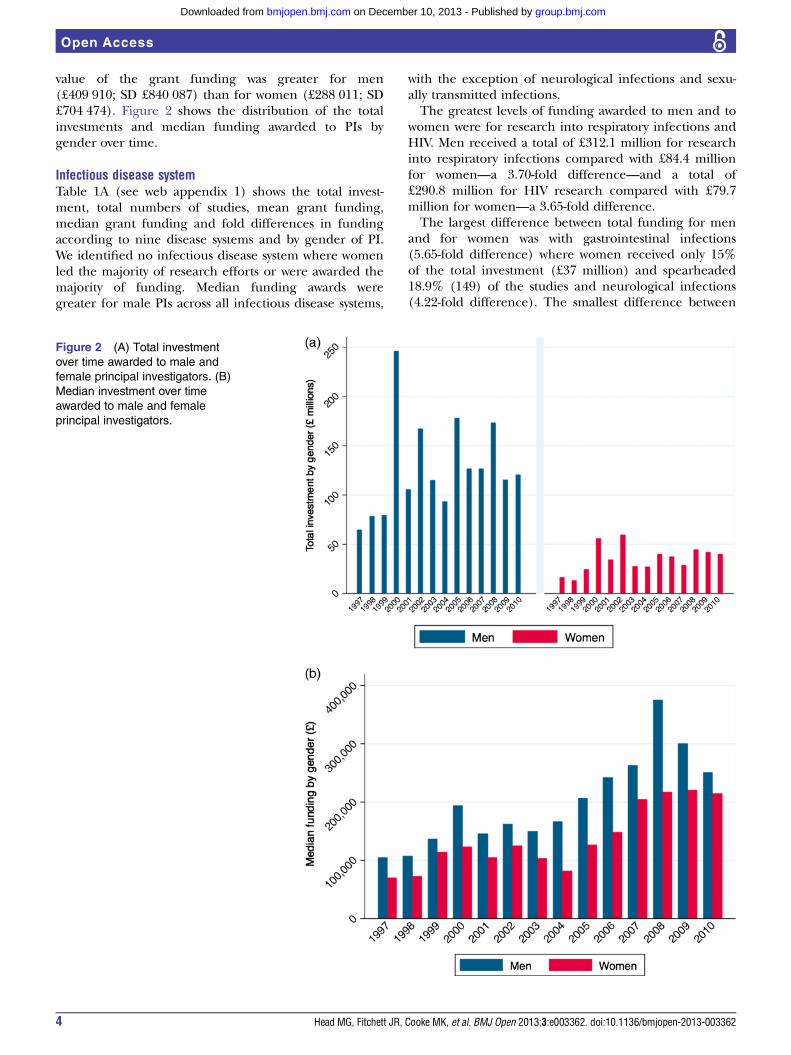
value of the grant funding was greater for men(£409 910; SD £840 087) than for women (£288 011; SD£704 474). Figure 2 shows the distribution of the totalinvestments and median funding awarded to PIs bygender over time.
Infectious disease systemTable 1A (see web appendix 1) shows the total invest-ment, total numbers of studies, mean grant funding,median grant funding and fold differences in fundingaccording to nine disease systems and by gender of PI.We identified no infectious disease system where womenled the majority of research efforts or were awarded themajority of funding. Median funding awards weregreater for male PIs across all infectious disease systems,
with the exception of neurological infections and sexu-ally transmitted infections.The greatest levels of funding awarded to men and to
women were for research into respiratory infections andHIV. Men received a total of £312.1 million for researchinto respiratory infections compared with £84.4 millionfor women—a 3.70-fold difference—and a total of£290.8 million for HIV research compared with £79.7million for women—a 3.65-fold difference.The largest difference between total funding for men
and for women was with gastrointestinal infections(5.65-fold difference) where women received only 15%of the total investment (£37 million) and spearheaded18.9% (149) of the studies and neurological infections(4.22-fold difference). The smallest difference between
Figure 2 (A) Total investment
over time awarded to male and
female principal investigators. (B)
Median investment over time
awarded to male and female
principal investigators.
4 Head MG, Fitchett JR, Cooke MK, et al. BMJ Open 2013;3:e003362. doi:10.1136/bmjopen-2013-003362
Open Access
group.bmj.com on December 10, 2013 - Published by bmjopen.bmj.comDownloaded from

total funding for men and for women was in researchinto sexually transmitted infections (1.90-fold differ-ence), where women received 35% (£45.4 million) ofthe total funding and led 49% (182) of the studies.The mean funding for grants was significantly greater
for men (£409 910, SD £840 087) than for women(£288 011, SD £704 474). The differences in medianfunding were statistically significant (p>0.01) for gastro-intestinal infections (men £328 021; SD £458 720)(women £248 615, SD £433 176), for haematologicalinfections (men £417 889; SD £914 626) (women£306 126; SD £819 910) and for HIV (men £649 216; SD£1 550 920) (women £278 505; SD £545 657).The median funding for grants showed a similar pattern,
with a significantly greater grant funding for men(£179 389; IQR £59 146–£371 977) than women (£125 556;IQR £30 983–£261 835). Differences in median fundingwere statistically significant (p>0.05) for gastrointestinalinfections (men £208 369; IQR £78 852–357 771) (women£155 066; IQR £43 637–£305 928), for hepatic infections(men £118 638; IQR £41 342–£269 629) (women £68 620;IQR £26 720–£221 952) and for HIV (men £163 462; IQR£39 153–£511 800) (women £114 272; IQR £29 880–£305 339).
Specific infectionsTable 1B (see web appendix 1) shows total investment,total numbers of studies, mean grant funding, mediangrant funding and fold differences in funding accordingto specific infection by gender.Men received significantly higher levels of total
research funding, spearheaded greater numbers ofstudies and were awarded greater median and meanfunding for grants for malaria (p=0.01), HIV (p=0.01)and influenza (p=0.04).Major differences between total funding for men and
for women were observed for research into candida(47.75-fold difference), rotavirus (33.65-fold difference),Campylobacter (24.33-fold difference) and norovirus(23.33-fold difference). Smallest differences betweentotal funding for men and women were observed forresearch into dengue (1.07-fold difference) and leish-maniasis (1.55-fold difference). Women received greatertotal funding than men for research into leprosy(0.09-fold difference), diphtheria (0.18-fold difference),chlamydia (0.36-fold difference), syphilis (0.37-fold dif-ference) and varicella zoster (0.54-fold difference).Differences in mean grant funding were statistically sig-
nificant (p>0.05) for malaria research (men £590 422; SD£1 324 909) (women £318 054; SD £726 872), for influ-enza (men £616 643; SD £881 493) (women £387 186; SD£489 997), for respiratory syncytial virus (men £485 283;SD £539 396) (women £187 931; SD £268 412) and forHIV (men £649 216; SD £1 550 920) (women £278 505;SD £545 657).Differences in median grant funding were statistically
significant (p>0.05) for malaria research (men£209 646; IQR £63 826–£529 610) (women £143 358;
IQR £42 754–£314 524), for hepatitis C (men £124 797;IQR £42 475–£289 293) (women £67 265; IQR £29 880–£233 467), for influenza (men £348 730; IQR £213 601–£668 561) (women £200 787; IQR £124 210–£398 191),for herpes simplex virus (men £119 295; IQR £40 009–£446 395) (women £309 610; IQR £147 885–£439 305)and for HIV (men £163 462; IQR £39 153–£511 800)(women £114 272; IQR £29 880–£305 339).Figure 3 shows the proportion of total funding awarded
to PIs by gender over time and a breakdown of investmentby research pipeline. The proportion of the total fundingawarded to women ranged from 14.3% (in 1998) to 26.8%(in 2009), with a mean proportion of 21.4% for the periodstudied. The proportion of funding was lowest for preclin-ical research at 18.2% (£285.5 million of £1.573 billiontotal) and highest for operational research at 30.9%(£151.4 million of £489.7 million). The funding for clin-ical (phases I–III) research was 29.9% (£25.5 of £85.2)and for product development it amounted to 20.4%(£25.8 million of £126.6 million).
Funding organisationTable 2 (see web appendix 2) shows in detail the totalinvestment, total numbers of studies, mean grant funding,median grant funding and fold differences in fundingaccording to funding organisation and by gender.Public funding organisations invested a total of £1.025
billion in research led by men (78.6%) and £279.8 inresearch led by women (21.4%). The greatest levels offunding awarded to men and to women were by theWellcome Trust and the UK MRC. Major differencesbetween funding awarded to men and to women PIs wereby the Biotechnology and Biological Sciences ResearchCouncil (BBSRC), with a 6.12-fold difference. Smallest dif-ferences between funding awarded to men and to womenwere by the UK Government funding streams such as theNational Institute for Health Research, with a 1.66-fold dif-ference. Mean grant funding from public funding organi-sations was significantly greater for men at £595 361 (SD£1 080 718) than for women at £448 414 (SD £814 979).Differences were also statistically significant (p>0.01) forUK MRC grants with men at £751 413 (SD £1 020 748)and women at £544 427 (SD £884 442) and for UKGovernment grants with men at £208 828 (SD £492 519)and women at £182 907 (SD £619 889).Median grant funding from public funding organisa-
tions had a similar pattern with significantly greater grantfunding for men at £272 452 (IQR £138 322–£572 529)and women at £213 718 (IQR £92 880–£402 917).Differences were also statistically significant (p>0.05) forUK MRC grants with men at £404 615 (IQR £ 210 068–£811 860) and women at £286 679 (£178 182 to £468 998),and for UK Government grants with men at £129 660(IQR £23 761–£207 320) and women at £59 976 (IQR£12 564–£157 053).Philanthropic funding organisations invested a total of
£691.7 million in research led by men (78.8%) and£185.9 million in research led by women (21.2%).
Head MG, Fitchett JR, Cooke MK, et al. BMJ Open 2013;3:e003362. doi:10.1136/bmjopen-2013-003362 5
Open Access
group.bmj.com on December 10, 2013 - Published by bmjopen.bmj.comDownloaded from

Mean grant funding from philanthropic funding organi-sations was significantly greater for men at £338 396 (SD£695 025) than for women at £242 014 (SD £711 420).Differences were also statistically significant (p>0.01) forWellcome Trust grants with men receiving £393 652 (SD£723 549) and women £230 168 (SD £362 836) and forother charitable funding organisations with men receiving£211 190 (SD £454 108) and women £271 842 (SD£1 208 852).Median grants from philanthropic funding organisa-
tions showed a similar pattern with significantly greatergrant funding for men at £153 653 (IQR £58 589–£302 774) and women at £114 173 (IQR £42 658–£222 842). Differences were also statistically significant(p>0.05) for Wellcome Trust grants with men receiving£191 461 (IQR £74 759–£362 424) and women £137 241(IQR £54 019–£250 723), and for other charitable funding
organisations with men receiving £91 991 (IQR £36 429–£172 497) and women £76 058 (IQR £17 279–£150 727).Figure 4 shows the association between funding organ-
isation and total investment and median funding bygender. The MRC awarded the highest median amountin grants to women (£286 679; IQR £178 182–£468 998),but the median funding amount in grants for men were1.41-fold higher than that awarded to women (£404 615;IQR £210 068–£811 860). The European Commissionawarded the highest mean grants to women at £923 364(SD £1 316 016); however, mean funding amount ingrants for men was 1.44-fold higher at £1 325 149 (SD£2 409 860) than that for women.
Time trendTable 3 (see web appendix 3) shows in detail the trendsin funding over time from 1997 to 2010 by gender of
Figure 3 (A) Proportion of
investment over time awarded to
male and female principal
investigators. (B) Total investment
by research pipeline awarded to
male and female principal
investigators.
6 Head MG, Fitchett JR, Cooke MK, et al. BMJ Open 2013;3:e003362. doi:10.1136/bmjopen-2013-003362
Open Access
group.bmj.com on December 10, 2013 - Published by bmjopen.bmj.comDownloaded from

PIs, with amounts and relative proportions each year offunding. Mean annual funding received was greater bymen at £127.6 million (SD £48.7 million) than womenat £34.9 million (SD £13.4 million). Proportions ofannual funding received by men ranged from 73.2% to85.7%, with a mean of 78.6%.Proportions of annual funding received by women
ranged from 14.3% to 26.8% with a mean of 21.4%. Thelargest annual funding received by men was £245.7million in 2000, and the smallest at £64.2 million in1997. The largest annual funding received by womenwas £59.6 million in 2002, with the smallest at £13.1million in 1998.Over the 14-year study period, the proportion of
investment awarded to women each year remains rela-tively unchanged with a mean of 21.4% of total (range14.3–26.8%; £13.1 million to £59.6 million). Figure 5
shows the funding trends over time and fold differencesin total investments by gender. The absolute differencein the funding amounts in the grants awarded to menand women ranges between £47.9 million and £190.1million, with a mean difference of £92.7 million (SD£38.3 million). The fold difference in grant funding formen and women ranged from 2.74 to 5.97, with a meanfold difference of 3.66.
DISCUSSIONWe present the first detailed and systematic comparisonby sex of investments in infectious disease research inthe UK for the 14-year period 1997–2010. We identified6165 studies funded by public and philanthropicfunding organisations, with a total research investmentof £2.6 billion.
Figure 4 (A) Association
between funding organisation and
total investment by gender.
(B) Association between funding
organisation and median award
by gender. BBSRC,
Biotechnology and Biological
Sciences Research Council;
DH, UK department of health;
MRC, Medical Research Council.
Head MG, Fitchett JR, Cooke MK, et al. BMJ Open 2013;3:e003362. doi:10.1136/bmjopen-2013-003362 7
Open Access
group.bmj.com on December 10, 2013 - Published by bmjopen.bmj.comDownloaded from

We quantified the differences in research fundingawarded by gender to show these to be substantial. Theanalysis shows clear and consistent differences betweenmen and women PIs, with lower funding in terms of thetotal investment, the number of funded studies, themedian funding awarded and the mean fundingawarded across most of the infectious disease areasfunded. Women received less funding in absoluteamounts and in relative terms, by funder and the type ofscience funded along the R&D pipeline. These differ-ences in funding between men and women persist overtime.We show large differences in median funding amounts
for men and women researchers in investments by the
European Commission and the MRC. Such differenceswere much less apparent when comparing funding fromthe Department of Health and BBSRC, although theBBSRC awarded 86% of funding to men. The BBSRCalmost entirely funds preclinical research,14 and thismatches the increased proportions of preclinical studiesbeing led by male PIs.Our findings in infectious disease research, the most
detailed until now, provide new evidence on differencesbetween men and women researchers to reinforce theconcerns raised in earlier studies.4 15 16 Differences thatare more marked at senior levels of academia need tobe investigated to explain and account for the observeddifferences.
Figure 5 (A) Total investment
and trend over time, by gender.
(B) Fold difference of investment
over time, by gender.
8 Head MG, Fitchett JR, Cooke MK, et al. BMJ Open 2013;3:e003362. doi:10.1136/bmjopen-2013-003362
Open Access
group.bmj.com on December 10, 2013 - Published by bmjopen.bmj.comDownloaded from

The reasons why the median awards across most infec-tious disease conditions should be significantly less forwomen PIs cannot be deduced from the available data.Thus, it is not possible to recommend interventions toaddress this phenomenon, given that it is unclear if thereis any bias or precisely what mechanisms are at play. Thenext step may be to investigate success rates by gender toassess how many women are applying and what proportionof the initial request for funding is actually allocated.There have been suggestions that women are systematic-
ally less ambitious in the amounts of funding requested intheir grant applications when compared with men who areequivalently ranked academically, and that relativelysimple mentoring programmes could at least partially over-come this anomaly.3 However, there is no evidence sup-porting these assertions. Others have suggested thatsystems which ensure PI anonymity during review of grantfunding submissions may help reduce the presence of anysubtle gender biases,17 though in practice this approachwould be challenging as the experience of PI is a keyfactor when considering the suitability of request forresearch support. However, evidence on effective interven-tions to address barriers for women scientists is lacking.16
Women of childbearing age are being disadvantaged insome areas of employment, even though in relation to sci-entific endeavour, productivity as measured by publishedoutputs is not significantly different between women withand without children.15
Study limitationsOur analysis has several limitations. We rely on the accur-acy of the original data from the funding organisationsand, as described elsewhere, we have excluded datafrom the private sector as the publicly available data areincomplete.14
In the period analysed, we were not able to find data onthe number of men and women PIs requesting financialsupport for research agencies from the funding sourcesstudies. Hence, we were unable to assess the success andfailure rates by gender. We also did not have complete dataon the amount of funding initially requested, the genderof coapplicants for each study, the total pool of researchersin each disease area and within each type of science, orthe proportion of awards made to clinical and non-clinicalresearchers, all of which would be useful pieces of infor-mation in developing a clearer picture of the reasons forthe presented differences. The proportion of doctorsregistered in the UK favours men (56.8% as of January2013) over women,18 but the proportion of those carryingout research appears to be unknown. Understanding thedistribution of researchers is critical to an understandingof the research landscape.We lacked data on the academic ranking of PIs and
were hence unable to adjust for levels of seniority acrossboth genders. We were unable to get data on genderfrom the Gates Foundation and DFID and hence wereunable to clarify the gender of a small proportion ofinvestigators, though we believe this limitation is not
likely to change the conclusions of the study. Our ana-lysis focuses on infectious disease research, and analysisof other areas of scientific research would be needed ifthese differences persisted for all research areas.
CONCLUSIONSNotwithstanding the limitations, our systematic analysisshows an unequal distribution of investments in infec-tious disease research for men and women. There arefewer women receiving funding as PIs in infectiousdisease research, with fewer studies funded with lowerfunding amounts when successful.Although earlier studies have discussed possible solu-
tions, including mentoring programmes and advertisingcampaigns, none have systematically explored thereasons why such differences persist. Hence, without anunderstanding of the reasons for the observed differ-ences, the proposed solutions are not very meaningful.There is no evidence that women and men researchersare not equally capable; hence, other factors are likelyto be at play to explain the observed differences whichhave persisted over the 14-year study period. From ourdata, the limitations mean that we cannot explain whatthese mechanisms might be. Research is needed to elu-cidate an understanding of the factors that can explainthe observed differences. A subanalysis of our datasetwhere information on academic rank at the time ofaward is obtained would allow for more meaningful con-clusions. We strongly urge policy-makers, funders andscientists to urgently investigate the factors leading tothe observed differences and develop policies developedto address them, in order to ensure that women areappropriately supported in scientific endeavour.
Author affiliations1Research Department of Infection and Population Health, University CollegeLondon, UCL Royal Free Campus, London, UK2London School of Hygiene & Tropical Medicine, London, UK3Imperial College London, South Kensington Campus, London, UK4Harvard School of Public Health, Harvard University, Boston, Massachusetts,USA
Acknowledgements The authors would like to thank Jennifer Harris andRaidah Haider for their input and assistance, and acknowledge the assistanceof the research and development funding agencies for provision of data.
Contributors MGH designed the study with input from RA and JF andcollated the dataset. JRF, FW and MKC checked and refined the dataset. JRFundertook data analysis and created the graphs and figures with input fromMGH and RA. MGH, JRF and RA interpreted the data and wrote the first draft.MGH, JRF and RA refined the analysis and article with input from MKC andFBW. All authors reviewed and approved the final version. MH is the guarantorof the article.
Funding This research received no specific grant from any funding agency inthe public, commercial or not-for-profit sectors.
Competing interests RA has received research funding from the UK MedicalResearch Council, the UK National Institute for Health Research, UK CRC, UKEPSCRC, the UK Department for International Development and the UKDepartment of Health. RA is a member of the UL Medical Research CouncilGlobal Health Group. MGH works for the Infectious Disease Research Network,which has supported this work and is funded by the UK Department of Health.
Head MG, Fitchett JR, Cooke MK, et al. BMJ Open 2013;3:e003362. doi:10.1136/bmjopen-2013-003362 9
Open Access
group.bmj.com on December 10, 2013 - Published by bmjopen.bmj.comDownloaded from

JRF has received funds from the Wellcome Trust and is a steering group memberfor the Infectious Disease Research Network. MKC has received funding from theMedical Research Council and the Bill and Melinda Gates Foundation. FBW hasreceived funds from the UCLH Charitable Foundation.
Provenance and peer review Not commissioned; externally peer reviewed.
Data sharing statement All gender data are available with this submission.Further data relating to the Research Investments project can be found athttp://www.researchinvestments.org or by contacting MGH.
Open Access This is an Open Access article distributed in accordance withthe Creative Commons Attribution Non Commercial (CC BY-NC 3.0) license,which permits others to distribute, remix, adapt, build upon this work non-commercially, and license their derivative works on different terms, providedthe original work is properly cited and the use is non-commercial. See: http://creativecommons.org/licenses/by-nc/3.0/
REFERENCES1. Directorate-General for Employment, Social Affairs and Equal
Opportunities Unit G1. More women in senior positions. Key toeconomic stability and growth. Luxembourg: European Commission,2010. http://www.eubusiness.com/topics/employment/women-senior.10/
2. Blake M, La Valle I. Who applies for research funding? Key factorsshaping funding application behaviour among women and men inBritish higher education institutions. London: Wellcome Trust, 2000.
3. Bedi G, Van Dam NT, Munafo M. Gender inequality in awardedresearch grants. Lancet 2012;380:474.
4. Fitzpatrick S. A Survey of Staffing Levels of Medical Clinical Academicsin UK Medical Schools as at 31 July 2011. London, 2012. http://www.medschools.ac.uk/Publications/Documents/MSC_Clinical_Academic_Staff_Survey_310711.pdf (accessed 22 Aug 2013).
5. Burrelli J. Thirty-Three Years of Women in S&E Faculty Positions—US National Science Foundation. Arlington, 2008. http://www.nsf.gov/statistics/infbrief/nsf08308/ (accessed 22 Aug 2013).
6. Lincoln AE, Pincus SH, Leboy PS. Scholars’ awards go mainly tomen. Nature 2011;469:472.
7. Pohlhaus JR, Jiang H, Sutton J. Sex differences in careerdevelopment awardees’ subsequent grant attainment. Ann InternMed 2010;152:616–17; author reply 617.
8. Medical Research Council. MRC Gender Equality Scheme. 2007.http://www.mrc.ac.uk/Utilities/Documentrecord/index.htm?d=MRC003655 (accessed 22 Aug 2013).
9. European Commission. About this site-Science: It’s a girl thing! 2012.http://science-girl-thing.eu/en/about-this-site (accessed 22 Aug 2013).
10. Gill M. “Science, it’s a girl thing!” says EU Commission, holdinglipstick and bunsen burner. New Statesman, 2012. http://www.newstatesman.com/blogs/martha-gill/2012/06/science-its-girl-thing-says-eu-commission-holding-lipstick-and-bunsen-burn (accessed22 Aug 2013).
11. Swain F. Science: It’s a girl thing. Excuse me while I die inside.—SciencePunk. ScienceBlogs, 2012. http://scienceblogs.com/sciencepunk/2012/06/22/science-its-a-girl-thing-excuse-me-while-i-die-inside/ (date accessed 22 Aug 2013).
12. Yong E. Edit-a-thon gets women scientists into Wikipedia. Nature,2012. http://www.nature.com/news/edit-a-thon-gets-women-scientists-into-wikipedia-1.11636 (accessed 22 Aug 2013).
13. Donald A. Throw off the cloak of invisibility. Nature 2012;490:447.http://www.nature.com/news/throw-off-the-cloak-of-invisibility-1.11638 (accessed 22 Aug 2013).
14. Head MG, Fitchett JR, Cooke MK, et al. UK investments in globalinfectious disease research 1997–2010: a case study. Lancet InfectDis 2013;13:55–64.
15. Fox MF. Gender, family characteristics, and publication productivityamong scientists. Soc Stud Sci 2005;35:131–50.
16. Ceci SJ, Williams WM. Understanding current causes of women’sunderrepresentation in science. Proc Natl Acad Sci USA2011;108:3157–62.
17. Moss-Racusin CA, Dovidio JF, Brescoll VL, et al. Science faculty’ssubtle gender biases favor male students. Proc Natl Acad Sci USA2012;109:16474–9.
18. General Medical Council. List of Registered Medical Practitioners—statistics. http://www.gmc-uk.org/doctors/register/search_stats.asp(accessed 22 Aug 2013).
10 Head MG, Fitchett JR, Cooke MK, et al. BMJ Open 2013;3:e003362. doi:10.1136/bmjopen-2013-003362
Open Access
group.bmj.com on December 10, 2013 - Published by bmjopen.bmj.comDownloaded from

doi: 10.1136/bmjopen-2013-003362 2013 3: BMJ Open
Michael G Head, Joseph R Fitchett, Mary K Cooke, et al.
2010−research during 1997investments in global infectious diseasescientists: a systematic comparison of UK Differences in research funding for women
http://bmjopen.bmj.com/content/3/12/e003362.full.htmlUpdated information and services can be found at:
These include:
Data Supplement
http://bmjopen.bmj.com/content/suppl/2013/12/05/bmjopen-2013-003362.DC2.html"Press release"
http://bmjopen.bmj.com/content/suppl/2013/11/20/bmjopen-2013-003362.DC1.html"Supplementary Data"
References http://bmjopen.bmj.com/content/3/12/e003362.full.html#ref-list-1
This article cites 8 articles, 3 of which can be accessed free at:
Open Access
non-commercial. See: http://creativecommons.org/licenses/by-nc/3.0/terms, provided the original work is properly cited and the use iswork non-commercially, and license their derivative works on different license, which permits others to distribute, remix, adapt, build upon thisCreative Commons Attribution Non Commercial (CC BY-NC 3.0) This is an Open Access article distributed in accordance with the
serviceEmail alerting
the box at the top right corner of the online article.Receive free email alerts when new articles cite this article. Sign up in
CollectionsTopic
(184 articles)Infectious diseases � (114 articles)Global health �
Articles on similar topics can be found in the following collections
http://group.bmj.com/group/rights-licensing/permissionsTo request permissions go to:
http://journals.bmj.com/cgi/reprintformTo order reprints go to:
http://group.bmj.com/subscribe/To subscribe to BMJ go to:
group.bmj.com on December 10, 2013 - Published by bmjopen.bmj.comDownloaded from

Notes
http://group.bmj.com/group/rights-licensing/permissionsTo request permissions go to:
http://journals.bmj.com/cgi/reprintformTo order reprints go to:
http://group.bmj.com/subscribe/To subscribe to BMJ go to:
group.bmj.com on December 10, 2013 - Published by bmjopen.bmj.comDownloaded from