open access isprs international journal of geo-information · 2017-05-06 · isprs int. j. geo-inf....
TRANSCRIPT
ISPRS Int. J. Geo-Inf. 2014, 3, 584-598; doi:10.3390/ijgi3020584
ISPRS International Journal of
Geo-Information ISSN 2220-9964
www.mdpi.com/journal/ijgi/
Article
A Conceptual Flash Flood Early Warning System
for Africa, Based on Terrestrial Microwave Links
and Flash Flood Guidance
Joost C. B. Hoedjes 1,*, André Kooiman
2, Ben H. P. Maathuis
3, Mohammed Y. Said
1,
Robert Becht 3, Agnes Limo
4, Mark Mumo
4, Joseph Nduhiu-Mathenge
4, Ayub Shaka
5
and Bob Su 3
1 International Livestock Research Institute, P.O. Box 30709, Nairobi 00100, Kenya;
E-Mail: [email protected] 2
SERVIR Africa, NASA-RCMRD, 00618 Roysambu Kasarani, Nairobi, Kenya;
E-Mail: [email protected] 3 Faculty of Geo-Information Science and Earth Observation (ITC), University of Twente,
7514 AE Enschede, The Netherlands; E-Mails: [email protected] (B.H.P.M.);
[email protected] (R.B.); [email protected] (B.S.) 4 Safaricom, 00800 Nairobi, Kenya; E-Mails: [email protected] (A.L.);
[email protected] (M.M.); [email protected] (J.N.-M.) 5 Kenya Meteorological Department, 00100 Nairobi, Kenya; E-Mail: [email protected]
* Author to whom correspondence should be addressed; E-Mail: [email protected];
Tel.: +254-708-622-242; Fax: +254-204-223-001.
Received: 30 December 2013; in revised form: 26 March 2014 / Accepted: 3 April 2014 /
Published: 22 April 2014
Abstract: A conceptual flash flood early warning system for developing countries is
described. The system uses rainfall intensity data from terrestrial microwave communication
links and the geostationary Meteosat Second Generation satellite, i.e., two systems that are
already in place and operational. Flash flood early warnings are based on a combination
of the Flash Flood Guidance method and a hydrological model. The system will be
maintained and operated through a public-private partnership, which includes a mobile
telephone operator, a national meteorological service and an emergency relief service. The
mobile telephone operator acts as both the supplier of raw input data and the disseminator
of early warnings. The early warning system could significantly reduce the number of
fatalities due to flash floods, improve the efficiency of disaster risk reduction efforts and
OPEN ACCESS
ISPRS Int. J. Geo-Inf. 2014, 3 585
play an important role in strengthening the resilience to climate change of developing
countries in Africa. This paper describes the system that is currently being developed
for Kenya.
Keywords: flash flood early warning system; terrestrial microwave link; Meteosat Second
Generation; CREST; Africa; Kenya
1. Introduction
According to the United Nations Office for Disaster Risk Reduction, 43% of all disasters in 2012
were hydrological disasters or flood events [1]. Although these were only responsible for 15% of
economic damages caused by disasters, they were responsible for 42% of persons killed and 57% of
persons affected by disasters. In Africa, 82% of fatalities due to natural disasters were caused by
floods. Climate change, as well as growing populations and unplanned urbanization in the developing
world, will increase the vulnerability to floods in years to come.
Flash floods are defined by the American Meteorological Society as a “... flood that rises and falls
quite rapidly with little or no advance warning, usually as the result of intense rainfall over a relatively
small area.” [2] (p. 1.1). Early warning systems are crucial to saving lives. Flash flood early warning
systems can be particularly effective at reducing fatalities, notably due to the effectiveness and low
cost of evacuating for a flash flood. However, the short timespan between a rainstorm event and a flash
flood make this type of flood very difficult to forecast (e.g., [3]). Considering that most developing
countries do not have accurate real-time rainfall observation systems, the implementation of flash
flood early warning systems is not expected in the next 10–20 years, according to [4].
When rainfall within a catchment exceeds either the infiltration capacity or the storage capacity of
the catchment, surface runoff occurs. When the surface runoff exceeds the discharge capacity of any
point downstream of the catchment, a flash flood will occur. The amount of rainfall that is required
over a specified time frame to initiate a flash flood, i.e., to exceed the infiltration (or storage) capacity
of the catchment and cause more than bank full flow in the catchment outlet, depends on the catchment
(slope, soil type, drainage capacity, shape and capacity of the discharge point). The authors of [5,6]
pointed out the importance of good knowledge of the actual hydrologic condition of a catchment
(notably, good knowledge of the soil moisture status) with regard to the moment surface runoff occurs.
Fast responding catchments are most prone to flash floods [7]. As pointed out by [8], accurate
knowledge of the spatial and temporal distribution of rainfall is essential for flash flood early warning
systems. The spatial scale should not exceed that of the catchments of interest or the typical convective
storm within the area of interest. Furthermore, when using precipitation observations instead of
precipitation forecasts, the temporal scale of the rainfall observations should not exceed the response
time of the catchments of interest. The authors of [8] base their flash flood early warning system on
radar systems. However, few developing countries have radar systems at their disposal, and for most
developing countries, the cost of installing radar systems that provide countrywide cover is prohibitive.
Satellite remote sensing is a useful tool for obtaining rainfall estimates in areas without adequate
ground measurements of rainfall. The authors of [9] provide an overview of a number of the available
ISPRS Int. J. Geo-Inf. 2014, 3 586
satellite rainfall products that are available for Africa. However, for flash flood early warning systems,
the constraints on temporal and spatial resolutions pointed out above limit the amount of sensors
available. The authors of [10] evaluate the usefulness of the Tropical Rainfall Monitoring Mission
(TRMM) Multi-satellite Precipitation Analysis (TMPA) for discharge monitoring in ungauged basins.
Although they found good agreements using daily rainfall intensities, the spatial resolution of
0.25° × 0.25° and the temporal resolution of 3 h are too coarse to use in a flash flood early warning
system. The authors of [11] describe the EUMETSAT Multi-Sensor Precipitation Estimate (MPE).
Their algorithm combines the high spatio-temporal data from the Meteosat Second Generation (MSG)
with passive microwave data from the Special Sensor Microwave/Imager (SSM/I). The latter offers
high accuracy in rain rate retrievals. However, the lower temporal resolution of the SSM/I limits the
usability of the MPE in flash flood early warning systems. The authors of [12] stress the potential for
MSG in the estimation of precipitation. Being located at (0°, 0°), the spatial resolution of MSG over
Africa is in the order of 3–4 km. This resolution makes the observation of deep convective clouds
possible. Furthermore, with a typical lifespan of cumulonimbus clouds varying between 45 min and
several hours [13], the temporal resolution is sufficient to observe the evolution of deep convection.
However, MSG only monitors visible and near-infrared wavelengths. In contrast to products
incorporating microwave data, such as the TMPA and MPE, the MSG data contain only information
on cloud top parameters. The authors of [14] stress the importance of integrating satellite data from
geo-stationary environmental satellites, polar orbiting satellites, radar-based precipitation analysis and
in situ rain gauge data for increasing the accuracy of satellite precipitation estimates. To overcome the
absence of radar and in situ rain gauges, several authors (e.g., [15–21]) have described the use of signal
strength data from terrestrial microwave (MW) links. These MW links, operated by commercial
telephone operators, experience signal attenuation during rains. In order to overcome this loss in
signal, it is common practice to operate MW transceivers at sufficiently high power settings to
maintain signal strength even during heavy rains. Depending on the MW links frequency, the amount
of signal attenuation can be used to calculate the rainfall intensity along the transect. Although the
relationship linking MW signal attenuation to rainfall intensity depends on, e.g., the drop size
distribution, drop shape, temperature and other factors, the relationships appear to hold well for a wide
range of rainfall events.
In this paper, a conceptual, high-resolution flash flood early warning system for Kenya is presented.
This early warning system is based on a rainfall observation system, which uses terrestrial microwave
link data from commercial telephone providers and satellite imagery and the Flash Flood Guidance
(FFG) method ([22–24]), in combination with a hydrological model, which is being made operational
for approximately 840 gauged catchments in Kenya.
2. The Kenya Case
The Kenyan climate is characterized by two rainy seasons, the first (the “long rains”) occurring
in March–May, and the second (the “short rains”) in October and November. Flash floods during
the April–May 2013, seasonal rains claimed the lives of 96 people and caused the displacement of
140,000 people. These are fairly typical figures for the annual long rains. Many of these flash floods
occur in seasonal rivers, which are often located some distance downstream from the catchment where

ISPRS Int. J. Geo-Inf. 2014, 3 587
the rain occurred. Roads and bridges are often damaged or inundated, surprising motorists crossing
them. The typical sizes of the catchments from which flash floods originate are well below 1000 km2,
sometimes as small as a few tens of square kilometers. The authors of [5] quoted response times of
between approximately 15 min and 6 h for catchments of similar dimensions. Flash floods in Kenya
are almost exclusively caused by deep convective storms, with a relatively small spatial extent
(ranging from 3 km to 30 km in diameter) and a duration of several hours. Conventional rain gauge
networks, such as the (low density) rain gauge network operated by the Kenya Meteorological
Department, are not able to sample storms at these scales effectively. Weather radars are not
operational in Kenya, and consequently, there is currently no flash flood early warning system
operational in Kenya.
With the increasing amount of mobile telephone users in Kenya over the past 15 years, the
supporting network infrastructure has grown, as well. The network of Kenya’s largest mobile
telephone operator, Safaricom (a market share of 64% in 2012 [25]), comprises some 3000 individual
MW links located throughout the country. Safaricom operates MW links at seven, eight, 15 and
23 GHz. The seven and 8 GHz links typically operate over large distances (20–80 km); the 15 GHz
links operate over distances between four and 20 km; and the 23 GHz links operate over distances of
less than 3 km. Figure 1 shows the locations of the Safaricom network cells as of 2012.
Figure 1. (a) Safaricom cover in Kenya (shaded green). (b) Locations of the automated
weather stations of the Kenya Meteorological Department (red dots).
Overall, the density of MW links in Kenya is lower than the figures for the Netherlands mentioned
by [21]. The stand-alone use of MW links for the estimation of rain rate fields for Kenya is therefore
difficult, more so because the rainfall in Kenya is predominantly convective [26], making interpolation
between MW links difficult. Compared to the number of automated weather stations operated by the
Kenya Meteorological Department (KMD) (depicted in Figure 1b), Safaricom’s MW link network
presents an enormous increase in observational capacity. The 1800 rainfall stations operated by the
KMD are not automated and cannot be used for real-time rainfall observations.
(a) (b)

ISPRS Int. J. Geo-Inf. 2014, 3 588
The cooperation with a mobile telephone operator offers several advantages over conventional flash
flood early warning systems, e.g., systems based on weather radar rainfall data. First of all, the system
has the potential to be made operational at a much lower cost and in a much shorter timespan than
conventional radar-based systems, since the equipment is already in place and operational. Secondly,
the active involvement of the mobile telephone operator, both in gathering the meteorological data and
in the dissemination of the warning messages, increases the commitment and sustainability of the
system. Finally, with knowledge of the number of people that find themselves within the area at risk,
the mobile telephone operator can help improve emergency relief efforts in areas hit by a flash flood.
Once operational, the continuous operation of the system will be ensured by the
telecommunications company, Safaricom, the Kenya Meteorological Department and emergency relief
services in Kenya. Once proven and operational in the selected catchments in Kenya, the same
approach is applicable to other catchments in Kenya, as well as other developing countries.
3. Flash Flood Early Warning System
3.1. Rainfall Intensity Observations
The relationship between rain-induced microwave signal attenuation and rainfall intensity is
described by [27] and given in Equations (1) and (2).
(1)
With the signal attenuation, A (dB∙km−1
), given by:
(2)
Here, Pref(L) is the reference signal level (dB), and P(L) is the received signal level (dB) of an MW
link operating over a path length, L (km). The dimensionless coefficients, a and b, depend on the
frequency of the MW link, as well as on temperature and drop size distribution. Applying this
relationship to a selection of Safaricom’ MW links throughout Kenya yields a variable density rainfall
intensity map, with a high density of rainfall observations in areas with many MW links (i.e., densely
populated areas) and a low density of observations where MW links are sparse. To achieve full,
countrywide coverage of rainfall observations, MSG satellite data are well suited. Both the MW link
diagnostic signal strength data and the MSG data are available every 15 min and can easily be
integrated to yield a new rainfall product. Furthermore, with typical path lengths of between three and
20 km, the MW link data typically cover between one and seven MSG pixels. Consequently, the MSG
data can be used for disaggregation of MW link data.
An algorithm for the estimation of rain rate fields based on the combination of MW link signal
strength data and MSG satellite imagery is proposed by [28]. Using MSG’s infrared and water vapor
channels, the algorithm can be used during the day and the night. The basis for the algorithm proposed
by [28] is the estimation of a convectivity, cs, containing information on the convective stability of
individual pixels. First, a parallax correction is performed on the MSG images. Since the zenith
viewing angles of MSG over Kenya vary between 39.4° in the west and 48.5° in the east of Kenya, the
tops of high clouds are projected to the east on the MSG image. This parallax offset can amount to

ISPRS Int. J. Geo-Inf. 2014, 3 589
more than four pixels (i.e., cloud tops are visible on the MSG image more than 20 km to the east of
their actual location).
After performing a parallax correction on the MSG images, cs is calculated from the evolution
of convective clouds in consecutive MSG images and uses the MSG brightness temperatures (TB)
at 6.2 µm and 10.8 µm. The seven terms (tin) that are used to calculate cs are given by Equations (3)
through (9):
(3)
(4)
(5)
(6)
(7)
(8)
(9)
Here, i denotes a variable from the present interval; pconvection denotes the number of pixels within
an MSG scene that contains convective clouds; ptotal denotes the number of pixels within the scene;
TB_ir and TB_wv denote the 10.8 µm and 6.2 µm brightness temperatures, respectively. The sum of these
terms yields the convectivity, cs. This term contains information on the convective stability during
an interval, i, for each pixel. The convectivity is given by Equation (10):
(10)
In contrast to the observed brightness temperatures, the cs approach takes into account the
convective conditions in the area surrounding a convective storm, as well as the speed at which the
convective cloud has developed. Whereas two clouds can have the same brightness temperature, the
speed at which they have developed will cause the rainfall intensities from these two clouds to differ.
The next step in the algorithm proposed by [28] consists of linking the pixels covering the
individual MW links to the rain rates observed by the individual MW links. For each MW link, the cs
values of the pixels covering that link, at a specific interval, give the convective instability that

ISPRS Int. J. Geo-Inf. 2014, 3 590
corresponds to the rain rate measured by that MW link, at that interval. This set of cs and rain rate
values, plus the rain/no rain threshold cs value, give a relationship to calculate the rain rate fields for
the area surrounding the MW links. The authors of [28] performed initial testing of their algorithm in
Western Kenya, using data from 6 MW links. For illustration, an example of the 10.8 µm MSG TB
input and the model output is shown in Figure 2.
Figure 2. Ten-point-eight micrometer Meteosat Second Generation (MSG) TB image
without parallax correction (left) and the modeled rain rate, based on data from six
microwave (MW) links and MSG 6.2 µm and 10.8 µm TB (right).
The initial results presented by [28] are based on only 6 MW links and, therefore, lack accuracy for
the estimation of rain rate fields at the spatial extent shown Figure 2 right. However, the initial results
from the combined use of MW links and MSG shown in [27] are promising, notably for use in flash
flood early warnings. As pointed out by [29], good knowledge of rainfall patterns helps better assess
the volume of inputs in a catchment. The high spatial resolution of this method allows for the
monitoring of small catchments. Further testing at a larger scale will be conducted in the near future.
One important aspect of this method, notably for use in early warning systems, is the potential
accuracy of the method. The areas where the largest number of people are at risk of weather related
hazards, i.e., densely populated areas, are also the areas with the highest densities of MW links, linking
up the numerous GSM towers put in place by the mobile telephone operators to serve their customers.
Consequently, the potential accuracy of the rainfall measurements in these areas is highest. Not only
can a significant number of MW links be included in the rainfall calculation for those areas, but the
locations of the selected links can also be optimized for the local conditions. For example, if 90% of
convective storms in a given area arrive from the northeast, more MW links may be selected on that
side of the area of (greatest) interest. This can also be seen from Figure 1, which shows the best
network coverage in the most densely populated areas.

ISPRS Int. J. Geo-Inf. 2014, 3 591
3.2. Hydrological Modeling
The rainfall intensity maps described in the previous section are available every 15 min, as soon as
both the MSG and MW link data are available for processing (i.e., in near real time), thus fulfilling
one important requirement of flash flood early warning systems. The authors of [5] reported relatively
low runoff coefficients for flash floods, implying the significant importance of the hydrological
conditions of a catchment (e.g., soil moisture status). The authors of [6] point out that “Soil moisture
initial conditions are among the most important hydrological properties affecting flash flood triggering.
Without hydrological analysis, it is impossible to evaluate the flash flood potential of storms,
particularly in the fringe of the flood/no flood threshold.” The authors of [6] propose the use of generic
hydrologic models to estimate the FFG. The authors of [24] define the FFG as the amount of actual
rainfall of a given duration that generates the threshold runoff. The authors of [6,30] point out the
strength of the FFG method over ungauged basins. The FFG method relies on accurate knowledge of
the soil moisture status of catchments, in order to calculate the point at which the infiltration capacity
(or, in some cases, the storage capacity) of a catchment is reached. If the actual rainfall on the
catchment exceeds the runoff threshold value, surface runoff will occur. Depending on the type of
outlet of the catchment (e.g., seasonal river or large river), the point at which flash floods could occur
depends on the effective rainfall on the catchment (i.e., the actual rainfall that occurs after the runoff
threshold has been reached).
Currently, the CREST (Coupled Routing and Excess Storage) distributed hydrological model
developed by the University of Oklahoma and SERVIR NASA [31,32] is routinely being used with a
combination of TMPA observations and rainfall forecasts from the Kenya Meteorological Department
(KMD), in order to generate riverine flood forecasts for Kenya at medium range (up to 10 days in
advance). CREST operates at 1-km spatial and 3-h temporal resolutions and can provide predictions
60 h in advance. CREST is developed to simulate distributed rainfall-runoff and cell-to-cell routing, as
well as coupled runoff generation and is capable of representing soil moisture storage capacity. For
validation, SERVIR Africa currently monitors some 840 individual catchments within Kenya, which
are used for the calibration and validation of CREST for Kenya. The CREST model will be used to
simulate several rainfall scenarios daily, using the actual soil moisture status from the normal runs
(which use the TMPA/KMD forecast). This gives a set of potential FFG values for the following day,
at a 3-h temporal resolution. Matching the actual observed rainfall during the following day with the
simulated run that best approximates the actual rainfall, allows the determination of whether or not a
flash flood will occur during the day. In order to match the temporal resolutions between the rainfall
observations and the FFG values, the three hourly FFG values are interpolated to allow for comparison
to the 15-min rainfall observations.
The authors of [6] point out that a lack of the local calibration of parameters in ungauged basins
will increase the chance of errors in FFG values. Their results indicate that in the case of ungauged
basins, the transposition of complete sets of FFG parameters from neighboring catchments is
preferable over methods that take into account local basin characteristics to derive FFG parameters.
With the 840 gauged catchments for which CREST is routinely being run, the parameter sets for a
significant number of ungauged catchments can be obtained.
ISPRS Int. J. Geo-Inf. 2014, 3 592
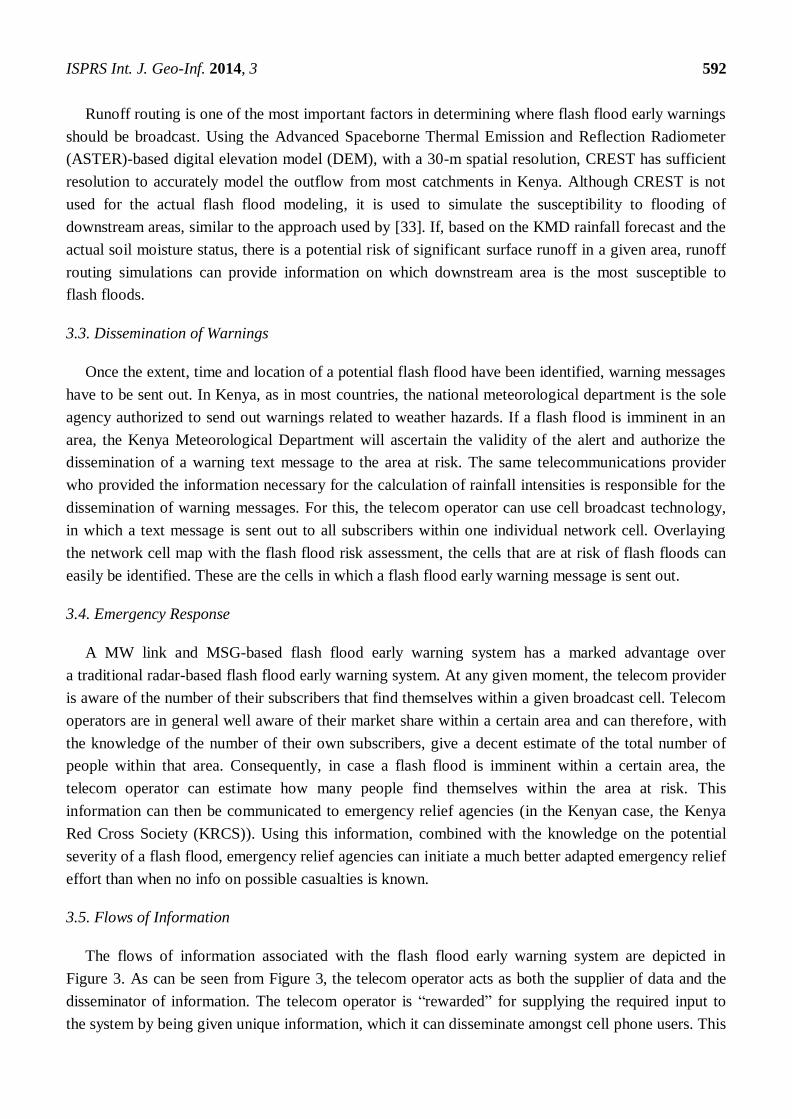
Runoff routing is one of the most important factors in determining where flash flood early warnings
should be broadcast. Using the Advanced Spaceborne Thermal Emission and Reflection Radiometer
(ASTER)-based digital elevation model (DEM), with a 30-m spatial resolution, CREST has sufficient
resolution to accurately model the outflow from most catchments in Kenya. Although CREST is not
used for the actual flash flood modeling, it is used to simulate the susceptibility to flooding of
downstream areas, similar to the approach used by [33]. If, based on the KMD rainfall forecast and the
actual soil moisture status, there is a potential risk of significant surface runoff in a given area, runoff
routing simulations can provide information on which downstream area is the most susceptible to
flash floods.
3.3. Dissemination of Warnings
Once the extent, time and location of a potential flash flood have been identified, warning messages
have to be sent out. In Kenya, as in most countries, the national meteorological department is the sole
agency authorized to send out warnings related to weather hazards. If a flash flood is imminent in an
area, the Kenya Meteorological Department will ascertain the validity of the alert and authorize the
dissemination of a warning text message to the area at risk. The same telecommunications provider
who provided the information necessary for the calculation of rainfall intensities is responsible for the
dissemination of warning messages. For this, the telecom operator can use cell broadcast technology,
in which a text message is sent out to all subscribers within one individual network cell. Overlaying
the network cell map with the flash flood risk assessment, the cells that are at risk of flash floods can
easily be identified. These are the cells in which a flash flood early warning message is sent out.
3.4. Emergency Response
A MW link and MSG-based flash flood early warning system has a marked advantage over
a traditional radar-based flash flood early warning system. At any given moment, the telecom provider
is aware of the number of their subscribers that find themselves within a given broadcast cell. Telecom
operators are in general well aware of their market share within a certain area and can therefore, with
the knowledge of the number of their own subscribers, give a decent estimate of the total number of
people within that area. Consequently, in case a flash flood is imminent within a certain area, the
telecom operator can estimate how many people find themselves within the area at risk. This
information can then be communicated to emergency relief agencies (in the Kenyan case, the Kenya
Red Cross Society (KRCS)). Using this information, combined with the knowledge on the potential
severity of a flash flood, emergency relief agencies can initiate a much better adapted emergency relief
effort than when no info on possible casualties is known.
3.5. Flows of Information
The flows of information associated with the flash flood early warning system are depicted in
Figure 3. As can be seen from Figure 3, the telecom operator acts as both the supplier of data and the
disseminator of information. The telecom operator is “rewarded” for supplying the required input to
the system by being given unique information, which it can disseminate amongst cell phone users. This

ISPRS Int. J. Geo-Inf. 2014, 3 593
has obvious promotional advantages for the telecom operator; they provide a unique service that is not
being provided by any of their competitors and which can potentially save lives.
Figure 3. Flow diagram showing the flows of information that make up the flash flood
early warning system. KMD, Kenya Meteorological Department; FFG, Flash Flood
Guidance; CREST, Coupled Routing and Excess Storage.
In addition to gaining a valuable asset to their early warning capacities, the Kenya Meteorological
Department also gets a considerable increase in their observational capabilities. The rainfall observation
system can potentially act as a proxy for weather radar, without the investment. The rainfall product
can be used for a variety of other applications.

ISPRS Int. J. Geo-Inf. 2014, 3 594
3.6. Quality Control
Before the system is made operational, thorough testing is necessary. Not only do the individual
components have to be robust to fulfil their role within the early warning system, the early warning
system itself needs to be capable of providing accurate, timely information on the location and
intensity of flash floods. As pointed out by [2], false alerts cost money and undermine the credibility of
the organization sending the warning message. In case of doubt and uncertainty about the threat, the
preferable option is to send out a warning message, even if the chance of sending a false alert exists.
However, reducing the number of false alerts to a minimum will increase the effectiveness of an early
warning system.
Therefore, built-in fail-safes are required to ensure the accuracy of the system, notably for the
rainfall observation system. The combination of ground- and satellite-based observations allows for a
certain measure of quality control. Microwave link signals can be disturbed by, e.g., fog. Thick fog can
cause a similar MW signal attenuation as that experienced during heavy rain. Consequently, it can be
hard to distinguish between thick fog and heavy rain from the MW signal data alone. In such cases, the
lack of convective clouds or even the presence of fog within the pixels overlaying the MW link is
observed from the MSG images. In such cases, the rainfall algorithm will “ignore” the erroneous MW
link rainfall values and report zero rainfall.
The accuracy of the flood forecasts in ungauged basins can be improved by including satellite-based
data sets. The authors of [31] used satellite-based forcing parameters to calibrate and initialize CREST
for a catchment in Western Kenya, finding predictions of spatial flood extents. The authors of [34]
reported good results in the estimation of discharge along rivers using their Rating Curve Model. This
model uses altimetry data from the Environmental Satellite (ENVISAT) and the European
Remote-Sensing Satellite 2 (ERS-2). In addition to the satellite-based calibration and validation
methods, some gauged basins will be present in most areas, providing additional possibilities
for validation.
The use of cell broadcast technology significantly increases the effectiveness of warnings, since
only people in the vicinity of a potential flash flood are informed. People who find themselves just
beyond the area at risk, but still receive an alert message, will know that a flash flood has taken place
in their vicinity. Therefore, even if they have not been affected, they will not perceive the early
warning message as a false alert.
4. Conclusions and Outlook
The flash flood early warning system described in this paper is a realistic, fast to implement and
cheap alternative to traditional radar-based flash flood early warning systems for Kenya. The required
technical components, i.e., networks of terrestrial microwave links, geostationary weather observation
satellites (such as MSG) and a widespread availability of mobile telephones amongst the population
for receiving the early warnings, are available in most countries in Africa. Once the rain rate
observation system is fully operational, it operates as a proxy for weather radar. Using flash flood
guidance values, which are calculated daily using the CREST distributed hydrological model, the risk
of flash floods in individual catchments is calculated. Within those areas at risk of flash floods, a

ISPRS Int. J. Geo-Inf. 2014, 3 595
warning text message is broadcast through a cell broadcast text message, targeting only those areas at
risk. Compared to traditional flash flood early warning systems, the public private partnership (notably
the participation of a mobile communications provider), the system described here offers a number of
advantages. First, the system allows for a much targeted dissemination of flash flood alert messages
through cell broadcast SMS text messages. Secondly, the mobile communications providers know at
all times how many mobile subscribers find themselves in each of their network cells. Consequently,
when a flash flood threat is observed, the number of people in the area at risk can be approximated.
This info is communicated to emergency relief services, such as the Kenya Red Cross Society in the
case of Kenya. Information on the potential number of people at risk allows the emergency relief
services to better dimension their emergency response efforts. Finally, the rain rate estimation system
is based on a combination of MSG data with signal strength data from MW links, with the latter
serving as ground truth data. In densely populated areas, i.e., areas where the greatest number of
people could be at risk of floods, more mobile telephones are usually present, and therefore, the
density of MW links will be greatest. Consequently, the accuracy of the rain rate estimates is the
highest in those areas where most people are located.
The operational system will use and produce large amounts of data: microwave signal strength data
from the selected MW links, MSG satellite data from the required channels, parallax corrected MSG
images, quarter hourly countrywide rainfall intensity maps at high spatial resolutions and flood risk
maps, linked to the mobile communications provider’s network infrastructure maps. However, those
data that are of greatest interest to the general public are the maps containing information regarding
imminent flash floods. The data of interest to national meteorological departments, professionals in,
e.g., agriculture and aviation, and scientists are the rainfall intensity maps and, e.g., the parallax
corrected satellite images. Scientists might find use for other intermediate or further processed data
products that originate from the data generated by the algorithm. Any of the products can be exported
in real time, upon request.
Acknowledgments
This study was carried out with support from the Consultative Group on International Agricultural
Research (CGIAR) Research Program on Climate Change, Agriculture and Food Security (CCAFS).
During this study, J.C.B. Hoedjes was financed through CCAFS East Africa.
Author Contributions
JH and BS conceived the study. JH, BS, AK, BM, MS, RB and AS participated in the design of the
study. AL, MM and JNM participated in the data generation and feasibility assessment. JH drafted the
manuscript. JH, BS, BM, AS and AK participated in the revision of the manuscript. All authors read and
approved the final manuscript.
Conflicts of Interest
The authors declare no conflict of interest.

ISPRS Int. J. Geo-Inf. 2014, 3 596
References
1. UNISDR. Economic Losses from Disasters Set New Record in 2012; Press Release UNISDR
2013/05, 14 March 2013. Available online: http://www.unisdr.org/archive/31685 (accessed on
15 March 2013).
2. NOAA. Flash Flood Early Warning System Reference Guide; University Corporation for
Atmospheric Research: Denver, CO, USA, 2010. Available online: http://www.meted.ucar.edu
(accessed on 16 December 2013).
3. Norbiato, D.; Borga, M.; Sangati, M.; Zanon, F. Regional frequency analysis of extreme
precipitation in the eastern Italian Alps and the August 29, 2003 flash flood. J. Hydrol. 2007, 345,
149–166.
4. The Government Office for Science. Foresight Reducing Risks of Future Disasters: Priorities for
Decision Makers; Final Project Report; The Government Office for Science: London, UK, 2012.
5. Marchi, L.; Borga, M.; Preciso, E.; Gaume, E. Characterisation of selected extreme flash floods in
Europe and implications for flood risk management. J. Hydrol. 2010, 394, 118–133.
6. Norbiato, D.; Borga, M.; Degli Esposti, S.; Gaume, E.; Anquetin, S. Flash flood warning based on
rainfall thresholds and soil moisture conditions: An assessment for gauged and ungauged basins.
J. Hydrol. 2008, 362, 274–290.
7. Grabs, W.E. Regional Flash Flood Guidance and Early Warning System. Presented at the
WMO Training for Trainers, Workshop on Integrated Approach to Flash Flood and Flood Risk
Management, Kathmandu, Nepal, 14–28 October 2010. Available online: http://www.wmo.int/
pages/prog/hwrp/rwgh/RA_II/documents/FFGS_FINAL_GRABS.pdf (accessed on 15 March 2013).
8. Liechti, K.; Panziera, L.; Germann, U.; Zappa, M. The potential of radar-based ensemble forecasts
for flash-flood early warning in the southern Swiss Alps. Hydrol. Earth Syst. Sci. 2013, 17,
3853–3869.
9. Vrieling, A.; Sterk, G.; de Jong, S.M. Satellite-based estimation of rainfall erosivity for Africa.
J. Hydrol. 2010, 395, 235–241.
10. Xue, X.; Hong, Y.; Limaye, A.S.; Gourley, J.J.; Huffman, G.J.; Khan, S.I.; Dorji, C.; Chen, S.
Statistical and hydrological evaluation of TRMM-based Multi-satellite Precipitation Analysis over
the Wangchu Basin of Bhutan: Are the latest satellite precipitation products 3B42V7 ready for use
in ungauged basins? J. Hydrol. 2013, 499, 91–99.
11. Heinemann, T.; Latanzio, A.; Roveda, F. The EUMETSAT Multi-Sensor Precipitation
Estimate (MPE). In Proceedings of the 2nd International Precipitation Working Group (IPWG)
Meeting, Madrid, Spain, 2002. Available online: http://oiswww.eumetsat.int/~idds/html/doc/
IPWG_2002_MPE.pdf (accessed on 17 December 2013).
12. Heinemann, T.; Kerényi, J. The EUMETSAT Multi Sensor Precipitation Estimate (MPE):
Concept and Validation. In Proceedings of the 2nd International Precipitation Working
Group (IPWG) Workshop, Monterey, CA, USA, 25–28 October 2004. Available online:
http://www.isac.cnr.it/~ipwg/meetings/monterey-2004/pres/Heinemann/mpef/pdf/EUMETSAT_
UC2003_MPE.pdf (accessed on 17 December 2013).

ISPRS Int. J. Geo-Inf. 2014, 3 597
13. Cotton, W.R.; Bryan, G.H.; van den Heever, S.C. Storm and Cloud Dynamics, 2nd ed.;
International Geophysics Series; Academic Press: Burlington, VT, USA, 2011; Volume 99.
14. Scofield, R.A.; Kuligowski, R.J. Status and outlook of operational satellite precipitation
algorithms for extreme-precipitation events. Weather Forecast. 2003, 18, 1037–1051.
15. Atlas, D.; Ulbrich, C.W. Path- and area-integrated rainfall measurement by microwave attenuation
in the 1–3 cm band. J. Appl. Meteorol. 1977, 16, 1322–1331.
16. Upton, G.J.G.; Holt, A.R.; Cummings, R.J.; Rahimi, A.R.; Goddard, J.W.F. Microwave links:
The future for urban rainfall measurement? Atmos. Res. 2005, 77, 300–312.
17. Messer, H.; Zinevich, A.; Alpert, P. Environmental monitoring by wireless communication
networks. Sci. New Ser. 2006, 312, 713, doi:10.1126/science.1120034.
18. Leijnse, H.; Uijlenhoet, R.; Stricker, J.N.M. Rainfall measurement using radio links from cellular
communication networks. Water Resour. Res. 2007, 43, doi:10.1029/2006WR005631.
19. Zinevich, A.; Alpert, P.; Messer, H. Estimation of rainfall fields using commercial microwave
communication networks of variable density. Adv. Water Resour. 2008, 31, 1470–1480.
20. Overeem, A.; Leijnse, H.; Uijlenhoet, R. Measuring urban rainfall using microwave links from
commercial cellular communication networks. Water Resour. Res. 2011, 47,
doi:10.1029/2010WR010350.
21. Overeem, A.; Leijnse, H.; Uijlenhoet, R. Country-wide rainfall maps from cellular
communication networks. Proc. Natl. Acad. Sci. USA 2013, 110, 2741–2745.
22. Carpenter, T.M.; Sperfslage, J.A.; Georgakakos, K.P.; Sweeney, T.; Fread, D.L. National
threshold runoff estimation utilizing GIS in support of operational flash flood warning systems.
J. Hydrol. 1999, 224, 21–44.
23. Mogil, H.M.; Monro, J.C.; Groper, H.S. NWS’s flash flood warning and disaster preparedness
programs. Bull. Am. Meteorol. Soc. 1978, 59, 690–699.
24. Georgakakos, K.P. Analytical results for operational flash flood guidance. J. Hydrol. 2006, 317,
81–103.
25. GSMA Community Power from Mobile. Safaricom-Kenya-Feasibility Study; GSMA:
Nairobi, Kenya, 2012. Available online: http://www.gsma.com/mobilefordevelopment/
safaricom-kenya-feasibility-study (accessed on 17 December 2013).
26. Yang, S.; Smith, E.A. Convective-stratiform precipitation variability at seasonal scale from 8 Yr
of TRMM observations: Implications for multiple modes of diurnal variability. J. Clim. 2008, 21,
4087–4114.
27. Olsen, R.L.; Rogers, D.V.; Hodge, D.B. The aRb relation in the calculation of rain attenuation.
IEEE Trans. Antennas Propag. 1978, 26, 318–329.
28. Hoedjes, J.C.B.; Maathuis, B.H.P.; Said, M.Y.; Becht, R.; Kooiman, A.; Limo, A.; Mumo, M.;
Nduhiu-Mathenge, J.; Shaka, A.; Su, Z. Towards real-time monitoring of convective rainfall over
Kenya, using terrestrial microwave links and meteosat second generation. Remote Sens. 2014,
in press.
29. Obled, C.H.; Wendling, J.; Beven, K. The sensitivity of hydrological models to spatial rainfall
patterns: An evaluation using observed data. J. Hydrol. 1994, 159, 305–333.
30. Norbiato, D.; Borga, M.; Dinale, R. Flash flood warning in ungauged basins by use of the flash
flood guidance and model-based runoff thresholds. Meteorol. Appl. 2009, 16, 65–75.

ISPRS Int. J. Geo-Inf. 2014, 3 598
31. Wang, J.; Hong, Y.; Li, L.; Gourley, J.J.; Yilmaz, K.; Khan, S.I.; Policelli, F.S.; Adler, R.F.;
Habib, S.; Irwn, D.; et al. The coupled routing and excess STorage (CREST) distributed
hydrological model. Hydrol. Sci. J. 2011, 56, 84–98.
32. Khan, S.I.; Hong, Y.; Wang, J.; Yilmaz, K.K.; Gourley, J.J.; Adler, R.F.; Brakenridge, G.R.;
Policelli, F.; Habib, S.; Irwin, D. Satellite remote sensing and hydrologic modeling for flood
inundation mapping in lake Victoria basin: Implications for hydrologic prediction in ungauged
basins. IEEE Trans. Geosci. Remote Sens. 2011, 49, 85–95.
33. Versini, P.-A.; Gaume, E.; Andrieu, H. Application of a distributed hydrological model to the
design of a road inundation warning system for flash flood prone areas. Nat. Hazards Earth Syst.
Sci. 2010, 10, 805–817.
34. Tarpanelli, A.; Barbetta, S.; Brocca, L.; Moramarco, T. River discharge estimation by using
altimetry data and simplified flood routing modeling. Remote Sens. 2013, 5, 4145–4162.
© 2014 by the authors; licensee MDPI, Basel, Switzerland. This article is an open access article
distributed under the terms and conditions of the Creative Commons Attribution license
(http://creativecommons.org/licenses/by/3.0/).