oo puerto rico aqueduct and sewer authority · puerto rico aqueduct and sewer authority oo...
TRANSCRIPT

U.S. Geological SurveyU.S. Department of the Interior
Prepared in cooperation with thePUERTO RICO AQUEDUCT AND SEWER AUTHORITY
oo
Sedimentation Survey of Lago La Plata, Puerto Rico, October 1998
Water-Resources Investigations Report 00-4045
usesscience for a changing world


U.S. Department of the Interior U.S. Geological Survey
Sedimentation Survey of Lago La Plata, Puerto Rico, October 1998
By Luis R. Soler-Lopez, Richard M.T. Webb, and Ramon A. Carrasquillo-Nieves
Water-Resources Investigations Report 00-4045
In cooperation with the
PUERTO RICO AQUEDUCT AND SEWER AUTHORITY
San Juan, Puerto Rico: 2000

U.S. DEPARTMENT OF THE INTERIOR BRUCE BABBITT, Secretary
U.S. GEOLOGICAL SURVEY Charles G. Groat, Director
Use of trade names in this report is for identification purposes only and does not imply endorsement by the U.S. Government.
For additional information write to:
District Chief U.S. Geological Survey GSA Center, Suite 400-15 651 Federal Drive Guaynabo, Puerto Rico 00965
Copies of this report can be purchased from:
U.S. Geological Survey Branch of Information Services Box 25286 Denver, CO 80225

CONTENTS
Abstract....................................................................................................;........................................................... 1
Introduction......................................................................................._^ 1
Acknowledgments..........................;....................... 2
Dam and reservoir characteristics........................................................................................................................ 2
Method of survey ................................................................................................................................................. 4
Field techniques.........................;................................................................................................................... 4
Data processing.............................................................................................................................................. 5
Actual capacity and sediment accumulation........................................................................................................ 20
Trapping efficiency and sediment yield............................................................................................................... 23
References............................................................................................................................................................ 23
PLATES
[Plates are in pocket]
1. Lago La Plata, Puerto Rico, Bathymetry, October 1998
2. Lago La Plata, Puerto Rico, Bathymetry, March 1974
3. Lago La Plata, Puerto Rico, thickness of sediments deposited from 1974 to 1998
Contents

FIGURES
1.-4. Map showing
1. Location of Lago La Plata in the Rio de La Plata Basin, Puerto Rico..................................................... 3
2. Planned cross-section locations for the October 1998 bathymetric survey ofLago La Plata, Puerto Rico................................................................................................................... 6
3. Actual track lines of the October 1998 bathymetric survey of Lago La Plata,Puerto Rico........................................................................................................................................... 7
4. Reference distances for longitudinal profiles of Lago La Plata, Puerto Rico,during the October 1998 bathymetric survey....................................................................................... 8
5. Selected cross sections generated from the TIN surface model of Lago La Plata,Puerto Rico, for 1974 and 1998................................................................................................................. 9
6. Comparison of longitudinal profiles for 1974 and October 1998 along the Rio deLa Plata, Rio Canas, and Rio Guadiana branches of Lago La Plata, Puerto Rico..................................... 19
7. Capacity curves for Lago La Plata, Puerto Rico, for 1974 and 1998............................................................. 21
TABLES
1. Principal characteristics of Lago La Plata and La Plata Dam, Puerto Rico ................................................... 2
2. Summary of the original and recent sedimentation surveys of Lago La Plata,Puerto Rico................................................................................................................................................. 20
3. Storage capacity for Lago La Plata, Puerto Rico, 1998.................................................................................. 22
IV Contents

CONVERSION FACTORS, DATUMS, and ACRONYMS
Multiply
centimetermeter
kilometer
square metersquare kilometersquare kilometer
cubic metermillion cubic meters
cubic meter
cubic meter per secondcubic meter per secondcubic meter per second
gram per cubic centimeterkilgram per square kilometer
megagram per square kilometer
ByLength0.03281
3.281
0.6214
Area10.76
0.3861
247.1
Volume35.31
810.7
0.0008107
Volume per unit time (includes flow)35.31
15,850
22.83
Mass per area (includes sediment yield)62.43
0.002855
2.855
To obtain
foot*footmile
square footsquare mileacre
cubic footacre-footacre-foot
cubic feet per secondgallon per minutemillion gallons per day
pound per cubic footton per square mile
ton per square mile
Datums
Horizontal Datum - Puerto Rico Datum, 1940 Adjustment
Vertical Datum - National Geodetic Vertical Datum 1929 (NGVD 1929)
Acronyms used in this report
BLASS Bathymetric/Land Survey System
DGPS Differential Global Positioning System
GIS Geographic Information System
PRASA Puerto Rico Aqueduct and Sewer Authority
TIN Triangulated Irregular Network
USGS U.S. Geological Survey
Contents


Sedimentation Survey of Lago La Plata, Puerto Rico, October 1998
R. Soler-Lopez, Richard M.T. Webb, am/Ramon A. Carrasquillo-Nieves
Abstract
Sediment accumulation has decreased the storage capacity of Lago La Plata from 40.21 million cubic meters in 1974 to 35.46 million cubic meters in 1998. In 24 years, the reservoir has lost about 12 percent of its original capacity, which represents an average annual capacity loss of about 0.5 percent. The trapping efficiency of the reservoir was estimated to be 85 percent in
1998. Based on the amount of accumulated sediment in the reservoir and on the 466-square- kilometer sediment-contributing area, the sediment yield of the Lago La Plata Basin was estimated to be about 483 megagrams per square kilometer per year. At a current average capacity loss per year of 0.2 million cubic meters and assuming a constant trapping efficiency, the reservoir is expected to completely fill with sediments by the year 2175.
On September 21,1998, Hurricane Georges made landfall on the island of Puerto Rico. A comparison of data collected in February and in October 1998 revealed the impact of the storm along the riverine branches of the reservoir bottom. Flooding that resulted from Hurricane Georges mobilized sediments deposited in upstream sections of Lago La Plata and transported them downstream to the deeper parts of the reservoir near the dam.
INTRODUCTION
The Puerto Rico Aqueduct and Sewer Authority (PRASA) operates the San Juan Metropolitan Water District, which consists of a series of reservoirs that provide water for domestic and industrial use to the San Juan metropolitan area and adjacent areas. Some of the major reservoirs include Lago Loiza, Lago de Cidra, and Lago La Plata. Of these, Lago La Plata provides about 35 percent of the total demand, which
is equivalent to 3.07 cubic meters per second or about 70 million gallons per day (Fernando Ortiz, PRASA, oral commun., 1998). Since construction of the reservoir in 1974, the storage capacity of Lago La Plata has decreased as a result of land erosion from runoff and agricultural and urban land-use practices that occur in the reservoir basin.
To determine the present storage capacity of the reservoir, the U.S. Geological Survey (USGS) in cooperation with the PRASA conducted a bathymetric survey of Lago La Plata. Data were collected in October 1998 by using a bathymetric land/survey system (BLASS). Data on geographic position and water depth were acquired simultaneously by using a differential global positioning system (DGPS) coupled to a depth sounder; collected data were stored in both digital and analog forms. The digital data were subsequently transferred into a geographic information system (GIS) data base for processing and analysis. The existing storage capacity, sedimentation rates, and sediment accumulation and location were calculated by using GIS software.
Introduction

The purpose of this report is to provide the PRASA with the necessary information about the existing storage capacity and sedimentation rate of the reservoir. This information will help PRASA in managing effectively the available water resources of Lago La Plata.
Acknowledgments
The bathymetric survey of Lago La Plata was the result of a cooperative effort between the USGS and the PRASA. Fernando Ortiz, the engineer in charge of the operation at Lago La Plata, provided personnel and equipment to assist in efforts to navigate in areas of the reservoir where water-hyacinth (eichhornia crassipes) accumulation was dense. Mr. Ortiz also provided important information regarding reservoir structures and operational procedures. The USGS personnel from the Caribbean District who were involved in some phases of the project included hydrologic technicians, Carlos Santos and Gilberto Rodriguez, as well as hydrologists Richardo Vachier and Juan Trias
DAM AND RESERVOIR CHARACTERISTICS
La Plata Dam is a concrete gravity structure located on the Rio de La Plata, which is about 5 kilometers south of the town of Toa Alta and 5 kilometers north of the town of Naranjito (fig. 1).
The reservoir, which was built in 1974 as part of the San Juan Metropolitan Water District, originally provided 26.84 million cubic meters of storage capacity at the spillway elevation of 47.12 meters above mean sea level. The dam was constructed with a gravity overflow-type spillway, and had provisions for the future installation of bascule gates. To help meet the increasing water demand of the San Juan metropolitan area and adjacent areas, six 4.88-meters- high bascule gates were installed in 1989, which raised the normal pool elevation to 52.0 meters above mean sea level. This rise in pool elevation increased the storage capacity of the reservoir by an additional 13.37 million cubic meters resulting in a total storage capacity of 40.21 million cubic meters.
The dam has a total length of 235.92 meters and a maximum height of 40.0 meters above the river channel. The spillway crest is 210.30 meters long and has an elevation of 47.12 meters above mean sea level. An intake and pumping-station structure, which forms an integral part of the dam, is located at the center of the preexisting river channel. Four spillway bays are located to the right of the intake structure and two bays are located to the left. The intake structure has six 1.82-meter-diameter intake ports along the upstream face that are vertically spaced 6 meters apart and range in elevation from 19.0 to 49.0 meters above mean sea level (PREPA, 1979). The principal characteristics of Lago La Plata and La Plata Dam are listed in table 1.
Table 1. Principal characteristics of Lago La Plata and La Plata Dam, Puerto Rico (Modified from the Puerto Rico Electric Power Authority, 1979)
[Elevations in meters above mean sea level]
Total length of dam...................................................................................................235.92 meters
Length of spillway structure.....................................................................................210.30 meters
Elevation of spillway crest.........................................................................................47.12 meters
Normal pool elevation..................................................................................................52.0 meters
Elevation of top of dam................................................................................................57.0 meters
Maximum height of dam above the river channel........................................................40.0 meters
Maximum original depth at pool elevation of 52.0 meters...........................................34.0 meters
Maximum depth during the 1998 survey......................................................................27.0 meters
Drainage area at dam site..........................................................................469.0 square kilometers
2 Sedimentation Survey of Lago La Plata, Puerto Rico, October 1998

66°15'
18°30'
18°15'
ATLANTIC OCEAN
66°06'33'
SAN JUAN
012345 KILOMETERS
012345 MILES
EXPLANATION
/ DAM
0430 ^ STREAM FLOW GAGING STATIONAND NUMBER
50045000* LAKE-LEVEL STATION AND NUMBER
TOWN OR CITY
DRAINAGE BASIN BOUNDARY
Figure 1. Location of Lago La Plata in the Rio de La Plata Basin, Puerto Rico.
Dam and Reservoir Characteristics 3
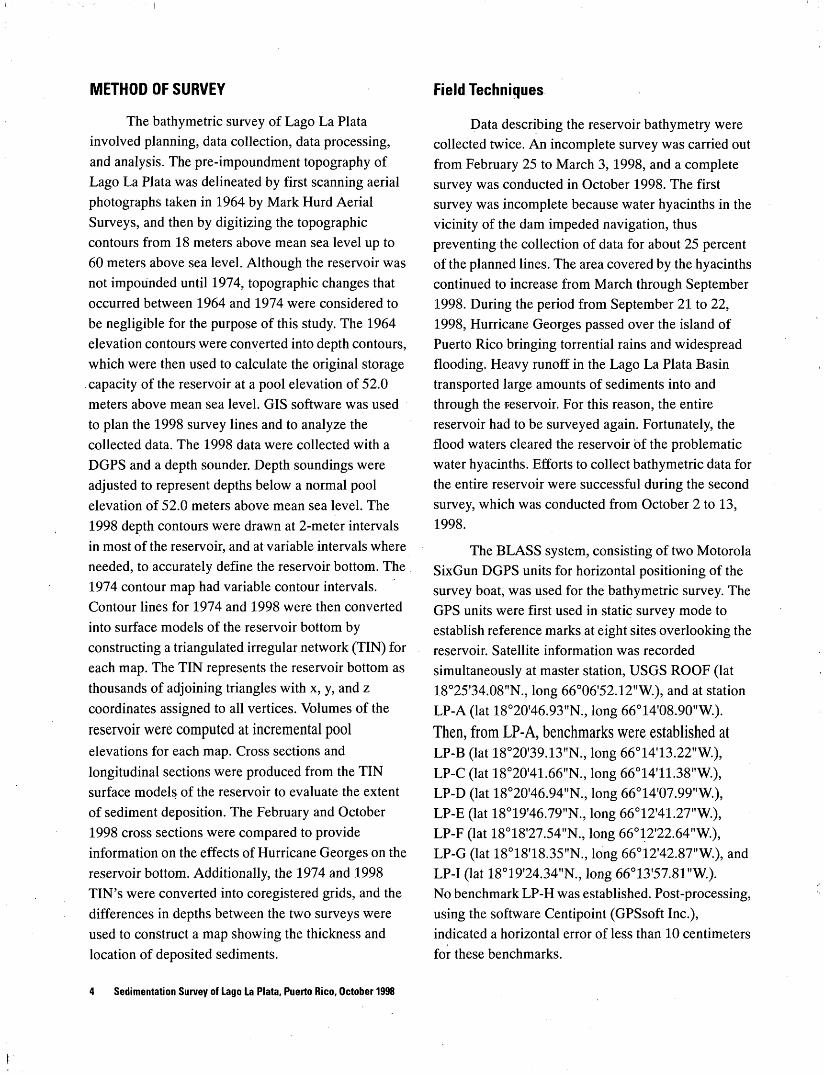
METHOD OF SURVEY Field Techniques
The bathymetric survey of Lago La Plata involved planning, data collection, data processing, and analysis. The pre-impoundment topography of Lago La Plata was delineated by first scanning aerial photographs taken in 1964 by Mark Kurd Aerial Surveys, and then by digitizing the topographic contours from 18 meters above mean sea level up to 60 meters above sea level. Although the reservoir was not impounded until 1974, topographic changes that occurred between 1964 and 1974 were considered to be negligible for the purpose of this study. The 1964 elevation contours were converted into depth contours, which were then used to calculate the original storage capacity of the reservoir at a pool elevation of 52.0 meters above mean sea level. GIS software was used to plan the 1998 survey lines and to analyze the collected data. The 1998 data were collected with a DGPS and a depth sounder. Depth soundings were adjusted to represent depths below a normal pool elevation of 52.0 meters above mean sea level. The 1998 depth contours were drawn at 2-meter intervals in most of the reservoir, and at variable intervals where needed, to accurately define the reservoir bottom. The 1974 contour map had variable contour intervals. Contour lines for 1974 and 1998 were then converted into surface models of the reservoir bottom by constructing a triangulated irregular network (TIN) for each map. The TIN represents the reservoir bottom as thousands of adjoining triangles with x, y, and z coordinates assigned to all vertices. Volumes of the
reservoir were computed at incremental pool elevations for each map. Cross sections and longitudinal sections were produced from the TIN surface models of the reservoir to evaluate the extent of sediment deposition. The February and October 1998 cross sections were compared to provide information on the effects of Hurricane Georges on the reservoir bottom. Additionally, the 1974 and 1998 TIN's were converted into coregistered grids, and the differences in depths between the two surveys were used to construct a map showing the thickness and location of deposited sediments.
Data describing the reservoir bathymetry were collected twice. An incomplete survey was carried out from February 25 to March 3, 1998, and a complete survey was conducted in October 1998. The first survey was incomplete because water hyacinths in the vicinity of the dam impeded navigation, thus preventing the collection of data for about 25 percent of the planned lines. The area covered by the hyacinths continued to increase from March through September 1998. During the period from September 21 to 22, 1998, Hurricane Georges passed over the island of Puerto Rico bringing torrential rains and widespread flooding. Heavy runoff in the Lago La Plata Basin transported large amounts of sediments into and through the reservoir. For this reason, the entire reservoir had to be surveyed again. Fortunately, the flood waters cleared the reservoir of the problematic water hyacinths. Efforts to collect bathymetric data for the entire reservoir were successful during the second survey, which was conducted from October 2 to 13, 1998.
The BLASS system, consisting of two Motorola SixGun DGPS units for horizontal positioning of the survey boat, was used for the bathymetric survey. The GPS units were first used in static survey mode to establish reference marks at eight sites overlooking the reservoir. Satellite information was recorded simultaneously at master station, USGS ROOF (lat 18°25'34.08 tIN., long 66°06'52.12"W.), and at station LP-A (lat 18°20'46.93"N., long 66°14'08.90"W.).
Then, from LP-A, benchmarks were established at LP-B (lat 18 020'39.13"N., long 66°14'13.22"W.), LP-C (lat 18°20'41.66"N., long 66°14t 11.38"W.), LP-D (lat 18°20'46.94"N., long 66°14'07.99"W.), LP-E (lat 18°19'46.79"N., long 66°12'41.27"W.), LP-F (lat 18°18'27.54"N., long 66°12'22.64"W.), LP-G (lat 18°18'18.35"N., long 66°12'42.87"W.), and LP-I (lat 18°19'24.34"N., long 66°13'57.81"W.). No benchmark LP-H was established. Post-processing, using the software Centipoint (GPSsoft Inc.), indicated a horizontal error of less than 10 centimeters for these benchmarks.
4 Sedimentation Survey of Lago La Plata, Puerto Rico, October 1998

Once established, the benchmark with the best view of the survey area was occupied as the DGPS master station while the other DGPS unit was installed in the survey boat. The DGPS on board the survey boat independently received a position once every second. Once every 5 seconds, the master station sent a set of correction signals to the mobile unit to maintain horizontal positional accuracy to within 2 meters.
Reservoir depths were measured by using a RAYTHEON model DE-719B echosounder coupled to an ODOM DIGITRACE to record data in analog and digital form. The depth sounder measured depth to an accuracy of 5 centimeters, and was calibrated by using a bar-check near surface and near bottom depths while anchored in the deepest area to be surveyed. The bathymetric survey software application HYPACK (Coastal Oceanographic, Inc.) was used to record position and depth once every second while in survey mode. HYPACK runs on a portable computer and is used to navigate and record data. Survey data were to be collected at 324 planned transects spaced about 50 meters apart, starting at the dam and continuing to the upstream limits of^the reservoir (fig. 2).
The planned lines failed to include some areas of the reservoir since no maps showing the lake shore at the elevation of 52.0 meters above mean sea level were readily available during the planning stages. Therefore, no lines were planned or surveyed in the upstream flooded area of the Rio Guadiana Branch. Figure 3 shows the actual track lines of the October 1998 bathymetric survey. Hand soundings from two bridges in the upstream reaches of the Rio Guadiana Branch were made to provide control for contour lines drawn for that area of the reservoir. The reservoir pool elevation during the entire survey was continuously monitored at USGS lake-level station Lago La Plata at Damsite near Toa Alta no. 50045000 (fig. 1).
Data Processing
Initial editing to verify geographic positions and depth data was performed by using the HYPACK (Coastal Oceanographic, Inc.) program. Data were corrected to eliminate erroneous positions that could appear when the master station correction signal was lost for some period of time, and when spurious depth readings were erroneously collected because of insufficient signal gain or bubble interfence with the transducer. The pool elevation during the data collection varied. To adjust the depth data to the normal pool elevation (52.0 meters above mean sea level), a time-elevation correction factor was applied. The edited data were then transferred into the GIS data base. The software was customized by color coding the data points with different colors according to the different depth values. Then, contour lines were added by connecting the data points of the same color.
The contour maps (plates 1 and 2) were used to create the TIN surface models of the 1974 and 1998
reservoir bottoms, respectively. Distances upstream from the dam were calculated along the thalweg of the river branches of the reservoir (fig. 4). Selected cross sections and three longitudinal profiles along the different branches of the reservoir were generated from the TIN surface models of the reservoir and are presented in figures 5 and 6, respectively. The selected cross sections shown in figure 5 start with section 1 at the dam and continue upstream at a spacing ranging from about 200 to 400 meters apart. Sections were located following a pattern that included all flooded areas of the reservoir. The longitudinal profiles shown in figure 6 were located along the thalweg of the three different major tributary branches of the reservoir.
Method of Survey

66°15'00" 66°14'00" 66°13'00" 66°12'00"
18°20'00"
18° 19'00"
18°18'00'
18°17'00"
Planned cross sections and identification number for the1998 bathymetric survey
Figure 2. Planned cross-section locations for the October 1998 bathymetric survey of Lago La Plata, Puerto Rico.
[Shoreline shown at spillway elevation of 47.12 meters above mean sea level.]
6 Sedimentation Survey of Lago La Plata, Puerto Rico, October 1998

66°15'00" 66° 14'00" 66°13'00" 66° 1 ZOO"
18°20'00"
18°19'00"
18°18'00" -
Dam
0 400 METERS
0 1,250 FEET
EXPLANATION
s- Track lines where data were collected
Random data collated
Hand soundings
Figure 3. Actual track lines of the October 1998 bathymetric survey of Lago La Plata, Puerto Rico.
[Shoreline shown at normal pool elevation of 52.0 meters above mean sea level.]
Method of Survey 7

66° 15'00" 66°14'00" 66°13'00" 66°12'00"
18°20'00" -
18°19'00" -
18°18'00"
Dam
EXPLANATIONDistance from the dam, in meters,
^ f°r the R'° cle La Plata. Rio Guadiana, ' Rio Canas, and northern branches of
Lago La Plata
Figure 4. Reference distances for longitudinal profiles of Lago La Plata, Puerto Rico, during the October 1998 bathymetric survey.
[Shoreline shown at normal pool elevation of 52.0 meters above mean sea level. Refer to figure 6 for longitudinal profiles.]
8 Sedimentation Survey of Lago La Plata, Puerto Rico, October 1998

LU
111
SCO
1LU
§CO< coQC LU
tu
CMin u_ O
ill HI
O O o_
cc o
HI COCOo:HI
LJJ
CL LU Q
10
20
30
40
SECTION 1
10
20
30
40
i I i i i i
SECTION 7
10
20
30
40
SECTION 16
OCT 1998
1974
50 100 150 200 ' 250 300 350 400 450 500 VERTICAL EXAGGERATION X 3.5
DISTANCE FROM THE LEFT BANK, IN METERS
Figures. Selected cross sections generated from the TIN surface model of Lago La Plata, Puerto Rico, for 1974 and 1998.
[Refer to figure 2 for cross-section locations.]
Method of Survey 9

LLJ >LLJ
LLJ CO
10
20LLJ
O 30 CD
40
CO
LJJ
LLJ^ 0qc\i 10LLO 10zo< 20
LLJ
111
SECTION 28
30
< 40
cc O
LLJ 10 CQ 1U
CO CC LLJ
20
SECTION 38
30
Q. LJJ Q
40
SECTION 46
OCT1998
FEB 1998
1974
50 100 150 200 250 300
DISTANCE FROM THE LEFT BANK, IN METERS
350 400 450 500 VERTICAL EXAGGERATION X 3.5
Figure 5. Selected cross sections generated from the TIN surface model of Lago La Plata, Puerto Rico, for 1974 and 1998 Continued.
[Refer to figure 2 for cross-section locations. The February 1998 cross sections were generated from field-collected data.]
10 Sedimentation Survey of Lago La Plata, Puerto Rico, October 1998

HI
LU
10
COzLU 20
LU
I 30
CO DC LU
LU
CMinLJLO
1LU_lOoQ_
40
10
20
SECTION 56
30
40
I I I I I i I I r
SECTION 62
CC O
LUmCOccLU
LU
10
20
30
Q. LU Q
40
SECTION 72
OCT 1998
FEB 1998
1974
50 100 150 200 250 300 350 400 450 500
VERTICAL EXAGGERATION X 3.5
DISTANCE FROM THE LEFT BANK, IN METERS
Figure 5. Selected cross sections generated from the TIN surface model of Lago La Plata, Puerto Rico, for 1974 and 1998 Continued.
[Refer to figure 2 for cross-section locations. The February 1998 cross sections were generated from field-collected data.]
Method of Survey 11

LLJ
< 10HICO
LLJ 20
LLJsCO<CO DC LLJ
Isp c\i
30
40
-| 1 I IT-1 | I I I I | I I I I-
SECTION 87
10
>LLJ
LLJ_l OO Q_
20
30
40
SECTION 102
DC O
3LLJ COCO DC LLJ
10
2°
30
tLLJ Q
SECTION 116
OCT 1998
FEB 1998
- 1974
4050 100 150 200 250 300 350 400 450 500
VERTICAL EXAGGERATION X 3.5
DISTANCE FROM THE LEFT BANK, IN METERS
Figure 5. Selected cross sections generated from the TIN surface model of Lago La Plata; Puerto Rico, for 1974 and 1998 Continued.
[Refer to figure 2 for cross-section locations. The February 1998 cross section's were generated from field-collected data.]
12 Sedimentation Survey of Lago La Plata, Puerto Rico, October 1998

LLJ
HI_l
35 10 CO
UJ 20
LLJ >oCQ 30
COCC
40
I''''I''''I''''I''''I'^^
SECTION 168
LLJ
CMin
10
> 20LJJ_l LU _l O 30OQ_
^ 40CCi «gHI 10 CDCO CC LUI- 20 LLJ
- 30
I ' '' ' I ' ' ' ' i ' ' ' n \ ' ' ' ' I ' ' '
SECTION 178
CL LLJ Q
40
SECTION 193
OCT 1998
FEB 1998
- 1974
50 100 150 200 250 300 350 400 450 500
VERTICAL EXAGGERATION X 3.5
Figures. Selected cross sections generated from the TIN surface model of Lago La Plata, Puerto Rico, for 1974 and 1998 Continued.
[Refer to figure 2 for cross-section locations. The February 1998 cross sections were generated from field-collected data.]
Method of Survey .13

HIa isCO
<LU
LU§CO
COor HILUsq cvi
1LU_Jo oQ_
10
20
30
40
10
20
30
cc oz
ILU DOCOcrLU
LJJ
40
10
20
.- 30
4050 100 150 200 250 300
SECTION 206
SECTION 265
SECTION 269
OCT1998
FEB 1998
1974
, i , ,350 400 450 500
VERTICAL EXAGGERATION X 3.5
DISTANCE FROM THE LEFT BANK, IN METERS
Figure 5. Selected cross sections generated from the TIN surface model of Lago La Plata, Puerto Rico, for 1974 and 1998 Continued.
[Refer to figure 2 for cross-section locations. The February 1998 cross sections were generated from field-collected data.]
14 Sedimentation Survey of Lago La Plata, Puerto Rico, October 1998

LU
LU
< 10LUCOzLU 20
LU
O CO
DC LU
30
40
SECTION 278
CM If)
O 10
< 20
LU_J LU
O 30
O Q-
i 40oc Q o
LU 10 COCO CC[^ 20 LU
- 30
SECTION 286
Q_ LU Q 40
SECTION 290
OCT1998
FEB 1998
1974
i . , . , i . , . , i , , . , i . , . . i , , . , i . , , , i , , . , i , , , , i , , , , 50 .100 150 200 250 300 350 400 450 500
VERTICAL EXAGGERATION X 3.5DISTANCE FROM THE LEFT BANK, IN METERS
Figure 5. Selected cross sections generated from the TIN surface model of Lago La Plata, Puerto Rico, for 1974 and 1998 Continued.
[Refer to figure 2 for cross-section locations. The February 1998 cross sections were generated from field-collected data.]
Method of Survey 15

LJJ
LJJ
isco
LJJ 20
LJJ
DO 30
CO CCU 40
LJJ
^ 0q c\i
u_ O 10
i ' ' ' ' i ' ' ' ' i ' ' ' 'i ' ''' i ' '''i ' ''' i ' ' '
SECTION 295
O H
LJJ LU
20
_ O 30O Q_
^ 40CC.o 0 ~z.
ILJJ 10m coDC LJJ h- 20
,-- 30
SECTION 300
Q_ LJJ Q
40
SECTION 302
OCT1998
FEB 1998
- 1974
I i . i i I i50 100 150 200 250 300 350 400 450 500
VERTICAL EXAGGERATION X 3.5
DISTANCE FROM THE LEFT BANK, IN METERS
Figure 5. Selected cross sections generated from the TIN surface model of Lago La Plata, Puerto Rico, for 1974 and 1998 Continued.
[Refer to figure 2 for cross-section locations. The February 1998 cross sections were generated from field-collected data.]
16 Sedimentation Survey of Lago La Plata, Puerto Rico, October 1998

LU >LU_l< 10LLICOZ < UJ 20
LU
OCO
COor LULU
p cvi
-- 30
40
SECTION 306
10
> 20UJ_iUJ_lO 30 OQ_
40
SECTION 312
cc O
UJ 10 COCOor LUh- 20 LU
- 30
40
SECTION 319
OCT 1998
FEB 1998
- 1974
50 100 150 200 250 300 350 400 450 500
VERTICAL EXAGGERATION X 3.5 DISTANCE FROM THE LEFT BANK, IN METERS
Figure 5. Selected cross sections generated from the TIN surface model of Lago La Plata, Puerto Rico, for 1974 and 1998 Continued.
[Refer to figure 2 for cross-section locations. The February 1998 cross sections were generated from field-collected data.]
Method of Survey 17

HI
HI
LU 20
LU
CQ 30
COtrH LU
40
SECTION 127
C\JinLLO 10z g> 20LJJ_J LU _l O 30OQ_
\-------
40
SECTION 140
cci
COor LU
20
jf 30
tLU Q
40
SECTION 155
OCT 1998
FEB 1998
- 1974
50 100 150 200 250 300 350 400 450 500VERTICAL EXAGGERATION X 3.5
DISTANCE FROM THE LEFT BANK, IN METERS
Figure 5. Selected cross sections generated from the TIN surface model of Lago,La Plata, Puerto Rico, for 1974 and 1998 Continued.
[Refer to figure 2 for cross-section locations. The February 1998 cross sections were generated from field-collected data.]
18 Sedimentation Survey of Lago La Plata, Puerto Rico, October 1998

p
oCN m
10
>
20
LU _l
HI
O
30
O CL
40
_ _ _ _ _ J
Rl'O
CA
NA
S B
RA
NC
H
RIO
GU
AD
IAN
A B
RA
NC
H
1998
~
19
74
Q
02,0
00
4,0
00
6,0
00
8,0
00
DIS
TA
NC
E U
PS
TR
EA
M F
RO
M T
HE
DA
M,
IN M
ET
ER
S
10,0
00
12,0
00
VE
RT
ICA
L S
CA
LE
GR
EA
TL
Y E
XA
GG
ER
AT
ED
Figu
re 6
. C
ompa
rison
of l
ongi
tudi
nal p
rofil
es fo
r 19
74 a
nd O
ctob
er 1
998
alon
g th
e Ri
o de
La
Plat
a, R
io C
afia
s, a
nd R
io G
uadi
ana
Bra
nche
s of
Lag
o La
Pla
ta,
Pue
rto R
ico.

ACTUAL CAPACITY AND SEDIMENT ACCUMULATION
The original storage capacity of Lago La Plata was calculated to be 40.21 million cubic meters in 1974 at a pool elevation of 52.0 meters above mean sea level. By October 1998, the storage capacity of the reservoir had decreased to 35.46 million cubic meters. This represents a reduction of 4.75 million cubic meters or 12 percent in 24 years. The reservoir is losing capacity at an average rate of 0.2 million cubic meters per year or 0.5 percent per year. Data from the original 1974 and recent 1998 surveys of Lago La Plata are summarized in table 2. In the vicinity of the dam, a layer averaging about 7 meters of sediment has accumulated in 24 years (plate 3). This is equivalent to a long-term deposition rate of about 0.3 meters of sediment per year.
The location and thickness of sediments deposited from 1974 to 1998 vary throughout the reservoir (plate 3). In the Rio de La Plata Branch of the reservoir, an average of about 4 meters of sediment has been deposited (fig. 5, sections 62 to 206). In the Rio Canas Branch, an average of about 6 meters of sediment has been deposited (fig. 5, sections 265 to 278). In the Rio Guadiana Branch, an average of about 5 meters of sediment has been deposited (fig. 5, sections 286 to 300). Figure 5 also compares cross sections generated from partial data collected during February 1998 with the 1998 TIN-generated cross sections. High water velocities during flood events result in variable scour and fill areas in the upstream shallow areas of the reservoir. From the comparison of the February and October 1998 cross sections, the data indicate that the flood caused by Hurricane Georges mobilized and deposited sediments into downstream areas closer to the reservoir dam.
Table 2. Summary of the original and recent sedimentation surveys of Lago La Plata, Puerto Rico
[ , not applicable]
Total capacity, in million cubic meters
Live storage, in million cubic meters
Dead storage, in million cubic meters
Sediment accumulated, in million cubic meters
Storage loss, in percent
Average annual loss of capacity, in million cubic meters
Average annual loss of capacity, in percent
Year that the reservoir is projected to be filled with sediments
Sediment yield of the basin, in megagrams per square kilometer per year
Trapping efficiency, in percent
1974
40.21
39.46 1
0.75 1
0
0
0
0
90
1998
35.46
17.802
17.662
4.75
12
0.2
0.5
21753
4834
85
1 Using the lowest intake structure elevation of 19.0 meters above mean sea level.2 Using the lowest operational intake structure elevation of 31.0 meters above mean sea level.3 Assuming a constant trapping efficiency.4 Assuming a dry bulk density of 1 gram per cubic centimeter.
20 Sedimentation Survey of Lago La Plata, Puerto Rico, October 1998

The Lago La Plata Dam has six intake structures at elevations of 19.0, 25.0, 31.0, 37.0, 43.0, and 49.0 meters above mean sea level. According to the 1998 data, the lower intake may be buried by accumulated sediment. Also, the 25.0-meters elevation intake may be in danger of becoming disabled since the reservoir bottom in the dam area has reached an elevation of 25.0-meters above mean sea level. Longitudinal profiles representing the reservoir bottom and generated from the TIN surface models of Lago La Plata along the different branches of the reservoir are shown in figure 6.
Capacity curves for 1974 and 1998 (fig. 7) were generated from the TIN surface models of the reservoir bottom by calculating the reservoir volume at 1-meter intervals of pool elevation. The curves show the relation between the pool elevation and the reservoir volume. The data indicate that the reservoir has less volume in 1998 than in 1974 at any given elevation, indicating storage capacity loss. Table 3 shows the tabulated data from which the 1998 curve in figure 7 was generated.
LU
LU
LU 05
zLU ^ LU
O CO
05orLU
LU
<LU_l LU
60.0
50.0
40.0
30.0
20.0
10.0
0.0
Spillway elevation = 52.0 meters above mean sea level
19741998
5 10 15 20 25 30 35
CAPACITY, IN MILLION CUBIC METERS
Figure 7. Capacity curves for Lago La Plata, Puerto Rico, for 1974 and 1998.
40 45
Actual Capacity and Sediment Accumulation 21

Table 3. Storage capacity for Lago La Plata, Puerto Rico, 1998
[amsl, above mean sea level]
Elevation, in meters amsl
52.0
51.0
50.0
49.0
48.0
47.0
46.0
45.0
44.0
43.0
42.0
41.0
40.0
39.0
38.0
37.0
36.0
35.0
34.0
33.0
32.0
31.0
30.0
29.0
28.0
27.0
26.0
25.0
Capacity, in million cubic meters
35.46
32.48
29.63
26.97
24.44
22.11
19.90
17.86
15.93
14.20
12.57
11.09
9.71
8.48
7.33
6.30
5.33
4.46
3.66
2.95
2.31
1.77
1.26
0.85
0.50
0.27
0.06
0.00
22 Sedimentation Survey of Lago La Plata, Puerto Rico, October 1998

TRAPPING EFFICIENCY AND SEDIMENT YIELD
Rapid sediment accumulation in many upland reservoirs underscores the need to estimate erosion rates. An erosion rate can be calculated by determining the trapping efficiency of the reservoir. Heinemann (1981) considered trap efficiency as the single most informative descriptor of a reservoir. A number of empirical studies have been carried out on trapping efficiency, of which, the best known and most commonly used is that of Brune (1953). For this reason, the Lago La Plata trapping efficiency was estimated using the capacity/inflow ratio described by Brune in 1953.
Long-term average rainfall in the Lago La Plata Basin is 1.88 meters per year, and the rainfall to runoff ratio is 0.33 (Giusti and Lopez, 1967). Thus, the mean annual runoff reaching Lago La Plata was calculated to be 0.62 meters per square kilometer (1.88 x.33) with the remainder of the rainfall infiltrating into the ground and being evapotranspirated. Based on the 469-square kilometers basin, the inflow to the reservoir is 290.78 million cubic meters per year. Using capacity/inflow ratios of 0.14 (40.21/290.78) and 0.12 (35.46/290.78), the trapping efficiency of the reservoir was estimated to be 90 percent in 1974 and 85 percent in 1998. The average long-term trapping efficiency of the reservoir for that 24-year period was 88 percent.
Sediment yield has been defined by the American Society of Civil Engineers as the total sediment outflow from a catchment or drainage basin measurable at a point of reference for a specified period of time (McManus and Duck, 1993). Based on this definition, the estimated sediment yield of the Lago La Plata Basin was determined by dividing the amount of sediment accumulated in the reservoir (4.75 million cubic meters) by the average long-term trapping efficiency of the reservoir (0.88); the estimated net volume of sediment eroded from within the basin was calculated to be 5.4 million cubic meters. The net sediment volume then was divided by the sediment-contributing drainage area of the basin, which was 466 square kilometers (for example, the 469-square kilometers total drainage area minus the 3 square kilometers surface area of the reservoir), and the number of years since impoundment (24 years). Assuming a dry bulk density of 1 gram per cubic centimeter, the estimated sediment yield for the Lago
La Plata Basin was determined to be 483 megagrams per square kilometer per year.
This estimated yield is most likely a minimum yield for the basin. The calculations do not take into account sediment volumes that pass over the dam during peak-flow events or volumes trapped by reservoirs such as Lago Carite, Represa Comerio , and Represa Comerio 2 (fig.l).
Lago Carite is located in the upper part of the Rio de La Plata Basin. The reservoir occupies only a small portion of the basin, and therefore, the amount of trapped sediment is presumably small, since the reservoir drainage area is not only limited in extent, but also is a national forest reserve where land erosion is minimal. Located about 4 kilometers above the Lago La Plata backwater, Represa Comerio 1 and Represa Comerio 2 are low-capacity reservoirs built in 1907 and 1913, respectively. By the time Lago La Plata was impounded in 1974, both reservoirs were completely or almost completely filled with sediment, thus making additional sediment trapping by these reservoirs minimal to negligible.
REFERENCES
Brune, G.M., 1953, Trap efficiency of reservoirs: Transactions of the American Geophysical Union, v. 34, no. 3, p. 407-418.
Giusti, E.V., and Lopez, M.A., 1967, Climate and streamflow of Puerto Rico: Caribbean Journal of Science, v. 7 no. 3-4, September-December 1967, p. 87-93.
Heinman, H.G., 1981, New sediment trap efficiency curve for small reservoirs: Water Resources Bulletin 7, p. 825-830.
McManus, J., and Duck, R.W., eds., 1993,Geomorphology and sedimentology of lakes and reservoirs: Chapter 6, Reservoir sedimentation rates in the Southern Pennine Region, UK: John Wiley & Sons, p. 73-92.
Puerto Rico Electric Power Authority, 1979, La Plata Dam, Toa Alta, Puerto Rico: Phase I Inspection Report: National Dam Safety Program, 1979.
Rausch, D.D., and Heinemman, H.G., 1984,Measurement of reservoir sedimentation in: Erosion and sediment field: R.F. Hadley and D.E. Walling, eds., Geobooks, p. 179-200.
References 23

District ChiefCaribbean DistrictU.S. Geological SurveyWater Resources DivisionGSA Center, Suite 400-15651 Federal DriveGuaynabo, Puerto Rico 00965-5703
COo_CD
COm o
COc30
Im33
o
o oo03
UJ
DOOI