onur ozansoy et al. ,vol. 1, no. 1,2015 multiobjective
TRANSCRIPT

INTERNATIONAL JOURNAL OF ENGINEERING TECHNOLOGIES Onur Ozansoy et al. ,Vol. 1, No. 1,2015
Multiobjective Pareto Optimal Design of a Clutch
System
O. Ozansoy*‡, T. Tevruz
**, A. Mugan
**
* : Istanbul Technical University, Faculty of Mechanical Engineering, Gumussuyu 34437, Istanbul, Turkey, Ford Otomotiv
Sanayi A.Ş. Gebze Engineering, Tubitak Technopark, 41470 Gebze, Kocaeli
** : Istanbul Technical University, Faculty of Mechanical Engineering, Gumussuyu 34437
([email protected], [email protected], [email protected] )
‡ Corresponding Author; Onur Ozansoy, Ford Otomotiv Sanayi A.Ş. Gebze Engineering, Tubitak Technopark, 41470 Gebze,
Kocaeli, [email protected]
Received: 08.02.2015 Accepted:14.03.2015
Abstract- Optimum design of a clutch and dual mass flywheel system is completed. Although the clutch systems are exposed
to both rotational and axial vibrations, they are generally designed by considering rotational vibrations of engines and they do
not have any component to damp axial vibrations due to the following two reasons: first, the package area of the clutch system
is very limited and there is no available space to put additional springs and dampers to reduce these vibrations. Second, axial
vibrations are normally insignificant to be considered in the analyses and such vibrations are supposed to be damped by the
diaphragm spring and cushion springs. Nonetheless, axial vibrations may lead to some unexpected problems in the power train
such as the rattle noise that is examined in this study by using global optimization techniques. The components in the clutch
system are modeled analytically. Then, by considering the pedal characteristics and vibrations of pressure plate as objective
functions, a multi-objective Pareto optimization problem is solved. It is shown that analytical models agree well with the
experimental measurements and vibrations in the clutch system can be reduced significantly by choosing the design parameters
with optimization tools.
Keywords Optimization; pareto optimality; dynamic systems; vibration; clutch.
1. Introduction
Since engineering structures are mostly subjected to
dynamic loads, it is important to design these structures in
consideration of their dynamic behavior whose optimization
is difficult since the associated mathematical models are
complicated and computational costs are expensive. In this
study, dynamic behavior of a clutch and dual mass flywheel
(DMF) system is optimized.
The clutch and dual mass flywheel system existing in
manual transmissions of internal combustion engines are
important components in a vehicle that affect the ride
comfort of the vehicle and may cause noise, fatigue of
components and longitudinal vibrations during the cruise of
the vehicle. It is noteworthy that the loading on the clutch
and dual mass flywheel system is transient and a dynamic
model has to be employed in optimization studies. The clutch
systems are essentially designed for damping out rotational
vibrations of the engine; thus, it helps increase the ride
comfort; nonetheless, they are exposed to axial vibrations as
well. They generally do not have any component to
annihilate axial vibrations due the following reasons: first of
all, packaging area of the clutch system is limited between
engine and transmission and there is no available space to
add some springs and dampers to annihilate axial vibrations.
Second of all, axial vibrations are normally insignificant to
be considered in design phase which are supposed to be
damped by the diaphragm spring and cushion springs. But,
axial vibrations may lead to some unexpected results in the
power train such as the rattle noise that is examined in this
study by using global optimization techniques.
Many studies on the clutches of different types exist in
literature. For instance, wet clutches and dual clutches, which
are mostly used on automated manual transmissions,

INTERNATIONAL JOURNAL of ENGINEERING TECHNOLOGIES Onur Ozansoy et al., Vol.1, No.1, 2015
27
engagement characteristics and their effects on engine
characteristics, shift characteristics and their effects on shaft
vibrations, modal frequencies of the clutch system and clutch
control mechanisms are some of the investigation topics [1-
7]. There are also studies in literature on modeling of one
way clutches [8-9]. Manual transmission dry clutch systems
and their rotational behavior are examined by some
researchers [10-18, 41-42]. For example, Crowther and
Zhang studied the torsional behavior of the clutch as an
elastic system in the driveline [11]. Duan and Singh
formulated the clutch engagement and disengagement as a
nonlinear dry friction problem with harmonically varying
normal load and investigated the stick-slip motions to
understand the clutch response under various torque inputs
[12-13]. Awrejcewicz and Grzelczyk studied the wear of
clutch friction surfaces [18]. Being one of the most important
component of a clutch system, the diaphragm spring (which
determines clutch pedal load) is studied by some researchers
and optimized for the best release load and durability [19-
25]. Some researchers studied the Almen-Laszlo formula
(which is used to calculate disc spring characteristics) [26] to
improve its accuracy [27-30]. Information about main
components of a clutch system can be found in [31-32].
One of the rare investigations on longitudinal vibrations
in a clutch system is presented in [33] where Esfahani et al
studied in-cycle vibrations on the clutch pedal which is
excited by the crank shaft’s axial vibration; at this point, the
authors remark about the same challenge as we faced in this
study which is the lack of an extensive axial clutch vibration
studies in literature whilst the problem observed are
connected with axial clutch vibrations. They focused on the
clutch pedal vibrations around 257Hz, which is originated
from the clutch axial vibrations, and their simulation showed
the same vibration level around 230-240Hz which is a good
correlation with actual condition, e.g., see [33]. But they did
not investigate why their system showed the whoop
frequency, or in cycle vibration, around 250Hz and did not
present a discussion or proposal how this could be reduced.
They only suggested using such kind of simulation toolboxes
to foresee any possible problems before handling the
physical parts.
Reitz et al. worked on a special test bench to investigate
NVH problems in a clutch system [46]. They reported that
the clutch system is excited by torsional and axial flywheel
vibrations. Torsional flywheel vibrations are caused by the
2nd engine order and axial flywheel vibrations are caused by
the crankshaft bending vibrations which are excited by the
4th cylinder firing. This means that axial vibrations are
caused by the 0.5th engine order which is the same outcome
of our investigations as explained in upcoming sections in
detail. They also reported the test results of three different
clutches but did not share the clutches’ specifications due to
confidentiality requirements. They presented their test bench
that enables to determine the clutch systems NVH behavior
during engagement and disengagement in detail and allow
them to predict the behavior of the clutch system in a real
vehicle.
Kelly and Rahnejat investigated the pedal vibrations and
influence of individual components on the transmission of
the subsequent vibration and noise [47]. They investigated
the vibrations in a vehicle and multi-body model of clutch
and observed that the pedal vibration and noise occurred due
to the 0.5th engine order excitation from the 4th cylinder
firing resulting in bending of the crankshaft. This is actually
the same root cause of the clutch axial vibrations investigated
in this study and although the source is the crankshaft
bending vibrations, these vibrations are transmitted by the
flywheel and clutch system. They also showed that cable
properties and mass fixes can influence the vibrations.
Hasabe and Seiki studied the clutch pedal vibrations
which are excited by the clutch axial vibrations [48]. They
conducted an experimental study based on an on-vehicle
observation of the vibrations and a test bench. They tried to
develop a method for a test bench evaluation to predict the
levels of vibration and noise in a vehicle having a 4 cylinder
engine and observed that the pedal vibrations exist at
4400RPM engine speed when the clutch is half engaged and
in the 1st, 3rd and 6th harmonic of the engine vibration. They
observed the same behavior on the clutch side which proves
that the vibrations are transmitted by the clutch system. They
also stated that the clutch system has the major contribution
on pedal vibrations. Their measurements showed that their
sample clutch has the critical resonance frequency between
200-300Hz. Unlike other studies in literature, since their
investigation covered the whole range of release bearing
travel, they observed a relatively larger range for critical
frequency and they proposed two different clutch behaviors
at engaged and disengaged positions which lead to this larger
range. They built a correlation between the vibration level
and frequency range of two different natural frequencies of
engaged and disengaged positions as well.
If the clutch model and its optimization are put aside,
there are many studies related to gear rattle phenomenon in
literature [14-15, 34-38]. Some of these studies focused on
neutral gear rattle [34-35], some of them focused on backlash
effects [15, 36-37]. Barthod et al. studied gear rattle
phenomenon to understand the rattle threshold and rattle
noise evolution in relation with excitations and mechanical
gearbox parameters [38]. On the other hand, ergonomic
issues of the clutch pedal characteristic for different driver
profiles are studied in [39]. There are also some studies to
identify the heat energy generation in friction clutch systems.
To this end, Shabibi investigated the transient solution of
heat conduction problem in solids with insulated boundaries
[40].
Padmanabhan and Singh [14] employed a simplified
rotational clutch model and showed that if clutch parameters
are selected appropriately, it can help reduce the transmission
rattle noise; although they employed a simplified clutch
model, it is a good example which shows that clutch
parameters are very important to reduce transmission rattle
noise problem. They proposed a dry friction three-stage
clutch with moderate first stage spring stiffness. Although we
are using a dry clutch, the clutch examined in this study has
one-stage spring set on it and this spring set is selected
carefully to accommodate corresponding engine torque. It is
noteworthy that three-stage clutches are not normally used
with DMF systems; instead, they are used with single mass

INTERNATIONAL JOURNAL of ENGINEERING TECHNOLOGIES Onur Ozansoy et al., Vol.1, No.1, 2015
28
flywheel systems due to their relatively higher rotational
vibration frequencies. Furthermore, three-stage clutches are
more expensive than single stage clutches due to 2 more
spring sets and friction surfaces. Nonetheless, since our
target should be getting the best results with a competitive
price, we avoid bringing add on cost to our system.
On the other hand, analyses of longitudinal dynamic
behavior of a clutch system and seeking the solution of
corresponding optimization problem have not been pursued
in literature. Motivated by these facts, this study is initiated
in which dynamic models of components of a clutch system
are derived and constructed in Matlab-Simulink,
mathematical models are verified by measurements, a multi-
objective optimization problem is formulated having two
objective functions (i.e., pressure plate vibrations and pedal
characteristics) and corresponding Pareto optimal solution is
obtained and discussed. A prototype clutch is manufactured
by using the design variables obtained by optimization runs
and then it is tested. It is shown that analytical models agree
well with the experimental measurements and vibrations in
the clutch system can be reduced significantly by choosing
the design parameters with optimization tools.
2. Modeling of the Clutch System
Parameters which affect axial vibrations of the clutch
system will also affect clutch release load characteristics
which will be discussed in the upcoming sections in detail.
Since the clutch pedal load characteristics are dependent on
release load characteristics, even if the vibration problem is
well resolved, pedal load might be too high which may cause
the clutch system becomes unusable. For that reason, clutch
release load characteristics will be simulated first, and then
optimization problem will be solved.
The clutch and DMF system that are the subject of this
study is shown in Fig. 1. Following, dynamic models of
components in this clutch system are derived. Please note
that primary side of the flywheel and some internal parts
could not be shown in the figure not make it more intricate.
Fig. 1. Geometrical data of the simulated clutch and
DMF system (at engaged position) [44].
2.1. Clutch Release Load Characteristic
Being one of the crucial elements determining the
clutch dynamic behavior, clutch release load
characteristic is derived from clutch release curve. A
typical clutch release curve, pressure plate spring curve
and lift off curve are shown in Fig. 2. While clutch
diaphragm spring is the most significant component
influencing clutch release load characteristic, it is also
affected by leaf springs on clutch cover (which helps
pressure plate disengagement), cushion springs between
friction surfaces of clutch disc and clutch cover stiffness.
Following sections explain how these components are
modeled.
As mentioned in the abstract, two objective
functions such as pressure plate vibrations and clutch
pedal curve characteristic are used in this study. Clutch
pedal curve characteristic is calculated by dividing the
release load curve to release system’s ratio and release
load curve gives us the load on the release bearing as the
release bearing travel changes. Note that while
calculating these curves, they are modeled
parametrically by using cubic spline polynomials in the
mathematical model of the clutch system and employed
in the optimization runs.
2.2. Diaphragm Spring
Since the diaphragm spring has two sections having
completely different characteristics, it is divided into
two parts and their mathematical equations are derived
separately, e.g., see Fig. 3. While the disc spring is
discussed below in Section 2.2.1, finger springs are
studied in Section 2.4 along with the other components
that are modeled by using finite element method (FEM).
Fig. 2. An example of a clutch pedal curve and its
important points [45].
Fig. 3. Two sections of the diaphragm spring. Disc Spring Disc Spring

INTERNATIONAL JOURNAL of ENGINEERING TECHNOLOGIES Onur Ozansoy et al., Vol.1, No.1, 2015
29
2.2.1. Modeling of Disc Springs.
The Almen-Laszlo formula [26] is commonly used
to model the disc springs in practice [19-22].
The load P1 acting on the outer radius of diaphragm
spring can be calculated as follows:
(2.1)
where E is the elasticity modulus of spring material, t is
the thickness of diaphragm spring, λ1 is the displacement
of outer diameter of disc spring, R is the radius of outer
end of disc spring, r is the inner radius of disc spring, ρ
is the Poisson’s ratio of spring material, L is the position
of load P1, l is the diameter of wire ring and h is the
internal cone height of an unloaded diaphragm spring
[20].
The load P2 acts on the inner radius of diaphragm
fingers. This leads to a large deformation λ2 on
diaphragm fingers and also λ1 on the outer radius of disc
spring as shown in Figure 4a and Figure 4b. The release
load P2 is given by [20]
(2.2)
Where rp is the inner radius of diaphragm fingers
where release bearing connection exists [20].
The cross section of disc spring part of diaphragm
spring is presented in Figure 4.b on the right without
showing the diaphragm fingers, which is used to derive
load equations of disc spring. The Almen-Laszlo
formulas assume that the disc spring rotates around a
center which can be calculated by using the following
formula [31-32]
(2.3)
Then, the load on disc spring is given by
(2.4)
(2.5)
Where s is the deflection of disc spring, De is the
outer diameter of disc spring, Di is the inner diameter
of disc spring and δ= De /Di [31]. The disc spring
characteristic which can be found in literature [31-32] is
shown in Fig. 5 as h/t ratio changes.
Fig.4a. Deformation of the diaphragm spring when its
fingers are loaded. [20]
Fig..4b. The cross section at reference position. [31]
Fig.5. Load-deflection characteristic for Belleville washers
[31].
By using the formulations given above and
geometrical properties of the clutch employed in this study,
the clamp load curve is obtained as shown in Figure 6 where
the maximum achievable load is calculated as approximately
18,000N.

INTERNATIONAL JOURNAL of ENGINEERING TECHNOLOGIES Onur Ozansoy et al., Vol.1, No.1, 2015
30
Fig.6. Clutch clamp load characteristics. The curve at the top
shows the spring compression, the curve at the bottom shows
the decompression phase.
Once the clamp load curve is built, operation point (λ1)
on the curve needs to be identified. In order to identify the
value of λ1, clamp load should be known which is the normal
force on the clutch pressure plate at the engaged position and
must be determined correctly to ensure the transmission of
engine torque. A safety factor is also considered to guarantee
no slippage on the clutch which is called the Slip Safety
Factor (SSF) which is typically chosen as 1.2 [45]. The
clamp load is calculated by using Eq. (2.7).
(2.6)
(2.7)
Where Dm is the diameter of gyration (centroid of
friction facing surface diameter to which torque is applied to
calculate the clamp load), Fclamp is the clamp load at the
clutch operation point, μ is the friction coefficient of friction
and Te is the maximum engine torque. By the use of Eq.
(2.7), the minimum clamp load is calculated as 9,400N and
nominal clamp load can be selected as approximately
10,000N. Considering this clamp load, nominal operation
point is calculated as 8.1mm from the Figure 6.
2.3. Modeling of Cushion Spring
The cushion spring significantly affects the release load
characteristic. Its characteristic load curve used this study is
shown in Figure 7 on the left [43] which is obtained from
experimental measurements (e.g., see Section 3). It is
parametrically modeled by using cubic spline polynomials in
the mathematical model of the clutch system and employed
in optimization runs. The cushion spring segment of clutch
disc provides a smooth release curve and prevents large loads
on the pedal load curve. In order to handle release load
curve, the difference between diaphragm spring and cushion
spring is calculated and divided by clutch ratio. The shaded
areas in Figure 7 on the right show this difference and related
release load is on the left side.
Fig.7. The cushion spring and its characteristics for the new
and worn springs [43].
2.4. Modeling of Diaphragm Spring Fingers, Clutch
Cover, Compensation Spring and Leaf Springs
FEM is used to model diaphragm spring fingers, clutch
cover, compensation spring and leaf springs. It is noteworthy
that diaphragm spring stiffness is strongly related to the
clutch release load characteristic.
In order to calculate the diaphragm spring stiffness
under loading, it is important to accurately model the
stiffness of fingers. To this end, the slave cylinder bearing is
modeled as a solid cylinder on the fingers of diaphragm
springs and a contact model is defined between the bearing
and fingers. There are a number of studies reported in
literature used shell elements [24] or tetrahedron solid mesh
elements, e.g., [49], [51-52]. Parabolic tetrahedron solid
elements (with 10 nodes having three degrees of freedom
(DOFs) at each node) are used in our study. In order to
analyze only finger area of the diaphragm spring, all DOFs
of the fulcrum ring connection are restricted as boundary
conditions and distributed pressure is loaded on the release
bearing. Based on FEM solutions, characteristics of fingers
are found to be similar to a linear spring, which is also
verified by experimental measurements, e.g., see Figure 9
(i.e., release load curve). Linear ramp up behavior of first
part of the release load curve shows linear spring
characteristics of diaphragm fingers. Many measurements
and simulations are reported in literature on this issue, e.g.,
see [22], [24], [49-50].
The clutch cover stiffness is also another important
parameter affecting the release load characteristic. By using
parabolic tetrahedron solid elements in FEM model,
distributed load is applied to fulcrum ring area and all DOFs
of the bolt holes around the cover where the cover is
connected to flywheel are restricted. Note that the diaphragm
spring position, compensation spring position and its end
stop position are different between the loaded and unloaded

INTERNATIONAL JOURNAL of ENGINEERING TECHNOLOGIES Onur Ozansoy et al., Vol.1, No.1, 2015
31
positions of diaphragm spring. These positions change under
the loading during the engagement and disengagement of
clutch and significantly affect the release load curve
characteristic. In order to identify these positions under
different loading conditions, FEM solutions are used and
relevant spring coefficients are calculated.
The compensation spring is used to achieve a more flat
release load characteristic which also leads to a more flat
clutch pedal characteristic. The compensation spring is
activated after the maximum loading is reached during its
release. After this point, the release load begins to reduce
dramatically. In order to prevent this, a linear spring is used
to increase the pedal loads starting from the maximum
release load to the end of release bearing travel; thus, more
flat pedal characteristic can be achieved [44].
Leaf springs are used to pull back the pressure plate
from the clutch disc during the disengagement of clutch.
These springs are thin planar plates located in front of the
diaphragm spring. Due to the clamp load on the pressure
plate, these plates are bent and have the function of a spring.
They are only used to guarantee that the pressure plate does
not touch to clutch disc after the disengagement.
In FEM models of compensation spring and leaf spring,
parabolic tetrahedron solid elements with 10 nodes are used
and all DOFs of rivet holes of these springs used for the
connection to the cover are restricted from movement or
rotation. The load between 0 to 400N is applied to leaf spring
and distributed pressure is applied to the release bearing
which contacts with compensation spring fingers at the
release bearing travel where this contact condition is
occurred.
FEM solutions of diaphragm spring, clutch cover,
compensation spring and leaf spring are shown in Figure 8.
Note that these results are used in the mathematical model of
clutch system to derive their parametric models which is
employed in the optimization runs.
Fig.8. FEM solutions of diaphragm spring fingers, clutch
cover, compensation spring and leaf springs.
The usage of FEM was necessary since the spring
characteristics of subcomponents are needed separately.
Experimental results give us only total system behavior as
shown in c instead of handling the spring characteristics of
all subcomponents separately. Furthermore, once these
spring characteristics are identified, it is very easy to change
the spring coefficients during optimization runs.
Once these numerical results are obtained and used in
the calculations of clutch release load curve, the results are
compared with experimental measurements (e.g., see Figure
9).
2.5. Derivation of Release Load Curve and Lift Off Curve
By the use of above results, we have all necessary inputs
to calculate the release load characteristic and lift off curve.
A simplified formulation to calculate the release load for
pressure plate movement “s” is given by
(2.8)
where FD is the diaphragm spring load, Fcushion is the cushion
spring load, Fsensor is the sensor spring load, Fleaf is the leaf
spring load, Fcomp. is the compensation spring load which is
zero at the beginning of disengagement movement of the
release bearing and i is the clutch ratio. These forces are
shown in Fig. 1. Then, the clutch ratio is given by
(2.9)
Where SRelease and SDiaphragm are respectively distances
between loads and connection rivets shown in Fig. 1.
Sensor spring load in Eq. (2.8) is created by the sensor
spring shown in Fig. 1 and it increases as clutch friction
faces get worn. After a certain level of load, clutch
adjustment system sets in and sensor spring load decreases to
the initial value. Detailed information about clutch
adjustment system can be found in [44].
It can be seen in Eq. (2.8) that the clutch cover or
diaphragm spring finger deflection is not considered in force
equilibrium. However, while the load on these components
changes during the engagement and disengagement process,
their stiffness affects the positions of diaphragm fingers and
subsequently the bearing position, which also determines the
complete release curve characteristic. These issues are
considered in the simulations to determine the mathematical
model of the system and calculate the release characteristics
of the clutch examined in this study.
The release load on clutch fingers and lift off curve
(displacement of pressure plate and clutch finger travel) are
simulated and compared with the measurements in Figure 9.
These curves are the basic clutch characteristics and can be
used to characterize a clutch system [45].

INTERNATIONAL JOURNAL of ENGINEERING TECHNOLOGIES Onur Ozansoy et al., Vol.1, No.1, 2015
32
Fig.9. The release load and lift off curves.
As mentioned earlier, the release load on clutch fingers
is directly related to the axial loading of clutch and load
transferred to clutch pedal through clutch release system. It is
observed in Figure 9 that the simulation results are very close
to measurements and can be used for solving the
optimization problem. Optimization results are obtained by
using analytical formulas, spring characteristics of different
sub-components which are obtained by FEM and parametric
curve of cushion spring. Measurements are obtained by the
clutch test bench which is explained in detail in Section 3.1..
3. Test Benches and Test Procedures
3.1. Load and Travel Measurement
Figure 10 shows the clutch test bench and component
layouts for release load, release travel, clutch pedal load and
pressure plate travel measurements. Load sensors are PULS
HT1 series compression load cell type of 50kN capacity.
Travel sensors are Alfa Electronic TLM type
magnetostrictive displacement sensor with +/-30 μm
precision.
Fig. 4. Test rig.
System components of the test bench shown in Fig. 10
are as follows
a) Clutch pressure plate, disc, bearing, fork
b) Clutch slave cylinder push rod
c) Clutch slave cylinder
d) Clutch pipe end fitting
e) Clutch hydraulic pipe
f) Master cylinder
g) Clutch pipe end fitting
h) Reservoir
i) Clutch pedal push rod
j) Clutch pin point
k) Clutch pedal
Sensors on the test bench shown in Fig. 10 are as follows
1. Force measurement from pressure plate
2. Displacement measurement from pressure plate
3. Force measurement from clutch slave cylinder push rod
4. Displacement measurement from clutch slave cylinder
5. Pressure measurement from clutch slave cylinder inlet (50
bar clutch hyd. DOT4)
6. Thermocouple on clutch pipe
7. Pressure measurement from clutch master cylinder Outlet
8. Force measurement from clutch pedal
9. Displacement measurement from clutch pedal
3.2. Dynamic Vibration Measurements
In order to measure and understand the vibration
phenomena in the clutch and flywheel system, a number of
displacement and speed sensors and one microphone are
equipped on a transmission and engine, and these
instrumented parts are used on a vehicle to measure the rattle
noise and vibrations on the clutch and flywheel system.
Sensor numbers and positions are listed below and shown in
Fig. 11.
Measurements are performed while driving the vehicle.
Firstly, the engine is accelerated above 3500 RPM, then
clutch pedal is depressed (i.e., clutch disengagement). Clutch
pedal is released again in one second and the clutch is
allowed to engage. Rattle noise and vibration signals of
components in the clutch are recorded during the clutch
engagement. Note that the rattle noise is irrespective of gear
position.
The noise measurement data recorded with the
microphone which is at the end of the transmission housing
is shown in Fig. 12 on the left where it is observed that
around the engine speed of 2500 RPM is the worst possible
range for the emergence of rattle noise.

INTERNATIONAL JOURNAL of ENGINEERING TECHNOLOGIES Onur Ozansoy et al., Vol.1, No.1, 2015
33
Fig. 11. Locations of displacement and speed sensors for
vibration analysis: a) 3 displacement sensors for crankshaft
vibrations at r = 58mm , b)3 displacement sensors for
primary flywheel vibrations at r = 140mm, c) 3 displacement
sensors for secondary flywheel vibrations at r = 97mm d)3
displacement sensors for pressure plate vibrations at r =
118mm,e) 1 displacement sensor at the end of the
transmission housing, f) 1 microphone at the end of the
transmission housing (bandpass filter 1000-20000 Hz). g) 1
speed sensor for the transmission input shaft speed
Fig. 12. Recorded noise data between 2000-3500 RPM
range. Rattle noise exists at the 0.5th engine order (on the
left) corresponding to crankshaft bending vibration resulting
in axial clutch vibrations (on the right) [33], [46].
As mentioned in Section 1, references [33], [46], [47]
reported that axial clutch vibrations are excited by the 4th
cylinder of engine at the 0.5th
engine order. Measurements
tell us the rattle noise in our experimental setup occurred at
the 0.5th
engine order which is excited by the crankshaft
bending vibrations which is verified by the references as
shown in Figure 12 on the right side.
Figure 13 shows the measurements taken from the
engine crankshaft, flywheel, clutch cover and pressure plate.
It is observed in this figure that the clutch system considered
in this study works like an amplifier which results in
transmission rattle noise during clutch engagement.
3.3. Analysis of Vibration Modes on the Clutch and Flywheel
In order to understand the axial vibration modes of
clutch and dual mass flywheel system, a modal analysis test
is performed on a shaker test bench and vibrations are
measured in response to axial sinusoidal excitations having
5mm release bearing travel between 0-800Hz. The shaker,
instrumented clutch and test rig configuration is shown in
Fig.14.
Components shown in Figure 14 are listed below:
a. Shaker
b. Flywheel primary side
c. Flywheel secondary side
d. Pressure plate
Fig. 13. Axial vibration measurements on the crankshaft,
primary and secondary flywheels and pressure plate, and its
relations with rattle noise measurements.
Fig. 14. Shaker test rig configuration and instrumented
clutch.

INTERNATIONAL JOURNAL of ENGINEERING TECHNOLOGIES Onur Ozansoy et al., Vol.1, No.1, 2015
34
Measurements obtained from this setup is presented in
Fig. 20 to verify the results of mathematical results where it
is observed that the first natural frequency of pressure plate is
around 165Hz with a phase difference between the flywheel
and pressure plate. Measurements also show that there is a
second dominant frequency around 150 Hz with no phase
difference between the flywheel and pressure plate whilst
pressure plate shows relatively larger amplitudes in
compared with the whole frequency range.
4. Mathematical Model for Pressure Plate Vibrations
Note that we have flywheel vibration measurements at
hand which are excited by the crankshaft bending vibrations
(especially 4th cylinder firing is effective on this kind of
vibration problem (Fig. 12), e.g., see [33], [46]) and it is not
possible to alter these vibrations unless the engine or
cranking system is modified. Therefore, flywheel vibrations
are used as an input to the vibration model of clutch system
in this study.
On the other hand, in order to model the pressure plate
axial vibrations, the system is modeled by the components
such as the clutch disk, input shaft, pressure plate, diaphragm
spring, clutch fingers and clutch cover. Engine vibration
transmitted through this flywheel connection is the only
source for clutch pressure plate vibration. Such a
mathematical model for another clutch system can be found
in [33] where a cable clutch system with an external slave
cylinder and a lever system is modeled while the model in
this study is a hydraulic system with a concentric slave
cylinder.
The components of clutch system are shown in Fig. 1.
The mathematical model includes the geometrical and
physical properties of these sub-components and stiffness
properties of the springs. Since excessive vibrations of the
pressure plate occur during the engagement (while releasing
the clutch pedal), we will simulate the system starting from
the disengaged position to the engaged position; that is, this
model will be working at the time while the clutch pedal is
being released.
It must be underlined that this model is only built to
study longitudinal vibrations of the clutch system and no
rotational motion is considered. There are two main reasons
for this assumption.
• If there are unexpected rotational vibrations in the
engine, the noise phenomena would occur at idle or driving
conditions as well. Instead, the noise is only heard during
engagement phase in which pressure plate does not complete
its full travel. Following, the excessive axial vibration causes
pressure plate to press the clutch disc intermittently, then
torque fluctuation is transmitted to the transmission that
causes the rattle noise phenomena.
• Torque fluctuations can also be improved by
modifying rotational dampers slightly. But this does not
resolve the main source of vibration, only damps out the
vibration transmitted to the transmission. This may also
cause a negative effect on the dampers life time due to the
vibrations on pressure plate.
Simulation results will be compared with the
measurements and above mentioned assumption will be
proven with the comparisons.
The simplified model of the system is shown in Fig. 15
in which diaphragm fingers are connected to the cover which
can rotate around the fulcrum ring connection points. This is
completely in line with the detailed representation of the
clutch system shown in Fig 1; clutch disc is assumed to be
consisting of two separate friction discs. The mass of these
friction discs are equally added to the secondary side of
flywheel and pressure plate. The cushion spring and its
friction surface are shown in the model as a sub-component
of the clutch disc.
In Figure 15 on the top side, experimental
measurements taken from the engine is shown. As it can be
seen from physical measurements, the crankshaft has two
main peaks which are due to the 3rd
and 4th cylinder firings
which cause the crankshaft bending. These two peaks are
repeated in every 720° of crankshaft rotation and used as
inputs in the simulation model as shown in the same figure.
By using the simplified model shown in Figure 15, the
mathematical model is obtained by using MATLAB
software. To this aim, the Simulink® which is a MATLAB
tool is employed that helps simulate such vibration models.
The high level Simulink model for the pressure plate and
clutch cover is shown in Figure 16 on the left.
Fig. 15. Simplified model of the clutch system by
considering axial vibrations and primary side axial
vibrations.

INTERNATIONAL JOURNAL of ENGINEERING TECHNOLOGIES Onur Ozansoy et al., Vol.1, No.1, 2015
35
Fig.16. High level Simulink model on the left and
pressure plate vibration during engagement phase on the
right.
The model shown in Figure 16 has two pulse
generators as explained in Figure 15, which simulate the
engine excitation and is used as an input to the pressure
plate and clutch cover. The main purpose is to find the
pressure plate excitations. Following, simulation results
will be compared with measurements.
In order to build sub-models, the mathematical
equations should be obtained for vibrations. The
following dynamic equations are of the system shown in
Figure 15. Vibrations of the pressure plate are shown in
Figure 16 on the right where point A shows the engaged
position of the pressure plate (operation point), point B
represents the disengagement phase at pressure plate
travel λ, and point C shows the cushion spring loading at
pressure plate travel λ.
(4.1)
(4.2)
Where mpp is the pressure plate mass, ẍpp is pressure
plate acceleration, xpp is the pressure plate travel around
point B in Figure 15, λ represents pressure plate travel
from the point where pressure plate vibrations are
calculated, Fdisc_spring is the load on the disc spring,
Fcushion is the load on the cushion spring, Ffingers is the
load on the pressure plate created by the release load, mc
is the cover mass, ẍc is the cover acceleration,xc is the
cover displacement, FR is the release load on the
diaphragm fingers, kc is the cover stiffness given in
Figure 8 and xf is the secondary flywheel displacement.
Now, we will write the terms in Eqs. (4.1) and (4.2) with
known parameters as follows
(4.3)
Where Fdiaph(.) is the clamp load at any xpp (characteristic
load curve for Fdiaph is shown in Figure 6). Moreover,
(4.4)
Where Fcush(.) is the cushion spring load at any xpp
which is given in Figure 7. In addition,
(4.5)
Where Frelease(.) is the release load characteristic
dependent on release travel given in Figure 9, xrelease is the
release bearing travel at (λ + xpp) pressure plate travel and i is
the clutch ratio. We can write this equation with xpp by using
lift off curve which is also given in Figure 9 as follows
(4.6)
that results in
(4.7)
Where klift(.) is the lift off curve characteristic which
gives the pressure plate travel against release travel shown in
Figure 9 on the right. We can also write release load FR in
Eq. (4.2) as follows
(4.8)
Then, Eq. (4.1) and Eq. (4.2) become as follows
(4.9)
(4.10)
After deriving the differential equations, we are ready
to build the corresponding Simulink models. Since we have a
number of non-linear springs and tables, it will be easier to
solve the equations in time domain by using the Simulink
blocks. Once these equations are solved in time domain, it is
easier to examine the solutions in frequency domain.
The mathematical model has the input of 2500 RPM
which is in the range such that the rattle noise is in the most
noticeable range (i.e., Figure 12). The Simulink sub-models
for the pressure plate and clutch cover are shown in Figure
17. These Simulink models help us solve the nonlinear
differential equations given by Eq.(4.9) and Eq.(4.10).
Simulation results are presented in Figure 18.
Simulink model of the pressure plate is built by using
the equation of the pressure plate. The model accepts
flywheel vibrations (Figure 15) and pressure plate operation
point (Figure 6) as the inputs and then calculates the pressure
plate vibrations xpp and diaphragm finger vibrations.

INTERNATIONAL JOURNAL of ENGINEERING TECHNOLOGIES Onur Ozansoy et al., Vol.1, No.1, 2015
36
Fig. 17. Simulink models for the pressure plate (on the
top) and clutch cover (on the bottom).
The model calculates every parameter in Eq. (4.9) by
using cushion spring, diaphragm spring and release load
characteristics which were explained in Section 2, e.g., see
Figure 17 on the top.
Following Simulink model of the clutch cover is
constructed by using the equation of the cover. The model
accepts pressure plate and diaphragm finger vibrations from
the previous Simulink model, pressure plate operation point
and flywheel vibrations as the inputs and then calculates the
clutch cover vibrations. The model calculates every
parameter in Eq. (4.10) by using cushion spring and release
load characteristics which were explained in Section 2, e.g.,
see Figure 17 on the right.
Simulation results and experimental measurements are
presented in Figure 18 where it is observed that the
simulation results show a good correlation with experimental
measurements that are obtained by using the test bench
explained in Section 3.2.
For instance, while the vibration amplitude in
simulations is approximately 0.35 mm, it is 0.37 mm in
experimental measurements at 2500 RPM. As mentioned
before, measured flywheel vibrations are used as the
excitation data in the simulation. All measurements are
sampled during the engagement phase where the rattle noise
occurs.
Fig. 18. Comparison between simulation results (on the
top) and measured vibrations (on the bottom).
By examining Figure 18 in detail, we can observe that
basically two different frequency contents exist in the
vibrations. It is obvious that the signal content having
relatively lower frequency is caused by the crankshaft axial
vibrations which are exactly equal to the 0.5th
order of the
engine speed. As a matter of fact, this is expected because
this frequency content is one of the most critical frequencies
of four cylinder engines.
If we study higher frequency vibrations in Figure 18, we
observe that there is a second frequency content in the
vibrations having approximately the frequency spectrum of
160Hz as shown in Figure 19 for both measured and
simulated data. In sum, both measured and simulated data
show a dominant frequency around 160Hz and similar sub-
harmonics. The corresponding FFT analyses of measured
data and simulation results show that there is another peak
around 145Hz as well.
Fig. 19. Power spectrum of the pressure plate vibration
measurements is on the left and that of simulation results is
on the right.
INTERNATIONAL JOURNAL of ENGINEERING TECHNOLOGIES Onur Ozansoy et al., Vol.1, No.1, 2015
37
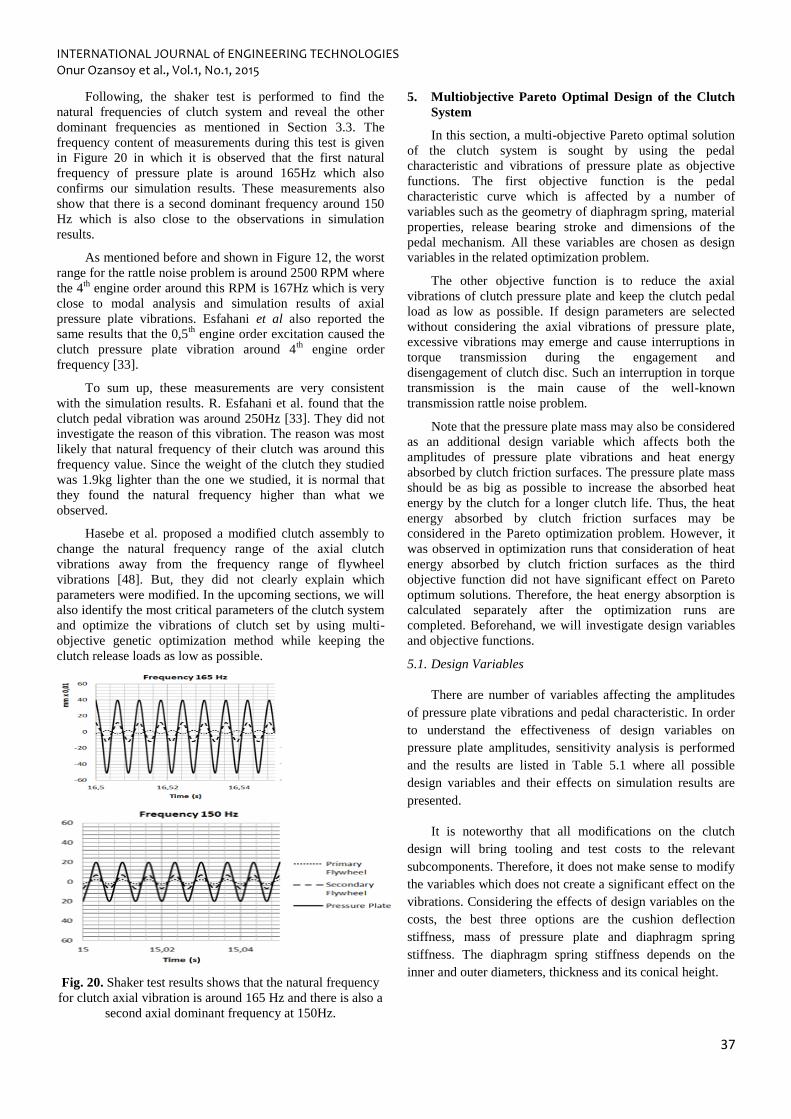
Following, the shaker test is performed to find the
natural frequencies of clutch system and reveal the other
dominant frequencies as mentioned in Section 3.3. The
frequency content of measurements during this test is given
in Figure 20 in which it is observed that the first natural
frequency of pressure plate is around 165Hz which also
confirms our simulation results. These measurements also
show that there is a second dominant frequency around 150
Hz which is also close to the observations in simulation
results.
As mentioned before and shown in Figure 12, the worst
range for the rattle noise problem is around 2500 RPM where
the 4th
engine order around this RPM is 167Hz which is very
close to modal analysis and simulation results of axial
pressure plate vibrations. Esfahani et al also reported the
same results that the 0,5th
engine order excitation caused the
clutch pressure plate vibration around 4th
engine order
frequency [33].
To sum up, these measurements are very consistent
with the simulation results. R. Esfahani et al. found that the
clutch pedal vibration was around 250Hz [33]. They did not
investigate the reason of this vibration. The reason was most
likely that natural frequency of their clutch was around this
frequency value. Since the weight of the clutch they studied
was 1.9kg lighter than the one we studied, it is normal that
they found the natural frequency higher than what we
observed.
Hasebe et al. proposed a modified clutch assembly to
change the natural frequency range of the axial clutch
vibrations away from the frequency range of flywheel
vibrations [48]. But, they did not clearly explain which
parameters were modified. In the upcoming sections, we will
also identify the most critical parameters of the clutch system
and optimize the vibrations of clutch set by using multi-
objective genetic optimization method while keeping the
clutch release loads as low as possible.
Fig. 20. Shaker test results shows that the natural frequency
for clutch axial vibration is around 165 Hz and there is also a
second axial dominant frequency at 150Hz.
5. Multiobjective Pareto Optimal Design of the Clutch
System
In this section, a multi-objective Pareto optimal solution
of the clutch system is sought by using the pedal
characteristic and vibrations of pressure plate as objective
functions. The first objective function is the pedal
characteristic curve which is affected by a number of
variables such as the geometry of diaphragm spring, material
properties, release bearing stroke and dimensions of the
pedal mechanism. All these variables are chosen as design
variables in the related optimization problem.
The other objective function is to reduce the axial
vibrations of clutch pressure plate and keep the clutch pedal
load as low as possible. If design parameters are selected
without considering the axial vibrations of pressure plate,
excessive vibrations may emerge and cause interruptions in
torque transmission during the engagement and
disengagement of clutch disc. Such an interruption in torque
transmission is the main cause of the well-known
transmission rattle noise problem.
Note that the pressure plate mass may also be considered
as an additional design variable which affects both the
amplitudes of pressure plate vibrations and heat energy
absorbed by clutch friction surfaces. The pressure plate mass
should be as big as possible to increase the absorbed heat
energy by the clutch for a longer clutch life. Thus, the heat
energy absorbed by clutch friction surfaces may be
considered in the Pareto optimization problem. However, it
was observed in optimization runs that consideration of heat
energy absorbed by clutch friction surfaces as the third
objective function did not have significant effect on Pareto
optimum solutions. Therefore, the heat energy absorption is
calculated separately after the optimization runs are
completed. Beforehand, we will investigate design variables
and objective functions.
5.1. Design Variables
There are number of variables affecting the amplitudes
of pressure plate vibrations and pedal characteristic. In order
to understand the effectiveness of design variables on
pressure plate amplitudes, sensitivity analysis is performed
and the results are listed in Table 5.1 where all possible
design variables and their effects on simulation results are
presented.
It is noteworthy that all modifications on the clutch
design will bring tooling and test costs to the relevant
subcomponents. Therefore, it does not make sense to modify
the variables which does not create a significant effect on the
vibrations. Considering the effects of design variables on the
costs, the best three options are the cushion deflection
stiffness, mass of pressure plate and diaphragm spring
stiffness. The diaphragm spring stiffness depends on the
inner and outer diameters, thickness and its conical height.

INTERNATIONAL JOURNAL of ENGINEERING TECHNOLOGIES Onur Ozansoy et al., Vol.1, No.1, 2015
38
Table 5.1. Sensitivities of variables on simulation results
of pressure plate vibrations.
However, in comparison with other design variables,
modifying only the conical height is the optimum way to
modify the diaphragm spring stiffness due to the ease of tool
modification and relatively lower cost. The rest of design
variables would result in relatively higher costs, require
major modifications on the tools (or may even need a new
tool) and very big lead time.
5.2. Objective Functions and Constraints
When designing a clutch system, the first issue to be
considered is to transfer the maximum engine torque to
transmission system. To this end, effective clamp load
should be selected carefully. Since the clamp load that is less
than the required value may cause excessive slippage on the
clutch system and degrades the clutch life significantly; on
the other hand, the clamp load which is more than the
required value may cause very high clutch pedal efforts and
bad clutch feeling during the launch (e.g., very quick
engagement and possible undesired stalls).
Subsequently, the first objective function should be the
minimization of maximum pressure plate vibration amplitude
which is the main source for rattle noise. Since the maximum
vibration amplitudes are observed between the frequency
range of 100 to 200 Hz (e.g., see Fig. 19 and 20), we will
focus on this frequency interval for the first objective
function. This frequency range also covers the 4th engine
orders of the engine speed between 1500-3000 RPM range
which is the critical engine order as discussed in Section 4.
Moreover, as another constraint in optimization runs, the
clamp load is chosen as 10,000N at the beginning of the
design process which is given in the section on modeling of
disc spring (i.e., Section 2.2.1).
The other basic function of the clutch system is to cut
the torque transfer from the engine to transmission system
when requested (to prevent stall or change transmission
gear). While fulfilling this function, the maximum clutch
pedal effort should be as low as possible. High pedal efforts
would cause unsatisfactory drivers. Thus, the second
objective function can be defined as the minimization of
maximum clutch pedal effort which is directly connected
with maximum release load. Considering these objective
functions and constraints, the multi-objective optimization
problem can be built as shown in Eq. (4.1). That is,
minimize xpp’ minimize FR subject to
=0
(5.1)
One of the functions of clutch system is to transfer
the heat energy generated by the friction on disc surfaces. To
this end, the clutch heat energy generation calculations are
completed after the optimization runs are completed by using
the following [45]
(5.2)
Where Q is the dissipated heat energy, μ is the friction
coefficient of clutch faces, Fclamp is the clamp force on the
pressure plate, Vx is the vehicle speed and tx is the time.
The ratio of Q/A for the cross sectional area A is widely
used to “normalize” heat generation as a sizing parameter.
This normalized value is used to evaluate clutch heat effects.
In addition, Q/mpp for the unit pressure plate mass mpp is also
used when considering “heat sink” capability of clutch
pressure plate [45].
Since the clutch inner or outer diameters are not chosen as
optimization parameters, Q/A will not be changed. However,
we need to check Q/mpp since pressure plate mass mpp is an
optimization variable and may be changed after the
optimization runs. If the pressure plate mass mpp is reduced,
heat sink capability of the pressure plate will be reduced
(more heat energy will need to be sank into unit mass).
Variable Increase
Decrease Effect
Magnitude
of Effect
Ratio ↑ ↓ No significant
effect n/a
Pressure Plate
Mass ↑ Improvement Medium
Pressure Plate
Mass ↓ Degradation Medium
Leaf Spring
Stiffness ↑ Improvement Small
Leaf Spring
Stiffness ↓ Degradation Small
Clamp Load ↑ Degradation Small
Cushion
Deflection
Stiffness ↓ Improvement High
Cover Stiffness ↑ Improvement Small
Cover Stiffness ↓ Degradation Small
Diaphragm Spring
Stiffness (h0) ↑ Degradation Medium
Diaphragm Spring
Stiffness (h0) ↓ Improvement Medium

INTERNATIONAL JOURNAL of ENGINEERING TECHNOLOGIES Onur Ozansoy et al., Vol.1, No.1, 2015
39
5.3. Optimization of The Clutch System As a Dynamic System
Since we have more than one objective function, multi-
objective genetic optimization algorithm in Matlab is used in
the optimization runs. The genetic algorithm is a method for
solving both constrained and unconstrained optimization
problems based on natural selection that drives biological
evolution. The genetic algorithm repeatedly modifies a
population of individual solutions. At each step, it selects
individuals randomly from the current population to be
parents and uses them to produce the children for the next
generation. At each iteration, the genetic algorithm performs
a series of computations on the current population to produce
a new population. Each successive population is called a new
generation. An individual is any point to which you can
apply the fitness functions whose value for an individual is
its score. A population is an array of individuals that consist
of optimization parameters. The fitness function is the name
of the optimization functions for genetic algorithm [53].
Typically, the algorithm is more likely to select parents that
have better fitness values.
The genetic algorithm begins by creating a random
initial population by using optimization variables. The
algorithm then creates a sequence of new populations. To
create the new population, the algorithm performs the
following steps:
1. Scores each member of the current population by
computing its fitness value.
2. Scales the raw fitness scores to convert them into a
more usable range of values.
3. Selects members, called parents, based on their
fitness.
4. Some of the individuals in the current population
that have lower fitness are chosen as elite. These
elite individuals are passed to the next population.
5. Produces children from the parents. Children are
produced either by making random changes to a
single parent (mutation) or by combining the vector
entries of a pair of parents (crossover).
6. Replaces the current population with the children to
form the next generation.
As an outcome of the above described optimization problem,
a Pareto chart is created. The curve in this chart is built with
optimum points for both objective functions. It means that
we do not have only one optimum solution, instead we have
a list of optimum solutions and we need to select one of these
solutions which can serve to our aim as the best result.
It must be noted at this point that all relevant optimization
parameters are modified at each optimization iterations if the
geometry of clutch, mass or stiffness are varied during
optimization process. Thus, each iteration is actually an
independent simulation which uses new design parameters
and re-calculated curves.
Figure 21 shows the Pareto chart of the clutch system and
optimum solutions of clutch system. The four solutions
having relatively lower values for the objective functions 1
and 2 are encircled in Figure 21, which can be selected as the
optimum solution by the designer. Note that the total solution
time is 840 seconds on a computer having AMD Athlon 2.8
GHz dual core processor.
As it can be seen in the Pareto chart, global optimum points
are calculated as;
Cushion deflection under max clamp load =
0.75+0.188=0.938mm
Pressure plate mass = 4.0387 kg
Diaphragm spring conical height = 8.971mm
However, these values cannot be handled due to the
tolerances of clutch manufacturing process. Reasonable
values which can be manufactured by manufacturing
processes can be found by rounding above design parameters
as follows
Cushion deflection under max clamp load =
0.75+0.2=0.95mm
Diaphragm spring conical height = 9mm
Table 5.2 shows the comparison between the original
parameters of the first physical clutch, optimized parameters
and results of the objective functions.
The simulation results which are shown in Figure 22
are calculated by using the variables given in Table 5.2. If
the results are compared with the initial system (e.g., Figure
18 and Figure 19), it can be observed that the vibration
amplitudes of pressure plate are reduced by 0.06mm that is
significant. This makes 0,12mm improvement in total
pressure plate displacement which makes approximately 35%
improvement on vibration amplitudes. The FFT results also
show the same improvement especially around the frequency
range of 140-160Hz.
Following, the physical model is produced by using
the optimum design variables given in Table 5.2 and then
tested. Experimental measurements obtained from the
optimized clutch system are shown in Figure 23 in which it is
observed that the experimental results give close results to
simulation results. Both simulated and measured data have
the same dominant frequency around 160Hz and their FFT
results are very close to each other. The maximum
amplitudes are also very close to each other (around
0,125mm-0,130mm).
Moreover, it is observed in the experiments that the
rattle noise is reduced approximately 40% based on
microphone measurements that can be observed if Figure 24
is compared with Figure 12. The measurements are
performed as explained in Section 3.2. In brief, the
simulation results and experimental measurements are
encouraging and axial vibrations in the drive line are reduced
by optimization process.
Finally, if we check the heat sink capability of
optimized mass and compare with that of the initial mass
(i.e., 3.9kg), we can see that the heat sink capability is

INTERNATIONAL JOURNAL of ENGINEERING TECHNOLOGIES Onur Ozansoy et al., Vol.1, No.1, 2015
40
improved by 3.56% since the mass is increased; that is,
.
Table 5.2. Comparison of initial and optimized clutch
parameters and their objective functions.
Clutch TypeCushion Disp. (mm)
Pressure Plate
mass (kg)
Diaphragm Spring
Height (mm)
Max. Release load
(N)
Pressure Plate
Amplitudes (mm)
Initial Clutch 0,75 3,9 9,2 2250 0,185
Optimized Clutch 0,95 4,04 9 2170 0,127
Fig. 21. Pareto chart of the optimization problem, where the
objective #1 shows the pressure plate amplitude and the
objective #2 shows the maximum pedal load.
Fig. 22. Simulation results of pressure plate vibrations for
the optimized clutch (in time domain on the top and in
frequency domain on the bottom).
Fig. 23. Experimental measurements for pressure plate
vibrations measured on the physical model produced by
using optimized parameters (in time domain on the top and
in frequency domain on the bottom).
Fig. 24. Noise measurements of optimized system.
6. Conclusion
Axial vibrations in clutch systems are generally ignored
in studies on dynamic behavior of clutch systems in
literature, since the clutches are used to damp torsional
vibrations instead of the axial ones. However, axial
vibrations has to be examined for the driveline noise
calculations, in particular in the existence of transmission
rattle noise.
On the other hand, axial vibrations and pedal efforts are
actually highly related to each other, since they are both
derived by the same variables such as stiffness values of
springs in the clutch and clutch ratio. To this end,
mathematical models for the clutch pedal effort and clutch

INTERNATIONAL JOURNAL of ENGINEERING TECHNOLOGIES Onur Ozansoy et al., Vol.1, No.1, 2015
41
pressure plate vibrations are derived and built by using the programs MATLAB and MATLAB-Simulink toolbox.
Then, these models are verified by making comparisons
with experimental measurements. By combining the
simulation models together, a multi-objective optimization
problem is formulated and solved such that axial vibrations
and clutch pedal effort are minimized under some
constraints. At the end of the study, a physical model is also
produced by using the optimization results and physically
tested.
It is observed that experimental measurements and
simulation results are quite close to each other and axial
vibrations in the drive line is reduced by optimization
process. Under the light of findings of this study, it is
possible to calculate and design the components of a clutch
system in an optimum way, which will help decrease the test
and prototype costs significantly.
On the other hand, optimizing a clutch system
considering axial vibrations only will not degrade the
rotational vibrations and, in order to reduce the different
level of rotational vibrations from engine to transmissions
(e.g., idle vibrations, creep vibrations or drive vibrations,
etc…), different types of rotational dampers are used on
clutch discs. However, in our study we tried to reduce the
axial vibrations of disengaged clutch, thus effects of these
axial vibrations during half engaged clutch position (which
can be called slipping phase or engagement phase).
These axial vibrations have no influence on the system
when the clutch is fully engaged since very high clamp load
is already exerted on the pressure plate that prevents the axial
vibrations. However, a further study may also be planned to
optimize the rotational dampers so that they can be usable
during engagement phase. Thus, the clutch can be optimized
to minimize the axial vibrations and rotational dampers can
damp the residual vibrations which cannot be fully damped
by axial vibration optimization during engagement phase.
Acknowledgements
This research received no specific grant from any funding
agency in the public, commercial or not-for-profit sectors.
The authors declare that there is no conflict of interest.
References
[1] E. Galvagno, M. Velardocchia, A. Vigliani,
Dynamic and kinematic model of a dual clutch transmission,
Mech. and Mach. Theory 46 (6) (2011) 794-805.
[2] Manish Kulkarni, Taehyun Shim, Yi Zhang, Shift
dynamics and control of dual-clutch transmissions, Mech.
and Mach. Theory 42 (2) (2007) 168-182.
[3] Nowshir Fatima, Par Marklund, Roland Larsson,
Influence of clutch output shaft inertia and stiffness on the
performance of the wet clutch, Tribol. Trans. 56 (2) (2013)
310-319.
[4] Y. Zhang, X. Chen, X. Zhang, H. Jiang, W. Tobler,
Dynamic modeling and simulation of a dual-clutch
automated lay-shaft transmission, J. of Mech. Des. 127 (2)
(2005) 302-307.
[5] Q. Zheng, K. Srinivasan, G. Rizzoni, Dynamic
modeling and characterization of transmission response for
rontroller resign, SAE Int. 981094 (1998)
doi:10.4271/981094.
[6] C. Pan, J. Moskwa, Dynamic modeling and
simulation of the Ford AOD automobile transmission, SAE
Int. 950899 (1995) doi:10.4271/950899.
[7] Z. S. Filipi, D. N. Assanis, A nonlinear, transient,
single-cylinder diesel engine simulation for predictions of
instantaneous engine speed and torque, J. of Eng. for Gas
Turbines and Power. 123 (4) (2001) 951-959.
[8] E.M. Mockensturm, E.M. Balaji, Piece-wise linear
dynamic systems with one-way clutches, J. of Vib. and
Acoust 127 (5) (2005) 475-482.
[9] F.R. Zhu, R.G. Parker, Non-linear dynamics of a
one-way clutch in belt-pulley systems, J. of Sound And Vib.
279 (1-2) (2005) 285-308.
[10] T. Petrun, J. Flasker, M.A. Kegl, Friction model for
dynamic analyses of multi-body systems with a fully
functional friction clutch, J. of Multibody Dyn. 227 (2)
(2012) 89-105.
[11] A. R. Crowther, N. Zhang, Torsional finite elements
and nonlinear numerical modelling in vehicle powertrain
dynamics, J. of Sound and Vib. 284 (3) (2005) 825-849.
[12] C. Duan, R. Singh, Influence of harmonically
varying normal load on steady-state behavior of a 2dof
torsional system with dry friction, J. of Sound and Vib. 294
(3) (2006) 503-528.
[13] C. Duan, R. Singh, Dynamics of a 3dof torsional
system with a dry friction controlled path, J. of Sound and
Vib. 289 (4) (2006) 657-688.
[14] C. Padmanabhan, R. Singh, Influence of clutch
design on the reduction and perception of automotive
transmission rattle noise, Noise-Con 93 (1993) 607-612.
[15] H. Moradi, H. Salarieh, Analysis of nonlinear
oscillations in spur gear pairs with approximated modelling
of backlash nonlinearity, Mech. and Mach. Theory 51 (2012)
14-31.
[16] T. C. Kim, T. E. Rook, R. Singh, Super - and sub-
harmonic response calculations for a torsional system with
clearance nonlinearity using the harmonic balance method, J.
of Sound and Vib. 281 (3) (2005) 965-993.
[17] T. C. Kim, T. E. Rook, R. Singh, Effect of nonlinear
impact damping on the frequency response of a torsional
system with clearance, J. of Sound and Vib. 281 (3) (2005)
995-1021.
[18] J. Awrejcewicz, D. Grzelczyk, Modeling and
analytical/numerical analysis of wear processes in a
mechanical friction clutch, Inter. J. of Bifurc. and Chaos 21
(10) (2011) 2861-2869.

INTERNATIONAL JOURNAL of ENGINEERING TECHNOLOGIES Onur Ozansoy et al., Vol.1, No.1, 2015
42
[19] W. Zhang, G. Zhu, Research and application of PSO
algorithm for the diaphragm spring optimization, Forth Inter.
Conf. on Nat. Comput. (2008) 549-553.
[20] W. Yong-hai, Multi-objective optimization design
of vehicle clutch diaphragm spring, Second Inter. Conf. on
Intell. Comput. Technol. and Autom. (2009) 194-197.
[21] X. Guo, H. Lu, Optimal design on diaphragm spring
of automobile clutch, Second Inter. Conf. on Intell. Comput.
Technol. and Autom. (2009) 206-208.
[22] A. Li-jun, L. Tao, S. Bao-yu, Optimum design of
automobile diaphragm spring clutch, IEEE Veh. Power and
Propuls. Conf. (2008) 1-4.
[23] G. Ercole, G. Mattiazzo, S. Mauro, M.
Velardocchia, F. Amisano, G. Serra, Experimental
methodologies to determine diaphragm spring clutch
characteristics, SAE Int. (2000) 10.4271/2000-01-1151.
[24] W. Nam, C. Lee, Y. Chai, J. Kwon, Finite element
analysis and optimal design of automobile clutch diaphragm
spring, SAE Int. (2000) 2000-05-0125.
[25] W. Jin, Solid modeling and finite element analysis
of diaphragm spring clutch, Manag., Manuf. and Mater. Eng
452-453 (2012) 258-263.
[26] J. O. Almen, A. Laszlo, The uniform section disk
spring, ASME 58 (1936) 305-314.
[27] G. Wempner, Axisymmetric deflections of shallow
conical shells, J. of Eng. Mech. 90 (2) (1964) 181–194.
[28] G. Curti, M. A. Orlando, New Calculation of Coned
Annular Disk Spring, ASME Winter Annual Meet. (1976).
[29] Y. Zhiming, Y. Kaiyuan. A Study of Belleville
Spring and Diaphragm Spring in Engineering. J. of Appl.
Mech. 57 (4) (1990) 1026-1031.
[30] S. Ozaki, K. Tsuda, J. Tominaga, Analyses of static
and dynamic behavior of coned disk springs: effects of
friction boundaries, Thin-Walled Struct. 59 (2012) 132-143
[31] E. Fromm, W. Kleiner, Handbook for Disc Springs,
Heilbronn, SCHNORR, 2003.
[32] J. E. Shigley, C. Mischke, Standart Handbook of
Machine Design, third ed., McGraw-Hill, San Francisco,
2004.
[33] R. Esfahani, A. Farshidianfar, A. Shahrjerdi, F.
Mustapha, Longitudinal vibrations analysis of vehicular
clutch, Aust. J. of Basic and Appl. Sci. 3 (4) (2009) 3633-
3641.
[34] R. Singh, H. Xie, R. J. Comparin, Analysis of
automotive neutral gear rattle, J. of Sound and Vib. 131 (2)
1989 177-196.
[35] S. Theodossiade, O. Tangasawi, H. Rahnejat, Gear
teeth impacts in hydrodynamic conjunctions promoting idle
gear rattle, J. of Sound and Vib. 303 (3) (2007) 632-658.
[36] E. Rocca, R. Russo, Theoretical and experimental
investigation into the influence of the periodic backlash
fluctuations on the gear rattle, J. of Sound and Vib. 330 (20)
(2011) 4738-4752.
[37] Y. Kadmiri, E. Rigaud, J. P. Laudet, L. Vary,
Experimental and numerical analysis of automotive gearbox
rattle noise, J. of Sound and Vib. 331 (13) (2012) 3144-3157.
[38] M. Barthod, B. Hayne, J. L. Tebec, J. C. Pin,
Experimental study of gear rattle excited by a multi-
harmonic excitation, Appl. Acoust. 68 (9) (2007) 1003-1025.
[39] X. Wang, B. L. B. Gadegbeku, L. Bouzon,
Biomechanical evaluation of the comfort of automobile
clutch pedal operation, Int. J. of Ind. Ergon. 34 (3) (2004)
209-221.
[40] A. Shabibi, Solution of heat conduction problem in
automotive clutch and brake systems, Proc. of 2008 ASME
Summer Heat Transf. Conf. 321 (2008).
[41] A. R. Crowther, C. Janello, R. Singh, Quantification
of clearance-induced impulsive sources in a torsional system,
J. of Sound and Vib. 307 (3-5) (2007) 428-451.
[42] C. Duan, R. Singh, Super-harmonics in a torsional
system with dry friction path subject to harmonic excitation
under a mean torque, J. of Sound and Vib. 285 (4-5) (2005)
803-834.
[43] W. Reik, The self-adjusting clutch – SAC, 05th LuK
Symp. (1994) 43-62.
[44] K. L. Kimming The Self-Adjusting Clutch SAC of
the 2nd
Generation, LuK Symp. (1998) 5-22.
[45] R. Shaver, Manual Transmission Clutch System,
first ed., Warrendale: SAE, (1997), p: 28, 59-63.
[46] A. Reitz, J. W. Biermann, P. Kelly, Special Test
Bench to Investigate NVH Phenomena of the Clutch System,
Inst. für Kraftfahrwesen Aachen
[47] P. Kelly, H. Rahnejat, Clutch Pedal Dynamic Noise
and Vibration Investigation, Proc. of the 1st Int. Symp. on
Multi-Body Dyn.: Monit. and Simul. Tech., Bradford, UK,
MEP Press, 1997
[48] T. Hasabe, U. A. Seiki, Experimental Study of
Reduction Methods for Clutch Pedal Vibration and Drive
Train Rattling Noise from Clutch System, SAE Int. 932007
(1993). doi:10.4271/932007
[49] M. Özbakış, Observation and optimization of the
characteristic of the diaphragm springs used in clutch
systems, Master Thesis, Dokuz Eylül University, Turkey,
2008.
[50] A. Hagerodt, F. Küçükay, Optimum Design of
Return and Cushion Springs for Automatic Transmission
Clutches, SAE Int. 2001-01-870 (2001)
[51] V. Arora, G. Bhushan, M. L. Aggarwal, Eye Design
Analysis of Single Leaf Spring in Automotive Vehicles
Using CAE Tools, Int. J. of App. Eng. And Tech. 1 (1)
(2011) 88-97.
[52] V. Arora, M. L. Aggarwal, G. Bhushan, A
Comparative Study of CAE and Experimental Results of

INTERNATIONAL JOURNAL of ENGINEERING TECHNOLOGIES Onur Ozansoy et al., Vol.1, No.1, 2015
43
Leaf Springs in Automotive Vehicles, Int. J. of Eng. Sci. and
Tech. 3 (9) (2011) 6856-6866.
[53] Genetic Algorithm and Direct Search Toolbox™
User’s Guide, Natick, The MathWorks, Inc, (2009), p:48.