ontario student achievement - eqao€¦ · ontario student achievement 2018–2019 ... we are...
TRANSCRIPT

Ontario Student Achievement
2018–2019
EQAO’s Provincial Secondary School ReportResults of the Grade 9 Assessment of Mathematics and
the Ontario Secondary School Literacy Test
English-Language Students

About the Education Quality and Accountability Office
EQAO’s tests measure student achievement in reading, writing and mathematics in relation to
Ontario Curriculum expectations. The resulting data provide accountability and a gauge of quality
in Ontario’s publicly funded education system. By providing this important evidence about learning,
EQAO acts as a catalyst for increasing the success of Ontario students.
The objective and reliable results from EQAO’s tests complement the information obtained from
classroom and other assessments to provide students, parents, teachers and administrators with
a clear and comprehensive picture of student achievement and a basis for targeted improvement
planning at the individual, school, school board and provincial levels. EQAO helps build capacity
for the appropriate use of data by providing resources that educators, parents, policy-makers and
others in the education community can use to improve learning and teaching. EQAO distributes an
individual report to each student who writes a test, and posts school, school board and provincial
results on its website (www.eqao.com).
Mandate
EQAO is dedicated to working with the education community and to enhancing the quality and
accountability of the education system in Ontario. This is achieved through student assessments
that produce objective, reliable and relevant information, and through the timely public release of
this information along with recommendations for system improvement.
Values
EQAO values giving all students the opportunity to reach their highest possible level of
achievement and well-being.
EQAO values its role as a service to educators, parents, students, government and the public
in support of teaching and learning in the classroom.
EQAO values credible evidence that informs professional practice and focuses attention
on interventions that improve student success.
EQAO values research that informs large-scale assessment and classroom practice.
EQAO values the dedication and expertise of Ontario’s educators and their involvement in
all aspects of the assessment process and the positive difference their efforts make in student
outcomes.
EQAO values the delivery of its programs and services in a manner that embraces diversity and
moves beyond tolerance and celebration to inclusivity.
Ontario Student Achievement2018–2019
EQAO’s Provincial Secondary School ReportResults of the Grade 9 Assessment of Mathematics and
the Ontario Secondary School Literacy Test
English-Language Students
© 2019 Queen’s Printer for Ontario
ISBN: 978-1-4868-3745-8 (PDF)

DR. BETTE M. STEPHENSON (1924–2019)
This report is dedicated to the memory of Dr. Stephenson, former EQAO board member and Director Emeritus.
Dr. Stephenson’s lifelong passion was her commitment to public service, and EQAO will remember and cherish her for her many contributions to the agency.

BOARD OF DIRECTORS
Cameron Montgomery, Chair
David Agnew, Vice-Chair
Gail Anderson
Roland Boudreau
Michael Bowe
Emily Brown
Abirami Jeyaratnam
Jim Marsh
Pierre Riopel
Norah Marsh, Chief Executive Officer

EQAO’s Provincial Secondary School Report, 2018–2019
MESSAGE FROM THE CHAIR OF THE BOARD OF DIRECTORS
On behalf of the Board of Directors of the Education Quality and Accountability Office (EQAO),
I am pleased to present Ontario Student Achievement: Provincial Secondary School Report:
Results of the 2018–2019 Grade 9 Assessment of Mathematics and Ontario Secondary School
Literacy Test (OSSLT).
The objective data EQAO offers through its province-wide assessments contribute to
supporting public accountability, equity and improvements in our education system. By
assessing each student’s math and literacy skills in relation to curriculum expectations, EQAO
can shed light on areas that require further attention at a systemic and individual student level,
ensuring the education system continues to meet the current and future needs of every
Ontario student.
EQAO’s Grade 9 Assessment of Mathematics and OSSLT, administered at key stages in a
child’s learning development, give a measurement of student achievement in numeracy and
literacy. The information gained from cohort tracking helps us understand learning trends over
time, informs targeted strategies implemented by policy makers and educators, and is useful
for researchers, parents and guardians, and the rest of the public alike.
As one source of information among many others, the data provided by EQAO assessments
are a gauge of the strengths and weaknesses of our publicly funded education system. EQAO
is as always committed to helping the education community provide initiatives that will benefit
students and prepare them for a successful future.
Dr. Cameron Montgomery
Chair, Board of Directors
Dr. Cameron Montgomery Chair, Board of Directors

EQAO’s Provincial Secondary School Report, 2018–2019
MESSAGE FROM THE CEO
On behalf of the EQAO staff, it is my pleasure to present the provincial-level results of the
2018–2019 Grade 9 Assessment of Mathematics and the Ontario Secondary School Literacy
Test (OSSLT). We are committed to providing independent data that support student success
by highlighting trends in mathematics and literacy learning across Ontario.
To build a full picture of learners’ contexts and the factors that influence achievement, it is
important to consider assessment results alongside other information, such as demographic
data and EQAO questionnaire responses. In mathematics, for instance, responses to EQAO’s
Student Questionnaire show that at the secondary level, fewer than 60% of students reported
liking or being good at mathematics, and that students enrolled in the academic mathematics
course tended to have a more positive attitude toward mathematics than students enrolled in
the applied course. According to EQAO data this year, the trends in mathematics remained
relatively consistent, but the achievement gap between students enrolled in the applied and
academic courses persists.
With respect to literacy, this year most students in Grade 10 indicated that the types of
materials they read and write outside school most frequently are related to websites, e-mail or
chat messages and blogs. According to our assessment data this year, the trends in Grade 10
literacy are consistent. The percentage of students successful on the OSSLT continues to be
much lower for students enrolled in the applied English course than for students enrolled in the
academic course.
Some observations drawn from EQAO data may prompt further inquiry within a school’s
context. For example, EQAO research suggests that students’ attitudes toward mathematics
can influence their achievement; it is therefore worth considering what can be done to promote
students’ positive attitudes toward this subject. In literacy, further analysis is required to
determine how students’ reading and writing habits outside school affect their literacy skills.
The continued difference in outcomes for students enrolled in applied programming, whether
in mathematics or literacy, needs to be examined urgently. We know that students can
overcome learning challenges when the right kind of supports are in place. EQAO data clearly
demonstrate that students with gaps in their learning at an early age can go on and achieve at
a high level in academic courses in secondary school. EQAO data, along with information from
other sources, can be used to support inclusive strategies benefiting each child and youth of
this province.
Norah Marsh
Chief Executive Officer
Norah Marsh Chief Executive Officer

EQAO’s Provincial Secondary School Report, 2018–2019
THE EQAO ASSESSMENT PROCESS
About the Grade 9 Assessment of Mathematics
The Grade 9 Assessment of Mathematics measures how
well students enrolled in a Grade 9 applied or academic
mathematics course have met the Ontario Curriculum
expectations in mathematics up to the end of Grade 9.
The test is administered in two 60-minute sessions and
is conducted twice annually—in January for students in
first-semester courses and in June for students in second-
semester and full-year courses.
About the Ontario Secondary School Literacy Test
The Ontario Secondary School Literacy Test (OSSLT)
assesses the cross-curricular reading and writing skills
students are expected to have learned by the end of Grade 9,
as outlined in The Ontario Curriculum. Students across Ontario
write the OSSLT in two 75-minute sessions in March or April
each year. Students must be successful on the OSSLT, or
complete the Ontario Secondary School Literacy Course
(OSSLC), to earn their Ontario Secondary School Diploma.
Students who are not yet successful on the OSSLT receive
information about the areas in which they need to improve and
have the option to retake the test at its next administration or
to enrol in the OSSLC.
Design and Development
All EQAO tests are developed in keeping with the Principles
for Fair Student Assessment Practices for Education in Canada
(1993), a document created by representatives of national
education institutions and associations and widely endorsed
by Canada’s education community. EQAO consults with
internationally recognized experts in large-scale assessment
for all aspects of the tests: design, development, bias reviews,
field testing, administration, scoring and reporting. Educators
from across the province also work with EQAO on all aspects
of the assessments, including question development and
review (i.e., for bias, curriculum connection and content),
scoring-material development and scoring.
Parallel English- and French-language versions of the tests
are developed. Each version has the same number and types
of questions but reflects variations in the curricula for both
languages and, in the case of Grade 9, between the academic
and applied courses.
The Grade 9 Assessment of Mathematics contains multiple-
choice and open-response questions through which students
can demonstrate what they know and can do. Grade 9
students enrolled in the academic mathematics course
are assessed on their demonstration of knowledge and
skills across the four strands of the academic mathematics
curriculum: number sense and algebra, linear relations,
analytic geometry, and measurement and geometry. Grade 9
students enrolled in the applied mathematics course are
assessed on their demonstration of knowledge and skills
across the three strands of the applied mathematics
curriculum: number sense and algebra, linear relations, and
measurement and geometry.
The OSSLT measures student literacy through multiple-choice
questions, open-response reading questions, and short- and
long-writing tasks. Although each year’s test is made up of
a new set of questions, the literacy standard remains the
same. The standard for the OSSLT describes a minimum
acceptable level of student achievement. It describes student
performance in literacy that meets or exceeds the minimum
criteria (successful) or does not meet the minimum criteria
(not yet successful).

EQAO’s Provincial Secondary School Report, 2018–2019
Consistency and Fairness
Each year, schools are sent English- or French-language
administration guides. These guides provide instructions to
ensure that consistent administrative and accommodation
procedures are followed. The guides describe in detail what
is expected of educators involved in the administration of the
EQAO tests, including
• professional responsibilities for the administration of
the tests;
• detailed steps to follow (e.g., preparation of materials
for distribution to students, administration and return
of materials);
• the permitted accommodations and special provisions;
and
• the deferrals and exemptions allowed for students
participating in the OSSLT, according to the Ministry of
Education’s Ontario Schools, Kindergarten to Grade 12:
Policy and Program Requirements (2016).
Quality Assurance
EQAO has established quality-assurance procedures to help
ensure that its assessments are administered consistently and
fairly across the province and that the data produced are valid
and reliable. EQAO follows a number of procedures to ensure
that parents, educators and the public have confidence in the
validity and reliability of the results reported:
• Quality-assurance monitors: EQAO contracts quality-
assurance monitors to visit a random sample of schools in
order to observe the administration of the assessments
to determine the extent to which EQAO guidelines are
being followed.
• Examination of test materials: Following each
assessment, EQAO looks for evidence of possible
irregularities in its administration. This is done through an
examination of test materials from a random sample of
schools prior to scoring.
• Follow-up on reports of irregularities: EQAO
systematically follows up on any reports of irregularities
received from principals, teachers, parents and others.
• Database analyses: EQAO conducts analyses that identify
student response patterns that suggest the possibility of
collusion between two or more students.
Scoring
EQAO’s scoring procedures are designed to ensure accurate,
fair and reliable results for all students. Before scoring takes
place, all student booklets are scrambled so that they can
be distributed randomly to scorers. All student booklets go
through “blind scoring,” with no information on the student
work that could identify a student. EQAO’s scoring process
includes scorer training, which requires successful completion
of a qualifying test, and monitoring for validity and reliability.
The validity and reliability of scoring is continuously tracked at
the scoring site, and retraining occurs if it is required.
The OSSLT is double scored, which means that every open-
response question and writing task is scored independently
by two trained scorers. If the two scores are not identical or
adjacent, an expert scorer adjudicates the score.
Given the EQAO scoring process, parents and students can
be assured that the results obtained are a reliable indication of
the students’ work and that the work has been scored against
the same standard, which has been applied consistently for all
students across the province and from year to year.
Reporting
The results of the assessments yield individual, school and
school-board data on student achievement. EQAO posts
board and school results on its Web site for public access.
As well, EQAO publishes an annual provincial report for
education stakeholders and the general public.
Data from the assessments provide valuable information to
support improvement planning at the school, school board
and provincial levels.

1 EQAO’s Provincial Secondary School Report, 2018–2019
Key Observations . . . . . . . . . . . . . . . . . . . . . . . . . . . . . . . . . . . . . . . . . . . . . . . . . . . . . . . . . . . . . . . . . . . . . . . . . . . . . . . . 2
Grade 9 Assessment of Mathematics . . . . . . . . . . . . . . . . . . . . . . . . . . . . . . . . . . . . . . . . . . . . . . . . . . . . . . . . . . . . . 5
Grade 9 Assessment of Mathematics: Contextual Information . . . . . . . . . . . . . . . . . . . . . . . . . . . . . . . . . . . . . . . . . . 6
Questionnaire Results Over Time . . . . . . . . . . . . . . . . . . . . . . . . . . . . . . . . . . . . . . . . . . . . . . . . . . . . . . . . . . . . . . . . . 6
Demographic Information and Participation Rates Over Time . . . . . . . . . . . . . . . . . . . . . . . . . . . . . . . . . . . . . . . . . . 20
Grade 9 Academic Mathematics Course: Achievement Results . . . . . . . . . . . . . . . . . . . . . . . . . . . . . . . . . . . . . . . . 22
Results for All Students Over Time . . . . . . . . . . . . . . . . . . . . . . . . . . . . . . . . . . . . . . . . . . . . . . . . . . . . . . . . . . . . . . . 22
Results by Gender . . . . . . . . . . . . . . . . . . . . . . . . . . . . . . . . . . . . . . . . . . . . . . . . . . . . . . . . . . . . . . . . . . . . . . . . . . . . 23
Results by Student Status . . . . . . . . . . . . . . . . . . . . . . . . . . . . . . . . . . . . . . . . . . . . . . . . . . . . . . . . . . . . . . . . . . . . . . 25
Grade 9 Applied Mathematics Course: Achievement Results . . . . . . . . . . . . . . . . . . . . . . . . . . . . . . . . . . . . . . . . . . 27
Results for All Students Over Time . . . . . . . . . . . . . . . . . . . . . . . . . . . . . . . . . . . . . . . . . . . . . . . . . . . . . . . . . . . . . . . 27
Results by Gender . . . . . . . . . . . . . . . . . . . . . . . . . . . . . . . . . . . . . . . . . . . . . . . . . . . . . . . . . . . . . . . . . . . . . . . . . . . . 28
Results by Student Status . . . . . . . . . . . . . . . . . . . . . . . . . . . . . . . . . . . . . . . . . . . . . . . . . . . . . . . . . . . . . . . . . . . . . . 30
Cohort Tracking: Grade 3 to Grade 6 to Grade 9 . . . . . . . . . . . . . . . . . . . . . . . . . . . . . . . . . . . . . . . . . . . . . . . . . . . . . 32
Tracking Progress in Mathematics from Grade 3 Through Grade 6 to Grade 9 . . . . . . . . . . . . . . . . . . . . . . . . . . . . 32
Grade 9 Assessment of Mathematics: Explanation of Terms . . . . . . . . . . . . . . . . . . . . . . . . . . . . . . . . . . . . . . . . . . 34
Ontario Secondary School Literacy Test (OSSLT) . . . . . . . . . . . . . . . . . . . . . . . . . . . . . . . . . . . . . . . . . . . . . . . . . . 35
OSSLT—First-Time Eligible Students: Contextual Information . . . . . . . . . . . . . . . . . . . . . . . . . . . . . . . . . . . . . . . . . 36
Questionnaire Results Over Time . . . . . . . . . . . . . . . . . . . . . . . . . . . . . . . . . . . . . . . . . . . . . . . . . . . . . . . . . . . . . . . . 36
Demographic Information and Participation Rates Over Time . . . . . . . . . . . . . . . . . . . . . . . . . . . . . . . . . . . . . . . . . . 39
OSSLT—Previously Eligible Students: Contextual Information . . . . . . . . . . . . . . . . . . . . . . . . . . . . . . . . . . . . . . . . . 40
Questionnaire Results . . . . . . . . . . . . . . . . . . . . . . . . . . . . . . . . . . . . . . . . . . . . . . . . . . . . . . . . . . . . . . . . . . . . . . . . . 40
Demographic Information and Participation Rates Over Time . . . . . . . . . . . . . . . . . . . . . . . . . . . . . . . . . . . . . . . . . . 43
OSSLT—First-Time Eligible Students: Achievement Results . . . . . . . . . . . . . . . . . . . . . . . . . . . . . . . . . . . . . . . . . . . 44
Results for All Students Over Time . . . . . . . . . . . . . . . . . . . . . . . . . . . . . . . . . . . . . . . . . . . . . . . . . . . . . . . . . . . . . . . 44
Results by Gender . . . . . . . . . . . . . . . . . . . . . . . . . . . . . . . . . . . . . . . . . . . . . . . . . . . . . . . . . . . . . . . . . . . . . . . . . . . . 45
Results by Student Status . . . . . . . . . . . . . . . . . . . . . . . . . . . . . . . . . . . . . . . . . . . . . . . . . . . . . . . . . . . . . . . . . . . . . . 48
Results by Course Type in English . . . . . . . . . . . . . . . . . . . . . . . . . . . . . . . . . . . . . . . . . . . . . . . . . . . . . . . . . . . . . . . 51
OSSLT—Previously Eligible Students: Achievement Results . . . . . . . . . . . . . . . . . . . . . . . . . . . . . . . . . . . . . . . . . . . 54
Results for All Students Over Time . . . . . . . . . . . . . . . . . . . . . . . . . . . . . . . . . . . . . . . . . . . . . . . . . . . . . . . . . . . . . . . 54
Results by Gender . . . . . . . . . . . . . . . . . . . . . . . . . . . . . . . . . . . . . . . . . . . . . . . . . . . . . . . . . . . . . . . . . . . . . . . . . . . . 55
Results by Student Status . . . . . . . . . . . . . . . . . . . . . . . . . . . . . . . . . . . . . . . . . . . . . . . . . . . . . . . . . . . . . . . . . . . . . . 58
Cohort Tracking: Grade 3 to Grade 6 to Grade 10 (OSSLT) . . . . . . . . . . . . . . . . . . . . . . . . . . . . . . . . . . . . . . . . . . . . . 61
Tracking Progress in Literacy from Grade 3 Through Grade 6 to Grade 10 (OSSLT) . . . . . . . . . . . . . . . . . . . . . . . . 61
OSSLT: Explanation of Terms . . . . . . . . . . . . . . . . . . . . . . . . . . . . . . . . . . . . . . . . . . . . . . . . . . . . . . . . . . . . . . . . . . . . . 62
Contents

EQAO’s Provincial Secondary School Report, 2018–2019 2
GRADE 9 ASSESSMENT OF MATHEMATICS AND THE OSSLT
Learners’ Context
Data from EQAO’s Student Questionnaires offer valuable attitudinal and behavioural information about student learning in mathematics and literacy. This type of information is important and should be considered alongside assessment results and data from other sources to build a full understanding of student learning in Ontario.
Below is information about responses from students who completed EQAO’s Student Questionnaire.
• One-third of Grade 9 students enrolled in the applied mathematics course like mathematics, and
a similar percentage see themselves as good at mathematics (35% and 32% respectively), while
more than half of Grade 9 students enrolled in the academic mathematics course like mathematics
and a similar percentage see themselves as good at mathematics (57% and 54% respectively).
Grade 9 students enrolled in the academic course have significantly higher perceived self-efficacy
in mathematics than students enrolled in the applied course.
• Of Grade 10 students, 51% reported that the type of reading material they engaged with most
frequently outside school are websites, e-mail or chat messages and blogs.
• Of Grade 10 students, 52% reported that the types of writing they engaged in most frequently
outside school are on social media (Twitter, Facebook, blogs) or texting.
• Of Grade 10 students, 23% reported that the types of writing they engaged in second most
frequently outside school are work-related.
Assessment Results
Grade 9 Assessment of Mathematics
Since 2016, the percentage of Grade 9 students who met the provincial mathematics standard
has remained stable for both students enrolled in the academic and those enrolled in the applied
mathematics course. In 2019,
• 84% of students enrolled in the Grade 9 academic course met the provincial mathematics
standard.
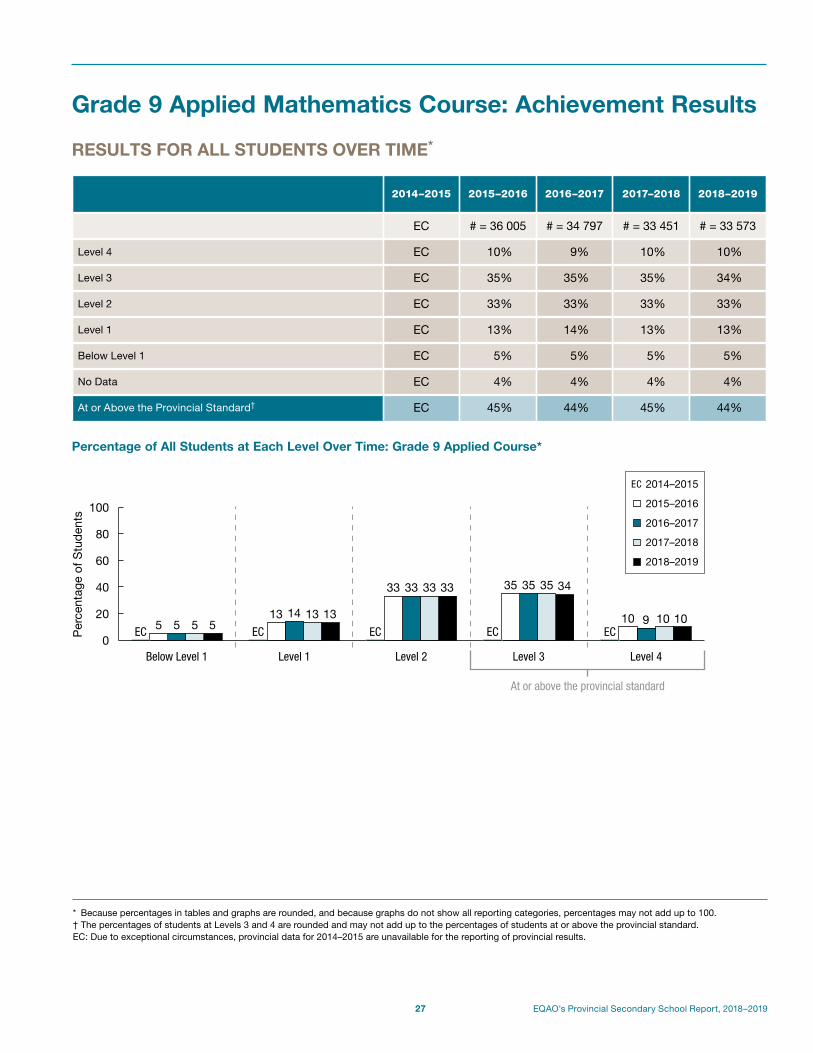
• 44% of students enrolled in the Grade 9 applied course met the provincial mathematics standard.
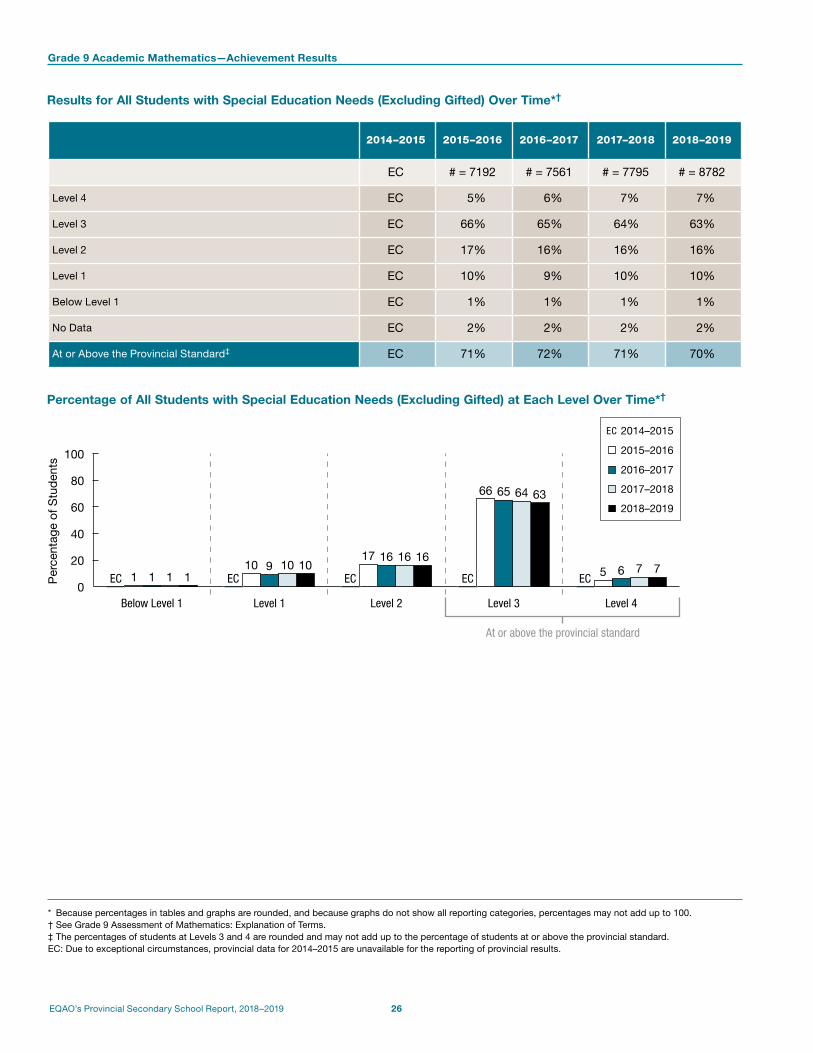
• 70% of students with special education needs in the Grade 9 academic course met the provincial
mathematics standard.
• 37% of students with special education needs in the Grade 9 applied course met the provincial
mathematics standard.
Key Observations
3 EQAO’s Provincial Secondary School Report, 2018–2019
Key Observations: Grade 9 Assessment of Mathematics and the OSSLT
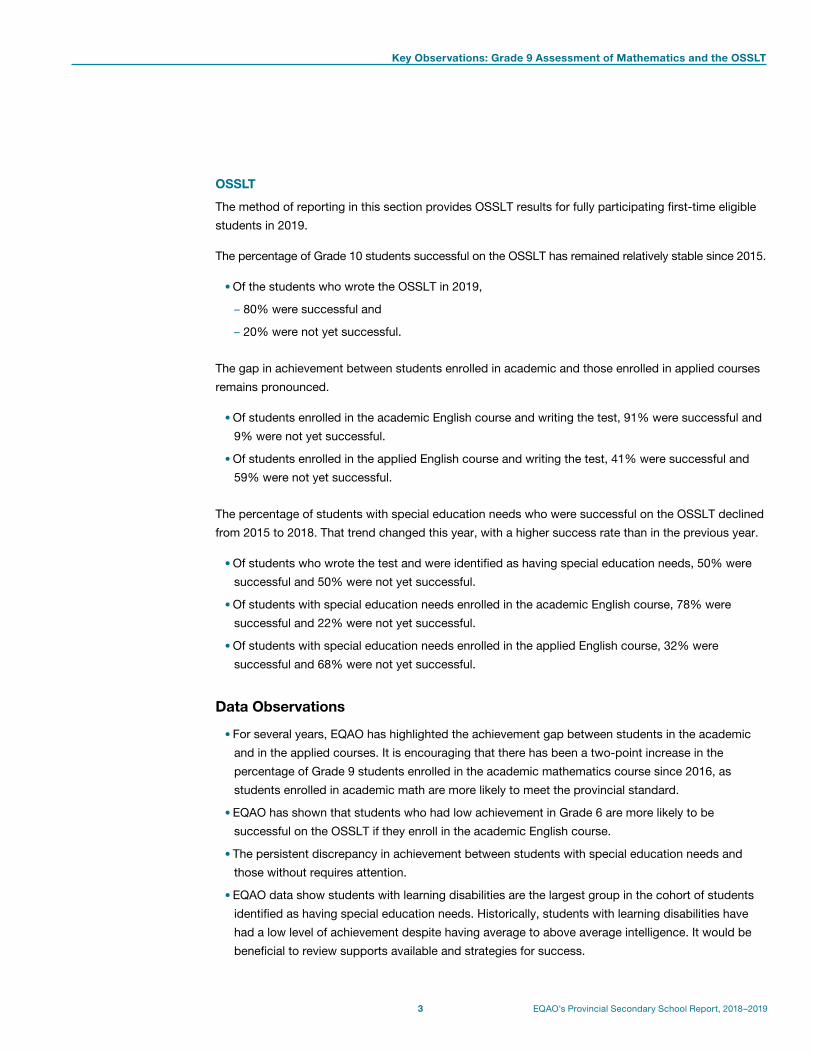
OSSLT
The method of reporting in this section provides OSSLT results for fully participating first-time eligible
students in 2019.
The percentage of Grade 10 students successful on the OSSLT has remained relatively stable since 2015.
• Of the students who wrote the OSSLT in 2019,
– 80% were successful and
– 20% were not yet successful.
The gap in achievement between students enrolled in academic and those enrolled in applied courses
remains pronounced.
• Of students enrolled in the academic English course and writing the test, 91% were successful and
9% were not yet successful.
• Of students enrolled in the applied English course and writing the test, 41% were successful and
59% were not yet successful.
The percentage of students with special education needs who were successful on the OSSLT declined
from 2015 to 2018. That trend changed this year, with a higher success rate than in the previous year.
• Of students who wrote the test and were identified as having special education needs, 50% were
successful and 50% were not yet successful.
• Of students with special education needs enrolled in the academic English course, 78% were
successful and 22% were not yet successful.
• Of students with special education needs enrolled in the applied English course, 32% were
successful and 68% were not yet successful.
Data Observations
• For several years, EQAO has highlighted the achievement gap between students in the academic
and in the applied courses. It is encouraging that there has been a two-point increase in the
percentage of Grade 9 students enrolled in the academic mathematics course since 2016, as
students enrolled in academic math are more likely to meet the provincial standard.
• EQAO has shown that students who had low achievement in Grade 6 are more likely to be
successful on the OSSLT if they enroll in the academic English course.
• The persistent discrepancy in achievement between students with special education needs and
those without requires attention.
• EQAO data show students with learning disabilities are the largest group in the cohort of students
identified as having special education needs. Historically, students with learning disabilities have
had a low level of achievement despite having average to above average intelligence. It would be
beneficial to review supports available and strategies for success.


Grade 9 Assessment of Mathematics

EQAO’s Provincial Secondary School Report, 2018–2019 6
Grade 9 Assessment of Mathematics: Contextual Information
QUESTIONNAIRE RESULTS OVER TIME
The following tables provide results from a sample of items from the questionnaires completed by students.
Student Questionnaire Results—Grade 9 Academic Mathematics*
2014–2015
2015–2016
2016–2017
2017–2018
2018–2019
2014–2015
2015–2016
2016–2017
2017–2018
2018–2019
Female Male
Students who completed the questionnaire
EC # = 46 352
# = 46 134
# = 46 170
# = 47 009 EC # =
43 809# =
43 609# =
42 875# =
44 386
STUDENT ATTITUDES TOWARD MATHEMATICS
Percentage of students indicating that they “agree” or “strongly agree” with the following statements:†
I like mathematics. EC 52% 53% 53% 52% EC 62% 63% 63% 63%
I am good at mathematics. EC 50% 50% 49% 48% EC 62% 61% 61% 60%
I am able to answer difficult mathematics questions.
EC 39% 40% 40% 41% EC 56% 57% 57% 58%
Mathematics is one of my favourite subjects.
EC 35% 36% 37% 36% EC 45% 47% 47% 47%
I understand most of the mathematics I am taught.
EC 72% 72% 72% 72% EC 77% 77% 77% 77%
Mathematics is an easy subject. EC 24% 25% 24% 24% EC 34% 34% 34% 35%
I do my best in mathematics class. EC 76% 76% 77% 77% EC 68% 69% 69% 69%
The mathematics I learn now is useful for everyday life.
EC 27% 29% 28% 26% EC 35% 36% 35% 31%
The mathematics I learn now helps me do work in other subjects.
EC 55% 56% 56% 54% EC 58% 59% 59% 57%
I need to do well in mathematics to study what I want later.
EC 61% 62% 62% 61% EC 67% 67% 67% 65%
I need to keep taking mathematics for the kind of job I want after I leave school.
EC 56% 56% 56% 55% EC 62% 61% 60% 59%
Percentage of students indicating they complete their mathematics homework at the following frequencies:‡
I am not usually assigned any mathematics homework.
EC 1% 1% 1% 2% EC 1% 2% 2% 2%
Never or almost never EC 3% 3% 3% 3% EC 7% 7% 7% 8%
Sometimes EC 17% 17% 18% 18% EC 25% 26% 25% 26%
Often EC 36% 36% 36% 36% EC 37% 37% 37% 36%
Always EC 38% 36% 36% 35% EC 25% 23% 23% 23%
* Numbers and percentages are based on the total number of students who completed the questionnaire and for whom gender data were available.† The other response options were “strongly disagree,” “disagree” and “neither agree nor disagree.”‡ Because of missing responses, percentages may not add up to 100.EC: Due to exceptional circumstances, provincial data for 2014–2015 are unavailable for the reporting of provincial results.

7 EQAO’s Provincial Secondary School Report, 2018–2019
Grade 9 Academic Mathematics—Questionnaire Results Over Time
Student Questionnaire Results—Grade 9 Academic Mathematics (continued)
2014–2015
2015–2016
2016–2017
2017–2018
2018–2019
2014–2015
2015–2016
2016–2017
2017–2018
2018–2019
Female Male
Students who completed the questionnaire
EC # = 46 352
# = 46 134
# = 46 170
# = 47 009 EC # =
43 809# =
43 609# =
42 875# =
44 386
STUDENT ATTITUDES TOWARD MATHEMATICS (CONTINUED)
Percentage of students indicating they feel “confident” or “very confident” that they can answer mathematics questions related to the following:*
Number sense (e.g., operations with integers, rational numbers, exponents)
EC 60% 61% 62% 61% EC 74% 74% 75% 75%
Algebra (e.g., solving equations, simplifying expressions with polynomials)
EC 67% 69% 68% 68% EC 71% 72% 72% 72%
Linear relations (e.g., scatter plots, lines of best fit)
EC 56% 55% 55% 55% EC 67% 66% 66% 67%
Analytic geometry (e.g., slope, y-intercept, equations of lines)
EC 59% 59% 58% 58% EC 66% 66% 66% 66%
Measurement (e.g., perimeter, area, volume)
EC 74% 74% 73% 73% EC 82% 82% 81% 82%
Geometry (e.g., angles, parallel lines) EC 65% 68% 65% 66% EC 74% 76% 74% 75%
Percentage of students indicating they do the following “often” or “very often” when studying mathematics or working on a mathematics problem:†
I connect new mathematics concepts to what I already know about mathematics or other subjects.
EC 44% 46% 47% 47% EC 47% 47% 49% 49%
I check my mathematics answers to see if they make sense.
EC 77% 79% 80% 80% EC 71% 72% 74% 75%
I apply new mathematics concepts to real-life problems.
EC 19% 20% 20% 20% EC 27% 27% 27% 26%
I take time to discuss my mathematics assignments with my classmates.
EC 42% 42% 44% 43% EC 37% 37% 38% 39%
I look for more than one way to solve mathematics problems.
EC 43% 43% 45% 45% EC 49% 47% 49% 48%
* The other response options were “not at all confident” and “somewhat confident.” † The other response options were “never or almost never” and “sometimes.” EC: Due to exceptional circumstances, provincial data for 2014–2015 are unavailable for the reporting of provincial results.

EQAO’s Provincial Secondary School Report, 2018–2019 8
Grade 9 Academic Mathematics—Questionnaire Results Over Time
Student Questionnaire Results—Grade 9 Academic Mathematics (continued)
2014–2015
2015–2016
2016–2017
2017–2018
2018–2019
2014–2015
2015–2016
2016–2017
2017–2018
2018–2019
Female Male
Students who completed the questionnaire
EC # = 46 352
# = 46 134
# = 46 170
# = 47 009 EC # =
43 809# =
43 609# =
42 875# =
44 386
OUT-OF-SCHOOL ACTIVITIES
Percentage of students indicating that they do the following “every day or almost every day” when they are not at school:*
Read by themselves EC 28% 27% 25% 23% EC 15% 14% 14% 13%
Use the Internet EC 91% 91% 93% 93% EC 88% 89% 91% 92%
Play video games EC 7% 7% 8% 9% EC 42% 42% 50% 47%
Participate in sports or other physical activities
EC 34% 34% 34% 33% EC 49% 49% 50% 48%
Percentage of students indicating that they do the following at least once a week when they are not at school:†
Participate in art, music or drama activities
EC 49% 51% 51% 50% EC 30% 32% 32% 31%
Participate in other clubs or organizations EC 40% 41% 41% 40% EC 40% 41% 41% 40%
Work at a paid job EC 16% 17% 17% 18% EC 20% 20% 20% 19%
Percentage of students indicating that they do the following at least once a month when they are not at school:‡
Volunteer in their community EC 72% 72% 73% 68% EC 62% 62% 63% 60%
NUMBER OF SCHOOLS ATTENDED
Percentage of students indicating attending the following number of schools from kindergarten to Grade 8:§
1 school/2 schools EC 62% 59% 60% 59% EC 62% 58% 60% 59%
3 schools/4 schools EC 28% 27% 28% 29% EC 28% 28% 28% 28%
5 or more schools EC 7% 7% 7% 8% EC 6% 7% 7% 7%
* The other response options were “never,” “1 or 2 times a month” and “1 to 3 times a week.”† The percentages are based on the number of students who answered “1 to 3 times a week” or “every day or almost every day.”‡ The percentages are based on the number of students who answered “1 or 2 times a month,” “1 to 3 times a week” or “every day or almost every day.”§ Because of missing or excluded responses, percentages may not add up to 100.EC: Due to exceptional circumstances, provincial data for 2014–2015 are unavailable for the reporting of provincial results.

9 EQAO’s Provincial Secondary School Report, 2018–2019
Grade 9 Academic Mathematics—Questionnaire Results Over Time
Student Questionnaire Results—Grade 9 Academic Mathematics (continued)
2014–2015
2015–2016
2016–2017
2017–2018
2018–2019
2014–2015
2015–2016
2016–2017
2017–2018
2018–2019
Female Male
Students who completed the questionnaire*
EC # = 46 352
# = 46 134
# = 46 170
# = 47 009 EC # =
43 809# =
43 609# =
42 875# =
44 386
USE OF THE ASSESSMENT IN STUDENTS’ CLASS MARKS
Percentage of students who indicated that their teacher will count some or all parts of the Grade 9 Assessment of Mathematics as part of their class mark:*
EC 73% 71% 72% 71% EC 68% 65% 66% 64%
Percentage of students indicating they were told how much the Grade 9 Assessment of Mathematics will count as part of their class mark:†
EC 95% 94% 95% 95% EC 94% 94% 94% 95%
Percentage of students who indicated that counting the Grade 9 Assessment of Mathematics as part of their class mark motivates them to take the assessment more seriously:†‡
EC 80% 81% 81% 81% EC 76% 77% 78% 77%
* The response options were “yes,” “no” and “don’t know.” The percentages given represent those students who answered “yes.” † The response options were “yes,” “no” and “undecided.” The percentages given represent those students who answered “yes.”‡ The percentages for this question are based on the number of students who answered “yes” to the first question in the above table.
2014–2015: EC 2015–2016: Females: # = 33 697; Males: # = 29 653 2016–2017: Females: # = 32 782; Males: # = 28 454 2017–2018: Females: # = 33 386; Males: # = 28 319 2018–2019: Females: # = 33 563; Males: # = 28 560
EC: Due to exceptional circumstances, provincial data for 2014–2015 are unavailable for the reporting of provincial results.

EQAO’s Provincial Secondary School Report, 2018–2019 10
Grade 9 Applied Mathematics—Questionnaire Results Over Time
The following tables provide results from a sample of items from the questionnaires completed by students.
Student Questionnaire Results—Grade 9 Applied Mathematics*
2014–2015
2015–2016
2016–2017
2017–2018
2018–2019
2014–2015
2015–2016
2016–2017
2017–2018
2018–2019
Female Male
Students who completed the questionnaire
EC # = 13 700
# = 13 280
# = 13 003
# = 12 493 EC # =
17 155# =
16 786# =
16 239# =
16 121
STUDENT ATTITUDES TOWARD MATHEMATICS
Percentage of students indicating that they “agree” or “strongly agree” with the following statements:†
I like mathematics. EC 30% 31% 31% 29% EC 39% 40% 41% 40%
I am good at mathematics. EC 27% 27% 27% 25% EC 40% 41% 39% 38%
I am able to answer difficult mathematics questions.
EC 16% 16% 17% 16% EC 29% 31% 31% 32%
Mathematics is one of my favourite subjects.
EC 18% 18% 19% 18% EC 24% 24% 25% 24%
I understand most of the mathematics I am taught.
EC 56% 56% 58% 55% EC 63% 64% 63% 63%
Mathematics is an easy subject. EC 13% 13% 13% 12% EC 21% 22% 21% 21%
I do my best in mathematics class. EC 72% 72% 74% 74% EC 65% 66% 66% 66%
The mathematics I learn now is useful for everyday life.
EC 29% 31% 31% 28% EC 36% 37% 36% 32%
The mathematics I learn now helps me do work in other subjects.
EC 43% 45% 46% 44% EC 47% 48% 48% 46%
I need to do well in mathematics to study what I want later.
EC 47% 47% 48% 46% EC 52% 53% 52% 51%
I need to keep taking mathematics for the kind of job I want after I leave school.
EC 40% 41% 40% 38% EC 45% 45% 44% 42%
Percentage of students indicating they complete their mathematics homework with the following frequencies:‡
I am not usually assigned any mathematics homework.
EC 10% 11% 13% 13% EC 11% 13% 14% 14%
Never or almost never EC 5% 5% 5% 6% EC 9% 8% 9% 10%
Sometimes EC 25% 25% 25% 25% EC 29% 29% 28% 29%
Often EC 31% 30% 30% 29% EC 30% 29% 28% 27%
Always EC 22% 20% 20% 19% EC 14% 14% 14% 14%
* Numbers and percentages are based on the total number of students who completed the questionnaire and for whom gender data were available.† The other response options were “strongly disagree,” “disagree” and “neither agree nor disagree.”‡ Because of missing responses, percentages may not add up to 100.EC: Due to exceptional circumstances, provincial data for 2014–2015 are unavailable for the reporting of provincial results.

11 EQAO’s Provincial Secondary School Report, 2018–2019
Grade 9 Applied Mathematics—Questionnaire Results Over Time
Student Questionnaire Results—Grade 9 Applied Mathematics (continued)
2014–2015
2015–2016
2016–2017
2017–2018
2018–2019
2014–2015
2015–2016
2016–2017
2017–2018
2018–2019
Female Male
Students who completed the questionnaire
EC # = 13 700
# = 13 280
# = 13 003
# = 12 493 EC # =
17 155# =
16 786# =
16 239# =
16 121
STUDENT ATTITUDES TOWARD MATHEMATICS (CONTINUED)
Percentage of students indicating they feel “confident” or “very confident” that they can answer mathematics questions related to the following:*
Number sense (e.g., operations with integers, rational numbers, exponents)
EC 33% 33% 33% 33% EC 46% 47% 47% 47%
Algebra (e.g., solving equations, simplifying expressions with polynomials)
EC 39% 40% 41% 40% EC 44% 45% 46% 45%
Linear relations (e.g., scatter plots, lines of best fit)
EC 51% 51% 48% 50% EC 61% 60% 59% 60%
Measurement (e.g., perimeter, area, volume)
EC 63% 64% 63% 60% EC 70% 70% 68% 68%
Geometry (e.g., angles, parallel lines) EC 38% 41% 42% 40% EC 51% 52% 53% 53%
Percentage of students indicating they do the following “often” or “very often” when studying mathematics or working on a mathematics problem:†
I connect new mathematics concepts to what I already know about mathematics or other subjects.
EC 23% 24% 26% 26% EC 27% 28% 28% 28%
I check my mathematics answers to see if they make sense.
EC 61% 63% 65% 66% EC 57% 59% 60% 61%
I apply new mathematics concepts to real-life problems.
EC 15% 16% 17% 16% EC 23% 23% 23% 22%
I take time to discuss my mathematics assignments with my classmates.
EC 23% 24% 25% 25% EC 21% 21% 23% 22%
I look for more than one way to solve mathematics problems.
EC 37% 38% 39% 40% EC 42% 42% 42% 42%
* The other response options were “not at all confident” and “somewhat confident.” † The other response options were “never or almost never” and “sometimes.”EC: Due to exceptional circumstances, provincial data for 2014–2015 are unavailable for the reporting of provincial results.

EQAO’s Provincial Secondary School Report, 2018–2019 12
Grade 9 Applied Mathematics—Questionnaire Results Over Time
* The other response options were “never,” “1 or 2 times a month” and “1 to 3 times a week.”† The percentages are based on the number of students who answered “1 to 3 times a week” or “every day or almost every day.”‡ The percentages are based on the number of students who answered “1 or 2 times a month,” “1 to 3 times a week” or “every day or almost every day.”§ Because of missing or excluded responses, percentages may not add up to 100.EC: Due to exceptional circumstances, provincial data for 2014–2015 are unavailable for the reporting of provincial results.
Student Questionnaire Results—Grade 9 Applied Mathematics (continued)
2014–2015
2015–2016
2016–2017
2017–2018
2018–2019
2014–2015
2015–2016
2016–2017
2017–2018
2018–2019
Female Male
Students who completed the questionnaire
EC # = 13 700
# = 13 280
# = 13 003
# = 12 493 EC # =
17 155# =
16 786# =
16 239# =
16 121
OUT-OF-SCHOOL ACTIVITIES
Percentage of students indicating that they do the following “every day or almost every day” when they are not at school:*
Read by themselves EC 23% 22% 21% 20% EC 11% 11% 10% 10%
Use the Internet EC 87% 88% 89% 89% EC 82% 84% 86% 86%
Play video games EC 12% 12% 13% 14% EC 46% 45% 53% 53%
Participate in sports or other physical activities
EC 25% 25% 25% 25% EC 44% 44% 43% 42%
Percentage of students indicating that they do the following at least once a week when they are not at school:†
Participate in art, music or drama activities
EC 42% 43% 43% 43% EC 25% 26% 26% 26%
Participate in other clubs or organizations EC 25% 25% 24% 24% EC 26% 27% 27% 25%
Work at a paid job EC 17% 18% 17% 18% EC 23% 24% 23% 23%
Percentage of students indicating that they do the following at least once a month when they are not at school:‡
Volunteer in their community EC 59% 58% 58% 53% EC 51% 52% 51% 46%
NUMBER OF SCHOOLS ATTENDED
Percentage of students indicating attending the following number of schools from kindergarten to Grade 8:§
1 school/2 schools EC 56% 52% 52% 53% EC 59% 55% 55% 56%
3 schools/4 schools EC 29% 29% 30% 29% EC 28% 27% 28% 28%
5 or more schools EC 11% 12% 12% 12% EC 9% 10% 10% 9%

13 EQAO’s Provincial Secondary School Report, 2018–2019
Grade 9 Applied Mathematics—Questionnaire Results Over Time
Student Questionnaire Results—Grade 9 Applied Mathematics (continued)
2014–2015
2015–2016
2016–2017
2017–2018
2018–2019
2014–2015
2015–2016
2016–2017
2017–2018
2018–2019
Female Male
Students who completed the questionnaire*
EC # = 13 700
# = 13 280
# = 13 003
# = 12 493 EC # =
17 155# =
16 786# =
16 239# =
16 121
USE OF THE ASSESSMENT IN STUDENTS’ CLASS MARKS
Percentage of students who indicated that their teacher will count some or all parts of the Grade 9 Assessment of Mathematics as part of their class mark:†
EC 47% 47% 47% 47% EC 42% 40% 41% 40%
Percentage of students indicating they were told how much the Grade 9 Assessment of Mathematics will count as part of their class mark:‡
EC 90% 89% 89% 90% EC 88% 88% 88% 88%
Percentage of students who indicated that counting the Grade 9 Assessment of Mathematics as part of their class mark motivates them to take the assessment more seriously:‡§
EC 78% 79% 79% 78% EC 76% 76% 75% 75%
* Includes only those students for whom gender data were available.† The response options were “yes,” “no” and “don’t know.” The percentages given represent those students who answered “yes.” ‡ The percentages for this question are based on the number of students who answered “yes” to the first question in the above table.
2014–2015: EC 2015–2016: Females: # = 6379; Males: # = 7239 2016–2017: Females: # = 6226; Males: # = 6764 2017–2018: Females: # = 6047; Males: # = 6595 2018–2019: Females: # = 5814; Males: # = 6496
§ The response options were “yes,” “no” and “undecided.” The percentages given represent those students who answered “yes.”EC: Due to exceptional circumstances, provincial data for 2014–2015 are unavailable for the reporting of provincial results.

EQAO’s Provincial Secondary School Report, 2018–2019 14
Grade 9 Academic Mathematics—Questionnaire Results Over Time
The following tables provide results from a sample of items from the questionnaires completed by teachers during the administrations
of the Grade 9 Assessment of Mathematics.
Teacher Questionnaire Results—Grade 9 Academic Mathematics
2014–2015 2015–2016 2016–2017 2017–2018 2018–2019
Teachers who completed the questionnaire EC # = 2428 # = 2390 # = 2298 # = 2223
USE OF EQAO RESOURCES
Percentage of teachers who indicated that they used EQAO data (demographic data, assessment and questionnaire results) this past year, independently or with a school team, to do the following:
Identify how well students are meeting curriculum expectations
EC 65% 72% 68% 66%
Communicate with parents and guardians about student achievement
EC 32% 34% 32% 32%
Identify areas of strength and areas for improvement in Grade 9 mathematics instructional programs
EC 67% 74% 70% 69%
Inform planning of their Grade 9 mathematics instructional program
EC 64% 68% 66% 66%
Percentage of teachers who indicated that they used EQAO sample student assessments and scoring guides for the following purpose this past year:
Independently or with a school team:
To inform classroom instruction EC 82% 83% 82% 83%
Independently:
To show samples of student responses to students EC 78% 78% 79% 79%
To help students understand how questions and tasks relate to mathematics curriculum expectations
EC 72% 74% 73% 73%
To communicate with parents and guardians about curriculum expectations
EC 32% 33% 33% 33%
EC: Due to exceptional circumstances, provincial data for 2014–2015 are unavailable for the reporting of provincial results.

15 EQAO’s Provincial Secondary School Report, 2018–2019
Grade 9 Academic Mathematics—Questionnaire Results Over Time
Teacher Questionnaire Results—Grade 9 Academic Mathematics (continued)
2014–2015 2015–2016 2016–2017 2017–2018 2018–2019
Teachers who completed the questionnaire EC # = 2428 # = 2390 # = 2298 # = 2223
SOME TEACHING PRACTICES
Percentage of teachers who “frequently” asked their students to do the following during mathematics instruction this past semester or year:*
Discuss and use problem-solving strategies for finding answers (e.g., work backward, use a chart, make a model)
EC 58% 63% 64% 66%
Solve open-ended problems EC 42% 46% 45% 48%
Work collaboratively to solve problems EC 57% 59% 63% 65%
Discuss mathematical ideas and relationships EC 66% 70% 69% 69%
Conduct mathematical investigations (e.g., to demonstrate the inquiry process)
EC 29% 32% 32% 34%
Explain the reasoning behind their answers EC 77% 80% 80% 81%
Write solutions using mathematical language and symbols EC 90% 91% 91% 92%
USE OF INSTRUCTIONAL RESOURCES IN THE CLASSROOM
Percentage of teachers who indicated that they “sometimes” or “frequently” had the majority of their students use the following resources in class this past semester or year:*
Calculator EC 96% 96% 96% 97%
Graphing calculator EC 35% 31% 27% 27%
Computer software (e.g., spreadsheet, statistical, dynamic geometry or graphing software)
EC 39% 46% 50% 53%
The Internet (e.g., to access statistics or other sources of mathematical information)
EC 44% 48% 50% 56%
Concrete manipulative (e.g., geoboard, algebra tiles, connecting cubes)
EC 36% 36% 39% 39%
Measuring device (e.g., ruler, metre stick, protractor) EC 75% 74% 75% 74%
Presentation technology (e.g., interactive white board, LCD projector)
EC 84% 86% 88% 88%
* The other response options were “never” and “seldom.” EC: Due to exceptional circumstances, provincial data for 2014–2015 are unavailable for the reporting of provincial results.

EQAO’s Provincial Secondary School Report, 2018–2019 16
Grade 9 Academic Mathematics—Questionnaire Results Over Time
* The percentages for this question are based on the number of teachers who indicated that some or all components of the assessment count as part of their students’ class mark. 2014–2015: EC 2015–2016: # = 2365 2016–2017: # = 2326 2017–2018: # = 2224 2018–2019: # = 2156
EC: Due to exceptional circumstances, provincial data for 2014–2015 are unavailable for the reporting of provincial results.
Teacher Questionnaire Results—Grade 9 Academic Mathematics (continued)
2014–2015 2015–2016 2016–2017 2017–2018 2018–2019
Teachers who completed the questionnaire EC # = 2428 # = 2390 # = 2298 # = 2223
USE OF THE ASSESSMENT IN STUDENTS’ CLASS MARKS
Percentage of teachers who indicated that some or all components of the Grade 9 Assessment of Mathematics count as part of their students’ class marks:
EC 97% 97% 97% 97%
Percentage of teachers indicating how much the assessment will count as part of their students’ class marks:*
1–5% EC 26% 25% 24% 23%
6–10% EC 50% 50% 49% 49%
11–15% EC 14% 15% 18% 16%
16–20% EC 3% 4% 3% 5%
21–25% EC 1% <1% 1% 1%
26–30% EC 2% 2% 3% 3%
Percentage of teachers who indicated the opinion that counting some or all components of the Grade 9 Assessment of Mathematics as part of class marks motivates students to take the assessment more seriously:*
EC 91% 91% 90% 91%

17 EQAO’s Provincial Secondary School Report, 2018–2019
Grade 9 Applied Mathematics—Questionnaire Results Over Time
The following tables provide results from a sample of items from the questionnaires completed by teachers during the administrations
of the Grade 9 Assessment of Mathematics.
Teacher Questionnaire Results—Grade 9 Applied Mathematics
2014–2015 2015–2016 2016–2017 2017–2018 2018–2019
Teachers who completed the questionnaire EC # = 1358 # = 1378 # = 1275 # = 1208
USE OF EQAO RESOURCES
Percentage of teachers who indicated that they used EQAO data (demographic data, assessment and questionnaire results) this past year, independently or with a school team, to do the following:
Identify how well students are meeting curriculum expectations
EC 67% 74% 72% 71%
Communicate with parents and guardians about student achievement
EC 30% 32% 31% 33%
Identify areas of strength and areas for improvement in Grade 9 mathematics instructional programs
EC 72% 78% 76% 73%
Inform planning of their Grade 9 mathematics instructional program
EC 68% 74% 74% 72%
Percentage of teachers who indicated that they used EQAO sample student assessments and scoring guides for the following purposes this past year:
Independently or with a school team:
To inform classroom instruction EC 85% 87% 87% 87%
Independently:
To show samples of student responses to students EC 74% 75% 76% 76%
To help students understand how questions and tasks relate to mathematics curriculum expectations
EC 72% 72% 71% 74%
To communicate with parents and guardians about curriculum expectations
EC 30% 31% 30% 32%
EC: Due to exceptional circumstances, provincial data for 2014–2015 are unavailable for the reporting of provincial results.

EQAO’s Provincial Secondary School Report, 2018–2019 18
Grade 9 Applied Mathematics—Questionnaire Results Over Time
* The other response options were “never” and “seldom.” EC: Due to exceptional circumstances, provincial data for 2014–2015 are unavailable for the reporting of provincial results.
Teacher Questionnaire Results—Grade 9 Applied Mathematics (continued)
2014–2015 2015–2016 2016–2017 2017–2018 2018–2019
Teachers who completed the questionnaire EC # = 1358 # = 1378 # = 1275 # = 1208
SOME TEACHING PRACTICES
Percentage of teachers who “frequently” asked their students to do the following during mathematics instruction this past semester or year:*
Discuss and use problem-solving strategies for finding answers (e.g., work backward, use a chart, make a model)
EC 52% 58% 60% 61%
Solve open-ended problems EC 38% 41% 43% 43%
Work collaboratively to solve problems EC 52% 58% 61% 62%
Discuss mathematical ideas and relationships EC 59% 60% 61% 63%
Conduct mathematical investigations (e.g., to demonstrate the inquiry process)
EC 25% 30% 29% 29%
Explain the reasoning behind their answers EC 72% 75% 76% 75%
Write solutions using mathematical language and symbols EC 85% 84% 84% 86%
USE OF INSTRUCTIONAL RESOURCES IN THE CLASSROOM
Percentage of teachers who indicated that they “sometimes” or “frequently” had the majority of their students use the following resources in class this past semester or year:*
Calculator EC 98% 98% 98% 98%
Graphing calculator EC 26% 25% 23% 22%
Computer software (e.g., spreadsheet, statistical, dynamic geometry or graphing software)
EC 35% 43% 45% 46%
The Internet (e.g., to access statistics or other sources of mathematical information)
EC 47% 54% 52% 54%
Concrete manipulative (e.g., geoboard, algebra tiles, connecting cubes)
EC 58% 62% 62% 59%
Measuring device (e.g., ruler, metre stick, protractor) EC 82% 85% 82% 82%
Presentation technology (e.g., interactive white board, LCD projector)
EC 83% 87% 88% 88%

19 EQAO’s Provincial Secondary School Report, 2018–2019
Grade 9 Applied Mathematics—Questionnaire Results Over Time
* The percentages for this question are based on the number of teachers who indicated that some or all components of the assessment count as part of their students’ class mark. 2014–2015: EC 2015–2016: # = 1292 2016–2017: # = 1306 2017–2018: # = 1220 2018–2019: # = 1148
EC: Due to exceptional circumstances, provincial data for 2014–2015 are unavailable for the reporting of provincial results.
Teacher Questionnaire Results—Grade 9 Applied Mathematics (continued)
2014–2015 2015–2016 2016–2017 2017–2018 2018–2019
Teachers who completed the questionnaire EC # = 1358 # = 1378 # = 1275 # = 1208
USE OF THE ASSESSMENT IN STUDENTS’ CLASS MARKS
Percentage of teachers who indicated that some or all components of the Grade 9 Assessment of Mathematics count as part of their students’ class marks:
EC 95% 95% 96% 95%
Percentage of teachers indicating how much the assessment will count as part of their students’ class marks:*
1–5% EC 24% 25% 21% 20%
6–10% EC 49% 47% 49% 47%
11–15% EC 19% 19% 19% 21%
16–20% EC 3% 3% 5% 5%
21–25% EC 1% 1% 1% 1%
26–30% EC 2% 2% 2% 4%
Percentage of teachers who indicated the opinion that counting some or all components of the Grade 9 Assessment of Mathematics as part of class marks motivates students to take the assessment more seriously:*
EC 84% 87% 84% 85%

EQAO’s Provincial Secondary School Report, 2018–2019 20
Grade 9 Academic Mathematics—Contextual Information
DEMOGRAPHIC INFORMATION AND PARTICIPATION RATES OVER TIMEGrade 9 Academic Mathematics
2014–2015 2015–2016 2016–2017 2017–2018 2018–2019
All students EC # = 97 347
# = 96 449
# = 96 996
# = 100 425
GENDER*
Female EC 51% 51% 52% 51%
Male EC 49% 49% 48% 49%
STUDENT STATUS*
English language learners† EC 6% 7% 7% 7%
Students with special education needs (excluding gifted)† EC 7% 8% 8% 9%
LANGUAGE SPOKEN AT HOME BY THE STUDENT‡§
Speak only or mostly English EC 72% 68% 70% 69%
Speak another language (or other languages) as often as English
EC 16% 17% 17% 18%
Speak only or mostly another language (or other languages) EC 9% 9% 9% 9%
STUDENT MOBILITY‡
Attended three or more elementary schools from kindergarten to Grade 8
EC 34% 35% 35% 36%
PARTICIPATION IN THE ASSESSMENT
Students participating in the assessment EC 99% 99% 99% 99%
* Contextual data pertaining to gender and student status are provided by schools and/or boards through the Student Data Collection process. Some data may be missing.
† See Grade 9 Assessment of Mathematics: Explanation of Terms.‡ Contextual data pertaining to the language spoken at home by the student and student mobility are gathered from the Student Questionnaire. Some data may
be missing.§ Because of missing responses, percentages may not add up to 100.EC: Due to exceptional circumstances, provincial data for 2014–2015 are unavailable for the reporting of provincial results.

Grade 9 Applied Mathematics—Contextual Information
21 EQAO’s Provincial Secondary School Report, 2018–2019
Grade 9 Applied Mathematics
2014–2015 2015–2016 2016–2017 2017–2018 2018–2019
All students EC # = 36 005
# = 34 797
# = 33 451
# = 33 573
GENDER*
Female EC 44% 44% 44% 43%
Male EC 56% 56% 56% 57%
STUDENT STATUS*
English language learners† EC 10% 11% 11% 12%
Students with special education needs (excluding gifted)† EC 41% 41% 41% 41%
LANGUAGE SPOKEN AT HOME BY THE STUDENT‡§
Speak only or mostly English EC 78% 75% 75% 75%
Speak another language (or other languages) as often as English
EC 13% 13% 13% 13%
Speak only or mostly another language (or other languages) EC 7% 7% 7% 7%
STUDENT MOBILITY‡
Attended three or more elementary schools from kindergarten to Grade 8
EC 39% 39% 39% 39%
PARTICIPATION IN THE ASSESSMENT
Students participating in the assessment EC 96% 96% 96% 96%
* Contextual data pertaining to gender and student status are provided by schools and/or boards through the Student Data Collection process. Some data may be missing.
† See Grade 9 Assessment of Mathematics: Explanation of Terms.‡ Contextual data pertaining to the language spoken at home by the student and student mobility are gathered from the Student Questionnaire. Some data may
be missing.§ Because of missing responses, percentages may not add up to 100.EC: Due to exceptional circumstances, provincial data for 2014–2015 are unavailable for the reporting of provincial results.

EQAO’s Provincial Secondary School Report, 2018–2019 22
Grade 9 Academic Mathematics Course: Achievement Results
RESULTS FOR ALL STUDENTS OVER TIME*
2014–2015 2015–2016 2016–2017 2017–2018 2018–2019
EC # = 97 347 # = 96 449 # = 96 996 # = 100 425
Level 4 EC 11% 13% 14% 15%
Level 3 EC 73% 71% 70% 69%
Level 2 EC 11% 11% 10% 10%
Level 1 EC 4% 5% 4% 5%
Below Level 1 EC <1% <1% <1% <1%
No Data EC 1% 1% 1% 1%
At or Above the Provincial Standard† EC 83% 83% 84% 84%
Percentage of All Students at Each Level Over Time: Grade 9 Academic Course*
0
20
40
60
80
100
Per
cent
age
of S
tud
ents
EC <1 <1 EC 4 5EC
11 11EC
73 71
EC11 13
<1 410
70
14
<1 5 10
69
15
Below Level 1 Level 1 Level 3 Level 4Level 2
At or above the provincial standard
D_F_p2 & 14_bar_Comparison_Ac_9e_19.eps
2015–2016
2016–2017
2017–2018
2018–2019
2014–2015EC
* Because percentages in tables and graphs are rounded, and because graphs do not show all reporting categories, percentages may not add up to 100.† The percentages of students at Levels 3 and 4 are rounded and may not add up to the percentages of students at or above the provincial standard.EC: Due to exceptional circumstances, provincial data for 2014–2015 are unavailable for the reporting of provincial results.

Grade 9 Academic Mathematics—Achievement Results
23 EQAO’s Provincial Secondary School Report, 2018–2019
RESULTS BY GENDER*
Results for Female and Male Students Over Time†
2014–2015
2015–2016
2016–2017
2017–2018
2018–2019
2014–2015
2015–2016
2016–2017
2017–2018
2018–2019
Female Male
EC # = 49 817
# = 49 388
# = 49 957
# = 51 250 EC # =
47 530# =
47 061# =
47 039# =
49 173
Level 4 EC 10% 12% 14% 14% EC 11% 13% 15% 15%
Level 3 EC 73% 71% 70% 69% EC 73% 71% 70% 69%
Level 2 EC 11% 11% 10% 11% EC 11% 11% 10% 10%
Level 1 EC 5% 4% 5% 5% EC 4% 5% 4% 5%
Below Level 1 EC <1% <1% <1% <1% EC <1% <1% <1% 1%
No Data EC 1% 1% 1% 1% EC 1% 1% 1% 1%
At or Above the Provincial Standard‡ EC 83% 83% 84% 83% EC 84% 83% 85% 84%
* Results by gender include only students for whom gender data were available.† Because percentages in tables are rounded, they may not add up to 100.‡ The percentages of students at Levels 3 and 4 are rounded and may not add up to the percentage of students at or above the provincial standard.EC: Due to exceptional circumstances, provincial data for 2014–2015 are unavailable for the reporting of provincial results.

EQAO’s Provincial Secondary School Report, 2018–2019 24
Grade 9 Academic Mathematics—Achievement Results
Percentage of Female Students at Each Level Over Time*
0
20
40
60
80
100
Per
cent
age
of S
tud
ents
EC <1 <1 <1 <1 EC 5 54 EC11 11 10
EC
73 71 70
14
EC10 12
Below Level 1 Level 1 Level 3 Level 4Level 2
At or above the provincial standard
mb2_27_trends_fmale_9e_ac_19.eps
511
69
14
2015–2016
2016–2017
2017–2018
2018–2019
2014–2015EC
Percentage of Male Students at Each Level Over Time*
0
20
40
60
80
100
Per
cent
age
of S
tud
ents
EC <1 <1 <1 EC 4 45 10 EC
11 11EC
73 71 70
EC11 13 15
1 5 10
69
15
Below Level 1 Level 1 Level 3 Level 4Level 2
At or above the provincial standard
mb2_28_trends_male_9e_ac_19.eps
2015–2016
2016–2017
2017–2018
2018–2019
2014–2015EC
* Because percentages in graphs are rounded, and because graphs do not show all reporting categories, percentages may not add up to 100.EC: Due to exceptional circumstances, provincial data for 2014–2015 are unavailable for the reporting of provincial results.
25 EQAO’s Provincial Secondary School Report, 2018–2019
Grade 9 Academic Mathematics—Achievement Results
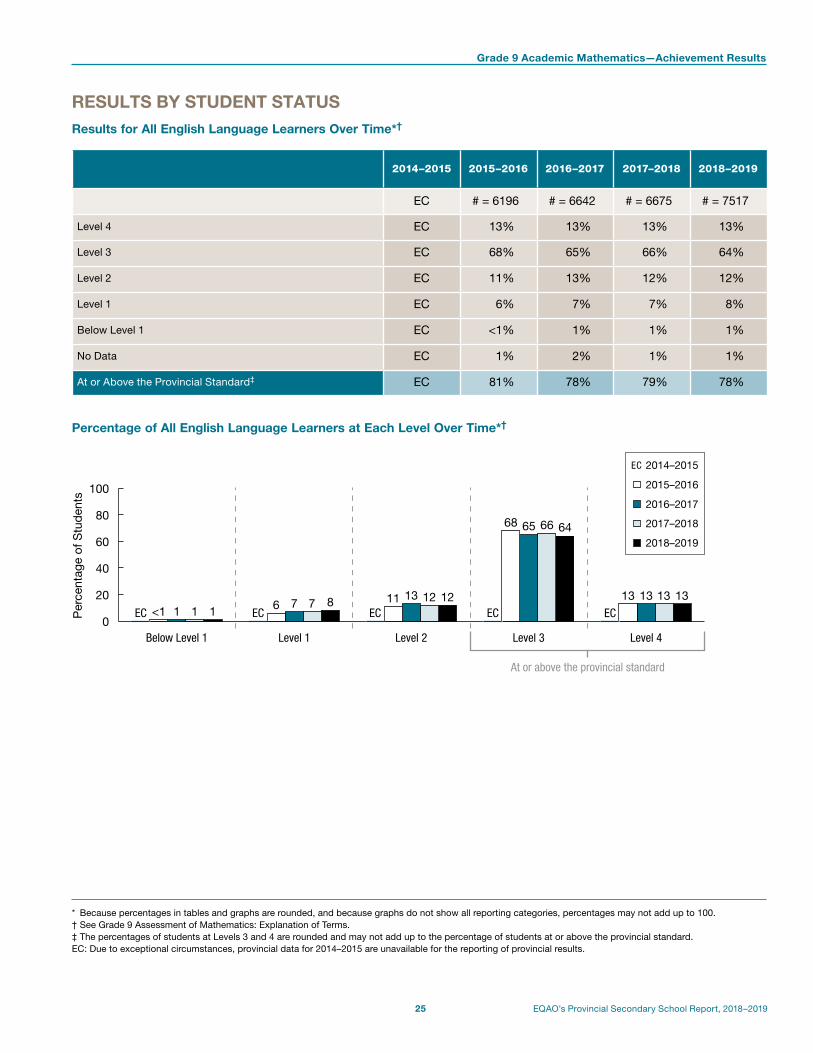
RESULTS BY STUDENT STATUSResults for All English Language Learners Over Time*†
2014–2015 2015–2016 2016–2017 2017–2018 2018–2019
EC # = 6196 # = 6642 # = 6675 # = 7517
Level 4 EC 13% 13% 13% 13%
Level 3 EC 68% 65% 66% 64%
Level 2 EC 11% 13% 12% 12%
Level 1 EC 6% 7% 7% 8%
Below Level 1 EC <1% 1% 1% 1%
No Data EC 1% 2% 1% 1%
At or Above the Provincial Standard‡ EC 81% 78% 79% 78%
Percentage of All English Language Learners at Each Level Over Time*†
0
20
40
60
80
100
Per
cent
age
of S
tud
ents
EC <1 1 1 EC6 7 7
EC11 13 12
EC
68 65 66
EC
13 13 131
8 12
64
13
Below Level 1 Level 1 Level 3 Level 4Level 2
At or above the provincial standard
mb2_35_E_ELL_9e_ac_19.eps
2015–2016
2016–2017
2017–2018
2018–2019
2014–2015EC
* Because percentages in tables and graphs are rounded, and because graphs do not show all reporting categories, percentages may not add up to 100.† See Grade 9 Assessment of Mathematics: Explanation of Terms.‡ The percentages of students at Levels 3 and 4 are rounded and may not add up to the percentage of students at or above the provincial standard.EC: Due to exceptional circumstances, provincial data for 2014–2015 are unavailable for the reporting of provincial results.
Grade 9 Academic Mathematics—Achievement Results
EQAO’s Provincial Secondary School Report, 2018–2019 26
Results for All Students with Special Education Needs (Excluding Gifted) Over Time*†
2014–2015 2015–2016 2016–2017 2017–2018 2018–2019
EC # = 7192 # = 7561 # = 7795 # = 8782
Level 4 EC 5% 6% 7% 7%
Level 3 EC 66% 65% 64% 63%
Level 2 EC 17% 16% 16% 16%
Level 1 EC 10% 9% 10% 10%
Below Level 1 EC 1% 1% 1% 1%
No Data EC 2% 2% 2% 2%
At or Above the Provincial Standard‡ EC 71% 72% 71% 70%
Percentage of All Students with Special Education Needs (Excluding Gifted) at Each Level Over Time*†
0
20
40
60
80
100
Per
cent
age
of S
tud
ents
1EC 1 1 EC10 109
EC
17 16 16
EC
66 65 64
EC 5 6 71
1016
63
7
Below Level 1 Level 1 Level 3 Level 4Level 2
At or above the provincial standard
mb2_36_F_SpclNds_9e_ac_19.eps
2015–2016
2016–2017
2017–2018
2018–2019
2014–2015EC
* Because percentages in tables and graphs are rounded, and because graphs do not show all reporting categories, percentages may not add up to 100.† See Grade 9 Assessment of Mathematics: Explanation of Terms.‡ The percentages of students at Levels 3 and 4 are rounded and may not add up to the percentage of students at or above the provincial standard.EC: Due to exceptional circumstances, provincial data for 2014–2015 are unavailable for the reporting of provincial results.
27 EQAO’s Provincial Secondary School Report, 2018–2019
Grade 9 Applied Mathematics Course: Achievement Results
RESULTS FOR ALL STUDENTS OVER TIME*
2014–2015 2015–2016 2016–2017 2017–2018 2018–2019
EC # = 36 005 # = 34 797 # = 33 451 # = 33 573
Level 4 EC 10% 9% 10% 10%
Level 3 EC 35% 35% 35% 34%
Level 2 EC 33% 33% 33% 33%
Level 1 EC 13% 14% 13% 13%
Below Level 1 EC 5% 5% 5% 5%
No Data EC 4% 4% 4% 4%
At or Above the Provincial Standard† EC 45% 44% 45% 44%
Percentage of All Students at Each Level Over Time: Grade 9 Applied Course*
0
20
40
60
80
100
Per
cent
age
of S
tud
ents
EC 5 5 EC
13 14
EC
33 33
EC
35 35
EC10 95
13
33 35
10513
33 34
10
Below Level 1 Level 1 Level 3 Level 4Level 2
At or above the provincial standard
H_J_p4 & 27_Bar_Comparison_Ap_9e_19.eps
2015–2016
2016–2017
2017–2018
2018–2019
2014–2015EC
* Because percentages in tables and graphs are rounded, and because graphs do not show all reporting categories, percentages may not add up to 100.† The percentages of students at Levels 3 and 4 are rounded and may not add up to the percentages of students at or above the provincial standard.EC: Due to exceptional circumstances, provincial data for 2014–2015 are unavailable for the reporting of provincial results.

Grade 9 Applied Mathematics—Achievement Results
EQAO’s Provincial Secondary School Report, 2018–2019 28
RESULTS BY GENDER*
Results for Female and Male Students Over Time†
2014–2015
2015–2016
2016–2017
2017–2018
2018–2019
2014–2015
2015–2016
2016–2017
2017–2018
2018–2019
Female Male
EC # = 15 748
# = 15 212
# = 14 646
# = 14 383 EC # =
20 257# =
19 585# =
18 804# =
19 185
Level 4 EC 9% 8% 9% 9% EC 11% 10% 11% 11%
Level 3 EC 34% 33% 34% 32% EC 36% 36% 37% 36%
Level 2 EC 35% 35% 34% 35% EC 32% 32% 32% 32%
Level 1 EC 14% 15% 14% 15% EC 12% 13% 12% 12%
Below Level 1 EC 4% 5% 5% 5% EC 5% 5% 5% 6%
No Data EC 4% 4% 4% 4% EC 4% 4% 4% 4%
At or Above the Provincial Standard‡ EC 43% 41% 42% 41% EC 47% 46% 47% 47%
* Results by gender include only students for whom gender data were available.† Because percentages in tables are rounded, they may not add up to 100.‡ The percentages of students at Levels 3 and 4 are rounded and may not add up to the percentage of students at or above the provincial standard.EC: Due to exceptional circumstances, provincial data for 2014–2015 are unavailable for the reporting of provincial results.

Grade 9 Applied Mathematics—Achievement Results
29 EQAO’s Provincial Secondary School Report, 2018–2019
* Because percentages in graphs are rounded, and because graphs do not show all reporting categories, percentages may not add up to 100.EC: Due to exceptional circumstances, provincial data for 2014–2015 are unavailable for the reporting of provincial results.
Percentage of Female Students at Each Level Over Time*
0
20
40
60
80
100
Per
cent
age
of S
tud
ents
EC 4 5 5 EC
14 15 14
EC
35 35 34
EC
34 33 34
EC9 8 95
15
35 32
9
Below Level 1 Level 1 Level 3 Level 4Level 2
At or above the provincial standard
mb2_29_trends_female_9e_ap_19.eps
2015–2016
2016–2017
2017–2018
2018–2019
2014–2015EC
Percentage of Male Students at Each Level Over Time*
0
20
40
60
80
100
Per
cent
age
of S
tud
ents
EC 5 5 5 EC12 13
EC
32 32
EC
36 36
EC11 1012
32 37
11612
32 36
11
Below Level 1 Level 1 Level 3 Level 4Level 2
At or above the provincial standard
mb2_30_trends_male_9e_ap_19.eps
2017–2018
2018–2019
2014–2015
2015–2016
2016–2017

Grade 9 Applied Mathematics—Achievement Results
EQAO’s Provincial Secondary School Report, 2018–2019 30
RESULTS BY STUDENT STATUSResults for All English Language Learners Over Time*†
2014–2015 2015–2016 2016–2017 2017–2018 2018–2019
EC # = 3598 # = 3802 # = 3724 # = 4122
Level 4 EC 9% 7% 8% 7%
Level 3 EC 28% 26% 28% 24%
Level 2 EC 33% 33% 32% 34%
Level 1 EC 19% 20% 18% 19%
Below Level 1 EC 8% 8% 9% 10%
No Data EC 3% 5% 5% 5%
At or Above the Provincial Standard‡ EC 37% 33% 36% 32%
Percentage of All English Language Learners at Each Level Over Time*†
0
20
40
60
80
100
Per
cent
age
of S
tud
ents
EC8 8 9
EC
19 20 18
EC
33 33 32
EC
28 26 28
EC9 7 810
19
3424
7
Below Level 1 Level 1 Level 3 Level 4Level 2
At or above the provincial standard
mb2_37_J_ELL_9e_ap_19.eps
2015–2016
2016–2017
2017–2018
2018–2019
2014–2015EC
* Because percentages in tables and graphs are rounded, and because graphs do not show all reporting categories, percentages may not add up to 100.† See Grade 9 Assessment of Mathematics: Explanation of Terms.‡ The percentages of students at Levels 3 and 4 are rounded and may not add up to the percentage of students at or above the provincial standard.EC: Due to exceptional circumstances, provincial data for 2014–2015 are unavailable for the reporting of provincial results.

Grade 9 Applied Mathematics—Achievement Results
31 EQAO’s Provincial Secondary School Report, 2018–2019
Results for All Students with Special Education Needs (Excluding Gifted) Over Time*†
2014–2015 2015–2016 2016–2017 2017–2018 2018–2019
EC # = 14 761 # = 14 384 # = 13 759 # = 13 644
Level 4 EC 7% 7% 7% 8%
Level 3 EC 29% 30% 30% 29%
Level 2 EC 36% 35% 34% 35%
Level 1 EC 17% 18% 17% 17%
Below Level 1 EC 7% 6% 7% 7%
No Data EC 4% 4% 4% 4%
At or Above the Provincial Standard‡ EC 36% 37% 38% 37%
Percentage of All Students with Special Education Needs (Excluding Gifted) at Each Level Over Time*†
0
20
40
60
80
100
Per
cent
age
of S
tud
ents
EC7 6
EC
17 18
EC
36 35
EC
29 30
EC7 77
17
34 30
7717
3529
8
Below Level 1 Level 1 Level 3 Level 4Level 2
At or above the provincial standard
mb2_38_K_SpcNds_9e_ap_19.eps
2015–2016
2016–2017
2017–2018
2018–2019
2014–2015EC
* Because percentages in tables and graphs are rounded, and because graphs do not show all reporting categories, percentages may not add up to 100.† See Grade 9 Assessment of Mathematics: Explanation of Terms.‡ The percentages of students at Levels 3 and 4 are rounded and may not add up to the percentage of students at or above the provincial standard.EC: Due to exceptional circumstances, provincial data for 2014–2015 are unavailable for the reporting of provincial results.

EQAO’s Provincial Secondary School Report, 2018–2019 32
Cohort Tracking—Grade 3 to Grade 6 to Grade 9
TRACKING PROGRESS IN MATHEMATICS FROM GRADE 3 THROUGH GRADE 6 TO GRADE 9English-Language Students (Academic Course)
Met Standard Did Not Meet Standard
61% (48 443) 96% (46 319)
87% (3343)
74% (11 601)
54% (6105) 46%
26%
13%
4%
5% (3861)
20% (15 617)
14% (11 285)
Maintained StandardOf the 48 443 students (61%) who had met the mathematics standard in both Grade 3 and Grade 6, 96% (46 319) met it again in Grade 9.
Rose to StandardOf the 3861 students (5%) who had not met the mathematics standard in Grade 3 but had achieved it in Grade 6, 87% (3343) met it in Grade 9.
Dropped from StandardOf the 15 617 students (20%) who had met the mathematics standard in Grade 3 but not in Grade 6, 74% (11 601) met it in Grade 9.
Never Met StandardOf the 11 285 students (14%) who had met the mathematics standard in neither Grade 3 nor Grade 6, 54% (6105) met it in Grade 9.
Number of students in the cohort: 79 206
Relationship to the Standardfrom Grade 3 to Grade 6
Outcome on the Grade 9 Assessment of Mathematics
Note: Because percentages in graphs are rounded, they may not add up to 100.

33 EQAO’s Provincial Secondary School Report, 2018–2019
Cohort Tracking—Grade 3 to Grade 6 to Grade 9
English-Language Students (Applied Course)
Met Standard Did Not Meet Standard
9% (2125) 88% (1874) 12%
76% (557)
60% (3930)
35% (4766) 65%
40%
24%3% (733)
29% (6576)
59% (13 521)
Maintained StandardOf the 2125 students (9%) who had met the mathematics standard in both Grade 3 and Grade 6, 88% (1874) met it again in Grade 9.
Rose to StandardOf the 733 students (3%) who had not met the mathematics standard in Grade 3 but had achieved it in Grade 6, 76% (557) met it in Grade 9.
Dropped from StandardOf the 6576 students (29%) who had met the mathematics standard in Grade 3 but not in Grade 6, 60% (3930) met it in Grade 9.
Never Met StandardOf the 13 521 students (59%) who had met the mathematics standard in neither Grade 3 nor Grade 6, 35% (4766) met it in Grade 9.
Number of students in the cohort: 22 955
Relationship to the Standardfrom Grade 3 to Grade 6
Outcome on the Grade 9 Assessment of Mathematics
Note: Because percentages in graphs are rounded, they may not add up to 100.

EQAO’s Provincial Secondary School Report, 2018–2019 34
Sec. StartGrade 9 Assessment of Mathematics: Explanation of Terms
All StudentsThis term refers to all students in the Grade 9 mathematics course (applied or academic), including students for whom we have no data.
Provincial Standard The Ministry of Education, in The Ontario Curriculum, has set Level 3 as the provincial standard. Level 3 identifies a high level of achievement of provincial expectations. The levels of achievement are aligned with the four-level scale developed by the Ministry of Education and used on the Provincial Report Card.
Level 4 (80–100%) The student has demonstrated a very high to outstanding level of achievement. Achievement surpasses the provincial standard.
Level 3 (70–79%) The student has demonstrated a high level of achievement. Achievement is at the provincial standard.
Level 2 (60–69%)The student has demonstrated a moderate level of achievement. Achievement is below, but approaching, the provincial standard.
Level 1 (50–59%)The student has demonstrated a passable level of achievement. Achievement is much below the provincial standard.
Below Level 1The student has not demonstrated sufficient achievement of the curriculum expectations (below 50%).
No Data This designates students who did not receive a result, due to absence or for other reasons.
English Language LearnersThese are students who have been identified by the school in accordance with English Language Learners: ESL and ELD Programs and Services: Policies and Procedures for Ontario Elementary and Secondary Schools, Kindergarten to Grade 12 (2007).
EC (Exceptional Circumstances)Due to exceptional circumstances, provincial data for 2014–2015 are unavailable for the reporting of provincial results.
Students with Special Education Needs (Excluding Gifted)Students with special education needs are students formally identified by an Identification, Placement and Review Committee (IPRC), and/or students who have an Individual Education Plan (IEP). Students whose sole identified exceptionality is giftedness are not included.

Ontario Secondary School Literacy Test (OSSLT)

EQAO’s Provincial Secondary School Report, 2018–2019 36
OSSLT—First-Time Eligible Students: Contextual Information
QUESTIONNAIRE RESULTS OVER TIMEStudent Questionnaire Results: Reading
2015–2016
2016–2017
2017–2018
2018–2019
2015–2016
2016–2017
2017–2018
2018–2019
Female Male
Students who completed the questionnaire*
# = 59 376
# = 59 706
# = 58 262
# = 59 182
# = 59 867
# = 59 959
# = 58 314
# = 58 890
Percentage of first-time eligible students indicating that they read the following kinds of material in English outside school for three hours or more most weeks (print or electronic):†‡
Non-fiction books (e.g., biographies) 14% 13% 13% 12% 12% 11% 11% 10%
Comics 4% 4% 5% 5% 6% 6% 6% 6%
Websites, e-mail or chat messages, blogs 64% 62% 59% 55% 51% 49% 49% 46%
Letters 1% 1% 1% 1% 1% 1% 1% 1%
Magazines 2% 2% 2% 1% 2% 2% 1% 1%
Manuals, instructions 1% 1% 1% 1% 3% 3% 3% 3%
Newspapers 2% 2% 2% 1% 3% 3% 2% 2%
Novels, fiction, short stories 37% 35% 32% 31% 18% 16% 15% 15%
Song lyrics, poems 27% 27% 27% 28% 17% 17% 19% 20%
Religious or spiritual writings 5% 4% 5% 5% 5% 4% 5% 5%
* Numbers and percentages are based on the total number of students who completed the questionnaire and for whom gender data were available.† Percentages are based on the number of students who answered “three hours or more but less than five hours” or “five hours or more.” The other response
options were “One hour or less” and “More than one hour but less than three hours.”‡ This question was asked for the first time in 2015–2016.
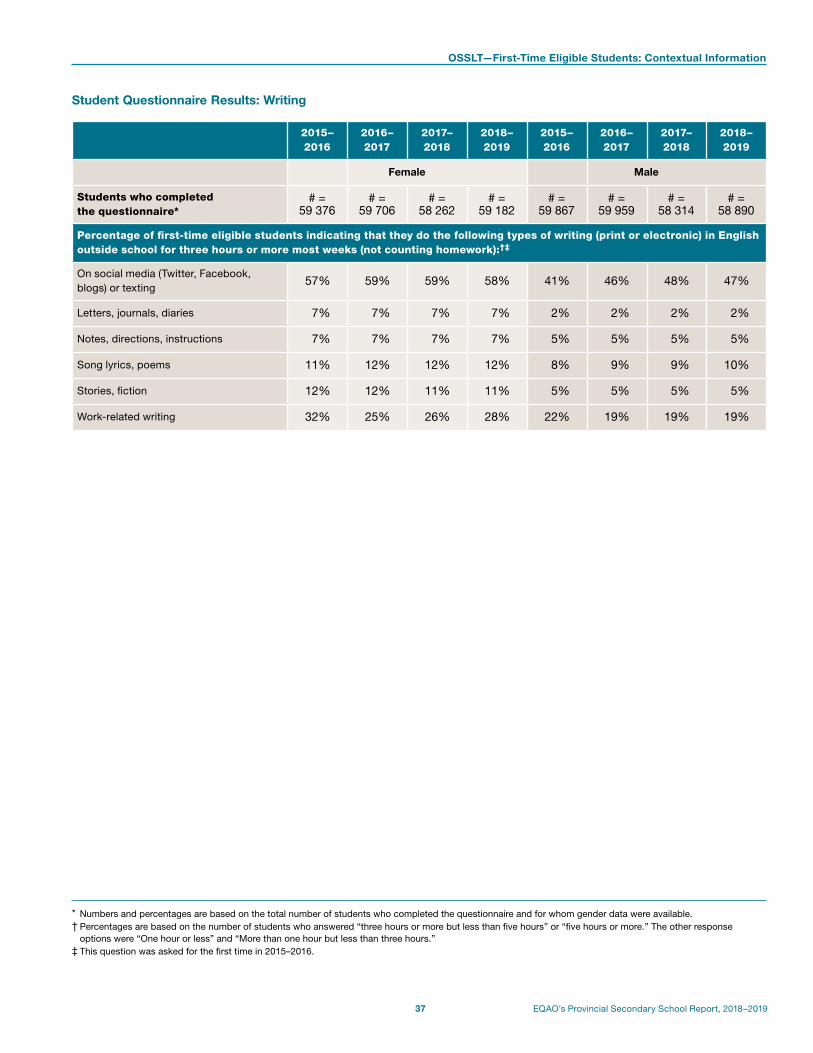
37 EQAO’s Provincial Secondary School Report, 2018–2019
OSSLT—First-Time Eligible Students: Contextual Information
Student Questionnaire Results: Writing
2015–2016
2016–2017
2017–2018
2018–2019
2015–2016
2016–2017
2017–2018
2018–2019
Female Male
Students who completed the questionnaire*
# = 59 376
# = 59 706
# = 58 262
# = 59 182
# = 59 867
# = 59 959
# = 58 314
# = 58 890
Percentage of first-time eligible students indicating that they do the following types of writing (print or electronic) in English outside school for three hours or more most weeks (not counting homework):†‡
On social media (Twitter, Facebook, blogs) or texting
57% 59% 59% 58% 41% 46% 48% 47%
Letters, journals, diaries 7% 7% 7% 7% 2% 2% 2% 2%
Notes, directions, instructions 7% 7% 7% 7% 5% 5% 5% 5%
Song lyrics, poems 11% 12% 12% 12% 8% 9% 9% 10%
Stories, fiction 12% 12% 11% 11% 5% 5% 5% 5%
Work-related writing 32% 25% 26% 28% 22% 19% 19% 19%
* Numbers and percentages are based on the total number of students who completed the questionnaire and for whom gender data were available.† Percentages are based on the number of students who answered “three hours or more but less than five hours” or “five hours or more.” The other response
options were “One hour or less” and “More than one hour but less than three hours.”‡ This question was asked for the first time in 2015–2016.

EQAO’s Provincial Secondary School Report, 2018–2019 38
OSSLT—First-Time Eligible Students: Contextual Information
Student Questionnaire Results: Home Computer Use
2014–2015
2015–2016
2016–2017
2017–2018
2018–2019
2014–2015
2015–2016
2016–2017
2017–2018
2018–2019
Female Male
Students who completed the questionnaire*
# = 60 328
# = 59 376
# = 59 706
# = 58 262
# = 59 182
# = 61 266
# = 59 867
# = 59 959
# = 58 314
# = 58 890
Percentage of first-time eligible students indicating that they use a computer at home for homework with the following frequencies:
I have a computer at home. 97% 96% 96% 96% 96% 96% 95% 95% 95% 94%
I use the computer almost every day for homework.
32% 34% 36% 41% 41% 29% 32% 33% 35% 36%
Student Questionnaire Results: Materials at Home
2014–2015
2015–2016
2016–2017
2017–2018
2018–2019
2014–2015
2015–2016
2016–2017
2017–2018
2018–2019
Female Male
Students who completed the questionnaire*
# = 60 328
# = 59 376
# = 59 706
# = 58 262
# = 59 182
# = 61 266
# = 59 867
# = 59 959
# = 58 314
# = 58 890
Percentage of first-time eligible students indicating that they have the following kinds of English-language materials at home (print or electronic):
Dictionaries, encyclopedias 82% 85% 83% 82% 79% 78% 83% 79% 78% 75%
Books 96% 97% 96% 97% 97% 93% 94% 94% 94% 94%
Newspapers 77% 78% 76% 73% 70% 75% 77% 75% 72% 68%
Magazines 76% 73% 70% 68% 65% 69% 68% 67% 65% 63%
* Numbers and percentages are based on the total number of students who completed the questionnaire and for whom gender data were available.

39 EQAO’s Provincial Secondary School Report, 2018–2019
OSSLT—First-Time Eligible Students: Contextual Information
EQAO’s Provincial Secondary School Report, 2018–2019 39
DEMOGRAPHIC INFORMATION AND PARTICIPATION RATES OVER TIME Participation rates, demographic information and questionnaire results provide a context for interpreting the province-wide results.
First-Time Eligible Students
2014–2015 2015–2016 2016–2017 2017–2018 2018–2019
All first-time eligible students # = 137 620
# = 135 111
# = 136 492
# = 132 639
# = 134 168
GENDER*
Female 49% 49% 49% 49% 49%
Male 51% 51% 51% 51% 51%
Not specified 0% 0% <1% <1% <1%
STUDENT STATUS*
English language learners 6% 7% 7% 7% 7%
English language learners who received one or more special provisions†‡ 4% 4% 4% 3% 3%
Students with special education needs (excluding gifted) 19% 19% 19% 20% 20%
Students with special education needs (excluding gifted) who received one or more accommodations† 16% 17% 16% 14% 14%
COURSE TYPE IN ENGLISH*
Academic 73% 73% 74% 74% 74%
Applied 21% 20% 20% 19% 19%
Locally developed 3% 3% 3% 3% 3%
LANGUAGE§
Number of students who completed the questionnaire 121 594 119 243 119 666 116 583 118 073
First language learned at home was other than English 22% 24% 23% 23% 23%
Speak only or mostly English at home 74% 72% 72% 71% 71%
Speak another language (or other languages) as often as English at home
18% 20% 20% 20% 20%
Speak only or mostly another language (or other languages) at home
7% 7% 7% 7% 7%
PARTICIPATION IN THE TEST
Number and percentage of fully participating first-time eligible students
127 867 93%
124 977 92%
127 142 93%
122 721 93%
124 251 93%
Students who were exempted 1 531 1 495 1 252 1 306 1 480
* Contextual data are provided by schools and/or boards through the Student Data Collection process. Some data may be missing.† Percentages are based on the number of fully participating students. In 2016–2017, percentages were based on the number of students who participated in the
March administration, which offered all permitted special provisions and accommodations.‡ Beginning in 2017–2018, the special provisions category includes extended periodic supervised breaks only.§ Contextual data pertaining to language are gathered from the questionnaire completed by students. Some data may be missing.

EQAO’s Provincial Secondary School Report, 2018–2019 40
OSSLT—Previously Eligible Students: Contextual Information
QUESTIONNAIRE RESULTS OVER TIMEStudent Questionnaire Results: Reading
2015–2016
2016–2017
2017–2018
2018–2019
2015–2016
2016–2017
2017–2018
2018–2019
Female Male
Students who completed the questionnaire*
# = 10 067
# = 10 508
# = 9776
# = 9839
# = 14 284
# = 14 511
# = 14 137
# = 14 583
Percentage of previously eligible students indicating that they read the following kinds of material in English outside school for three hours or more most weeks (print or electronic):†‡
Non-fiction books (e.g., biographies) 16% 15% 16% 15% 14% 12% 12% 11%
Comics 5% 5% 6% 6% 8% 7% 7% 7%
Websites, e-mail or chat messages, blogs 59% 57% 57% 54% 47% 46% 46% 44%
Letters 3% 3% 3% 3% 3% 3% 3% 3%
Magazines 4% 3% 3% 2% 3% 3% 2% 2%
Manuals, instructions 2% 3% 3% 3% 6% 5% 5% 5%
Newspapers 3% 3% 2% 2% 4% 4% 3% 2%
Novels, fiction, short stories 28% 28% 27% 25% 15% 14% 13% 13%
Song lyrics, poems 31% 32% 33% 34% 24% 25% 26% 28%
Religious or spiritual writings 7% 7% 7% 7% 6% 6% 6% 6%
* Numbers and percentages are based on the total number of students who completed the questionnaire and for whom gender data were available.† Percentages are based on the number of students who answered “three hours or more but less than five hours” or “five hours or more.” The other response
options were “One hour or less” and “More than one hour but less than three hours.”‡ This question was asked for the first time in 2015–2016.

41 EQAO’s Provincial Secondary School Report, 2018–2019
OSSLT—Previously Eligible Students: Contextual Information
Student Questionnaire Results: Writing
2015–2016
2016–2017
2017–2018
2018–2019
2015–2016
2016–2017
2017–2018
2018–2019
Female Male
Students who completed the questionnaire*
# = 10 067
# = 10 508
# = 9776
# = 9839
# = 14 284
# = 14 511
# = 14 137
# = 14 583
Percentage of first-time eligible students indicating that they do the following types of writing (print or electronic) in English outside school for three hours or more most weeks (not counting homework):†‡
On social media (Twitter, Facebook, blogs) or texting
53% 54% 55% 54% 39% 43% 45% 45%
Letters, journals, diaries 8% 9% 8% 8% 3% 3% 3% 3%
Notes, directions, instructions 8% 9% 9% 8% 6% 7% 7% 6%
Song lyrics, poems 16% 18% 18% 19% 14% 16% 16% 17%
Stories, fiction 12% 12% 12% 12% 6% 7% 6% 6%
Work-related writing 23% 21% 21% 22% 16% 15% 14% 15%
* Numbers and percentages are based on the total number of students who completed the questionnaire and for whom gender data were available.† Percentages are based on the number of students who answered “three hours or more but less than five hours” or “five hours or more.” The other response
options were “One hour or less” and “More than one hour but less than three hours.”‡ This question was asked for the first time in 2015–2016.

EQAO’s Provincial Secondary School Report, 2018–2019 42
OSSLT—Previously Eligible Students: Contextual Information
Student Questionnaire Results: Home Computer Use
2014–2015
2015–2016
2016–2017
2017–2018
2018–2019
2014–2015
2015–2016
2016–2017
2017–2018
2018–2019
Female Male
Students who completed the questionnaire*
# = 9807
# = 10 067
# = 10 508
# = 9776
# = 9839
# = 14 208
# = 14 284
# = 14 511
# = 14 137
# = 14 583
Percentage of previously eligible students indicating that they use a computer at home for homework with the following frequencies:
I have a computer at home. 92% 91% 91% 91% 90% 91% 89% 89% 88% 87%
I use the computer almost every day for homework.
28% 30% 31% 32% 31% 23% 25% 25% 24% 24%
Student Questionnaire Results: Materials at Home
2014–2015
2015–2016
2016–2017
2017–2018
2018–2019
2014–2015
2015–2016
2016–2017
2017–2018
2018–2019
Female Male
Students who completed the questionnaire*
# = 9807
# = 10 067
# = 10 508
# = 9776
# = 9839
# = 14 208
# = 14 284
# = 14 511
# = 14 137
# = 14 583
Percentage of previously eligible students indicating that they have the following kinds of English-language materials at home (print or electronic):
Dictionaries, encyclopedias 74% 78% 75% 73% 71% 69% 75% 71% 70% 67%
Books 91% 93% 92% 93% 93% 86% 89% 88% 88% 89%
Newspapers 65% 69% 66% 62% 60% 67% 70% 66% 64% 61%
Magazines 67% 66% 62% 59% 56% 62% 63% 60% 58% 56%
* Numbers and percentages are based on the total number of students who completed the questionnaire and for whom gender data were available.

43 EQAO’s Provincial Secondary School Report, 2018–2019
OSSLT—Previously Eligible Students: Contextual Information
DEMOGRAPHIC INFORMATION AND PARTICIPATION RATES OVER TIMEParticipation rates, demographic information and questionnaire results provide a context for interpreting the province-wide results.
Previously Eligible Students
2014–2015 2015–2016 2016–2017 2017–2018 2018–2019
All previously eligible students # = 54 024
# = 55 284
# = 58 895
# = 57 133
# = 58 128
GENDER*
Female 39% 39% 40% 39% 38%
Male 61% 61% 60% 61% 62%
Not specified 0% 0% 0% <1% 0%
STUDENT STATUS*
English language learners 15% 17% 19% 18% 17%
English language learners who received one or more special provisions†‡ 16% 19% 20% 11% 9%
Students with special education needs (excluding gifted) 41% 40% 38% 38% 40%
Students with special education needs (excluding gifted) who received one or more accommodations† 34% 33% 30% 26% 27%
LANGUAGE§
Number of students who completed the questionnaire 24 015 24 351 25 019 23 913 24 422
First language learned at home was other than English 34% 35% 37% 36% 33%
Speak only or mostly English at home 62% 60% 58% 58% 61%
Speak another language (or other languages) as often as English at home
21% 21% 23% 23% 23%
Speak only or mostly another language (or other languages) at home
16% 17% 17% 17% 15%
PARTICIPATION IN THE TEST
Number and percentage of fully participating previously eligible students
25 989 48%
26 333 48%
27 360 46%
26 021 46%
26 499 46%
Students who were exempted 2 074 1 832 1 562 1 592 1 603
* Contextual data are provided by schools and/or boards through the Student Data Collection process. Some data may be missing.† Percentages are based on the number of fully participating students. In 2016–2017, percentages were based on the number of students who participated in the
March administration, which offered all permitted special provisions and accommodations.‡ Beginning in 2017–2018, the special provisions category includes extended periodic supervised breaks only.§ Contextual data pertaining to language are gathered from the questionnaire completed by students. Some data may be missing.

EQAO’s Provincial Secondary School Report, 2018–2019 44
OSSLT—First-Time Eligible Students: Achievement Results
RESULTS FOR ALL STUDENTS OVER TIMEResults for First-Time Eligible Students Over Time*
ALL STUDENTS FULLY PARTICIPATING STUDENTS
2014–2015 # = 137 620
2015–2016 # = 135 111
2016–2017 # = 136 492
2017–2018 # = 132 639
2018–2019 # = 134 168
2014–2015 # = 127 867
2015–2016 # = 124 977
2016–2017 # = 127 142
2017–2018 # = 122 721
2018–2019 # = 124 251
SUCCESSFUL 77% 75% 75% 73% 74% 82% 81% 81% 79% 80%
NOT YET SUCCESSFUL
16% 18% 18% 20% 18% 18% 19% 19% 21% 20%
FULLY PARTICIPATING
93% 92% 93% 93% 93%
ABSENT 2% 2% 2% 2% 2%
DEFERRED 5% 6% 5% 6% 6%
Participation Rates Over Time: All Students*
Success Rates Over Time: Fully Participating Students*
0
20
40
60
80
100
0
20
40
60
80
100
Per
cent
age
of S
tud
ents
mb1__�rst_overTime_Xe_19.eps
5 56 6 622 2 2 2 Per
cent
age
of S
tud
ents
93 9392 93 9382 81 81 79 80
18 19 19 21 20
Fully Participating Absent Successful Not Yet SuccessfulDeferred
2017–20182014–2015 2015–2016 2016–2017 2018–2019
* Percentages in tables and bar graphs may not add up to 100, due to rounding.

45 EQAO’s Provincial Secondary School Report, 2018–2019
OSSLT—First-Time Eligible Students: Results by Gender
RESULTS BY GENDERResults for Female Students Over Time*†
ALL FEMALE STUDENTS
FULLY PARTICIPATING FEMALE STUDENTS
2014–2015 # = 67 023
2015–2016 # = 65 907
2016–2017 # = 66 832
2017–2018# = 64 849
2018–2019# = 65 696
2014–2015 # = 62 936
2015–2016 # = 61 694
2016–2017 # = 62 991
2017–2018 # = 60 716
2018–2019 # = 61 723
SUCCESSFUL 81% 79% 81% 79% 81% 86% 85% 85% 84% 86%
NOT YET SUCCESSFUL
13% 14% 14% 15% 13% 14% 15% 15% 16% 14%
FULLY PARTICIPATING
94% 94% 94% 94% 94%
ABSENT 2% 2% 2% 2% 2%
DEFERRED 4% 4% 4% 5% 4%
Participation Rates Over Time: All Female Students*†
Success Rates Over Time: Fully Participating Female Students*†
0
20
40
60
80
100
0
20
40
60
80
100
Per
cent
age
of S
tud
ents
mb5__�rst_female_Xe_19.eps
4 4 4 5 422 2 2 2 Per
cent
age
of S
tud
ents
9494 94 94 9486 85 85 84
14 15 15 16
86
14
Fully Participating Absent Successful Not Yet SuccessfulDeferred
2017–20182014–2015 2015–2016 2016–2017 2018–2019
* Includes only students for whom gender data were available. † Percentages in tables and bar graphs may not add up to 100, due to rounding.
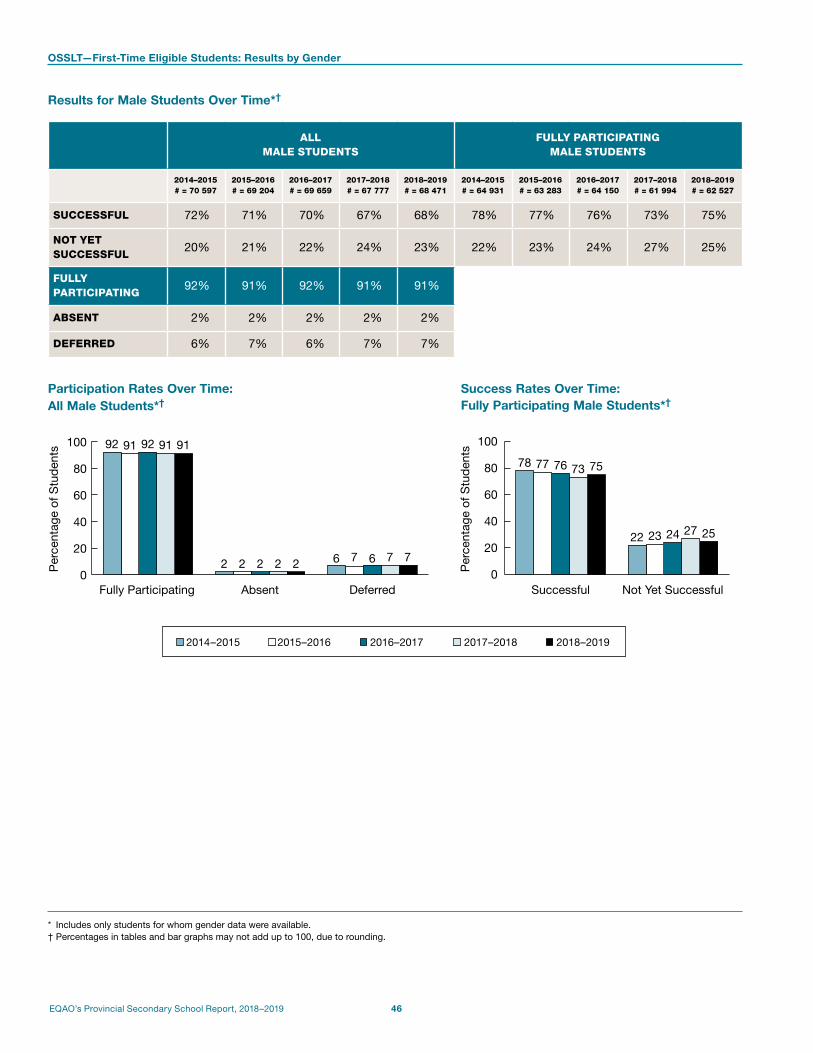
EQAO’s Provincial Secondary School Report, 2018–2019 46
OSSLT—First-Time Eligible Students: Results by Gender
Results for Male Students Over Time*†
ALL MALE STUDENTS
FULLY PARTICIPATING MALE STUDENTS
2014–2015 # = 70 597
2015–2016 # = 69 204
2016–2017 # = 69 659
2017–2018 # = 67 777
2018–2019 # = 68 471
2014–2015 # = 64 931
2015–2016 # = 63 283
2016–2017 # = 64 150
2017–2018 # = 61 994
2018–2019 # = 62 527
SUCCESSFUL 72% 71% 70% 67% 68% 78% 77% 76% 73% 75%
NOT YET SUCCESSFUL
20% 21% 22% 24% 23% 22% 23% 24% 27% 25%
FULLY PARTICIPATING
92% 91% 92% 91% 91%
ABSENT 2% 2% 2% 2% 2%
DEFERRED 6% 7% 6% 7% 7%
Participation Rates Over Time: All Male Students*†
Success Rates Over Time: Fully Participating Male Students*†
0
20
40
60
80
100
0
20
40
60
80
100
Per
cent
age
of S
tud
ents
mb6__�rst_male_Xe_19.eps
6 7 6 722 2 2 2 Per
cent
age
of S
tud
ents
92 91 92 91
7
91
78 77 76 73
22 23 24 27
75
25
Fully Participating Absent Successful Not Yet SuccessfulDeferred
2017–20182014–2015 2015–2016 2016–2017 2018–2019
* Includes only students for whom gender data were available. † Percentages in tables and bar graphs may not add up to 100, due to rounding.

47 EQAO’s Provincial Secondary School Report, 2018–2019
OSSLT—First-Time Eligible Students: Results by Gender
Number of Fully Participating First-Time Eligible Students by Gender*
2014–2015 2015–2016 2016–2017 2017–2018 2018–2019
FEMALE 62 936 61 694 62 991 60 716 61 723
MALE 64 931 63 283 64 150 61 994 62 527
Success Rates Over Time: Fully Participating Female and Male Students*
0
20
40
60
80
100
Per
cent
age
of S
tud
ents
mb7__�rst_Parti_gender_Xe_19.eps
77 76 737886 85 85 84
7586
Female Male
2014–2015
2015–2016
2016–2017
2017–2018
2018–2019
* Includes only students for whom gender data were available.
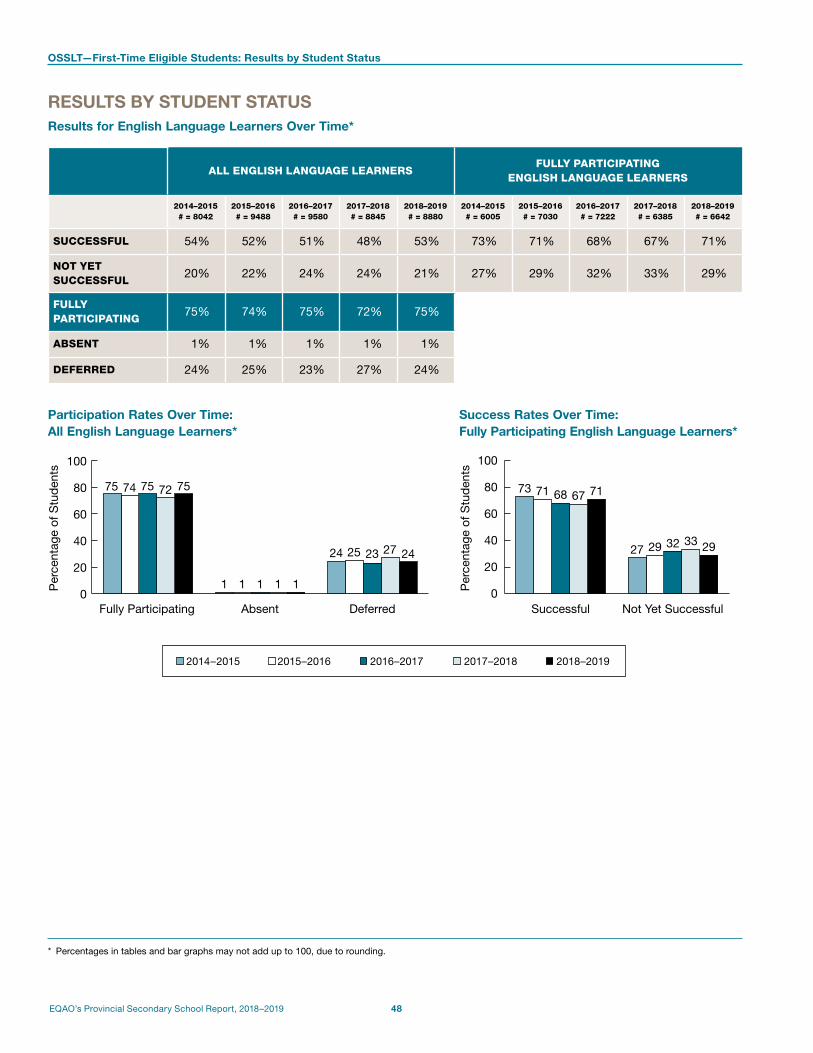
EQAO’s Provincial Secondary School Report, 2018–2019 48
OSSLT—First-Time Eligible Students: Results by Student Status
RESULTS BY STUDENT STATUSResults for English Language Learners Over Time*
ALL ENGLISH LANGUAGE LEARNERSFULLY PARTICIPATING
ENGLISH LANGUAGE LEARNERS
2014–2015 # = 8042
2015–2016 # = 9488
2016–2017 # = 9580
2017–2018 # = 8845
2018–2019 # = 8880
2014–2015 # = 6005
2015–2016 # = 7030
2016–2017 # = 7222
2017–2018 # = 6385
2018–2019 # = 6642
SUCCESSFUL 54% 52% 51% 48% 53% 73% 71% 68% 67% 71%
NOT YET SUCCESSFUL
20% 22% 24% 24% 21% 27% 29% 32% 33% 29%
FULLY PARTICIPATING
75% 74% 75% 72% 75%
ABSENT 1% 1% 1% 1% 1%
DEFERRED 24% 25% 23% 27% 24%
Participation Rates Over Time: All English Language Learners*
Success Rates Over Time: Fully Participating English Language Learners*
0
20
40
60
80
100
0
20
40
60
80
100
Per
cent
age
of S
tud
ents
mb17__�rst_EngLanLear_Xe_19.eps
24 25 23 27
1 1 1 1 1 Per
cent
age
of S
tud
ents
75 74 75 72
24
75 73 71 68 67
27 29 32 33
71
29
Fully Participating Absent Successful Not Yet SuccessfulDeferred
2017–20182014–2015 2015–2016 2016–2017 2018–2019
* Percentages in tables and bar graphs may not add up to 100, due to rounding.

49 EQAO’s Provincial Secondary School Report, 2018–2019
Results for Students with Special Education Needs (Excluding Gifted) Over Time*
ALL STUDENTS WITH SPECIAL EDUCATION NEEDS
FULLY PARTICIPATING STUDENTS WITH SPECIAL EDUCATION NEEDS
2014–2015 # = 25 772
2015–2016 # = 25 907
2016–2017 # = 26 311
2017–2018# = 25 908
2018–2019# = 26 504
2014–2015 # = 21 869
2015–2016 # = 21 952
2016–2017 # = 22 566
2017–2018 # = 21 994
2018–2019 # = 22 322
SUCCESSFUL 45% 44% 45% 40% 42% 54% 53% 52% 48% 50%
NOT YET SUCCESSFUL
39% 40% 41% 44% 43% 46% 47% 48% 52% 50%
FULLY PARTICIPATING
85% 85% 86% 85% 84%
ABSENT 3% 3% 3% 3% 3%
DEFERRED 12% 12% 11% 12% 13%
Participation Rates Over Time: All Students with Special Education Needs (Excluding Gifted)*
Success Rates Over Time: Fully Participating Students with Special Education Needs (Excluding Gifted)*
0
20
40
60
80
100
0
20
40
60
80
100
Per
cent
age
of S
tud
ents
mb18__�rst_specialNeeds_Xe_19.eps
12 12 12 13113 3 3 3 3 P
erce
ntag
e of
Stu
den
ts85 85 86 8485
54 53 52 48 46 47 48 5250 50
Fully Participating Absent Successful Not Yet SuccessfulDeferred
2017–20182014–2015 2015–2016 2016–2017 2018–2019
* Percentages in tables and bar graphs may not add up to 100, due to rounding.
OSSLT—First-Time Eligible Students: Results by Student Status

EQAO’s Provincial Secondary School Report, 2018–2019 50
Number of Fully Participating Students with Special Education Needs (Excluding Gifted) Receiving Accommodations
2014–2015 2015–2016 2016–2017* 2017–2018 2018–2019
Students with Special Education Needs (IEP Only,† Excluding Gifted) Receiving Accommodations
8770 9338 9613 8040 7818
Students with Special Education Needs (IEP and IPRC,† Excluding Gifted) Receiving Accommodations
11 752 11 458 10 849 9181 9058
Success Rates Over Time: Fully Participating Students with Special Education Needs (Excluding Gifted) Receiving Accommodations
0
20
40
60
80
100
Per
cent
age
of S
tud
ents
mb19__�rst_specialNeeds_RA_Xe_19.eps
56 51 5054 51 47 4451
4550
Students with Special Education Needs (IEP and IPRC,* Excluding Gifted)
Receiving Accommodations
Students with Special Education Needs (IEP Only,* Excluding Gifted)Receiving Accommodations
2017–20182014–2015 2015–2016 2016–2017* 2018–2019
* Numbers and percentages are based on students who participated in the March administration, which offered all permitted accommodations.† Individual Education Plan (IEP); Identification, Placement and Review Committee (IPRC).
OSSLT—First-Time Eligible Students: Results by Student Status

51 EQAO’s Provincial Secondary School Report, 2018–2019
OSSLT—First-Time Eligible Students: Results by Course Type in English
RESULTS BY COURSE TYPE IN ENGLISHResults for Students Taking the Academic English Course Over Time*
ALL STUDENTS IN THE ACADEMIC ENGLISH COURSE
FULLY PARTICIPATING STUDENTS IN THE ACADEMIC ENGLISH COURSE
2014–2015 # = 99 813
2015–2016 # = 98 153
2016–2017 # = 100 950
2017–2018# = 97 851
2018–2019# = 99 381
2014–2015 # = 97 615
2015–2016 # = 95 971
2016–2017 # = 99 051
2017–2018 # = 95 709
2018–2019 # = 97 228
SUCCESSFUL 91% 90% 90% 88% 89% 93% 92% 92% 90% 91%
NOT YET SUCCESSFUL
7% 8% 8% 9% 8% 7% 8% 8% 10% 9%
FULLY PARTICIPATING
98% 98% 98% 98% 98%
ABSENT 1% 1% 1% 1% 1%
DEFERRED 1% 1% 1% 1% 1%
Participation Rates Over Time: All Students in the Academic English Course*
Success Rates Over Time: Fully Participating Students in the Academic English Course*
0
20
40
60
80
100
0
20
40
60
80
100
Per
cent
age
of S
tud
ents
mb43__�rst_AcademicEng_Xe_19.eps
1 1 1 1 11 1 1 1 1 Per
cent
age
of S
tud
ents
98 98 98 98 98 93 92 92 90
7 8 8 10
91
9
Fully Participating Absent Successful Not Yet SuccessfulDeferred
2017–20182014–2015 2015–2016 2016–2017 2018–2019
* Percentages in tables and bar graphs may not add up to 100, due to rounding.

EQAO’s Provincial Secondary School Report, 2018–2019 52
Results for Students Taking the Applied English Course Over Time*
ALL STUDENTS IN THE APPLIED ENGLISH COURSE
FULLY PARTICIPATING STUDENTS IN THE APPLIED ENGLISH COURSE
2014–2015 # = 29 316
2015–2016 # = 27 678
2016–2017 # = 27 006
2017–2018# = 25 674
2018–2019# = 25 648
2014–2015 # = 26 213
2015–2016 # = 24 772
2016–2017 # = 24 233
2017–2018 # = 22 700
2018–2019 # = 22 437
SUCCESSFUL 45% 42% 39% 34% 36% 50% 47% 44% 39% 41%
NOT YET SUCCESSFUL
45% 48% 50% 54% 51% 50% 53% 56% 61% 59%
FULLY PARTICIPATING
89% 90% 90% 88% 87%
ABSENT 3% 3% 3% 3% 4%
DEFERRED 7% 7% 7% 8% 9%
Participation Rates Over Time: All Students in the Applied English Course*
Success Rates Over Time: Fully Participating Students in the Applied English Course*
0
20
40
60
80
100
0
20
40
60
80
100
Per
cent
age
of S
tud
ents
mb44__�rst_AppliedEng_Xe_19.eps
77 7 83 3 3 3 4
Per
cent
age
of S
tud
ents89 90 90 88
50 47 44 3950 53 56 61
9
87
41
59
Fully Participating Absent Successful Not Yet SuccessfulDeferred
2017–20182014–2015 2015–2016 2016–2017 2018–2019
* Percentages in tables and bar graphs may not add up to 100, due to rounding.
OSSLT—First-Time Eligible Students: Results by Course Type in English

53 EQAO’s Provincial Secondary School Report, 2018–2019
Results for Students Taking a Locally Developed English Course Over Time*
ALL STUDENTS IN A LOCALLY DEVELOPED ENGLISH COURSE
FULLY PARTICIPATING STUDENTS IN A LOCALLY DEVELOPED ENGLISH COURSE
2014–2015 # = 3791
2015–2016 # = 4372
2016–2017 # = 3958
2017–2018# = 3916
2018–2019# = 3888
2014–2015 # = 2064
2015–2016 # = 2307
2016–2017 # = 2060
2017–2018 # = 1963
2018–2019 # = 1880
SUCCESSFUL 7% 6% 6% 3% 3% 13% 11% 11% 7% 7%
NOT YET SUCCESSFUL
47% 47% 46% 47% 45% 87% 89% 89% 93% 93%
FULLY PARTICIPATING
54% 53% 52% 50% 48%
ABSENT 5% 5% 6% 5% 6%
DEFERRED 41% 42% 42% 45% 45%
Participation Rates Over Time: All Students in a Locally Developed English Course*
Success Rates Over Time: Fully Participating Students in a Locally Developed English Course*
0
20
40
60
80
100
0
20
40
60
80
100
Per
cent
age
of S
tud
ents
mb45__�rst_LocalDev_Xe_19.eps
41 42 42 45
5 5 6 5
Per
cent
age
of S
tud
ents
54 53 52 5045
6
48
13 11 11 7
87 89 89 93
7
93
Fully Participating Absent Successful Not Yet SuccessfulDeferred
2017–20182014–2015 2015–2016 2016–2017 2018–2019
* Percentages in tables and bar graphs may not add up to 100, due to rounding.
OSSLT—First-Time Eligible Students: Results by Course Type in English
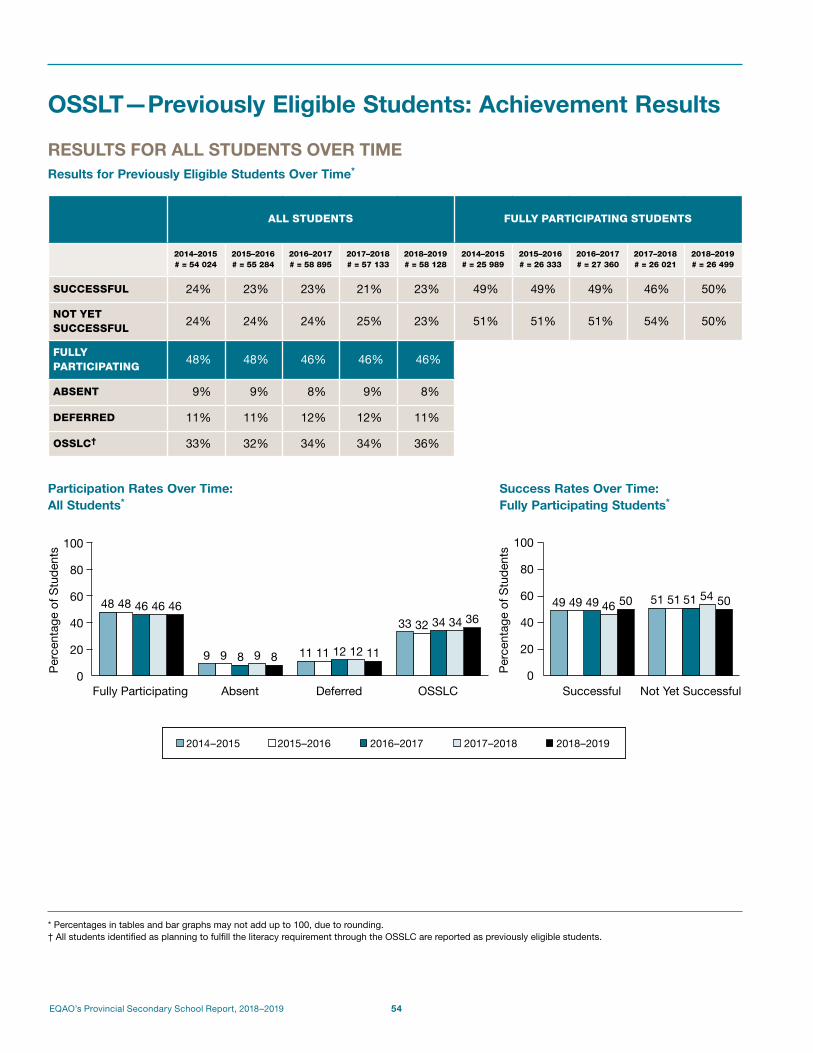
EQAO’s Provincial Secondary School Report, 2018–2019 54
OSSLT—Previously Eligible Students: Achievement Results
RESULTS FOR ALL STUDENTS OVER TIMEResults for Previously Eligible Students Over Time*
ALL STUDENTS FULLY PARTICIPATING STUDENTS
2014–2015 # = 54 024
2015–2016 # = 55 284
2016–2017 # = 58 895
2017–2018 # = 57 133
2018–2019 # = 58 128
2014–2015 # = 25 989
2015–2016 # = 26 333
2016–2017 # = 27 360
2017–2018 # = 26 021
2018–2019 # = 26 499
SUCCESSFUL 24% 23% 23% 21% 23% 49% 49% 49% 46% 50%
NOT YET SUCCESSFUL
24% 24% 24% 25% 23% 51% 51% 51% 54% 50%
FULLY PARTICIPATING
48% 48% 46% 46% 46%
ABSENT 9% 9% 8% 9% 8%
DEFERRED 11% 11% 12% 12% 11%
OSSLC† 33% 32% 34% 34% 36%
Participation Rates Over Time: All Students*
Success Rates Over Time: Fully Participating Students*
0
20
40
60
80
100
0
20
40
60
80
100
mb2__prev_overTime_Xe_19.eps
Per
cent
age
of S
tud
ents
Per
cent
age
of S
tud
ents
48 48 46 46
9 9 8 9 11 11 12 12
33 32 34 3446
8 11
3649 49 4649 51 51 5450 5051
Fully Participating Absent Successful Not Yet SuccessfulDeferred OSSLC
2016–20172013–2014 2014–2015 2015–2016 2017–20182017–20182014–2015 2015–2016 2016–2017 2018–2019
* Percentages in tables and bar graphs may not add up to 100, due to rounding.† All students identified as planning to fulfill the literacy requirement through the OSSLC are reported as previously eligible students.

55 EQAO’s Provincial Secondary School Report, 2018–2019
OSSLT—Previously Eligible Students: Results by Gender
RESULTS BY GENDER Results for Female Students Over Time*†
ALL FEMALE STUDENTS
FULLY PARTICIPATING FEMALE STUDENTS
2014–2015 # = 21 079
2015–2016 # = 21 746
2016–2017 # = 23 582
2017–2018# = 22 431
2018–2019# = 22 295
2014–2015 # = 10 444
2015–2016 # = 10 731
2016–2017 # = 11 349
2017–2018 # = 10 446
2018–2019 # = 10 474
SUCCESSFUL 27% 26% 27% 24% 27% 54% 54% 55% 51% 57%
NOT YET SUCCESSFUL
23% 23% 22% 23% 20% 46% 46% 45% 49% 43%
FULLY PARTICIPATING
50% 49% 48% 47% 47%
ABSENT 9% 9% 8% 9% 8%
DEFERRED 11% 11% 11% 12% 11%
OSSLC‡ 31% 31% 33% 32% 34%
Participation Rates Over Time: All Students*
Success Rates Over Time: Fully Participating Students*
0
20
40
60
80
100
0
20
40
60
80
100
mb8__prev_female_Xe_19.eps
Per
cent
age
of S
tud
ents
Per
cent
age
of S
tud
ents
50 49 48 47
9 9 8 9 11 11 11 12
31 31 33 32
47
8 11
34
54 55 515446 45 49
57
4346
Fully Participating Absent Successful Not Yet SuccessfulDeferred OSSLC
2016–20172013–2014 2014–2015 2015–2016 2017–20182017–20182014–2015 2015–2016 2016–2017 2018–2019
* Includes only students for whom gender data were available.† Percentages in tables and bar graphs may not add up to 100, due to rounding.‡ All students identified as planning to fulfill the literacy requirement through the OSSLC are reported as previously eligible students.

EQAO’s Provincial Secondary School Report, 2018–2019 56
OSSLT—Previously Eligible Students: Results by Gender
Results for Male Students Over Time*†
ALL MALE STUDENTS
FULLY PARTICIPATING MALE STUDENTS
2014–2015 # = 32 945
2015–2016 # = 33 538
2016–2017 # = 35 313
2017–2018# = 34 683
2018–2019# = 35 833
2014–2015 # = 15 545
2015–2016 # = 15 602
2016–2017 # = 16 011
2017–2018 # = 15 575
2018–2019 # = 16 025
SUCCESSFUL 22% 21% 20% 19% 20% 46% 45% 45% 42% 46%
NOT YET SUCCESSFUL
25% 25% 25% 26% 24% 54% 55% 55% 58% 54%
FULLY PARTICIPATING
47% 47% 45% 45% 45%
ABSENT 8% 9% 8% 8% 8%
DEFERRED 11% 12% 12% 11% 10%
OSSLC‡ 34% 33% 34% 35% 37%
Participation Rates Over Time: All Students*
Success Rates Over Time: Fully Participating Students*
0
20
40
60
80
100
0
20
40
60
80
100
mb9__prev_male_Xe_19.eps
Per
cent
age
of S
tud
ents
Per
cent
age
of S
tud
ents
47 47 45 45
8 9 8 8 11 12 12 11
34 33 34 3545
8 10
3745 45 4246
55 55 5846
5454
Fully Participating Absent Successful Not Yet SuccessfulDeferred OSSLC
2016–20172013–2014 2014–2015 2015–2016 2017–20182017–20182014–2015 2015–2016 2016–2017 2018–2019
* Includes only students for whom gender data were available.† Percentages in tables and bar graphs may not add up to 100, due to rounding.‡ All students identified as planning to fulfill the literacy requirement through the OSSLC are reported as previously eligible students.

57 EQAO’s Provincial Secondary School Report, 2018–2019
OSSLT—Previously Eligible Students: Results by Gender
Number of Fully Participating Previously Eligible Students by Gender*
2014–2015 2015–2016 2016–2017 2017–2018 2018–2019
FEMALE 10 444 10 731 11 349 10 446 10 474
MALE 15 545 15 602 16 011 15 575 16 025
Success Rates Over Time: Fully Participating Female and Male Students*
0
20
40
60
80
100
Per
cent
age
of S
tud
ents
mb7__�rst_Parti_gender_Xe_19.eps
45 45 424654 54 55 51 46
57
Female Male
2014–2015
2015–2016
2016–2017
2017–2018
2018–2019
* Includes only students for whom gender data were available.

EQAO’s Provincial Secondary School Report, 2018–2019 58
OSSLT—Previously Eligible Students: Results by Student Status
RESULTS BY STUDENT STATUSResults for English Language Learners Over Time*
ALL ENGLISH LANGUAGE LEARNERSFULLY PARTICIPATING
ENGLISH LANGUAGE LEARNERS
2014–2015 # = 8278
2015–2016 # = 9520
2016–2017 # = 11 276
2017–2018 # = 10 545
2018–2019 # = 9821
2014–2015 # = 5040
2015–2016 # = 5611
2016–2017 # = 6308
2017–2018 # = 5547
2018–2019 # = 4926
SUCCESSFUL 27% 26% 24% 19% 21% 45% 44% 43% 37% 42%
NOT YET SUCCESSFUL
33% 33% 32% 33% 29% 55% 56% 57% 63% 58%
FULLY PARTICIPATING
61% 59% 56% 53% 50%
ABSENT 4% 4% 5% 5% 5%
DEFERRED 22% 23% 24% 24% 25%
OSSLC† 13% 14% 15% 18% 19%
Participation Rates Over Time: All English Language Learners*
Success Rates Over Time: Fully Participating English Language Learners*
0
20
40
60
80
100
0
20
40
60
80
100
mb23__prev_EngLanLear_Xe_19.eps
Per
cent
age
of S
tud
ents
Per
cent
age
of S
tud
ents
61 59 56 53
4 4 5 5
22 23 24 2413 14 15 18
50
5
2519
44 4337
4556 57
63
42
5855
Fully Participating Absent Successful Not Yet SuccessfulDeferred OSSLC
2016–20172013–2014 2014–2015 2015–2016 2017–20182017–20182014–2015 2015–2016 2016–2017 2018–2019
* Percentages in tables and bar graphs may not add up to 100, due to rounding.† All students identified as planning to fulfill the literacy requirement through the OSSLC are reported as previously eligible students.

59 EQAO’s Provincial Secondary School Report, 2018–2019
OSSLT—Previously Eligible Students: Results by Student Status
Results for Students with Special Education Needs (Excluding Gifted) Over Time*
ALL STUDENTS WITH SPECIAL EDUCATION NEEDS
FULLY PARTICIPATING STUDENTS WITH SPECIAL EDUCATION NEEDS
2014–2015 # = 21 881
2015–2016 # = 22 033
2016–2017 # = 22 624
2017–2018# = 21 976
2018–2019# = 23 286
2014–2015 # = 9370
2015–2016 # = 9167
2016–2017 # = 8846
2017–2018 # = 8536
2018–2019 # = 9163
SUCCESSFUL 15% 14% 13% 12% 13% 35% 34% 34% 30% 34%
NOT YET SUCCESSFUL
28% 27% 26% 27% 26% 65% 66% 66% 70% 66%
FULLY PARTICIPATING
43% 42% 39% 39% 39%
ABSENT 8% 9% 8% 8% 7%
DEFERRED 10% 10% 10% 10% 9%
OSSLC† 39% 40% 42% 43% 44%
Participation Rates Over Time: All Students with Special Education Needs (Excluding Gifted)*
Success Rates Over Time: Fully Participating Students with Special Education Needs (Excluding Gifted)*
0
20
40
60
80
100
0
20
40
60
80
100
mb23__prev_EngLanLear_Xe_19.eps
Per
cent
age
of S
tud
ents
Per
cent
age
of S
tud
ents
43 42 39 39
8 9 8 8 1010 10 10
39 40 42 4339
7 9
4434 34 3035
66 66 70
34
6665
Fully Participating Absent Successful Not Yet SuccessfulDeferred OSSLC
2016–20172013–2014 2014–2015 2015–2016 2017–20182017–20182014–2015 2015–2016 2016–2017 2018–2019
* Percentages in tables and bar graphs may not add up to 100, due to rounding.† All students identified as planning to fulfill the literacy requirement through the OSSLC are reported as previously eligible students.

EQAO’s Provincial Secondary School Report, 2018–2019 60
OSSLT—Previously Eligible Students: Results by Student Status
Number of Fully Participating Students with Special Education Needs (Excluding Gifted) Receiving Accommodations
2014–2015 2015–2016 2016–2017* 2017–2018 2018–2019
Students with Special Education Needs (IEP Only,† Excluding Gifted) Receiving Accommodations
3407 3670 3635 2769 3193
Students with Special Education Needs (IEP and IPRC,† Excluding Gifted) Receiving Accommodations
5317 5037 4478 3900 3933
Success Rates Over Time: Fully Participating Students with Special Education Needs (Excluding Gifted) Receiving Accommodations
0
20
40
60
80
100
Per
cent
age
of S
tud
ents
mb25__prev_specialNeeds_RA_Xe_19.eps
40 35 343933 29 27
383231
Students with Special Education Needs (IEP and IPRC,* Excluding Gifted)
Receiving Accommodations
Students with Special Education Needs (IEP Only,* Excluding Gifted)Receiving Accommodations
2017–20182014–2015 2015–2016 2016–2017* 2018–2019
* Numbers and percentages are based on students who participated in the March administration, which offered all permitted accommodations.† Individual Education Plan (IEP); Identification, Placement and Review Committee (IPRC).
61 EQAO’s Provincial Secondary School Report, 2018–2019
Cohort Tracking—Grade 3 to Grade 6 to Grade 10 (OSSLT)
TRACKING PROGRESS IN LITERACY FROM GRADE 3 THROUGH GRADE 6 TO GRADE 10 (OSSLT)English-Language Students
Note: Provincial-level results for the primary and junior divisions of the English-
language school system are not available for 2015. Due to exceptional
circumstances, a significant proportion of schools and boards did not
participate in the provincial assessments that school year.

EQAO’s Provincial Secondary School Report, 2018–2019 62
OSSLT: Explanation of TermsFirst-Time Eligible StudentsFirst-time eligible students are working toward an Ontario Secondary School Diploma (OSSD). These students are expected to write the Ontario Secondary School Literacy Test (OSSLT) for the first time in the spring of their second year of secondary school; this also applies to students who entered Grade 10 from out of province.
Previously Eligible StudentsPreviously eligible includes all students who were absent or deferred, or were unsuccessful during one or more previous administrations; were previously exempted but are now working toward an OSSD; entered Grade 11 or 12 from out of province or enrolled in an adult education program and began Grade 9 in or after the 2000–2001 school year.
All StudentsThis method of reporting provides percentages based on all students in the cohort who are working toward an OSSD. The only students excluded are those who are not working toward an OSSD (exempted students).
Fully Participating StudentsThis method of reporting provides percentages based on students for whom there is work for both sessions of the administration of the OSSLT and who were assigned an achievement result (successful, not yet successful). Students who are not working toward an OSSD, those who were absent and those who were deferred are excluded.
SuccessfulStudents who fully participated in the OSSLT and received a score that met the expected standard.
Not Yet SuccessfulStudents who fully participated in the OSSLT and received a score that did not meet the expected standard.
AbsentStudents who did not have a result due to absence for one or both sessions or for other reasons.
DeferredStudents’ participation in the OSSLT can be deferred under several circumstances, as outlined in EQAO’s How to Administer the OSSLT. A student is categorized as deferred only if the school indicates a deferral. If a student has completed any portion of the OSSLT, he or she is not categorized as deferred.
OSSLCStudents are placed in this category of reporting if the school indicated that the students would be fulfilling the literacy requirement through the Ontario Secondary School Literacy Course (OSSLC). For details about the OSSLC, see the Ministry of Education website (www.edu.gov.on.ca). If a student has completed any portion of the OSSLT, he or she is not categorized as OSSLC.
ExemptedStudents can be exempted from the OSSLT only if they are not working toward an OSSD. A student is categorized as exempted only if the school indicates that the student is exempted. If a student has completed any portion of the OSSLT, he or she is not categorized as exempted.
English Language LearnersThese are students who have been identified by the school in accordance with English Language Learners: ESL and ELD Programs and Services: Policies and Procedures for Ontario Elementary and Secondary Schools, Kindergarten to Grade 12 (2007). English language learners were formerly called English as a second language (ESL)/English literacy development (ELD) learners.
English Language Learners Receiving Special ProvisionsThese are English language learners identified by the school as receiving special provisions. Detailed information about special provisions is available in EQAO’s How to Administer the OSSLT.
Students with Special Education Needs (Excluding Gifted)These are students who have an Individual Education Plan (IEP). These students may or may not have been formally identified by an Identification, Placement and Review Committee (IPRC). Students identified solely as gifted are not included.
Students with Special Education Needs (Excluding Gifted) Receiving AccommodationsThese are students with special education needs identified by the school as receiving accommodations. Students identified solely as gifted are not included. Detailed information about accommodations are available in the Ministry of Education’s Ontario Schools, Kindergarten to Grade 12: Policy and Program Requirements (2016) and EQAO’s How to Administer the OSSLT.

2 Carlton Street, Suite 1200, Toronto ON M5B 2M9 Telephone: 1-888-327-7377 Website: www.eqao.com
© 2019 Queen’s Printer for OntarioISBN: 978-1-4868-3745-8 (PDF) Cp
rs_9Xe_0919