ontario municipal report card 2013 - canadian taxpayers federation
TRANSCRIPT

Municipal Report Card
Candice Malcolm, Ontario Director Canadian Taxpayers Federation Nick Bergamini, Research Director July 2013
1
Ontario Municipal Report Card

Municipal Report Card
Candice Malcolm, Ontario Director Canadian Taxpayers Federation Nick Bergamini, Research Director July 2013
2
Table of Contents
About the Canadian Taxpayers Federation .................................................................................................................................................. 3 About the Ontario Municipal Report Card .................................................................................................................................................... 4
Municipal Report Card Grading Rubric ......................................................................................................................................................... 6
2013 Class Rankings ............................................................................................................................................................................................ 7 Municipal Report Card Highlights .................................................................................................................................................................. 8
Municipal Sunshine List Growth ....................................................................................................................................................................... 9
Property Taxes: 2012 Average Tax Bill by Municipality ....................................................................................................................... 10 Property Tax Grading Scheme ........................................................................................................................................................................ 11
Ranking Summary .............................................................................................................................................................................................. 12 Municipal Report Cards .................................................................................................................................................................................... 13

Municipal Report Card
Candice Malcolm, Ontario Director Canadian Taxpayers Federation Nick Bergamini, Research Director July 2013
3
About the Canadian Taxpayers Federation
The Canadian Taxpayers Federation (CTF) is a federally incorporated, not-‐for-‐profit citizen’s group dedicated to lower taxes, less waste and accountable government. The CTF was founded in Saskatchewan in 1990 when the Association of Saskatchewan Taxpayers and the Resolution One Association of Alberta joined forces to create a national taxpayers organization. Today, the CTF has 84,000 supporters nation-‐wide
The CTF maintains a federal office in Ottawa and regional offices in British Columbia, Alberta, Prairie (SK and MB), Ontario and Atlantic. Regional offices conduct research and advocacy activities specific to their provinces in addition to acting as regional organizers of Canada-‐wide initiatives.
CTF offices field hundreds of media interviews each month, hold press conferences and issue regular news releases, commentaries, online postings and publications to advocate on behalf of CTF supporters. CTF representatives speak at functions, make presentations to government, meet with politicians, and organize petition drives, events and campaigns to mobilize citizens to affect public policy change. Each week CTF offices send out Let’s Talk Taxes commentaries to more than 800 media outlets and personalities across Canada.
Any Canadian taxpayer committed to the CTF’s mission is welcome to join at no cost and receive issue and Action Updates. Financial supporters can additionally receive the CTF’s flagship publication, The Taxpayer magazine published four times a year.
The CTF is independent of any institutional or partisan affiliations. All CTF staff, board and representatives are prohibited from holding a membership in any political party.

Municipal Report Card
Candice Malcolm, Ontario Director Canadian Taxpayers Federation Nick Bergamini, Research Director July 2013
4
About the Ontario Municipal Report Card The Canadian Taxpayers Federation compiled this report using public data released by the Government of Ontario in its annual Sunshine List. This report focuses on government employee compensation and the growth of salaries in municipal governments. The twenty largest cities and municipalities are analyzed and compared in this report. In order to determine growth in spending and assess current municipal administrations, comparisons are measured over two years, since 2010. The “Growth of Sunshine List” measure shows the number of government workers promoted onto the Sunshine List during this period, while the “Growth of List Salaries” shows the growth in total funds spent on Sunshine List salaries. The “Fat Cat Ratio” compares cities on a per capita basis, and illustrates how many government workers make Sunshine List salaries per 10,000 residents. The “Average Salary” measure shows the average salary on the Sunshine List, not the average salary of municipal employees. To add another level of depth to the report, we calculated the average 2012 property tax bill across these municipalities to determine how many households – paying the average property tax rate – are required to pay the salary of average Sunshine List employee. A larger number of households in this measure is more desirable because the individual tax burden per household is shared and therefore lower. A smaller number of households mean the burden for paying Sunshine List employees in higher per household. Paying a quarter of a tab is better than paying half of it. Unlike the Sunshine List data, complete property tax information is not proactively disclosed by the provincial government, therefore the numbers collected are not uniform, and were found through various sources, including individual municipal government resources. Often municipalities display and disclose average or typical residential property assessments and average residential property tax bills differently. This contributed to some inevitable inconsistencies in our data. 2012 property tax bills are based on the Municipal Property Assessment Corporation’s (MPAC) assessments with a valuation date of
Municipal Report Card
Candice Malcolm, Ontario Director Canadian Taxpayers Federation Nick Bergamini, Research Director July 2013
5
January 1, 20081. This information, however, was not always available, and thus some municipalities display the 2013 property tax bill. The 2013 property tax bill is based upon one-‐quarter of the average increase in property value between 2009 and 2012. This is because of Ontario provincial legislation requiring a four-‐year “phase-‐in” valuation for home reassessments by the MPAC. It is our hope that next year’s report card will display more accurate property tax bills once this new system is in place. This report focuses on municipalities, and the 20 largest in Ontario were chosen to be included in this report. Regions such as Niagara, Peel, and York were not included because cities and towns that comprise the majority of the population in those regions were included individually. Durham Region, however, was included due to its size and composition. Because Durham overlaps with some of the municipalities included, the property tax metric is not included in Durham’s grade. Some of the Sunshine List data is organized differently between municipalities, and over the time we measured for growth ratios. The measures are not always uniform, which can affect the accuracy of our data. Similarly, property tax information is not displayed uniformly across the province, making it difficult to collect and display all information accurately. Our Municipal Report Card offers a general assessment of how each city is managed and operated, and how well-‐off taxpayers are relative to other taxpayers in cities across Ontario. The CTF grading scale is illustrated in the Grading Rubric based on relative spending and growth. Letter grades are determined according to the Canadian academic grading system. Special thanks to Corey Schruder, CTF’s 2013 research intern, for his contributions to this report.
1 http://www.mpac.ca/property_owners/default.asp
Municipal Report Card
Candice Malcolm, Ontario Director Canadian Taxpayers Federation Nick Bergamini, Research Director July 2013
6
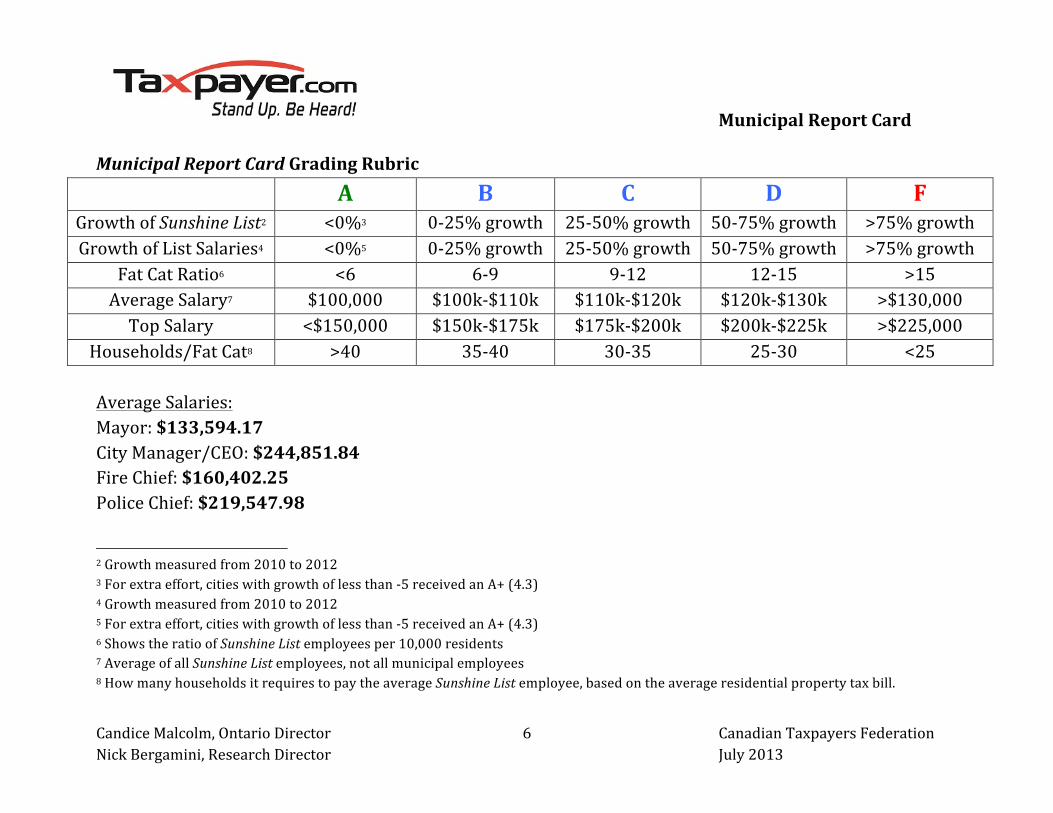
Municipal Report Card Grading Rubric A B C D F Growth of Sunshine List2 <0%3 0-‐25% growth 25-‐50% growth 50-‐75% growth >75% growth Growth of List Salaries4 <0%5 0-‐25% growth 25-‐50% growth 50-‐75% growth >75% growth
Fat Cat Ratio6 <6 6-‐9 9-‐12 12-‐15 >15 Average Salary7 $100,000 $100k-‐$110k $110k-‐$120k $120k-‐$130k >$130,000 Top Salary <$150,000 $150k-‐$175k $175k-‐$200k $200k-‐$225k >$225,000
Households/Fat Cat8 >40 35-‐40 30-‐35 25-‐30 <25 Average Salaries: Mayor: $133,594.17 City Manager/CEO: $244,851.84 Fire Chief: $160,402.25 Police Chief: $219,547.98
2 Growth measured from 2010 to 2012 3 For extra effort, cities with growth of less than -‐5 received an A+ (4.3) 4 Growth measured from 2010 to 2012 5 For extra effort, cities with growth of less than -‐5 received an A+ (4.3) 6 Shows the ratio of Sunshine List employees per 10,000 residents 7 Average of all Sunshine List employees, not all municipal employees 8 How many households it requires to pay the average Sunshine List employee, based on the average residential property tax bill.
Municipal Report Card
Candice Malcolm, Ontario Director Canadian Taxpayers Federation Nick Bergamini, Research Director July 2013
7
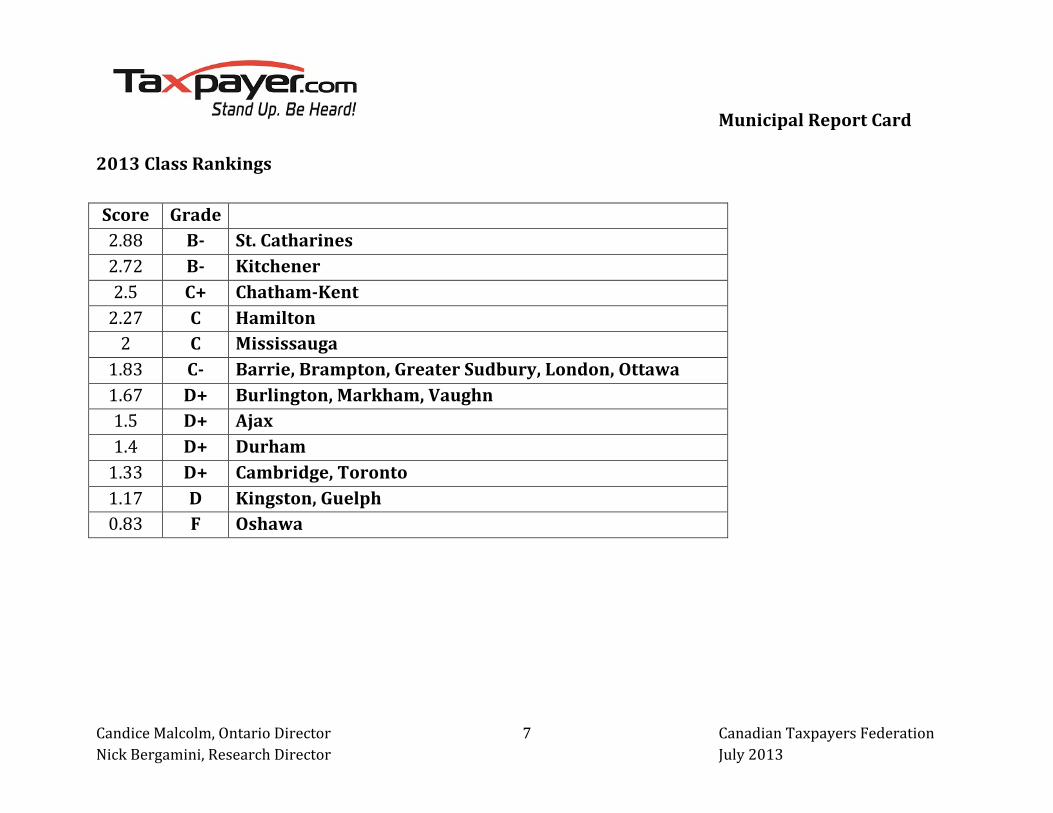
2013 Class Rankings Score Grade 2.88 B-‐ St. Catharines 2.72 B-‐ Kitchener 2.5 C+ Chatham-‐Kent 2.27 C Hamilton 2 C Mississauga
1.83 C-‐ Barrie, Brampton, Greater Sudbury, London, Ottawa 1.67 D+ Burlington, Markham, Vaughn 1.5 D+ Ajax 1.4 D+ Durham 1.33 D+ Cambridge, Toronto 1.17 D Kingston, Guelph 0.83 F Oshawa

Municipal Report Card
Candice Malcolm, Ontario Director Canadian Taxpayers Federation Nick Bergamini, Research Director July 2013
8
Municipal Report Card Highlights
• Mayors, on average, are paid $133,594 in the twenty largest municipalities in Ontario • City managers/CEOs, on average, are paid $244,851 • Toronto Police Chief William Sterling Blair topped the list of high-‐paid municipal employees, making $370,727 last year
• Top municipal performers are St. Catharines, and then Kitchener, as each decreased their Sunshine List since 2010
• Hamilton also decreased its Sunshine List; however also imposes high property taxes and maintains a high ratio of Sunshine List bureaucrats per capita, contributing to its lower report card score
• The worst municipal performers are Oshawa and Kingston, as each have grown their Sunshine List by over 80 per cent since 2010
• The city with the lowest number of Sunshine List employees per capita is Kitchener • Per capita, the worst Sunshine List performer was Toronto, which has more than 25 Sunshine List employees per 10,000 residents
• Average municipal Sunshine Lists have grown 34.5 per cent over the past two years • Average growth in Sunshine List salaries since 2010 is 35.7 per cent

Municipal Report Card
Candice Malcolm, Ontario Director Canadian Taxpayers Federation Nick Bergamini, Research Director July 2013
9
-‐10%
0%
10%
20%
30%
40%
50%
60%
70%
80%
90%
% change
Municipality/City
Municipal Sunshine List Growth
% change in total Sunshine List salaries since 2010
% change in number of Sunshine List employees since 2010

Municipal Report Card
Candice Malcolm, Ontario Director Canadian Taxpayers Federation Nick Bergamini, Research Director July 2013
10
Property Taxes 2012 Average Tax Bill by Municipality
Municipal Report Card
Candice Malcolm, Ontario Director Canadian Taxpayers Federation Nick Bergamini, Research Director July 2013
11
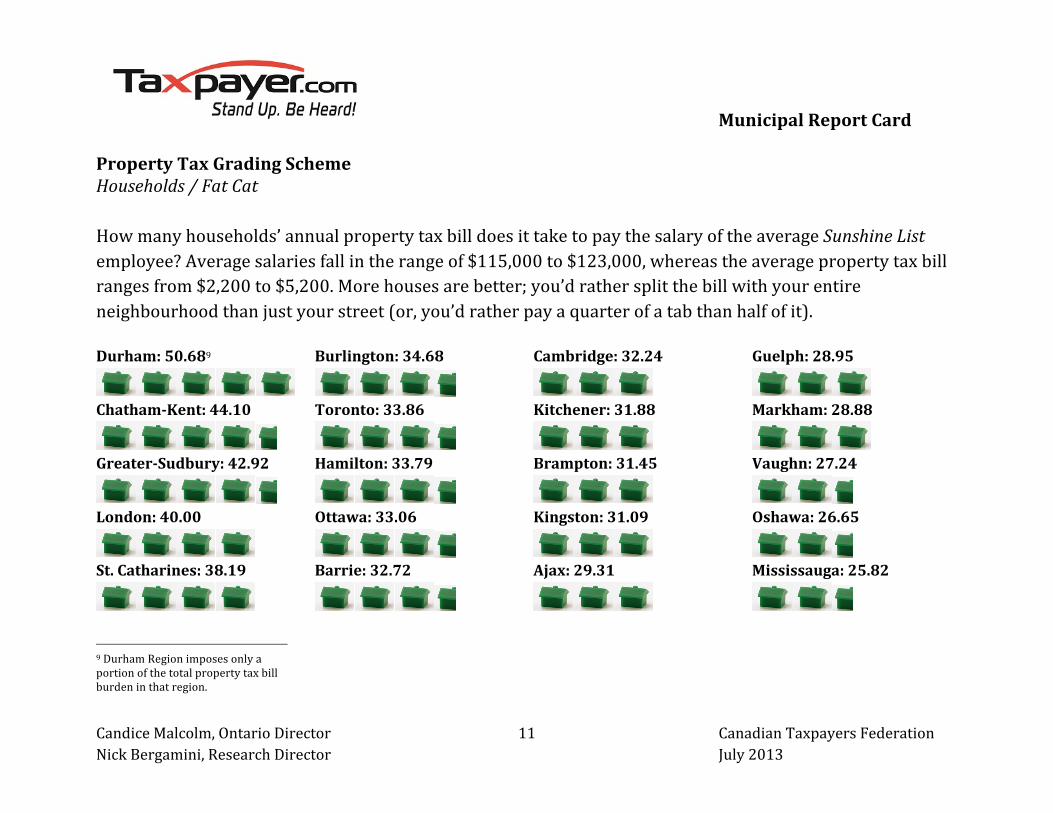
Property Tax Grading Scheme Households / Fat Cat How many households’ annual property tax bill does it take to pay the salary of the average Sunshine List employee? Average salaries fall in the range of $115,000 to $123,000, whereas the average property tax bill ranges from $2,200 to $5,200. More houses are better; you’d rather split the bill with your entire neighbourhood than just your street (or, you’d rather pay a quarter of a tab than half of it). Durham: 50.689
Chatham-‐Kent: 44.10
Greater-‐Sudbury: 42.92
London: 40.00
St. Catharines: 38.19
9 Durham Region imposes only a portion of the total property tax bill burden in that region.
Burlington: 34.68
Toronto: 33.86
Hamilton: 33.79
Ottawa: 33.06
Barrie: 32.72
Cambridge: 32.24
Kitchener: 31.88
Brampton: 31.45
Kingston: 31.09
Ajax: 29.31
Guelph: 28.95
Markham: 28.88
Vaughn: 27.24
Oshawa: 26.65
Mississauga: 25.82
Municipal Report Card
Candice Malcolm, Ontario Director Canadian Taxpayers Federation Nick Bergamini, Research Director July 2013
12
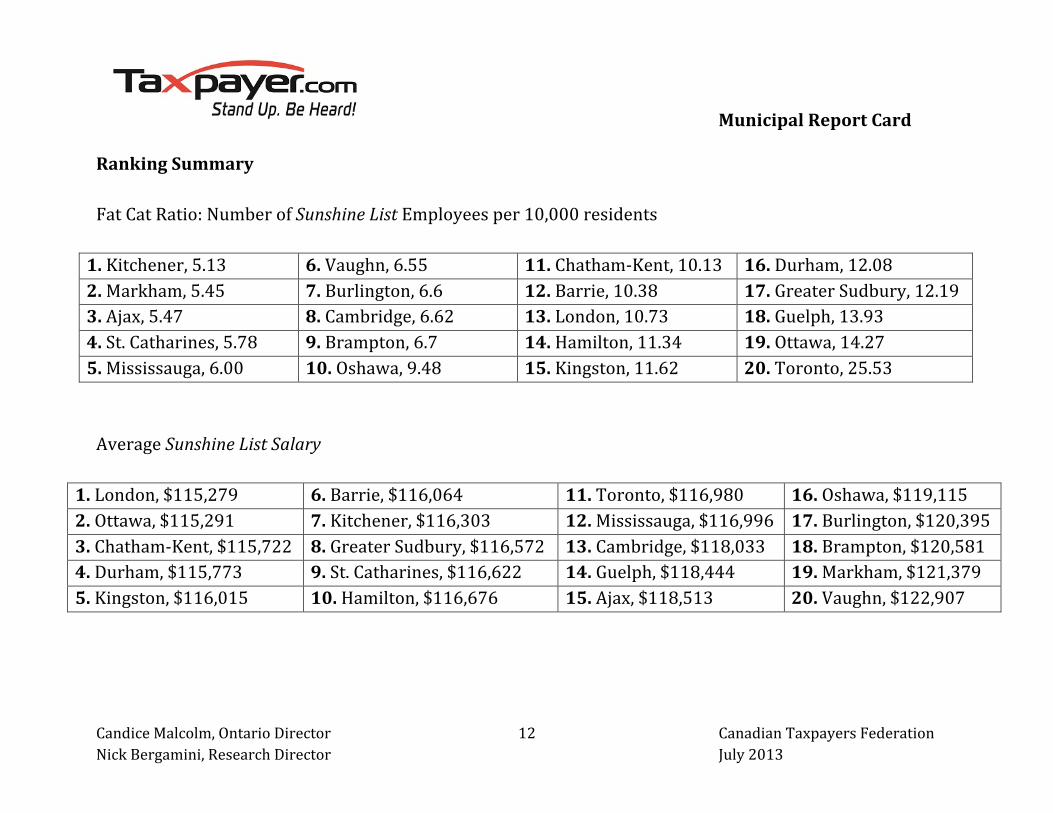
Ranking Summary Fat Cat Ratio: Number of Sunshine List Employees per 10,000 residents 1. Kitchener, 5.13 6. Vaughn, 6.55 11. Chatham-‐Kent, 10.13 16. Durham, 12.08 2. Markham, 5.45 7. Burlington, 6.6 12. Barrie, 10.38 17. Greater Sudbury, 12.19 3. Ajax, 5.47 8. Cambridge, 6.62 13. London, 10.73 18. Guelph, 13.93 4. St. Catharines, 5.78 9. Brampton, 6.7 14. Hamilton, 11.34 19. Ottawa, 14.27 5. Mississauga, 6.00 10. Oshawa, 9.48 15. Kingston, 11.62 20. Toronto, 25.53 Average Sunshine List Salary
1. London, $115,279 6. Barrie, $116,064 11. Toronto, $116,980 16. Oshawa, $119,115 2. Ottawa, $115,291 7. Kitchener, $116,303 12. Mississauga, $116,996 17. Burlington, $120,395 3. Chatham-‐Kent, $115,722 8. Greater Sudbury, $116,572 13. Cambridge, $118,033 18. Brampton, $120,581 4. Durham, $115,773 9. St. Catharines, $116,622 14. Guelph, $118,444 19. Markham, $121,379 5. Kingston, $116,015 10. Hamilton, $116,676 15. Ajax, $118,513 20. Vaughn, $122,907

Municipal Report Card
Candice Malcolm, Ontario Director Canadian Taxpayers Federation Nick Bergamini, Research Director July 2013
13
Ajax D+ Population: 109,600
Mayor Steve Parish: $107,877 City Manager/CEO Brian Skinner: $219,020 Fire Chief: Mike Diotte: $164,493 Police Chief (Durham Region) Mike Ewles: $243,861
Growth of List 76% F Growth of Salaries 74% D Fat Cat Ratio 5.47/10,000 A Average Salary $118,513 C Top Salary $219,020 D
Households/Fat Cat D
COMMENT: “With a population of just over 100,000, it’s difficult to understand why Ajax needs an executive team with over $700,000 per year in salaries.” “Ajax is heading in the wrong direction. For a municipality with an overall decent performance, the rapid growth of its Sunshine List is very disappointing.” -‐Candice Malcolm, Ontario Director
Municipal Report Card
Candice Malcolm, Ontario Director Canadian Taxpayers Federation Nick Bergamini, Research Director July 2013
14
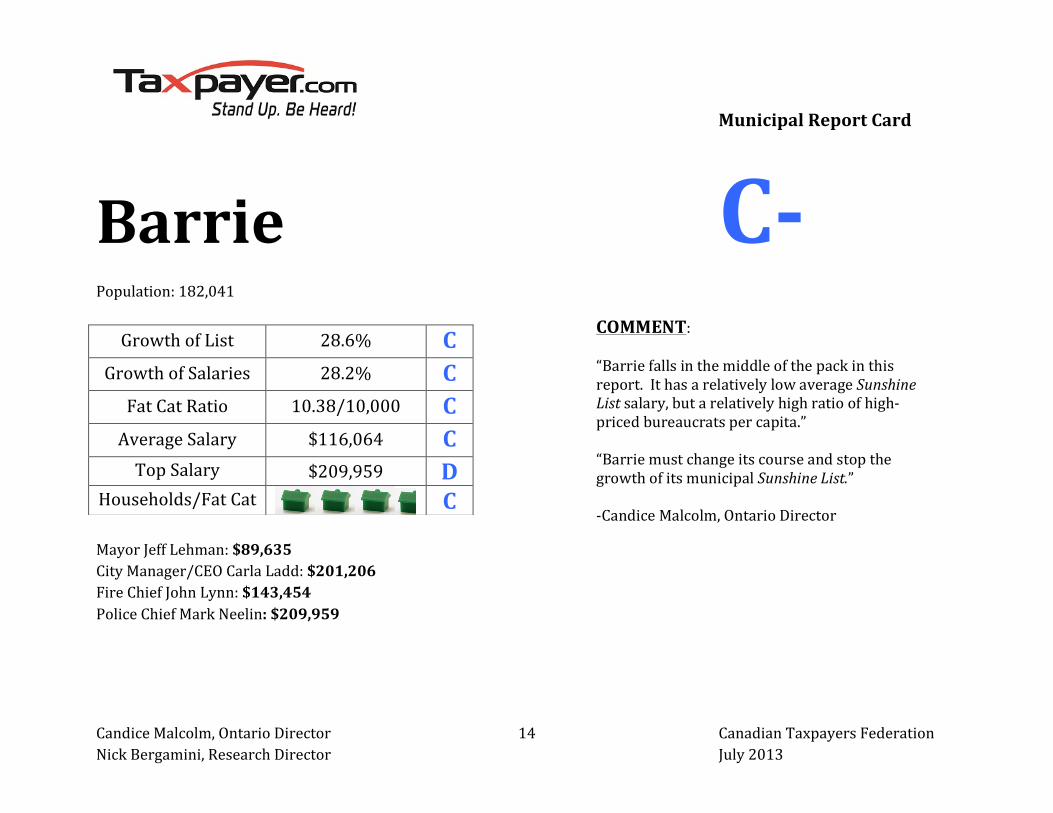
Barrie C-‐ Population: 182,041
Mayor Jeff Lehman: $89,635 City Manager/CEO Carla Ladd: $201,206 Fire Chief John Lynn: $143,454 Police Chief Mark Neelin: $209,959
Growth of List 28.6% C Growth of Salaries 28.2% C Fat Cat Ratio 10.38/10,000 C Average Salary $116,064 C Top Salary $209,959 D
Households/Fat Cat C
COMMENT: “Barrie falls in the middle of the pack in this report. It has a relatively low average Sunshine List salary, but a relatively high ratio of high-‐priced bureaucrats per capita.” “Barrie must change its course and stop the growth of its municipal Sunshine List.” -‐Candice Malcolm, Ontario Director
Municipal Report Card
Candice Malcolm, Ontario Director Canadian Taxpayers Federation Nick Bergamini, Research Director July 2013
15
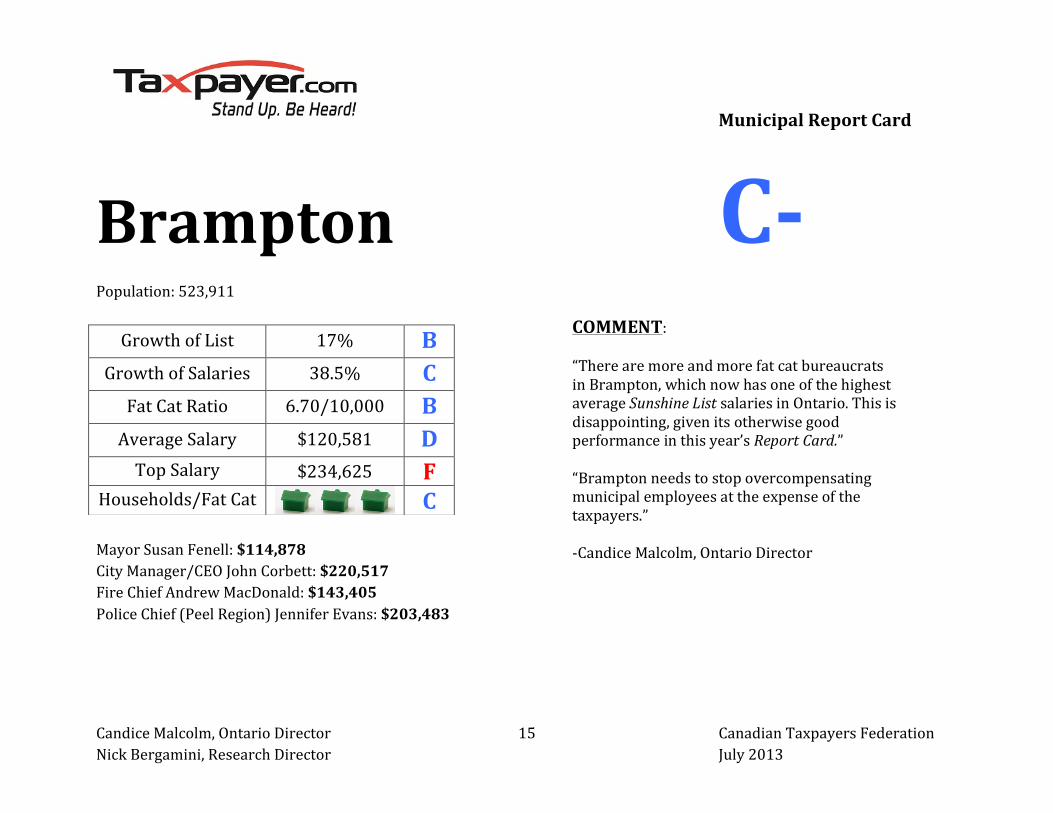
Brampton C-‐ Population: 523,911
Mayor Susan Fenell: $114,878 City Manager/CEO John Corbett: $220,517 Fire Chief Andrew MacDonald: $143,405 Police Chief (Peel Region) Jennifer Evans: $203,483
Growth of List 17% B Growth of Salaries 38.5% C Fat Cat Ratio 6.70/10,000 B Average Salary $120,581 D Top Salary $234,625 F
Households/Fat Cat C
COMMENT: “There are more and more fat cat bureaucrats in Brampton, which now has one of the highest average Sunshine List salaries in Ontario. This is disappointing, given its otherwise good performance in this year’s Report Card.” “Brampton needs to stop overcompensating municipal employees at the expense of the taxpayers.” -‐Candice Malcolm, Ontario Director
Municipal Report Card
Candice Malcolm, Ontario Director Canadian Taxpayers Federation Nick Bergamini, Research Director July 2013
16
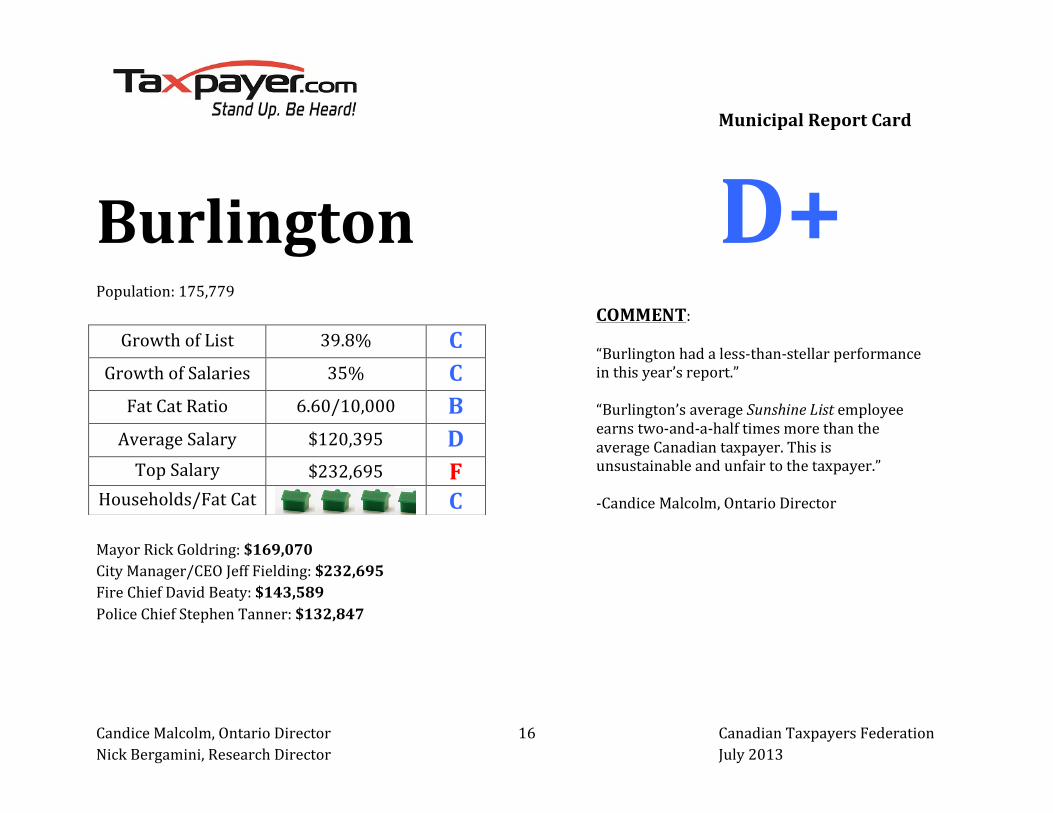
Burlington D+ Population: 175,779
Mayor Rick Goldring: $169,070 City Manager/CEO Jeff Fielding: $232,695 Fire Chief David Beaty: $143,589 Police Chief Stephen Tanner: $132,847
Growth of List 39.8% C Growth of Salaries 35% C Fat Cat Ratio 6.60/10,000 B Average Salary $120,395 D Top Salary $232,695 F
Households/Fat Cat C
COMMENT: “Burlington had a less-‐than-‐stellar performance in this year’s report.” “Burlington’s average Sunshine List employee earns two-‐and-‐a-‐half times more than the average Canadian taxpayer. This is unsustainable and unfair to the taxpayer.” -‐Candice Malcolm, Ontario Director

Municipal Report Card
Candice Malcolm, Ontario Director Canadian Taxpayers Federation Nick Bergamini, Research Director July 2013
17
Cambridge D+ Population: 132,900
Mayor Doug Craig: $139,850 City Manager/CEO James King: $202,235 Fire Chief William Chesney: $164,529 Police Chief (Waterloo) Matthew Torigian: $236,208
Growth of List 83.3% F Growth of Salaries 86.9% F Fat Cat Ratio 6.62/10,000 B Average Salary $118,033 C Top Salary $202,235 D
Households/Fat Cat C
COMMENT: “Cambridge has nearly doubled its Sunshine List over the past two years, both in the number of employees on the list and the amount government workers are paid.” “Cambridge has experienced the most rapid growth in Sunshine List spending in Ontario over the past two years. This is a worrisome alarm bell to taxpayers.” -‐Candice Malcolm, Ontario Director
Municipal Report Card
Candice Malcolm, Ontario Director Canadian Taxpayers Federation Nick Bergamini, Research Director July 2013
18
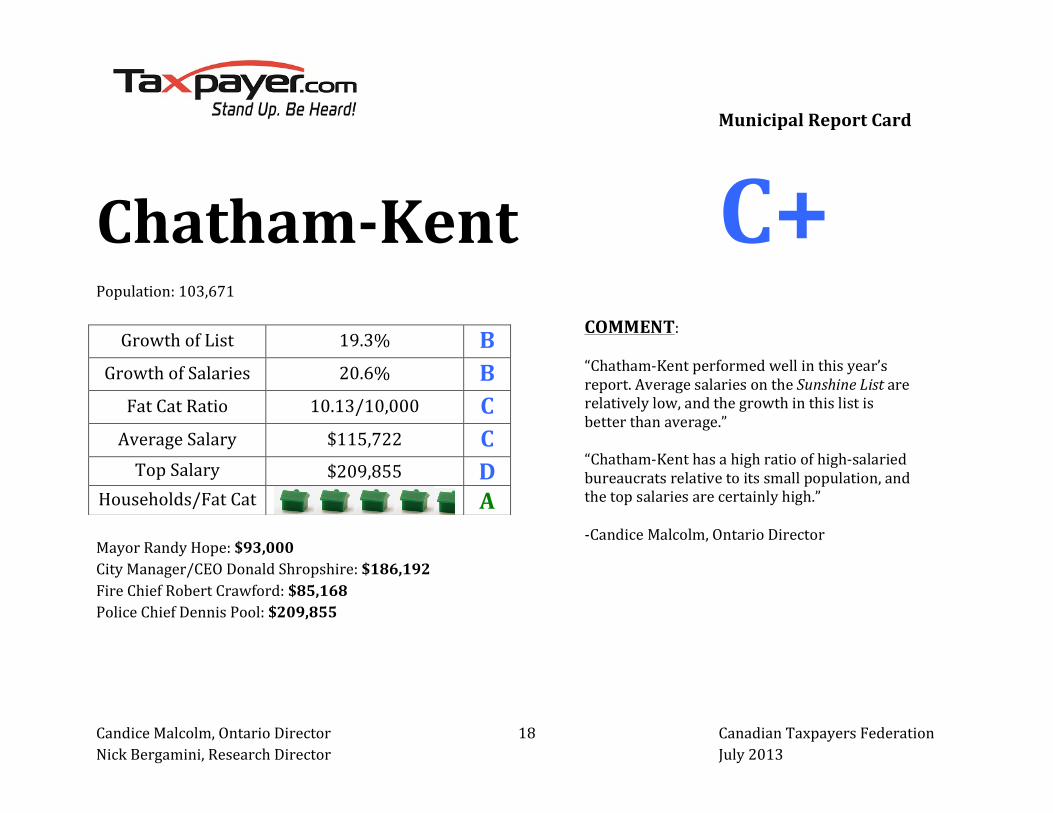
Chatham-‐Kent C+ Population: 103,671
Mayor Randy Hope: $93,000 City Manager/CEO Donald Shropshire: $186,192 Fire Chief Robert Crawford: $85,168 Police Chief Dennis Pool: $209,855
Growth of List 19.3% B Growth of Salaries 20.6% B Fat Cat Ratio 10.13/10,000 C Average Salary $115,722 C Top Salary $209,855 D
Households/Fat Cat A
COMMENT: “Chatham-‐Kent performed well in this year’s report. Average salaries on the Sunshine List are relatively low, and the growth in this list is better than average.” “Chatham-‐Kent has a high ratio of high-‐salaried bureaucrats relative to its small population, and the top salaries are certainly high.” -‐Candice Malcolm, Ontario Director

Municipal Report Card
Candice Malcolm, Ontario Director Canadian Taxpayers Federation Nick Bergamini, Research Director July 2013
19
Durham D+
Population: 561,253
“CEO of Council” Roger Anderson: $215,211 City Manager/CEO Garry Cubitt: $330,679 Police Chief (Durham Region) Mike Ewles: $243,861 NOTE: Fire services are managed by individual cities within Durham
10 This is only a portion of the property tax burden of municipal taxpayers in the Durham Region. For this reason, Durham is not graded on this metric
Growth of List 29.9% C Growth of Salaries 30.5% C Fat Cat Ratio 12.08/10,000 D Average Salary $115,773 C Top Salary $330,679 F
Households/Fat Cat 50.6810 -‐
COMMENT: “Durham’s executive team is extremely well paid. Politicians give themselves a raise, meanwhile, hardworking Ontario families are being left behind.” “Durham’s average Sunshine List salaries are low, but growth over the last two years is sending the wrong message to taxpayers. Durham needs to curb its spending on municipal government workers.” -‐Candice Malcolm, Ontario Director
Municipal Report Card
Candice Malcolm, Ontario Director Canadian Taxpayers Federation Nick Bergamini, Research Director July 2013
20
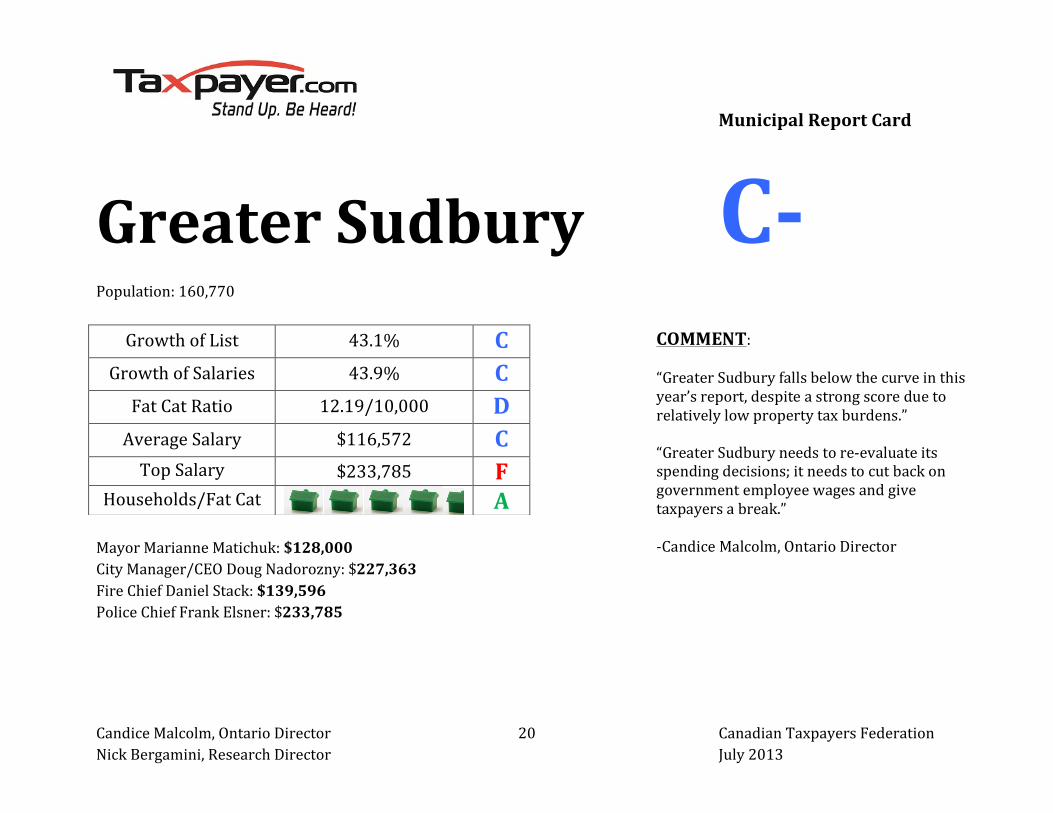
Greater Sudbury C-‐ Population: 160,770
Mayor Marianne Matichuk: $128,000 City Manager/CEO Doug Nadorozny: $227,363 Fire Chief Daniel Stack: $139,596 Police Chief Frank Elsner: $233,785
Growth of List 43.1% C Growth of Salaries 43.9% C Fat Cat Ratio 12.19/10,000 D Average Salary $116,572 C Top Salary $233,785 F
Households/Fat Cat A
COMMENT: “Greater Sudbury falls below the curve in this year’s report, despite a strong score due to relatively low property tax burdens.” “Greater Sudbury needs to re-‐evaluate its spending decisions; it needs to cut back on government employee wages and give taxpayers a break.” -‐Candice Malcolm, Ontario Director
Municipal Report Card
Candice Malcolm, Ontario Director Canadian Taxpayers Federation Nick Bergamini, Research Director July 2013
21
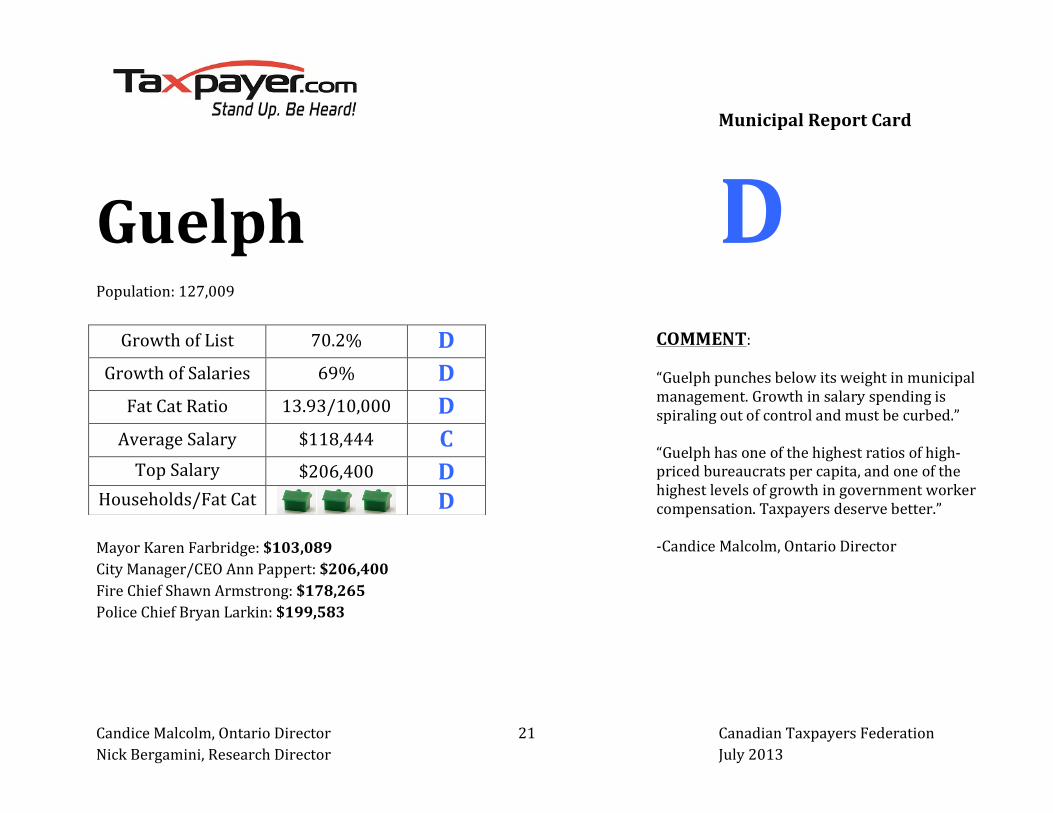
Guelph D Population: 127,009
Mayor Karen Farbridge: $103,089 City Manager/CEO Ann Pappert: $206,400 Fire Chief Shawn Armstrong: $178,265 Police Chief Bryan Larkin: $199,583
Growth of List 70.2% D Growth of Salaries 69% D Fat Cat Ratio 13.93/10,000 D Average Salary $118,444 C Top Salary $206,400 D
Households/Fat Cat D
COMMENT: “Guelph punches below its weight in municipal management. Growth in salary spending is spiraling out of control and must be curbed.” “Guelph has one of the highest ratios of high-‐priced bureaucrats per capita, and one of the highest levels of growth in government worker compensation. Taxpayers deserve better.” -‐Candice Malcolm, Ontario Director

Municipal Report Card
Candice Malcolm, Ontario Director Canadian Taxpayers Federation Nick Bergamini, Research Director July 2013
22
Hamilton C Population: 721,053
Mayor Bob Bratina: $118,568 City Manager/CEO Christopher Murray: $246,525 Fire Chief Robert Simonds: $179,262 Police Chief Glen De Caire: $256,136
Growth of List -‐5.4% A+ Growth of Salaries -‐7.3% A+ Fat Cat Ratio 11.34/10,000 D Average Salary $116,676 C Top Salary $256,136 F
Households/Fat Cat C
COMMENT: “Hamilton scores well compared to other municipalities Ontario. It was able to curb government employee compensation and reduce the number of Sunshine List bureaucrats.” -‐Candice Malcolm, Ontario Director
Municipal Report Card
Candice Malcolm, Ontario Director Canadian Taxpayers Federation Nick Bergamini, Research Director July 2013
23
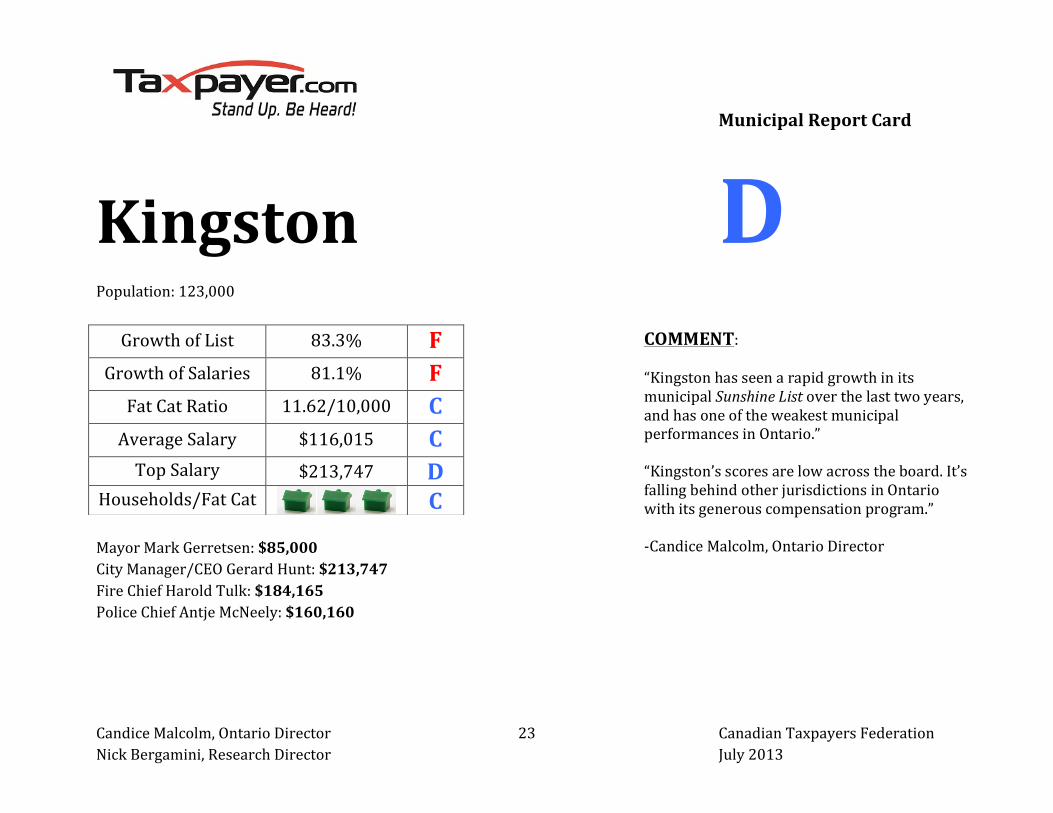
Kingston D
Population: 123,000
Mayor Mark Gerretsen: $85,000 City Manager/CEO Gerard Hunt: $213,747 Fire Chief Harold Tulk: $184,165 Police Chief Antje McNeely: $160,160
Growth of List 83.3% F Growth of Salaries 81.1% F Fat Cat Ratio 11.62/10,000 C Average Salary $116,015 C Top Salary $213,747 D
Households/Fat Cat C
COMMENT: “Kingston has seen a rapid growth in its municipal Sunshine List over the last two years, and has one of the weakest municipal performances in Ontario.” “Kingston’s scores are low across the board. It’s falling behind other jurisdictions in Ontario with its generous compensation program.” -‐Candice Malcolm, Ontario Director
Municipal Report Card
Candice Malcolm, Ontario Director Canadian Taxpayers Federation Nick Bergamini, Research Director July 2013
24
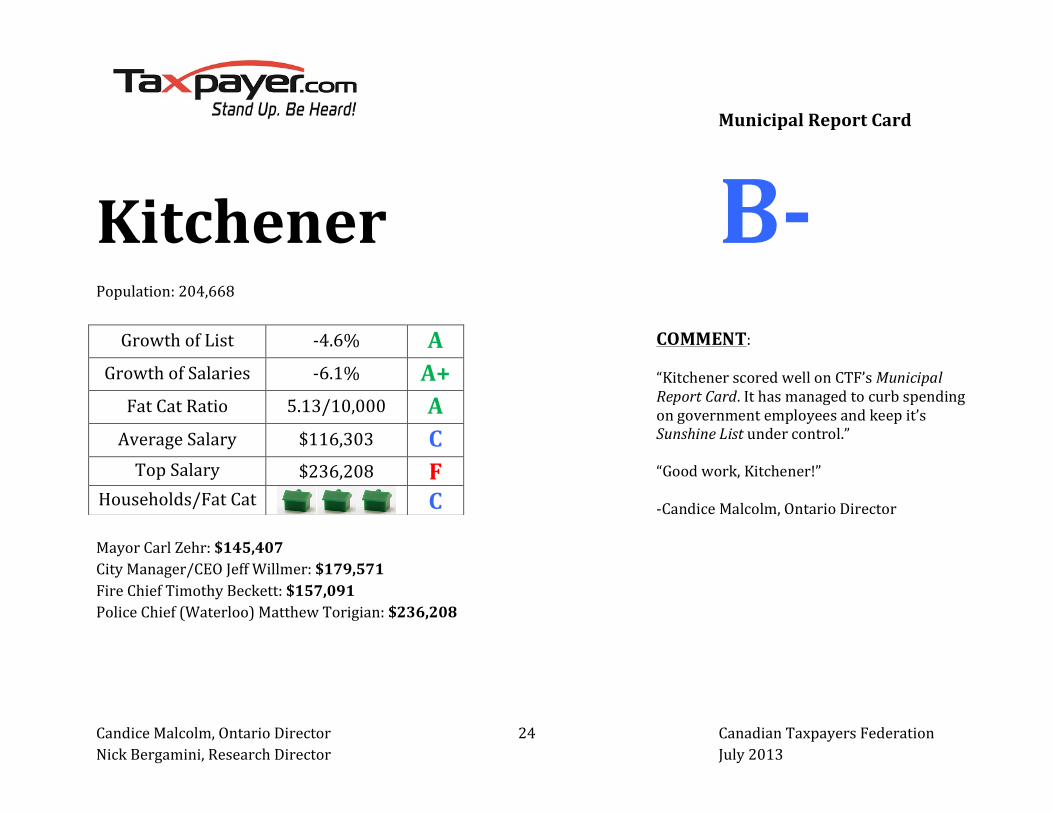
Kitchener B-‐
Population: 204,668
Mayor Carl Zehr: $145,407 City Manager/CEO Jeff Willmer: $179,571 Fire Chief Timothy Beckett: $157,091 Police Chief (Waterloo) Matthew Torigian: $236,208
Growth of List -‐4.6% A Growth of Salaries -‐6.1% A+ Fat Cat Ratio 5.13/10,000 A Average Salary $116,303 C Top Salary $236,208 F
Households/Fat Cat C
COMMENT: “Kitchener scored well on CTF’s Municipal Report Card. It has managed to curb spending on government employees and keep it’s Sunshine List under control.” “Good work, Kitchener!” -‐Candice Malcolm, Ontario Director

Municipal Report Card
Candice Malcolm, Ontario Director Canadian Taxpayers Federation Nick Bergamini, Research Director July 2013
25
London C-‐
Population: 366,151
Mayor Joe Fontana: $102,717 City Manager/CEO Art Zuidema: UNKNOWN11 Fire Chief John Kobarda: $172,146 Police Chief Bradley Duncan: $215,357
11 Former City Manager Jeff Fielding earned $263,553.60 in 2010. He left in May 2012, and his successor Art Zuidema’s salary has not been disclosed
Growth of List 29.7% C Growth of Salaries 29.2% C Fat Cat Ratio 10.73/10,000 D Average Salary $115,279 C Top Salary $215,257 D
Households/Fat Cat B
COMMENT: “London falls in the middle of the pack in Ontario in this year’s Report Card. The municipal government needs to continue to reduce spending and start thinking about the taxpayer before giving staff more pay-‐raises.” -‐Candice Malcolm, Ontario Director
Municipal Report Card
Candice Malcolm, Ontario Director Canadian Taxpayers Federation Nick Bergamini, Research Director July 2013
26
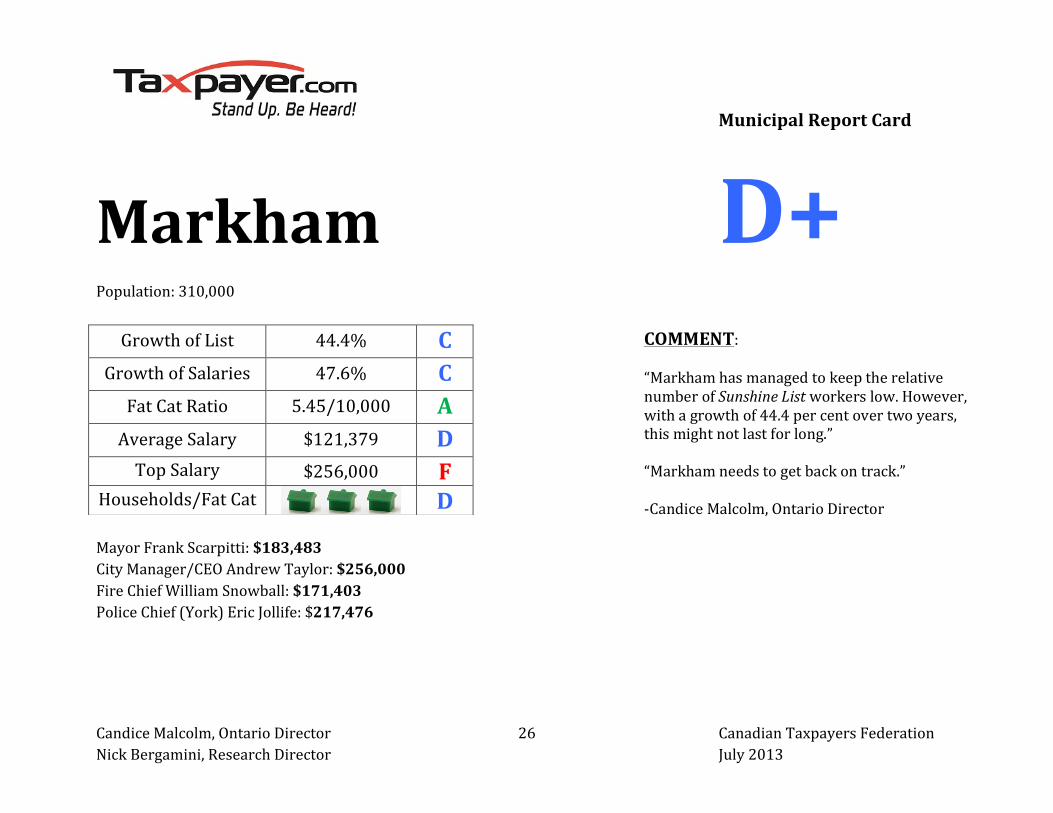
Markham D+ Population: 310,000
Mayor Frank Scarpitti: $183,483 City Manager/CEO Andrew Taylor: $256,000 Fire Chief William Snowball: $171,403 Police Chief (York) Eric Jollife: $217,476
Growth of List 44.4% C Growth of Salaries 47.6% C Fat Cat Ratio 5.45/10,000 A Average Salary $121,379 D Top Salary $256,000 F
Households/Fat Cat D
COMMENT: “Markham has managed to keep the relative number of Sunshine List workers low. However, with a growth of 44.4 per cent over two years, this might not last for long.” “Markham needs to get back on track.” -‐Candice Malcolm, Ontario Director

Municipal Report Card
Candice Malcolm, Ontario Director Canadian Taxpayers Federation Nick Bergamini, Research Director July 2013
27
Mississauga C Population: 713,443
Mayor Hazel McCallion: $138,366 City Manager/CEO Janice Baker: $263,708 Fire Chief John McDougall: $179,093 Police Chief (Peel Region) Jennifer Evans: $203,483
Growth of List 10.6% B Growth of Salaries 11.2% B Fat Cat Ratio 6.00/10,000 B Average Salary $116,996 C Top Salary $263,708 F
Households/Fat Cat D
COMMENT: “Mississauga scores well, overall, on the CTF’s Municipal Report Card. If they hold the line this next year, they could see their grade improve as it barely missed getting an A on the Fat Cat Ratio.” -‐Candice Malcolm, Ontario Director

Municipal Report Card
Candice Malcolm, Ontario Director Canadian Taxpayers Federation Nick Bergamini, Research Director July 2013
28
Oshawa F Population: 155,000
Mayor John Henry: $137,660 City Manager/CEO Robert Scott Duignan: $269,627 Fire Chief Steven Meringer: $163,569 Police Chief (Durham Region) Mike Ewles: $243,861
Growth of List 79.3% F Growth of Salaries 82.1% F Fat Cat Ratio 9.48/10,000 C Average Salary $119,115 C Top Salary $269,627 F
Households/Fat Cat D
COMMENT: “Oshawa scored poorly on all measurements in this report card. It has experienced massive growth in compensation spending, maintains a high average Sunshine List salaries, and pays its top dogs more on average than other jurisdictions in Ontario.” “Oshawa finished dead last in CTF’s Municipal Report Card.” -‐Candice Malcolm, Ontario Director
Municipal Report Card
Candice Malcolm, Ontario Director Canadian Taxpayers Federation Nick Bergamini, Research Director July 2013
29
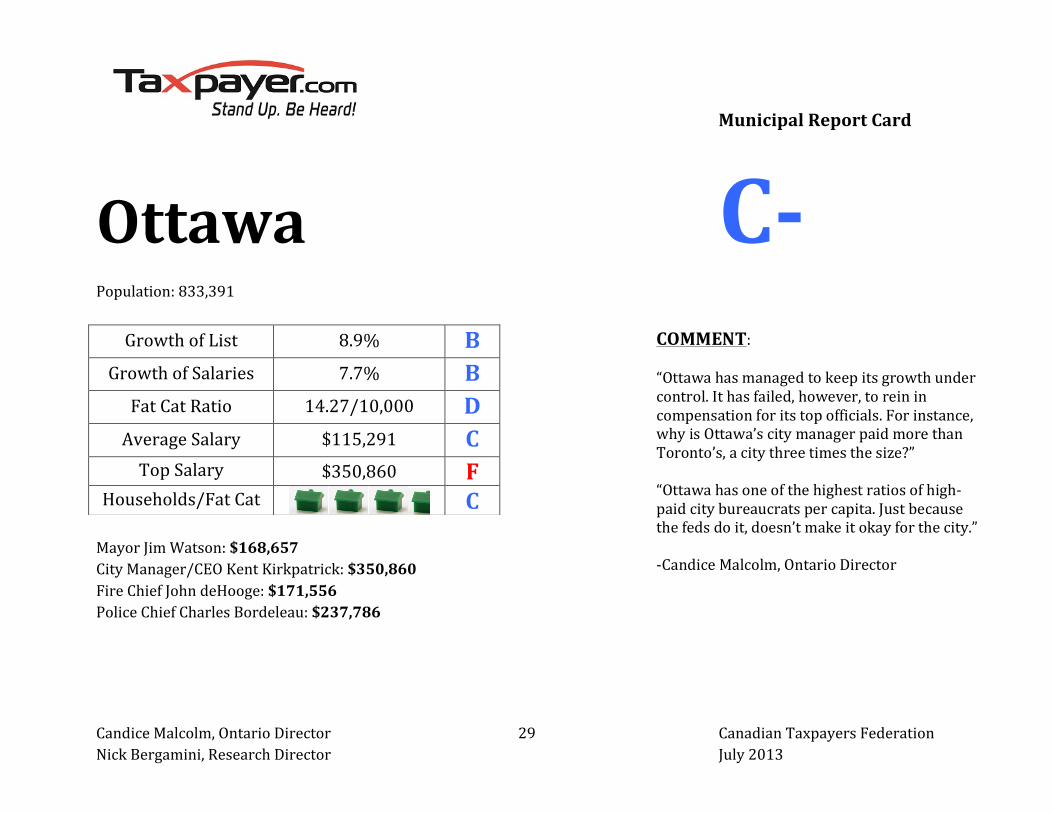
Ottawa C-‐ Population: 833,391
Mayor Jim Watson: $168,657 City Manager/CEO Kent Kirkpatrick: $350,860 Fire Chief John deHooge: $171,556 Police Chief Charles Bordeleau: $237,786
Growth of List 8.9% B Growth of Salaries 7.7% B Fat Cat Ratio 14.27/10,000 D Average Salary $115,291 C Top Salary $350,860 F
Households/Fat Cat C
COMMENT: “Ottawa has managed to keep its growth under control. It has failed, however, to rein in compensation for its top officials. For instance, why is Ottawa’s city manager paid more than Toronto’s, a city three times the size?” “Ottawa has one of the highest ratios of high-‐paid city bureaucrats per capita. Just because the feds do it, doesn’t make it okay for the city.” -‐Candice Malcolm, Ontario Director

Municipal Report Card
Candice Malcolm, Ontario Director Canadian Taxpayers Federation Nick Bergamini, Research Director July 2013
30
St. Catharines B-‐ Population: 131,400
Mayor Bryan McMullan: $88,263 City Manager/CEO Colin Briggs: $240,928 Fire Chief Mark Mehlenbacher: $150,585 Police Chief (Niagara Region) Jeffrey McGuire: $118,848
Growth of List -‐5% A+ Growth of Salaries -‐1.6% A Fat Cat Ratio 5.78/10,000 A Average Salary $116,622 C Top Salary $240,928 F
Households/Fat Cat B
COMMENT: “St. Catharines is the top municipal performer in the class of 2013. The city has managed to reduce the size of its Sunshine List, and keep the number of fat cat employees low relative to the population.” “Way to go, St. Catharines!” -‐Candice Malcolm, Ontario Director
Municipal Report Card
Candice Malcolm, Ontario Director Canadian Taxpayers Federation Nick Bergamini, Research Director July 2013
31
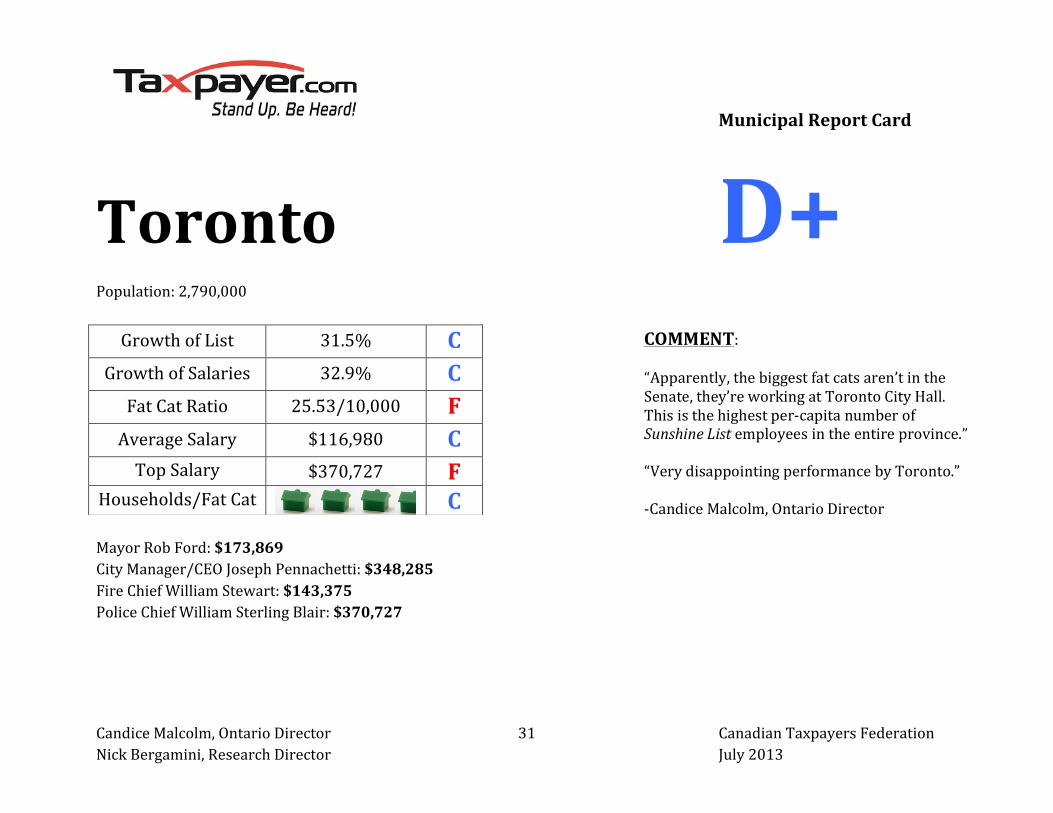
Toronto D+ Population: 2,790,000
Mayor Rob Ford: $173,869 City Manager/CEO Joseph Pennachetti: $348,285 Fire Chief William Stewart: $143,375 Police Chief William Sterling Blair: $370,727
Growth of List 31.5% C Growth of Salaries 32.9% C Fat Cat Ratio 25.53/10,000 F Average Salary $116,980 C Top Salary $370,727 F
Households/Fat Cat C
COMMENT: “Apparently, the biggest fat cats aren’t in the Senate, they’re working at Toronto City Hall. This is the highest per-‐capita number of Sunshine List employees in the entire province.” “Very disappointing performance by Toronto.” -‐Candice Malcolm, Ontario Director

Municipal Report Card
Candice Malcolm, Ontario Director Canadian Taxpayers Federation Nick Bergamini, Research Director July 2013
32
Vaughan D+ Population: 288,301
Mayor Maurizio Bevilacqua: $168,285 City Manager/CEO Clayton Harris: $277,172 Fire Chief Gregory Senay: $167,900 Police Chief (York) Eric Jollife: $217,476
Growth of List 9.3% B Growth of Salaries 10.1% B Fat Cat Ratio 6.55/10,000 B Average Salary $122,907 D Top Salary $277,172 F
Households/Fat Cat F
COMMENT: “Vaughn had a pretty good year, according to CTF’s Municipal Report Card. It maintained a low ratio of high-‐priced bureaucrats and only saw a marginal growth it their Sunshine List.” “Vaughn levies a large property tax burden on its residents, and it fails our final metric. If property taxes went to pay Sunshine List salaries, it would require only 27 households to pay each fat cat. That is shameful.” -‐Candice Malcolm, Ontario Director