ontario and lhin 2015/16 - stroke report cards and...
TRANSCRIPT

Ontario and LHIN 2015/16
Stroke Report Cards and Progress Reports
Setting the Bar Higher
June 2017


Ontario and LHIN 2015/16
Stroke Report Cards and Progress Reports
Setting the Bar Higher
Authors
Ruth E. HallFerhana KhanJen LeviHuiting MaJiming FangCally MartinKay MorrisonJenn FearnGwen BrownLinda Kelloway Moira K. KapralChristina O’Callaghan Mark BayleyBeth Linkewich
June 2017

ONTARIO AND LHIN 2015/16 STROKE REPORT CARDS AND PROGRESS REPORTS
Institute for Clinical Evaluative Sciencesii
Publication Information
© 2017 Institute for Clinical Evaluative Sciences. All rights reserved.
This publication may be reproduced in whole or in part for noncommercial purposes only and on the condition that the original content of the publication or portion of the publication not be altered in any way without the express written permission of ICES. To seek this permission, please contact [email protected].
The Institute for Clinical Evaluative Sciences (ICES) is funded by an annual grant from the Ontario Ministry of Health and Long-Term Care (MOHLTC). The opinions, results and conclusions included in this report are those of the authors and are independent from the funding sources. No endorsement by ICES or the MOHLTC is intended or should be inferred.
Parts of this publication are based on data and information compiled and provided by the Canadian Institute for Health Information (CIHI). However, the analyses, conclusions, opinions and statements expressed herein are those of the authors, and not necessarily those of CIHI.
How to cite this publication
Hall RE, Khan F, Levi J, Ma H, Fang J, Martin C, Morrison K, Fearn J, Brown G, Kelloway L, Kapral MK, O’Callaghan C, Bayley M, Linkewich B. Ontario and LHIN 2015/16 Stroke Report Cards and Progress Reports: Setting the Bar Higher. Toronto, ON: Institute for Clinical Evaluative Sciences; 2017.
This document is available at www.ices.on.ca.
INSTITUTE FOR CLINICAL EVALUATIVE SCIENCES G1 06, 2075 Bayview Avenue Toronto, ON M4N 3M5 Telephone: 416-480-4055 Email: [email protected]
ISBN: 978-1-926850-76-4 (Online)

Institute for Clinical Evaluative Sciences iii
ONTARIO AND LHIN 2015/16 STROKE REPORT CARDS AND PROGRESS REPORTS
Authors’ Affiliations
Ruth E. Hall, PhDOntario Stroke Network Evaluation Scientist and Adjunct Scientist, Institute for Clinical Evaluative Sciences / Assistant Adjunct Professor, Institute of Health Policy, Management and Evaluation, University of Toronto
Ferhana Khan, MPHSenior Research Project Manager, Ontario Stroke Network Evaluation Office and Ontario Stroke Registry, Institute for Clinical Evaluative Sciences
Jen Levi, BAResearch Assistant, Ontario Stroke Network Evaluation Office and Ontario Stroke Registry, Institute for Clinical Evaluative Sciences
Huiting Ma, MScResearch Analyst, Institute for Clinical Evaluative Sciences
Jiming Fang, PhDResearch Methodologist, Institute for Clinical Evaluative Sciences
Cally Martin, BScPT, MScRegional Director, Stroke Network of Southeastern Ontario, Kingston Health Sciences Centre
Kay Morrison, RN, MScNRegional Education Coordinator, Central East Stroke Network / Representative, Ontario Regional Education Group
Jenn Fearn, BHScPT, MScPTRegional Rehabilitation Coordinator, Northeastern Ontario Stroke Network, Health Sciences North
Gwen Brown, RN, BA, BEd, MARegional Stroke Community and Long-Term Care Coordinator, Stroke Network of Southeastern Ontario, Kingston Health Sciences Centre
Linda Kelloway, RN, MN, CNN(C) Director Best Practice, Stroke Services, Cardiac Care Network
Moira K. Kapral, MD, MSc, FRCPCProfessor, Department of Medicine and Institute of Health Policy, Management and Evaluation, University of Toronto / Senior Scientist, Institute for Clinical Evaluative Sciences / Senior Scientist, Toronto General Research Institute / Staff Physician, General Internal Medicine, University Health Network and Mount Sinai Hospital
Christina O’Callaghan, BAppSc (PT)Former Executive Director, Ontario Stroke Network
Mark Bayley, MD, FRCPCDeputy Physiatrist in Chief and Medical Director, Brain and Spinal Cord Rehabilitation Program, Toronto Rehabilitation Institute / Professor, Department of Medicine, University of Toronto / Adjunct Scientist, Institute for Clinical Evaluative Sciences / Chair, Stroke Evaluation Quality Committee, Ontario Stroke Network
Beth Linkewich, MPA, OT Reg (Ont)Chair, Knowledge Translation and Implementation Subcommittee, Ontario Stroke Network / Regional Director, North and East GTA Stroke Network, Sunnybrook Health Sciences Centre / Lecturer, Department of Occupational Science and Occupational Therapy, University of Toronto

ONTARIO AND LHIN 2015/16 STROKE REPORT CARDS AND PROGRESS REPORTS
Institute for Clinical Evaluative Sciencesiv
Acknowledgements
Susan Bursey, Regional Director, Northeastern Ontario Stroke Network
Esmé French, Interim Regional Director, Northwestern Ontario Stroke Network
Sean Gehring, Regional Director, Champlain Regional Stroke Network
Paula Gilmore, Regional Director, Southwestern Ontario Stroke Network
Cheryl Moher, Regional Director, Central East Stroke Network
Nicole Pageau, Regional Director, West GTA Stroke Network
Stefan Pagliuso, Regional Director, Central South Regional Stroke Network
Shelley Sharp, Regional Director, Toronto West Stroke Network
Jacqueline Willems, Regional Director, Southeast Toronto Stroke Network
Data Resources
AlphaFIM® and FIM® are trademarks of Uniform Data System for Medical Rehabilitation, a division of UB Foundation Activities, Inc.
IntelliHealth Ontario (Ontario Ministry of Health and Long-Term Care)
The authors thank IMS Brogan Inc. for use of their Drug Information Database.
Research Analysis
Daniel McCormack, Research Analyst, Institute for Clinical Evaluative Sciences

Institute for Clinical Evaluative Sciences v
ONTARIO AND LHIN 2015/16 STROKE REPORT CARDS AND PROGRESS REPORTS
About the Organizations Involved in this Report
The Ontario Stroke Network
With its vision of Fewer Strokes, Better Outcomes, the mission of the Ontario Stroke Network (OSN) is to provide provincial leadership and planning for the 11 Ontario Regional Stroke Networks supporting the 14 Local Health Integration Networks through: measuring and reporting on performance; partnering to achieve best practices; leading and/or supporting provincial initiatives; and supporting innovations for stroke prevention, care, recovery and reintegration. The OSN delivers on its mission by establishing province-wide goals and initiatives to implement best practices across the stroke continuum, evaluating and reporting on the progress of the 11 Ontario Regional Stroke Networks, and translating and exchanging knowledge. Currently the OSN is collaborating with Health Quality Ontario and the
Ontario Ministry of Health and Long-Term Care (MOHLTC) to advise on stroke quality-based procedures (QBPs), as well as implementation of, monitoring and impact on system performance.
Effective April 1, 2016, the Ontario Stroke Network (OSN) and Cardiac Care Network of Ontario (CCN) have come together as a single entitya to ensure a comprehensive and integrated approach to cardiac, vascular and stroke care in Ontario. The OSN and CCN are funded by the MOHLTC.
Institute for Clinical Evaluative Sciences
Established in 1992, the Institute for Clinical Evaluative Sciences (ICES) is an independent not-for- profit corporation with an international reputation as a trusted source of high-quality health and health services research and evidence.
ICES researchers have access to a vast and secure array of Ontario’s health-related data, including population-based health surveys, anonymous patient records, and clinical and administrative databases. ICES’ unbiased evidence provides measures of health
system performance, a clearer understanding of the shifting health care needs of Ontarians, and a stimulus for discussion of practical solutions to optimize scarce resources. ICES research and reports influence the development, implementation and evaluation of health policy and the delivery of health care.
Key to ICES’ work is its ability to link population-based health information, at the patient level, in a way that ensures the privacy and confidentiality of personal health information. Linked databases reflecting 13 million of 34 million Canadians allow researchers to follow patient populations through diagnosis and treatment, and to evaluate outcomes. ICES goes to great lengths to protect privacy and is recognized as an international leader in maintaining the security of health information.
ICES receives core funding from the Ontario Ministry of Health and Long-Term Care. In addition, ICES scientists and staff have highly successful track records competing for peer-reviewed grants from federal agencies, such as the Canadian Institutes of Health Research, and from provincial and international funding bodies.
a The identity of the integrated organization had not been publically announced at the time of publication.
ONTARIO AND LHIN 2015/16 STROKE REPORT CARDS AND PROGRESS REPORTS
Institute for Clinical Evaluative Sciencesvi
Contents
ii Publication Informationiii Authors' Affiliationsiv Acknowledgementsv About the Organizations
Involved in this Report
1 EXECUTIVE SUMMARY
5 INTRODUCTION
7 ABOUT THIS REPORT 8 Performance Indicators9 Colour Banding for Performance
10 METHODS11 Acute Care Institutional Resource Inventory11 Stroke Cohort 11 Indicator Analysis12 Performance Analysis12 Provincial Benchmarks12 High Performers and Greatest Improvement
13 RESULTS14 Acute Care Institutional Resources22 Ontario Stroke Report Cards, Progress Reports and Interpretations
81 REFERENCES
83 APPENDICES84 Appendix A Indicator Definitions, Calculations and Data Sources86 Appendix B Contact Information for
High-Performing Facilities and Sub-LHINs87 Appendix C Glossary
Institute for Clinical Evaluative Sciences 1
ONTARIO AND LHIN 2015/16 STROKE REPORT CARDS AND PROGRESS REPORTS
Since 2011, the Ontario Stroke Network’s annual stroke report cards and progress reports have been a key resource for Ontario’s 11 Regional Stroke Networks. The information they provide drives system change and allows for consistent planning across the province.
This 2017 report marks the seventh edition of the provincial and Local Health Integration (LHIN) report cards, capturing data from 2012/13 to 2015/16. The quality of stroke care continues to improve in Ontario. Compared to 2014/15 performance:
• The proportion of stroke and TIA (transient ischemic attack) patients receiving stroke unit care increased from 32.5% in 2014/15 to 43.3%
in 2015/16, with increases in the number of stroke units from 21 in 2014/15 to 28 by March 31, 2016.
• The time from acute stroke onset (excluding TIA) to admission to inpatient rehabilitation decreased from a median of 9.0 days in 2014/15 to 8.0 days in 2015/16, and more patients are meeting recommended length of stay (LOS) targets.
• The proportion of ischemic stroke inpatients who received carotid imaging, to detect potential causes of stroke and assess their eligibility for preventative interventions, increased from 79.0% in 2014/15 to 81.8% in 2015/16.
• The 30-day readmission rate for stroke/TIA decreased from 8.0% in 2014/15 to 7.1% in 2015/16. The Waterloo Wellington LHIN had the greatest one-year improvement (2.6% decrease), followed by the North West LHIN (1.5% decrease).
The report includes a comprehensive annual update on the acute stroke infrastructure in Ontario. Stroke is a time-sensitive condition with two key hyperacute interventions, endovascular therapy (EVT) and acute thrombolytic therapy (tPA), to restore blood flow to the brain. In 2015/16, Ontario had eight hospitals offering EVT and tPA. A recent Ontario Health Technology Advisory Committee (OHTAC) review
Executive Summary
ONTARIO AND LHIN 2015/16 STROKE REPORT CARDS AND PROGRESS REPORTS

ONTARIO AND LHIN 2015/16 STROKE REPORT CARDS AND PROGRESS REPORTS
Institute for Clinical Evaluative Sciences2
of EVT considered mechanical thrombectomy to be a cost-effective intervention, and recommended public funding of EVT for eligible patients with acute ischemic stroke in selected stroke centres identified by the Ontario Stroke Network (OSN).1
The delivery of tPA for ischemic stroke also offers significant benefit to select stroke patients. In 2015/16, there were 44 Ontario hospitals that provided tPA on a 24/7 basis,c resulting in 12.4% of ischemic stroke patients in Ontario receiving tPA. This is a significant improvement from 11.7% in the previous three-year period (2012/13–2014/15) and is considered to be the minimum intravenous tPA utilization rate to have an impact on disability at a population level.2
Stroke unit care is associated with better patient outcomes,3 and it is encouraging that the proportion of stroke patients receiving stroke unit care increased from 32.5% in 2014/15 to 43.3% in 2015/16. Seven more stroke units were established in 2015/16, resulting in 28 acute hospitals in Ontario providing stroke unit care.b The collaborative efforts of the Regional Stroke Networks and the LHINs resulted in significant improvements across most LHINs and are the main drivers for this provincial change.
Acute hospitals admitting stroke patients routinely provide early assessment of rehabilitation needs using the AlphaFIM tool. There was a one-day decrease in the time patients needing inpatient rehabilitation begin therapy to achieve their rehabilitation goals, from a median of 9.0 in 2014/15
to 8.0 in 2015/16. Rehabilitation in the outpatient setting is recommended for patients with stroke whose AlphaFIM score is greater than 80,4 and while 71.7% of those patients were discharged home in 2015/16, a lack of available data prevents an accurate evaluation of the provision of outpatient rehabilitation for them.
Almost three out of four ischemic stroke/TIA inpatients (74.2%) with atrial fibrillation had their secondary prevention medication filled within 90 days of discharge from acute stroke care, which represents a four percent increase from the previous three-year performance and from what was reported in Ontario almost two decades ago.5 Similarly, nearly three out of four ischemic stroke/TIA patients (73.9%) not admitted to hospital were referred to stroke secondary prevention clinics. However, lack of clinic data prevents an assessment of access and care provided.
The proportion of stroke/TIA patients arriving at the emergency department (ED) by ambulance (58.0%), an important metric of public awareness, plateaued. This means that more than one out of every three stroke patients are not arriving at the ED by ambulance, which emphasizes the need for further efforts to improve public awareness of stroke signs and symptoms and the need to call 911. These efforts are becoming increasingly important as access to EVT improves. The rate of inpatient admission for stroke/TIA remained stable (1.3 per 1,000 population), which suggests that further work is
needed to examine the ambulatory care management of patients with TIAs and non-disabling strokes.
Despite improvements, Ontario’s stroke report card identified wide variation across the province in delivering best practices on many indicators, which means that people receive different quality of care depending on where they live or receive that care. For example, 2.6% of stroke patients residing in the North East LHIN had access to stroke unit care in 2015/16 compared to 80.6% of stroke patients living in the Waterloo Wellington LHIN. Additionally, Ontario’s stroke rehabilitation sector is under pressure to provide the 180 minutes per day of direct therapy that is recommended by stroke quality-based procedures (QBPs).4 In 2015/16, the median was only 62.6 minutes/day.
b A stroke unit is a geographical unit with identifiable co-located beds (e.g., 5A-7, 5A-8, 5A-9, 5A-10) that are occupied by stroke patients 75% of the time and have a dedicated interprofessional team with expertise in stroke care including, at a minimum, nursing, physiotherapy, occupational therapy and speech-language pathology.
c The use of Telestroke, through Criticall and the Ontario Telemedicine Network, allows 25 of these sites to achieve 24/7 access to stroke expertise for advising on tPA.

Institute for Clinical Evaluative Sciences 3
ONTARIO AND LHIN 2015/16 STROKE REPORT CARDS AND PROGRESS REPORTS
In summary, the report cards and progress reports revealed that Ontario’s stroke system is continuing to improve the delivery of best practice care and the benchmarks for high quality care are being set higher in the absence of financial incentives.
It is estimated that if all LHINs performed at benchmark levels:
• 6,171 more patients would have access to stroke unit care,
• 764 more patients would receive tPA, and
• 844 more severe stroke patients would have access to inpatient rehabilitation.
In 2017/18 the OSN will have a greater focus on implementation of QBP recommendations for management of TIA, community-based rehabilitation and EVT. In addition, the OSN will continue to work with the Ministry of Health and Long-Term Care and the Canadian Institute for Health Information to develop a sustainable data collection and data quality strategy for stroke. This strategy will inform report card indicators that include EVT, and support the work of the Rehabilitative Care Alliance in addressing availability of outpatient rehabilitation data. Finally, the OSN will continue to lead a project to identify sustainable and efficient data collection for clinic- based, high-risk TIA and secondary stroke prevention management.

ONTARIO AND LHIN 2015/16 STROKE REPORT CARDS AND PROGRESS REPORTS
Institute for Clinical Evaluative Sciences4

Institute for Clinical Evaluative Sciences 5
ONTARIO AND LHIN 2015/16 STROKE REPORT CARDS AND PROGRESS REPORTS
Introduction
ONTARIO AND LHIN 2015/16 STROKE REPORT CARDS AND PROGRESS REPORTS
In 2009, the Ontario Stroke Network (OSN) commissioned stakeholder consultations to assist the Stroke Evaluation Quality Committee (SEQC) in creating an effective tool for communicating the status of the OSN to its key stakeholders. Based on the results of these consultations, in which stakeholders indicated their preference for a concise reporting mechanism, the SEQC created one provincial and 14 Local Health Integration Network (LHIN) report cards in 2011. The Ontario report card presents a provincial overview of the quality of stroke care across the care continuum that identifies where the system is working well and where improvements are needed.
Through a series of internal reviews, and using the Canadian Stroke Strategy's Performance Measurement Manual,6 the SEQC identified 20 key indicators for the report cards; seven population-based and thirteen facility-based. These indicators were considered integral to system efficiency and effectiveness. The report cards serve as a valuable stakeholder tool that facilitates consistent planning across Ontario’s 11 Regional Stroke Networks, and the implementation of Quality-Based Procedures (QBPs).4
In 2015, the SEQC developed a progress report for each LHIN. In contrast to the report cards, where LHIN performance is compared to provincial high
performers, the progress reports evaluate each LHIN's progress in achieving best practice by comparing their current year performance to their previous three-year performance.
The Knowledge Translation and Implementation Subcommittee of the SEQC also established a report card dissemination strategy—an active knowledge translation strategy to increase awareness of stroke system initiatives and pique the interest of funders in monitoring the system and targeting gaps.

ONTARIO AND LHIN 2015/16 STROKE REPORT CARDS AND PROGRESS REPORTS
Institute for Clinical Evaluative Sciences6
The strategy includes:
• An individualized interpretation of the report card to enable system improvement within each LHIN.
• OSN distribution of report cards and interpretations to the CEO and board chair of each LHIN.
• Scheduled meetings between regional directors and LHIN representatives to review report card data.
• The development of quality improvement plans.
The annual report cards and progress reports are the foundation of the OSN's active knowledge exchange and stroke best practice implementation strategy. The Knowledge Translation and Implementation Subcommittee of the SEQC reviews the indicators every year to assess data availability, system impact and the knowledge translation strategy.
The collaborative process between the 11 Regional Stroke Networks and the LHINs has resulted in ongoing improvements in access to and delivery of stroke best practices for Ontarians. In addition, the OSN conducts an annual inventory to provide a snapshot of the stroke-related, acute care infrastructure across the province.
Institute for Clinical Evaluative Sciences 7
ONTARIO AND LHIN 2015/16 STROKE REPORT CARDS AND PROGRESS REPORTS
About This Report
ONTARIO AND LHIN 2015/16 STROKE REPORT CARDS AND PROGRESS REPORTS
This 2017 report marks the seventh edition of the provincial and LHIN report cards, capturing data from 2012/13 to 2015/16. Changes to this year’s report cards and progress reports include:
1. Two new indicators have been added.
• Proportion of ischemic stroke/TIA patients discharged from the emergency department and referred to secondary prevention services (Indicator 9).
• Proportion of acute stroke patients with mild disability (AlphaFIM > 80) discharged home (Indicator 12).
2. Data is now available for measuring the amount of daily, one-on-one therapy that stroke patients receive during inpatient rehabilitation (Indicator 14).
3. Calculations have been revised for the proportion of ischemic stroke/TIA patients aged 65 and older with atrial fibrillation who filled a prescription for anticoagulant therapy within 90 days of discharge from acute care (Indicator 4).
4. The provincial benchmark reported for each indicator is the best between 2013/14 and 2015/16.

ONTARIO AND LHIN 2015/16 STROKE REPORT CARDS AND PROGRESS REPORTS
Institute for Clinical Evaluative Sciences8
Performance Indicators
The 20 indicators on the report cards and progress reports cross the care continuum and cover access, effectiveness, efficiency and integration domains. Appendix A provides indicator calculations and data sources, including the risk-adjustment mortality model for Indicator 3.
Performance was analyzed at the facility, sub-LHIN, LHIN and provincial level. The minimum and maximum performance was also included for each indicator. The provincial report card includes the range of performance results across the 14 LHINs, and each LHIN report card includes the range of performance within the LHIN (facilities or sub-LHINs).
Provincial benchmarks were calculated using the Achievable Benchmarks of Care (ABC) methodology,7 which summarizes the performance among the highest performing facilities or sub-LHINs representing at least 20% of all patients eligible for the appropriate care.
Indicator No.
Care Continuum Category Domain Definition
1 Public Awareness and Patient Education Access Proportion of stroke/transient ischemic attack (TIA) patients who arrived at the emergency department
(ED) by ambulance
2 Prevention of Stroke Effectiveness Annual age- and sex-adjusted inpatient admission rate for stroke/TIA (per 1,000 population)
3 Prevention of Stroke Effectiveness Risk-adjusted stroke/TIA mortality rate at 30 days (per 100 patients)
4 Prevention of Stroke Effectiveness Proportion of ischemic stroke/TIA inpatients aged 65 and older with atrial fibrillation who filled a prescription for anticoagulant therapy within 90 days of discharge from acute care
5 Prevention of Stroke Access Proportion of ischemic stroke inpatients who received carotid imaging
6 Acute Stroke Management Efficiency Median door-to-needle time among patients who received acute thrombolytic therapy (tPA) (minutes)
7 Acute Stroke Management Access Proportion of ischemic stroke patients who received tPA
8 Acute Stroke Management Effectiveness Proportion of stroke/TIA patients treated on a stroke unit at any time during their inpatient stay
(Health Service Accountability Agreement indicator)
9 Prevention of Stroke Effectiveness Proportion of ischemic stroke/TIA patients discharged from the ED and referred to secondary prevention services
10 Acute Stroke Management Efficiency Proportion of alternate level of care (ALC) days to total length of stay (LOS) in acute care
11 Acute Stroke Management Integration Proportion of acute stroke (excluding TIA) patients discharged from acute care and admitted to
inpatient rehabilitation
12 Stroke Rehabilitation Efficiency Proportion of acute stroke (excluding TIA) patients with mild disability (AlphaFIM > 80) discharged home
13 Stroke Rehabilitation Efficiency Median number of days between stroke (excluding TIA) onset and admission to stroke inpatient rehabilitation
14 Stroke Rehabilitation Effectiveness Median number of minutes per day of direct therapy received by inpatient stroke rehabilitation patients
15 Stroke Rehabilitation Efficiency Proportion of inpatient stroke rehabilitation patients achieving rehabilitation patient group (RPG) active length of stay (LOS) target
16 Stroke Rehabilitation Efficiency Median FIM efficiency for moderate stroke in inpatient rehabilitation
17 Stroke Rehabilitation Access Mean number of CCAC visits provided to stroke patients on discharge from inpatient acute care or inpatient rehabilitation in 2014/15–2015/16
18 Stroke Rehabilitation Access Proportion of patients admitted to inpatient rehabilitation with severe stroke (RPG 1100 or 1110)
19 System Integration Integration Proportion of stroke/TIA patients discharged from acute care to LTC/CCC (excluding patients originating from LTC/CCC)
20 System Integration Integration Age- and sex-adjusted readmission rate at 30 days for patients with stroke/TIA for all diagnoses (per 100 patients)

Institute for Clinical Evaluative Sciences 9
ONTARIO AND LHIN 2015/16 STROKE REPORT CARDS AND PROGRESS REPORTS
Colour Banding for Performance
Report Cards
Green, yellow and red colour bands were used to distinguish levels of regional performance relative to the benchmark for each indicator. Green bands indicate exemplary performance (benchmark achieved or within 5% of the benchmark), yellow bands represent acceptable performance (at or above the 50th percentile and greater than 5% absolute or relative difference from the benchmark), and red bands indicate poor performance (below the 50th percentile). Sub-LHINs or facilities and LHINs with the highest performance in the 2015/16 fiscal year were identified, where possible, for each report card indicator, in order to highlight achievements made across the province, facilitate dialogue among regions and drive system improvement.
Progress Reports
Teal, purple and coral colour bands were used to distinguish degrees of provincial/LHIN progress from the previous three-year average performance for each indicator. Teal bands indicate that the province/LHIN was progressing well (statistically significant improvement), purple bands indicate progress (improving performance but not statistically significant), and coral bands indicate no progress (no change or performance decline). Sub-LHINs or facilities and LHINs with the greatest change in performance in 2015/16 from the previous three years were identified for each indicator on the progress report.

ONTARIO AND LHIN 2015/16 STROKE REPORT CARDS AND PROGRESS REPORTS
Institute for Clinical Evaluative Sciences10
Methods
ONTARIO AND LHIN 2015/16 STROKE REPORT CARDS AND PROGRESS REPORTS
10 Institute for Clinical Evaluative Sciences
Institute for Clinical Evaluative Sciences 11
ONTARIO AND LHIN 2015/16 STROKE REPORT CARDS AND PROGRESS REPORTS
Acute Care Institutional Resource Inventory
As in previous years, the OSN conducted an inventory to quantify the distribution of key health system resources needed to implement stroke best practices in Ontario. Inventories were distributed to the regional directors at each of the 11 Regional Stroke Networks, who were asked to report on the locations of stroke units and secondary prevention clinics, diagnostic imaging capability (CT, MRI, CTA, MRA), thrombolysis and EVT capacity, in the acute hospitals of their respective regions.
Stroke Cohort
Stroke cohorts for adults aged 18 and older were generated from administrative databases held at the Institute for Clinical Evaluative Sciences, using codes from the International Classification of Diseases, 10th Revision, Canada (ICD-10-CA). These codes included: G45 (excluding G45.4), H34.0, H34.1, I60 (excluding I60.8), I61, I63 (excluding I63.6) and I64. The most responsible or main problem diagnosis was used to identify stroke and TIA records for adults aged 18 and older in the Discharge Abstract Database (DAD) and the National Ambulatory Care Reporting System (NACRS) database, respectively.
Only unique patients for each 12-month period, from April 1 to March 31, were included. Community Care Access Centre data were based on patient visits, and multiple patient visits were included if they occurred in different LHINs. Patients considered palliative (ICD-10-CA, code Z51.5 with prefix 8) as part of their initial treatment plan were excluded. Stroke inpatient rehabilitation patients, classified as RCG-1 and without a readmission within the same day, were included.
Indicator Analysis
Most indicators reflect the proportion of patients receiving a care or service among all patients expected to receive that care or service, and are reported as percentages. Indicators are reported at LHIN levels. Seven of the indicators are population-based (Indicators 1, 2, 4, 7, 8, 11, 19). The remaining indicators (Indicators 3, 5, 6, 9, 10, 12–18, 19) are facility-based (i.e., they examine how well the facilities in a given LHIN performed on various indicators). Time-based indicators are reported as median values. The median time is the time required for half of the patients to receive a given service (e.g., inpatient rehabilitation; Indicators 13, 14). The mean is the sum of all services divided by the number of patients receiving services (e.g., CCAC rehabilitation services; Indicator 17).
For admission rates, direct standardization was used to compare rates between regions, as if they had similar population compositions. Direct
standardized rates were calculated using the 2003/04 Ontario adult population (aged 18 and older) to examine provincial and regional rates over time. Indirect standardization was used to calculate the performance of readmission and mortality rates. Readmission rate represents patients who survived the initial emergency department (ED) visit or hospitalization, but were readmitted to hospital at least once within 30 days of the index visit or admission. An age-sex regression model was used to calculate an expected revisit/readmission rate for each region; the crude (observed) rate for each region was divided by the expected rate and multiplied by the annual Ontario rate to provide the age- and sex-adjusted rate. For progress reports, the same approach was used except that the ratio of the observed to expected rate was multiplied by the overall previous three-year LHIN rate. Readmission rate is a good indicator of whether there was appropriate discharge planning to prevent secondary complications or another stroke or TIA event.
Thirty-day mortality rates relate to patients who were alive when they arrived at the ED and admitted to hospital. A risk-adjusted regression model was used to calculate an expected mortality rate for each region; the crude (observed) rate for each region was divided by the expected rate and multiplied by the overall annual Ontario rate to provide the risk- adjusted mortality rate. For progress reports, the same approach was used except that the ratio of the observed to expected rate was multiplied by the overall previous three-year LHIN rate. Further details on the risk-adjustment model are found in Appendix A.

ONTARIO AND LHIN 2015/16 STROKE REPORT CARDS AND PROGRESS REPORTS
Institute for Clinical Evaluative Sciences12
Performance Analysis
Statistically significant differences in performance were determined by comparing the current year’s performance to the combined average performance for the previous three years; using a chi-square test for categorical variables, and a Wilcoxon rank-sum test and T-test for continuous variables. For calculating mortality and readmission rates bootstrapping 200 times was used to generate a standard error around the estimates, to assess statistical significance of the difference between the current risk-adjusted rate and the overall combined risk-adjusted rate for the previous three years.
Provincial Benchmarks
Provincial benchmarks are provided for each indicator and represent the top benchmark achieved between 2013/14 and 2015/16. Benchmarks were calculated using the Achievable Benchmarks of Care (ABC) methodology 7:
1. Care providers (facilities or sub-LHINs) were ranked in descending order of performance on the indicator.
2. Beginning with the highest-performing care provider, the providers were added until at least 20% of the total number of patients were represented (in the denominator). It is important to note that low values are desired for Indicators 2, 3, 6, 10, 13, 19 and 20.
3. The benchmark was calculated using only the providers selected in step 2 (20%), by dividing the total number of patients who received appropriate care by the total number of patients eligible for that care in the subset.
To ensure that high-performing care providers with low numbers of patients did not unduly influence the benchmark rates, the performance results of facilities or sub-LHINs with small sample sizes and high performance levels were adjusted, and rank order was based on the adjusted performance results. The benchmarks were calculated by ranking sub-LHIN performance, not facility performance, for population-based indicators (Indicators 1, 2, 4, 7, 8, 11, 19). Benchmarks for Indicators 3 and 20 (mortality and readmission rates) were not included because the current risk-adjustment models do not adequately capture stroke severity; a key predictor of stroke outcomes.8 Benchmarks for Indicators 12 and 14 will be reported with more years of data as data quality improves.
High Performers and Greatest Improvement
To be considered a high performer (report card) or to have had the greatest improvement (progress report), acute care facilities had to have annual volumes of more than 100 stroke/TIA patients per year, and rehabilitation facilities had to have sample sizes greater than the median number of patients admitted to inpatient rehabilitation in that year (approximately 50 patients each year). High-performing sub-LHINs had to have at least 30 stroke/TIA patients for each indicator. The two highest-performing LHINs for each indicator were also identified. These LHINs had performance rates within 5% of the provincial benchmark, with the exception of Indicators 2, 3 and 20, for which the highest-performing LHIN had a performance rate that was lower than the provincial average by a statistically significant amount. For some indicators, no single LHIN had exemplary performance; in these cases, no LHINs were identified. This was not unexpected, as each LHIN’s performance is an aggregate of the performance results of all facilities in the LHIN. The two LHINs with the greatest change and statistically significant performance compared to the three-year average were identified on the progress report.

Institute for Clinical Evaluative Sciences 13
ONTARIO AND LHIN 2015/16 STROKE REPORT CARDS AND PROGRESS REPORTSONTARIO AND LHIN 2015/16 STROKE REPORT CARDS AND PROGRESS REPORTS
Institute for Clinical Evaluative Sciences 13
Results

ONTARIO AND LHIN 2015/16 STROKE REPORT CARDS AND PROGRESS REPORTS
Institute for Clinical Evaluative Sciences14
Acute Care Institutional Resources

Institute for Clinical Evaluative Sciences 15
ONTARIO AND LHIN 2015/16 STROKE REPORT CARDS AND PROGRESS REPORTS
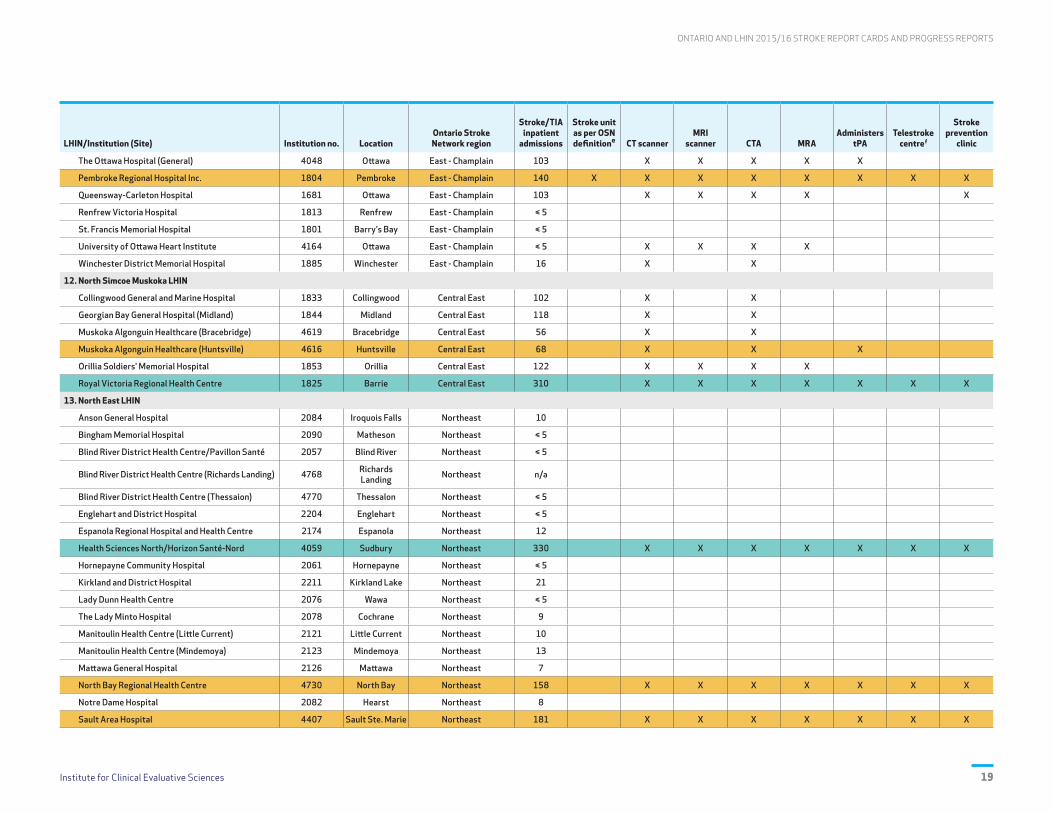
EXHIBIT 1 Acute Care Institutional Resources for Stroke/TIA in Ontario, 2015/16d
LegendRegional stroke centre A facility that meets all the requirements of a district stroke centre, plus neurosurgical facilities and interventional radiology.
District stroke centre A facility with written stroke protocols (e.g., transport and triage, thrombolytic therapy, neuroimaging), clinicians with stroke expertise, and linkages to rehabilitation and secondary prevention.
Non-designated An acute care hospital that does not fit the definition of district or regional stroke centre.
LHIN/Institution (Site) Institution no. LocationOntario Stroke Network region
Stroke/TIA inpatient
admissions
Stroke unit as per OSN definitione CT scanner
MRI scanner CTA MRA
Administers tPA
Telestroke centref
Stroke prevention
clinic
Ontario, n 170 17,602 28 95 62 76 52 44 25 45
1. Erie St. Clair LHIN
Bluewater Health (Sarnia) 4415 Sarnia Southwestern Ontario 174 X X X X X X X X
Bluewater Health (Charlotte Eleanor Englehart) 4418 Petrolia Southwestern Ontario 8
Chatham-Kent Health Alliance (Chatham) 1223 Chatham Southwestern Ontario 206 X X X X X X X
Chatham-Kent Health Alliance (Sydenham) 1239 Wallaceburg Southwestern Ontario n/a
Leamington District Memorial Hospital 1067 Leamington Southwestern Ontario 46 X X
Windsor Regional Hospital (Metropolitan) 1079 Windsor Southwestern Ontario 102 X X X X
Windsor Regional Hospital (Ouellette Campus) 4773 Windsor Southwestern Ontario 429 X X X X Xg X
2. South West LHIN
Alexandra Hospital 1696 Ingersoll Southwestern Ontario 12
Alexandra Marine and General Hospital 1206 Goderich Southwestern Ontario 39 X X X X
Four Counties Health Services Corporation 1507 Newbury Southwestern Ontario 10
Grey Bruce Health Services (Lion's Head) 1030 Lion's Head Southwestern Ontario ≤ 5
Grey Bruce Health Services (Markdale) 4025 Markdale Southwestern Ontario 7
Grey Bruce Health Services (Meaford) 4027 Meaford Southwestern Ontario 9
Grey Bruce Health Services (Owen Sound) 3944 Owen Sound Southwestern Ontario 192 X X X X X X X X
Grey Bruce Health Services (Southampton) 4030 Southampton Southwestern Ontario ≤ 5
Grey Bruce Health Services (Wiarton) 4033 Wiarton Southwestern Ontario n/a
Hanover and District Hospital 1124 Hanover Southwestern Ontario 21
Huron Perth Healthcare Alliance (Clinton) 1199 Clinton Southwestern Ontario ≤ 5
Huron Perth Healthcare Alliance (Seaforth) 1213 Seaforth Southwestern Ontario ≤ 5
Huron Perth Healthcare Alliance (St. Marys) 1748 St. Marys Southwestern Ontario ≤ 5
Huron Perth Healthcare Alliance (Stratford) 1754 Stratford Southwestern Ontario 148 X X X X X X
Listowel Memorial Hospital 1740 Listowel Southwestern Ontario 14
London Health Sciences Centre (University) 3850 London Southwestern Ontario 734 X X X X X Xg X
London Health Sciences Centre (Victoria) 4359 London Southwestern Ontario n/a X X X X X

ONTARIO AND LHIN 2015/16 STROKE REPORT CARDS AND PROGRESS REPORTS
Institute for Clinical Evaluative Sciences16
LHIN/Institution (Site) Institution no. LocationOntario Stroke Network region
Stroke/TIA inpatient
admissions
Stroke unit as per OSN definitione CT scanner
MRI scanner CTA MRA
Administers tPA
Telestroke centref
Stroke prevention
clinic
South Bruce Grey Health Centre (Chesley) 4042 Chesley Southwestern Ontario ≤ 5
South Bruce Grey Health Centre (Durham) 4036 Durham Southwestern Ontario 6
South Bruce Grey Health Centre (Kincardine) 3907 Kincardine Southwestern Ontario 23
South Bruce Grey Health Centre (Walkerton) 4039 Walkerton Southwestern Ontario 16 X X
South Huron Hospital 1203 Exeter Southwestern Ontario 16
St. Joseph's Health Care London 1497 London Southwestern Ontario n/a X X X
St. Thomas-Elgin General Hospital 1059 London Southwestern Ontario 103 X X
Strathroy Middlesex General Hospital 1515 Strathroy Southwestern Ontario 47 X
Tillsonburg District Memorial Hospital 1709 Tillsonburg Southwestern Ontario 58 X
Wingham and District Hospital 1217 Wingham Southwestern Ontario 20
Woodstock General Hospital 1716 Woodstock Southwestern Ontario 80 X X X X
3. Waterloo Wellington LHIN
Cambridge Memorial Hospital 1905 Cambridge Central South 15 X X
Grand River Hospital (Kitchener-Waterloo) 3734 Kitchener Central South 611 X X X X X X X X
Groves Memorial Community Hospital 1936 Fergus Central South 18 X
Guelph General Hospital 1946 Guelph Central South 313 X X X X X X X
North Wellington Health Care (Louise Marshall) 4323 Mount Forest Central South 12
North Wellington Health Care (Palmerston and District) 4326 Palmerston Central South 8
St. Mary's General Hospital 1921 Kitchener Central South 35 X
4. Hamilton Niagara Haldimand Brant LHIN
Brant Community Health Care System (Brantford) 4675 Brantford Central South 327 X X X X X X X X
Brant Community Health Care System (Willet) 4680 Paris Central South n/a
Haldimand War Memorial Hospital 1146 Dunnville Central South 15 X
Hamilton Health Sciences Corp. (General) 1982 Hamilton Central South 749 X X X X X Xg X
Hamilton Health Sciences Corp. (Juravinski) 1983 Hamilton Central South 121 X X X X
Hamilton Health Sciences Corp. (West End) 4737 Hamilton Central South n/a
Joseph Brant Hospital 1160 Burlington Central South 204 X X X X X
Niagara Health System (Douglas Memorial) 4210 Fort Erie Central South n/a
Niagara Health System (Greater Niagara) 4213 Niagara Falls Central South 337 X X X X X X X X
Niagara Health System (Port Colborne) 4219 Port Colborne Central South n/a
Niagara Health System (St. Catharines General) 4224 St. Catharines Central South 206 X X X X
Niagara Health System (Welland County) 4227 Welland Central South 68 X X X
Norfolk General Hospital 1591 Simcoe Central South 16 X X
St. Joseph's Health Care System (Hamilton) 2003 Hamilton Central South 121 X X X X

Institute for Clinical Evaluative Sciences 17
ONTARIO AND LHIN 2015/16 STROKE REPORT CARDS AND PROGRESS REPORTS
LHIN/Institution (Site) Institution no. LocationOntario Stroke Network region
Stroke/TIA inpatient
admissions
Stroke unit as per OSN definitione CT scanner
MRI scanner CTA MRA
Administers tPA
Telestroke centref
Stroke prevention
clinic
West Haldimand General Hospital 1149 Hagersville Central South ≤ 5
West Lincoln Memorial Hospital 4788 Grimsby Central South 21
5. Central West LHIN
Headwaters Health Care Centre (Dufferin) 3684 Orangeville West GTA 87 X
William Osler Health System (Brampton) 4681 Brampton West GTA 409 X X X X Xh
William Osler Health System (Etobicoke) 3929 Etobicoke West GTA 240 X X X X Xh
6. Mississauga Halton LHIN
Halton Healthcare Services (Georgetown) 4622 Georgetown West GTA 59
Halton Healthcare Services (Milton) 4022 Milton West GTA 60 X
Halton Healthcare Services (Oakville) 3926 Oakville West GTA 157 X X X X X
Trillium Health Partners (Mississauga) 4752 Mississauga West GTA 839 X X X X X Xg X
Trillium Health Partners (Queensway) 4759 Toronto West GTA n/a X
Trillium Health Partners (Credit Valley) 4747 Mississauga West GTA 315 X X X X X
7. Toronto Central LHIN
Sinai Health System (Mount Sinai) 4804 Toronto Toronto West 97 X X X X
St. Joseph's Health Centre 1443 Toronto Toronto West 186 X X X X X
St. Michael's Hospital 1444 Toronto Toronto - Southeast 452 X X X X X Xg X
Sunnybrook Health Sciences Centre 3936 Toronto Toronto - North and East 607 X X X X X Xg Xi
Michael Garron Hospital 1302 Toronto Toronto - Southeast 173 X X X
University Health Network (Toronto General) 3910 Toronto Toronto West n/a X X X X
University Health Network (Toronto Western) 3910 Toronto Toronto West 631 X X X X X Xg Xi
8. Central LHIN
Humber River Hospital (Wilson) 4799 Weston Toronto West 128 X X X X X X
Humber River Regional Hospital (Church) j 3883 Weston Toronto West 106 X X X X X
Humber River Regional Hospital (Finch) j 1343 Downsview Toronto West 84 X X X X X
Mackenzie Health (Mackenzie Richmond Hill Hospital) 2046 Richmond Hill Central East 401 X X X X X X
Markham Stouffville Hospital (Markham) 3587 Markham Central East 169 X X X
Markham Stouffville Hospital (Uxbridge) 4465 Uxbridge Central East 18 X X X
North York General Hospital 1330 Toronto Toronto - North and East 278 X X X X X X
Southlake Regional Health Centre 2038 Newmarket Central East 181 X X X
Stevenson Memorial Hospital 1817 Alliston Central East 43 X X
9. Central East LHIN
Campbellford Memorial Hospital 1597 Campbellford Central East 25 X
Haliburton Highlands Health Services (Haliburton) 3737 Haliburton Central East 8 X

ONTARIO AND LHIN 2015/16 STROKE REPORT CARDS AND PROGRESS REPORTS
Institute for Clinical Evaluative Sciences18
LHIN/Institution (Site) Institution no. LocationOntario Stroke Network region
Stroke/TIA inpatient
admissions
Stroke unit as per OSN definitione CT scanner
MRI scanner CTA MRA
Administers tPA
Telestroke centref
Stroke prevention
clinic
Haliburton Highlands Health Services (Minden) 4191 Minden Central East n/a
Lakeridge Health (Bowmanville) 4008 Clarington Central East 20 X X
Lakeridge Health (Oshawa) 3932 Oshawa Central East 432 X X X X X X X X
Lakeridge Health (Port Perry) 4005 Port Perry Central East 17
Northumberland Hills Hospital 3860 Cobourg Central East 64 X X X
Peterborough Regional Health Centre 1768 Peterborough Central East 251 X X X X X X X Xk
Ross Memorial Hospital 1893 Lindsay Central East 95 X X X X
Rouge Valley Health System (Ajax) 4014 Ajax Toronto - Southeast 169 X X X X
Rouge Valley Health System (Centenary) 3943 Scarborough Toronto - Southeast 192 X X X X X Xl
Scarborough Hospital (Birchmount) 4154 Scarborough Toronto - North and East 161 X X X X Xl
Scarborough Hospital (Scarborough General) 4152 Scarborough Toronto - North and East 195 X X X X X Xl
10. South East LHIN
Brockville General Hospital 1273 Brockville South East 97 X X X X
Kingston Health Sciences Centre (Hotel Dieu) 4601 Kingston South East n/a X X
Kingston Health Sciences Centre (Kingston General Hospital) 1100 Kingston South East 417 X X X X X Xg Xi
Lennox and Addington County General Hospital 1295 Napanee South East 8
Perth and Smiths Falls District (Perth) 3732 Perth South East 39 Xm Xm X
Perth and Smiths Falls District (Smith Falls) 1269 Smiths Falls South East 26 Xm Xm
Quinte Healthcare Corp. (Bancroft) 3991 Bancroft South East ≤ 5
Quinte Healthcare Corp. (Belleville) 3988 Belleville South East 288 X X X X X X X X
Quinte Healthcare Corp. (Picton) 3992 Picton South East 7
Quinte Healthcare Corp. (Trenton) 3994 Trenton South East 6 X
11. Champlain LHIN
Almonte General Hospital 1254 Almonte East - Champlain ≤ 5
Arnprior and District Memorial Hospital 1799 Arnprior East - Champlain 14
Carleton Place and District Memorial Hospital 1256 Carleton Place East - Champlain 8
Cornwall Community Hospital 4451 Cornwall East - Champlain 114 X X X X X X X
Deep River and District Hospital 1803 Deep River East - Champlain ≤ 5
Glengarry Memorial Hospital 1870 Alexandria East - Champlain 6
Hawkesbury and District General Hospital 1777 Hawkesbury East - Champlain 49 X X X X
Hôpital Montfort 1661 Ottawa East - Champlain 89 X X X X
Kemptville District Hospital 1284 Kemptville East - Champlain ≤ 5
The Ottawa Hospital (Civic) 4046 Ottawa East - Champlain 721 X X X X Xg X
Institute for Clinical Evaluative Sciences 19
ONTARIO AND LHIN 2015/16 STROKE REPORT CARDS AND PROGRESS REPORTS
LHIN/Institution (Site) Institution no. LocationOntario Stroke Network region
Stroke/TIA inpatient
admissions
Stroke unit as per OSN definitione CT scanner
MRI scanner CTA MRA
Administers tPA
Telestroke centref
Stroke prevention
clinic
The Ottawa Hospital (General) 4048 Ottawa East - Champlain 103 X X X X X
Pembroke Regional Hospital Inc. 1804 Pembroke East - Champlain 140 X X X X X X X X
Queensway-Carleton Hospital 1681 Ottawa East - Champlain 103 X X X X X
Renfrew Victoria Hospital 1813 Renfrew East - Champlain ≤ 5
St. Francis Memorial Hospital 1801 Barry's Bay East - Champlain ≤ 5
University of Ottawa Heart Institute 4164 Ottawa East - Champlain ≤ 5 X X X X
Winchester District Memorial Hospital 1885 Winchester East - Champlain 16 X X
12. North Simcoe Muskoka LHIN
Collingwood General and Marine Hospital 1833 Collingwood Central East 102 X X
Georgian Bay General Hospital (Midland) 1844 Midland Central East 118 X X
Muskoka Algonguin Healthcare (Bracebridge) 4619 Bracebridge Central East 56 X X
Muskoka Algonguin Healthcare (Huntsville) 4616 Huntsville Central East 68 X X X
Orillia Soldiers' Memorial Hospital 1853 Orillia Central East 122 X X X X
Royal Victoria Regional Health Centre 1825 Barrie Central East 310 X X X X X X X
13. North East LHIN
Anson General Hospital 2084 Iroquois Falls Northeast 10
Bingham Memorial Hospital 2090 Matheson Northeast ≤ 5
Blind River District Health Centre/Pavillon Santé 2057 Blind River Northeast ≤ 5
Blind River District Health Centre (Richards Landing) 4768 Richards Landing Northeast n/a
Blind River District Health Centre (Thessaion) 4770 Thessalon Northeast ≤ 5
Englehart and District Hospital 2204 Englehart Northeast ≤ 5
Espanola Regional Hospital and Health Centre 2174 Espanola Northeast 12
Health Sciences North/Horizon Santé-Nord 4059 Sudbury Northeast 330 X X X X X X X
Hornepayne Community Hospital 2061 Hornepayne Northeast ≤ 5
Kirkland and District Hospital 2211 Kirkland Lake Northeast 21
Lady Dunn Health Centre 2076 Wawa Northeast ≤ 5
The Lady Minto Hospital 2078 Cochrane Northeast 9
Manitoulin Health Centre (Little Current) 2121 Little Current Northeast 10
Manitoulin Health Centre (Mindemoya) 2123 Mindemoya Northeast 13
Mattawa General Hospital 2126 Mattawa Northeast 7
North Bay Regional Health Centre 4730 North Bay Northeast 158 X X X X X X X
Notre Dame Hospital 2082 Hearst Northeast 8
Sault Area Hospital 4407 Sault Ste. Marie Northeast 181 X X X X X X X

ONTARIO AND LHIN 2015/16 STROKE REPORT CARDS AND PROGRESS REPORTS
Institute for Clinical Evaluative Sciences20
LHIN/Institution (Site) Institution no. LocationOntario Stroke Network region
Stroke/TIA inpatient
admissions
Stroke unit as per OSN definitione CT scanner
MRI scanner CTA MRA
Administers tPA
Telestroke centref
Stroke prevention
clinic
Sensenbrenner Hospital 2088 Kapuskasing Northeast 11
Service de Santé de Chapleau Health Service 2173 Chapleau Northeast ≤ 5
Smooth Rock Falls Hospital 2094 Smooth Rock Falls Northeast ≤ 5
St. Joseph's General Hospital 2058 Elliot Lake Northeast 22
Temiskaming Hospital 2207 New Liskeard Northeast 36 X X X
Timmins and District General Hospital 3414 Timmins Northeast 101 X X X X X X X
Weeneebayko Area Health Authority 4698 Moose Factory Northeast ≤ 5
West Nipissing General Hospital 2812 Sturgeon Falls Northeast 20
West Parry Sound Health Centre 3729 Parry Sound Northeast 50 X
14. North West LHIN
Atikokan General Hospital 2147 Atikokan Northwest ≤ 5
Dryden Regional Health Centre 2103 Dryden Northwest 21 X X X X
Geraldton District Hospital 2175 Geraldton Northwest ≤ 5
Lake-of-the-Woods District Hospital 2110 Kenora Northwest 26 X X X X X
Manitouwadge General Hospital 2176 Manitouwadge Northwest ≤ 5
McCausland Hospital 2180 Terrace Bay Northwest ≤ 5
Nipigon District Memorial Hospital 2178 Nipigon Northwest n/a
The Red Lake Margaret Cochenour Memorial Hospital 2115 Red lake Northwest 7
Riverside Health Care Facilities (La Verendrye) 2150 Fort Frances Northwest 27 X X X X X
Riverside Health Care Facilities (Rainy River) 2153 Rainy River Northwest ≤ 5
Sioux Lookout Meno-Ya-Win Health Centre (District) 4353 Sioux Lookout Northwest ≤ 5 X X X X X
Thunder Bay Regional Health Sciences Centre 3853 Thunder Bay Northwest 349 X X X X X Xg X
Wilson Memorial General Hospital 2177 Marathon Northwest n/a X
d Based on Ontario Stroke Network's annual acute stroke care resource survey (as of February 2017). Survey includes facilities (e.g., emergency departments, urgent care centres, inpatient care) that had at least one stroke/TIA ED visit or DAD discharge in 2015/16.
e Stroke unit (revised definition, February 2014): A geographical unit with identifiable co-located beds (e.g., 5A-7, 5A-8, 5A-9, 5A-10) that are occupied by stroke patients 75% of the time and have a dedicated interprofessional team with expertise in stroke care including, at a minimum, nursing, physiotherapy, occupational therapy and speech-language pathology.
f Funded Ontario Telemedicine Network site in 2015/16.
g Also provides endovascular therapy (EVT).
h Cardiovascular clinic, not specific to stroke.
i Also has a rapid TIA and minor ischemic stroke clinic.
j Humber Regional Hospital closed Church and Finch sites October 18, 2015 and were consolidated as the new Wilson site. Church and Finch site resources are not counted in the Ontario total.
k Patients from Peterborough Regional Health Centre have access to a stroke prevention clinic through the Peterborough Regional Vascular Health Network.
l Urgent TIA patients have access to the Scarborough Stroke Clinic.
m CT scanner at Smiths Falls site is shared with Perth site (Perth and Smith Falls District).
n/a = not applicable (i.e., no stroke/TIA admissions, or institution does not provide inpatient care).

Institute for Clinical Evaluative Sciences 21
ONTARIO AND LHIN 2015/16 STROKE REPORT CARDS AND PROGRESS REPORTS
Exhibit 1 presents an inventory of Ontario’s acute care institutional resources for stroke/TIA in 2015/16. These resources support stroke best practice delivery, stroke QBP implementation and system planning. Among 170 Ontario institutions, 154 admitted 17,602 stroke/TIA patients, ranging from less than five in some institutions to as many as 839 in others. Sixty percent of admissions were to designated stroke centres, 35% were to regional stroke centres and 25% were to district stroke centres. This represents a four percent increase in the proportion of patients receiving care in a designated stroke centre compared to 2012/13.9 There were 55 hospitals with over 100 admissions, and 84 hospitals with less than 50 admissions. Secondary stroke prevention services were available at 45 sites and four sites offered rapid TIA assessment clinics for rapid access to stroke expertise and diagnostic imaging to potentially avoid hospitalization for TIA patients and those with minor non-disabling ischemic stroke.
Hyperacute stroke care
Stroke is a time-sensitive condition. Hyperacute services are those that are time-dependent and are provided within the first few hours after the onset of stroke symptoms. Until recently, neuroimaging and tissue plasminogen activator (tPA) were recognized as important processes. In 2015/16, 95 hospitals had neuroimaging available; 62 had magnetic resonance imaging (MRI) and 95 had computed tomography (CT). Fourty-four hospitals provided tPA, 25 of which provided tPA with the support of Telestroke service.
Recently, large clinical trials have demonstrated a reduction in mortality of nearly 50%, and a 25% increase in positive outcomes, from a clot retrieval intervention for acute ischemic stroke due to large artery occlusion (compared to standard tPA).10,11
This game-changing intervention, referred to as endovascular treatment (EVT), involves mechanical clot disruption (embolectomy) carried out by a
specialist with neurointerventional expertise, the use of advanced imaging and specialized monitoring after treatment. There were 10 hospitals (admitting an average 593 stroke patients in 2015/16) that provided this highly-specialized procedure; seven of which offered 24/7 access. Advanced carotid imaging, including computed tomography angiography (CTA) or magnetic resonance angiography (MRA), is needed to evaluate patient eligibility for EVT. CTA or MRA was available at 76 hospitals; however, not all sites provided 24/7 access to this hyperacute imaging.
Acute stroke care
Over the past three years, several regional stroke networks have worked with the LHINs to establish and maintain dedicated stroke units as a means of consolidating stroke care in hospitals where there is critical mass. In 2015/16 Ontario had 28 stroke units, compared to 14 in 2012/13.

ONTARIO AND LHIN 2015/16 STROKE REPORT CARDS AND PROGRESS REPORTS
Institute for Clinical Evaluative Sciences22
Ontario Stroke Report Cards, Progress Reports and Interpretations

Institute for Clinical Evaluative Sciences 23
ONTARIO AND LHIN 2015/16 STROKE REPORT CARDS AND PROGRESS REPORTS
ONTARIO STROKE REPORT CARD, 2015/16
Progressing well1 Progressing2 Not progressing3 Limited data
Indicator No. Care Continuum Category Indicator4
Ontario FY 2015/16
(2014/15)
VarianceAcross LHINs
(Min–Max)Provincial
Benchmark5
High Performers6
Sub-LHIN/Facility LHIN
1 Public awareness and patient education Proportion of stroke/TIA patients who arrived at the ED by ambulance 58.0% (58.0%) 48.2–62.7% 65.3% Essex Sub-LHIN 1, 4
2 Prevention of stroke Annual age- and sex-adjusted inpatient admission rate for stroke/TIA (per 1,000 population) 1.3 (1.3) 1.1–1.9 1.1 Ottawa Centre Sub-LHIN 8, 11
3§ Prevention of stroke Risk-adjusted stroke/TIA mortality rate at 30 days (per 100 patients) 11.1 (10.6) 9.8–15.2 - - 11
4 Prevention of strokeProportion of ischemic stroke/TIA inpatients aged 65 and older with atrial fibrillation who filled a prescription for anticoagulant therapy within 90 days of discharge from acute care
74.2% (72.6%) 66.9–79.6% 85.5% South West York Region Sub-LHIN None
5 Prevention of stroke Proportion of ischemic stroke inpatients who received carotid imaging 81.8% (79.0%) 72.5–88.6% 91.7% Bluewater Health, Sarnia 7, 1
6 Acute stroke management Median door-to-needle time among patients who received acute thrombolytic therapy (tPA) (minutes)
50.0 (52.0) 36.5–72.0 33.0 Hamilton Health Sciences Corp., General None
7§ Acute stroke management Proportion of ischemic stroke patients who received acute thrombolytic therapy (tPA) 12.4% (11.9%) 9.0–15.0% 17.7% Hamilton Outer Core Sub-LHIN 11, 4
8§ Acute stroke management Proportion of stroke/TIA patients treated on a stroke unit7 at any time during their inpatient stay 43.3% (32.5%) 2.6–80.6% 78.7% Thunder Bay City Sub-LHIN 3
9 Prevention of stroke Proportion of ischemic stroke/TIA patients discharged from the ED and referred to secondary prevention services
73.9% (70.3%) 38.0–87.6% 94.4% London Health Sciences Centre, University Hospital None
10§ Acute stroke management Proportion of ALC days to total length of stay in acute care 26.8% (26.0%) 14.4–42.8% 8.2% Bluewater Health, Sarnia None
11§ Acute stroke management Proportion of acute stroke (excluding TIA) patients discharged from acute care and admitted to inpatient rehabilitation 35.5% (35.5%) 20.9–45.3% 47.8% Chatham-Kent Sub-LHIN 1
12§ Stroke rehabilitation Proportion of acute stroke (excluding TIA) patients with mild disability (AlphaFIM > 80) discharged home
71.7% (71.5%) 58.9–83.9% - - 14, 12
13§ Stroke rehabilitation Median number of days between stroke (excluding TIA) onset and admission to stroke inpatient rehabilitation 8.0 (9.0) 6.0–15.0 5.0 Southlake Regional Health Centre None
14§ Stroke rehabilitation Median number of minutes per day of direct therapy received by inpatient stroke rehabilitation patients 62.6 (-) 15.3–88.8 - - 3, 8
15§ Stroke rehabilitation Proportion of inpatient stroke rehabilitation patients achieving RPG active length of stay target 63.3% (57.2%) 37.9–84.0% 82.0% St. Joseph’s Health Centre, Guelph 3
16 Stroke rehabilitation Median FIM efficiency for moderate stroke in inpatient rehabilitation 1.1 (1.0) 0.7–1.9 1.5 St. Joseph’s Health Centre, Guelph 12, 3
17 Stroke rehabilitation Mean number of CCAC visits provided to stroke patients on discharge from inpatient acute care or inpatient rehabilitation in 2014/15–2015/16 8.2 (7.3) 5.3–15.0 12.4 Waterloo Wellington CCAC 3, 10
18§ Stroke rehabilitation Proportion of patients admitted to inpatient rehabilitation with severe stroke (RPG 1100 or 1110) 40.8% (41.3%) 31.1–51.2% 58.7% St. Joseph’s Health Centre, Guelph None
19§ Reintegration Proportion of stroke/TIA patients discharged from acute care to LTC/CCC (excluding patients originating from LTC/CCC) 6.4% (7.0%) 3.4–9.3% 2.0% Urban Guelph Sub-LHIN None
20§ Reintegration Age- and sex-adjusted readmission rate at 30 days for patients with stroke/TIA for all diagnoses (per 100 patients) 7.1 (8.0) 6.6–8.5 - - None
Hospital Service Accountability Agreement indicators, 2015/16 – Data not available § Contributes to QBP performance
1 Statistically significant improvement.
2 Performance improving but not statistically significant.
3 No change or performance decline.
4 Facility-based analysis (excluding Indicators 1, 2, 4, 7, 8, 11 and 19) for patients aged 18–108. Indicators are based on CIHI data. Low rates are desired for Indicators 2, 3, 6, 10, 13, 19 and 20.
5 Top benchmark achieved between 2013/14 and 2015/16. Benchmarks were calculated using the ABC methodology (Weissman NW et al. J Eval Clin Pract. 1999; 5(3):269–81) on sub-LHIN or facility data.
6 Sub-LHIN/facility: Highest performer among acute care institutions treating more than 100 stroke patients per year, rehabilitation facilities admitting more than 64 stroke patients per year, or sub-LHINs with at least 30 stroke patients per year. LHIN: Top two with exemplary performance.
7 The revised definition was developed with the consensus of Ontario Stroke Network regional directors (February 2014). There were 14 stroke units in 2012/13, 16 in 2013/14, 21 in 2014/15 and 28 in 2015/16.
Local Health Integration Networks (LHINs)1 Erie St. Clair 6 Mississauga Halton 11 Champlain2 South West 7 Toronto Central 12 North Simcoe Muskoka3 Waterloo Wellington 8 Central 13 North East4 Hamilton Niagara Haldimand Brant 9 Central East 14 North West5 Central West 10 South East

ONTARIO AND LHIN 2015/16 STROKE REPORT CARDS AND PROGRESS REPORTS
Institute for Clinical Evaluative Sciences24
INTERPRETATION OF 2015/16 STROKE REPORT CARD Ontario
PERFORMANCE OVERVIEWThe 2015/16 stroke report card shows ongoing progress across the key performance indicators (excluding those with limited data), with the following trends noted: • 15 of 17 indicators improved compared to the
previous three years. • 14 of 16 performance benchmarks improved
since 2014/15.
In addition, the highest performance value, lowest performance value and LHIN variation improved for:1. 30-day all-cause readmission (Indicator 20)2. Proportion of stroke/TIA patients discharged
to CCC/LTC (Indicator 19)3. tPA door-to-needle time (Indicator 6)4. Proportion of stroke inpatients receiving
carotid imaging (Indicator 5)
AREAS OF PROGRESSThe provincial report card reflects steady improvement, most notably in access to stroke units, tPA and its timely administration, carotid imaging, discharge to CCC/LTC, and readmissions following an acute stroke. Regional efforts to consolidate stroke care and create stroke units resulted in a dramatic improvement in access to stroke unit care—a 33% relative increase.
Ontario’s tPA rate (12.4%) is considered the minimum to impact disability at a population level,2 and rates exceeded 17.7% in some sub-LHINs.
Patient flow and access to inpatient rehabilitation improved, as did daily functional improvement in
rehabilitation. Ontario achieved the national target (>30%)12 of stroke patients admitted to rehabilitation (35.5%). The 30-day readmission rate after acute stroke (7.1%) was well below the general population (9.1%).13 These impressive improvements were accomplished in the absence of financial incentives.
This year’s report card includes two new indicators: referral to secondary prevention (Indicator 9) and functional outcome in acute care (Indicator 12). In addition, data is now available for minutes of rehabilitation therapy (Indicator 14). Benchmarks for Indicators 12 and 14 will be reported as data quality improves.
AREAS FOR IMPROVEMENTVariation in performance across LHINs remains; LHIN variation increased for 10 indicators, and ongoing improvement efforts are required. The percent of patients arriving by ambulance has stagnated; more than one out of three stroke patients are not arriving by calling 911. Ongoing public awareness initiatives are needed.
More work is needed to achieve recommended targets for stroke unit care (over 75%)12 and tPA delivery time (30 minutes).14
The amount of time stroke patients spend in therapy is 63 minutes/day. This suggests more resources and innovative approaches are needed to meet the QBP recommendation of 180 minutes per day.4
CURRENT OR PLANNED ACTIVITIESThe OSN will continue its vital collaboration with
Ontario’s 11 Regional Stroke Networks to align operating plans, education, knowledge translation approaches and implementation strategies to advance access to best practices and continue to improve on report card indicators.
The OSN will continue to lead the implementation of the updated Quality-Based Procedures: Clinical Handbook for Stroke4 recommendations, and to advise on indicators. In 2017/18, there will be a greater focus on implementation of QBP recommendations for TIA, community-based rehabilitation and EVT.
The OSN will continue to work with the MOHLTC and CIHI to inform to inform a sustainable stroke data collection and data quality strategy. This strategy will aim to inform report card indicators that include EVT, and to support the work of the Rehabilitative Care Alliance in addressing availability of outpatient rehabilitation data.
The OSN will continue to lead a project to identify sustainable and efficient data collection for clinic-based, high-risk TIA/secondary prevention management.
The OSN Stroke Evaluation Quality Committee will continue to review the report card indicators in the context of stroke QBP and evolving data availability and quality.
CONTACT Linda KellowayDirector Best Practice, Stroke Services Cardiac Care Network [email protected] / (416) 512-7472, ext. 271

Institute for Clinical Evaluative Sciences 25
ONTARIO AND LHIN 2015/16 STROKE REPORT CARDS AND PROGRESS REPORTS
ONTARIO STROKE REPORT CARD, 2015/16 Erie St. Clair Local Health Integration Network
Poor performance1 Acceptable performance2 Exemplary performance3 Data or benchmark not available
Indicator No. Care Continuum Category Indicator4
LHIN FY 2015/16(2014/15)
Variance Within LHIN5
(Min–Max)Provincial
Benchmark6
High Performers7
Sub-LHIN/Facility LHIN
1 Public awareness and patient education Proportion of stroke/TIA patients who arrived at the ED by ambulance 62.7% (61.8%) 55.7–67.3% 65.3% Essex Sub-LHIN 1, 4
2 Prevention of stroke Annual age- and sex-adjusted inpatient admission rate for stroke/TIA (per 1,000 population) 1.5 (1.4) 1.6–2.3 1.1 Ottawa Centre Sub-LHIN 8, 11
3§ Prevention of stroke Risk-adjusted stroke/TIA mortality rate at 30 days (per 100 patients) 12.2 (13.5) 8.8–32.6 - - 11
4 Prevention of strokeProportion of ischemic stroke/TIA inpatients aged 65 and older with atrial fibrillation who filled a prescription for anticoagulant therapy within 90 days of discharge from acute care
76.0% (64.7%) 66.7–80.0% 85.5% South West York Region Sub-LHIN None
5 Prevention of stroke Proportion of ischemic stroke inpatients who received carotid imaging 88.0% (82.7%) 47.1–97.7% 91.7% Bluewater Health, Sarnia 7, 1
6 Acute stroke management Median door-to-needle time among patients who received acute thrombolytic therapy (tPA) (minutes)
63.0 (70.0) 55.7–79.0 33.0 Hamilton Health Sciences Corp., General None
7§ Acute stroke management Proportion of ischemic stroke patients who received acute thrombolytic therapy (tPA) 9.0% (8.8%) 7.5–12.4% 17.7% Hamilton Outer Core Sub-LHIN 11, 4
8§ Acute stroke management Proportion of stroke/TIA patients treated on a stroke unit8 at any time during their inpatient stay 36.0% (18.2%) 2.2–81.3% 78.7% Thunder Bay City Sub-LHIN 3
9 Prevention of stroke Proportion of ischemic stroke/TIA patients discharged from the ED and referred to secondary prevention services
83.4% (86.4%) 50.0–93.8% 94.4% London Health Sciences Centre, University Hospital None
10§ Acute stroke management Proportion of ALC days to total length of stay in acute care 31.3% (30.6%) 0.0–41.9% 8.2% Bluewater Health, Sarnia None
11§ Acute stroke management Proportion of acute stroke (excluding TIA) patients discharged from acute care and admitted to inpatient rehabilitation 45.3% (41.2%) 37.6–55.4% 47.8% Chatham-Kent Sub-LHIN 1
12§ Stroke rehabilitation Proportion of acute stroke (excluding TIA) patients with mild disability (AlphaFIM > 80) discharged home
72.6% (71.0%) 60.7–78.3% - - 14, 12
13§ Stroke rehabilitation Median number of days between stroke (excluding TIA) onset and admission to stroke inpatient rehabilitation 7.0 (8.0) 4.0–13.0 5.0 Southlake Regional Health Centre None
14§ Stroke rehabilitation Median number of minutes per day of direct therapy received by inpatient stroke rehabilitation patients 69.0 (-) 24.4–87.3 - - 3, 8
15§ Stroke rehabilitation Proportion of inpatient stroke rehabilitation patients achieving RPG active length of stay target 67.0% (58.8%) 60.6–83.3% 82.0% St. Joseph’s Health Centre, Guelph 3
16 Stroke rehabilitation Median FIM efficiency for moderate stroke in inpatient rehabilitation 1.0 (1.1) 0.9–1.3 1.5 St. Joseph’s Health Centre, Guelph 12, 3
17 Stroke rehabilitation Mean number of CCAC visits provided to stroke patients on discharge from inpatient acute care or inpatient rehabilitation in 2014/15–2015/16 5.4 (6.2) - 12.4 Waterloo Wellington CCAC 3, 10
18§ Stroke rehabilitation Proportion of patients admitted to inpatient rehabilitation with severe stroke (RPG 1100 or 1110) 41.3% (40.5%) 25.0–50.0% 58.7% St. Joseph’s Health Centre, Guelph None
19§ Reintegration Proportion of stroke/TIA patients discharged from acute care to LTC/CCC (excluding patients originating from LTC/CCC) 3.4% (5.7%) 2.8–3.8% 2.0% Urban Guelph Sub-LHIN None
20§ Reintegration Age- and sex-adjusted readmission rate at 30 days for patients with stroke/TIA for all diagnoses (per 100 patients) 7.3 (7.6) 4.0–10.8 - - None
Hospital Service Accountability Agreement indicator, 2015/16 - Data not available § Contributes to QBP performance
1 Performance below the 50th percentile.
2 Performance at or above the 50th percentile and greater than 5% absolute/relative difference from the benchmark.
3 Benchmark achieved or performance within 5% absolute/relative difference from the benchmark.
4 Facility-based analysis (excluding Indicators 1, 2, 4, 7, 8, 11 and 19) for patients aged 18–108. Indicators are based on CIHI data. Low rates are desired for Indicators 2, 3, 6, 10, 13, 19 and 20.
5 Excludes sub-LHINs or facilities with fewer than six patients.
6 Top benchmark achieved between 2013/14 and 2015/16. Benchmarks were calculated using the ABC methodology (Weissman NW et al. J Eval Clin Pract. 1999; 5(3):269–81) on sub-LHIN or facility data.
7 Sub-LHIN/facility: Highest performer among acute care institutions treating more than 100 stroke patients per year, rehabilitation facilities admitting more than 64 stroke patients per year, or sub-LHINs with at least 30 stroke patients per year. LHIN: Top two with exemplary performance.
8 The revised definition was developed with the consensus of Ontario Stroke Network regional directors (February 2014). There were 14 stroke units in 2012/13, 16 in 2013/14, 21 in 2014/15 and 28 in 2015/16.
Local Health Integration Networks (LHINs)1 Erie St. Clair 6 Mississauga Halton 11 Champlain2 South West 7 Toronto Central 12 North Simcoe Muskoka3 Waterloo Wellington 8 Central 13 North East4 Hamilton Niagara Haldimand Brant 9 Central East 14 North West5 Central West 10 South East

ONTARIO AND LHIN 2015/16 STROKE REPORT CARDS AND PROGRESS REPORTS
Institute for Clinical Evaluative Sciences26
STROKE PROGRESS REPORT, 2015/16 COMPARED TO 2012/13–2014/15 Erie St. Clair Local Health Integration Network
Progressing well1 Progressing2 Not progressing3 Data not available
Indicator No. Care Continuum Category Indicator4
LHIN FY 2015/16(Previous
3-Year Average)
Variance Within LHIN5
2015/16 (2012/13) Greatest Improvement6
Min Max Sub-LHIN/Facility LHIN
1 Public awareness and patient education Proportion of stroke/TIA patients who arrived at the ED by ambulance 62.7% (61.4%) 55.7% (51.9%) 67.3% (64.6%) Woodbridge (Vaughan) Sub-LHIN None
2 Prevention of stroke Annual age- and sex-adjusted inpatient admission rate for stroke/TIA (per 1,000 population) 1.5 (1.4) 1.6 (1.5) 2.3 (1.9) Thunder Bay District Sub-LHIN 8
3§ Prevention of stroke Risk-adjusted7 stroke/TIA mortality rate at 30 days (per 100 patients) 12.4 (13.1) 9.5 (0.0) 37.6 (24.9) - 10, 11
4 Prevention of strokeProportion of ischemic stroke/TIA inpatients aged 65 and older with atrial fibrillation who filled a prescription for anticoagulant therapy within 90 days of discharge from acute care
76.0% (64.0%) 66.7 % (40.7%) 80.0% (72.2%) Chatham-Kent Sub-LHIN 9, 4
5 Prevention of stroke Proportion of ischemic stroke inpatients who received carotid imaging 88.0% (78.3%) 47.1% (30.3%) 97.7% (83.2%) North Bay Regional Health Centre 2, 1
6 Acute stroke management Median door-to-needle time among patients who received acute thrombolytic therapy (tPA) (minutes)
63.0 (80.0) 55.5 (63.0) 79.0 (95.5) University Health Network 6, 7
7§ Acute stroke management Proportion of ischemic stroke patients who received acute thrombolytic therapy (tPA) 9.0% (8.1%) 7.5% (3.8%) 12.4% (13.0%) Timiskaming Sub-LHIN 4, 11
8§ Acute stroke management Proportion of stroke/TIA patients treated on a stroke unit8 at any time during their inpatient stay 36.0% (17.1%) 2.2% (1.3%) 81.3% (64.0%) Belleville Sub-LHIN 14, 2
9 Prevention of stroke Proportion of ischemic stroke/TIA patients discharged from the ED and referred to secondary prevention services
83.4% (-) 50.0% (-) 93.8% (-) - -
10§ Acute stroke management Proportion of ALC days to total length of stay in acute care 31.3% (32.8%) 0.0% (0.0%) 41.9% (41.5%) Rouge Valley Health System, Ajax 5, 3
11§ Acute stroke management Proportion of acute stroke (excluding TIA) patients discharged from acute care and admitted to inpatient rehabilitation 45.3% (41.5%) 37.6% (34.6%) 55.4% (51.1%) Central York Region Sub-LHIN 8, 3
12§ Stroke rehabilitation Proportion of acute stroke (excluding TIA) patients with mild disability (AlphaFIM > 80) discharged home
72.6% (-) 60.7% (-) 78.3% (-) - -
13§ Stroke rehabilitation Median number of days between stroke (excluding TIA) onset and admission to stroke inpatient rehabilitation 7.0 (8.0) 4.0 (4.5) 13.0 (16.5) William Osler Health System, Brampton 5, 8, 10
14§ Stroke rehabilitation Median number of minutes per day of direct therapy received by inpatient stroke rehabilitation patients 69.0 (-) 24.4 (-) 87.3 (-) - -
15§ Stroke rehabilitation Proportion of inpatient stroke rehabilitation patients achieving RPG active length of stay target 67.0% (57.0%) 60.6% (41.2%) 83.3% (64.6%) Hotel Dieu Shaver 3, 5
16 Stroke rehabilitation Median FIM efficiency for moderate stroke in inpatient rehabilitation 1.0 (1.1) 0.9 (0.6) 1.3 (1.1) Grand River Hospital Corp., Freeport 3, 12
17 Stroke rehabilitation Mean number of CCAC visits provided to stroke patients on discharge from inpatient acute care or inpatient rehabilitation in 2014/15–2015/16 5.4 (6.0) - - Waterloo Wellington CCAC 3, 6
18§ Stroke rehabilitation Proportion of patients admitted to inpatient rehabilitation with severe stroke (RPG 1100 or 1110) 41.3% (39.0%) 25.0% (25.0%) 50.0% (43.2%) Providence Healthcare 7
19§ Reintegration Proportion of stroke/TIA patients discharged from acute care to LTC/CCC (excluding patients originating from LTC/CCC) 3.4% (6.2%) 2.8% (4.8%) 3.8% (11.1%) Belleville Sub-LHIN 10, 1
20§ Reintegration Age- and sex-adjusted7 readmission rate at 30 days for patients with stroke/TIA for all diagnoses (per 100 patients) 7.2 (7.1) 4.2 (6.6) 10.2 (7.9) - None
Hospital Service Accountability Agreement indicator, 2015/16 - Data not available § Contributes to QBP performance
1 Statistically significant improvement.
2 Performance improving but not statistically significant.
3 No change or performance decline.
4 Facility-based analysis (excluding Indicators 1, 2, 4, 7, 8, 11 and 19) for patients aged 18–108. Indicators are based on CIHI data. Low rates are desired for Indicators 2, 3, 6, 10, 13, 19 and 20.
5 Excludes sub-LHINs or facilities with fewer than six patients.
6 Sub-LHIN/facility: Greatest improvement from 2012/13 among acute care institutions treating more than 100 stroke patients per year, rehabilitation facilities admitting more than 64 stroke patients per year, or sub-LHINs with at least 30 stroke patients per year. LHIN: Top two with greatest statistically significant improvement from 2012/13.
7 The 2012/13-2015/16 LHIN rate was used in calculating the LHIN risk-adjusted rate.
8 The revised definition was developed with the consensus of Ontario Stroke Network regional directors (February 2014). There were 14 stroke units in 2012/13, 16 in 2013/14, 21 in 2014/15 and 28 in 2015/16.
Local Health Integration Networks (LHINs)1 Erie St. Clair 6 Mississauga Halton 11 Champlain2 South West 7 Toronto Central 12 North Simcoe Muskoka3 Waterloo Wellington 8 Central 13 North East4 Hamilton Niagara Haldimand Brant 9 Central East 14 North West5 Central West 10 South East

Institute for Clinical Evaluative Sciences 27
ONTARIO AND LHIN 2015/16 STROKE REPORT CARDS AND PROGRESS REPORTS
INTERPRETATION OF 2015/16 STROKE REPORT CARD Erie St. Clair Local Health Integration Network
PERFORMANCE OVERVIEWThe Erie St. Clair LHIN progressed on 13 of 17 indicators, with Indicators 5 and 19 showing the most improvement in Ontario. Three indicators (1, 5, 11) had exemplary performance in 2015/16, including four indicators (1, 5, 10, 11) where an Erie St. Clair LHIN county or facility was the provincial high performer.
AREAS OF PROGRESS
Acute Stroke Management Patients receiving care on a stroke unit increased to 36.0%, which contributed to significant improvements in patients receiving carotid imaging (88.0%), and those aged 65 and older with atrial fibrillation who filled an anticoagulant prescription (76.0%).
Acute Stroke Management Median DTN time improved significantly (63 minutes in 2015/16 vs. 80 minutes over the previous three years). As a result of DTN quality improvement initiatives at Windsor Regional Hospital (WRH), DTN decreased from 95 minutes (2014/15) to 79 minutes (2015/16).
Stroke Rehabilitation The proportion of inpatient rehabilitation patients achieving the QBP RPG active LOS target increased from 58.8% to 67.0% in one year, with all rehabilitation programs making improvements that included processes and staffing.
Community Reintegration The proportion of patients discharged from acute care to LTC/CCC decreased to 3.4% from 6.2% over previous three years. Lambton County, where there is more access to inpatient rehabilitation, had the lowest rate (2.8%).
AREAS FOR IMPROVEMENT ASSOCIATED CURRENT OR PLANNED ACTIVITIES
IntegrationProportion of ALC days to total LOS increased. Performance remains below the 50th percentile (31.3%) with wide variability across facilities (0.0–41.9%); highest proportions in Windsor Essex.
Bluewater Health (BWH) is the high performer in Ontario (1.6%) due to efficient flow processes from acute care to inpatient rehabilitation. WRH opened an acute stroke unit in April 2017 with plans to actively partner with Hotel Dieu Grace Healthcare (HDGH) to improve the transition from acute care to inpatient rehabilitation (through quality improvement plans to map the flow of patients and address barriers to discharge from hospital).
AppropriatenessProportion of acute stroke patients with mild disability who are discharged home was 72.6%, which is impacted by limited community rehabilitation. The number of CCAC visits after hospital discharge fell to 5.4.
HDGH implemented a community rehabilitation outreach team in 2016. Erie St. Clair LHIN facilities have been actively seeking opportunities and grants (e.g., ARTIC) to expand rehabilitation services in the community. The Erie St. Clair CCAC is currently piloting eRehab for mild to moderate stroke patients discharged home from acute care in Windsor Essex.
EffectivenessMedian number of days to inpatient rehabilitation decreased to seven days, with wide variability across facilities (4–13 days).
The median number of days to inpatient rehabilitation was 5.0 in Chatham-Kent Health Alliance and BWH, with FIM efficiencies of 1.2 and 1.3, respectively. Unique considerations exist for admission to free-standing facilities with HDGH at 13 days, impacting the ability to capitalize on early intensive therapy and resulting in a FIM efficiency of 0.9. Quality improvement plans will address patient transitions between WRH and HDGH.
EffectivenessMedian number of minutes per day of direct therapy received by inpatient rehabilitation patients was 69 minutes, which impacted FIM efficiency for moderate stroke (1.0). The QBP target is 180 minutes.
The Southwestern Ontario Stroke Network Rehabilitation Forum (Fall 2015) assisted the region in focusing on rehabilitation intensity. Weekend staffing began in some organizations; however, resources remain inadequate. Further opportunities for process improvement are being explored. There is need for a QBP funding model to support staffing requirements for therapy intensity.
OPPORTUNITIES FOR LHIN AND STROKE NETWORK COLLABORATION
• Complete the realignment of in-hospital stroke care to designated stroke centres with stroke units in the LHIN, and implement provincial recommendations to improve access to EVT.
• Support is required for the implementation of the Erie St. Clair LHIN stroke care pathway (with a focus on access to inpatient rehabilitation), and the need for high-intensity, stroke-specific outpatient/community rehabilitation across the LHIN.
• Lessons learned from the Erie St. Clair CCAC eRehab pilot and HDGH's rehabilitation outreach team will continue to be reviewed and supported.
• All stroke districts in the LHIN require stroke-specific outpatient/community rehabilitation programs and ongoing recovery and prevention opportunities (e.g., exercise programs, aphasia groups).
CONTACTPaula GilmoreRegional Director Southwestern Ontario Stroke Network [email protected] (519) 685-8500, ext. 32214
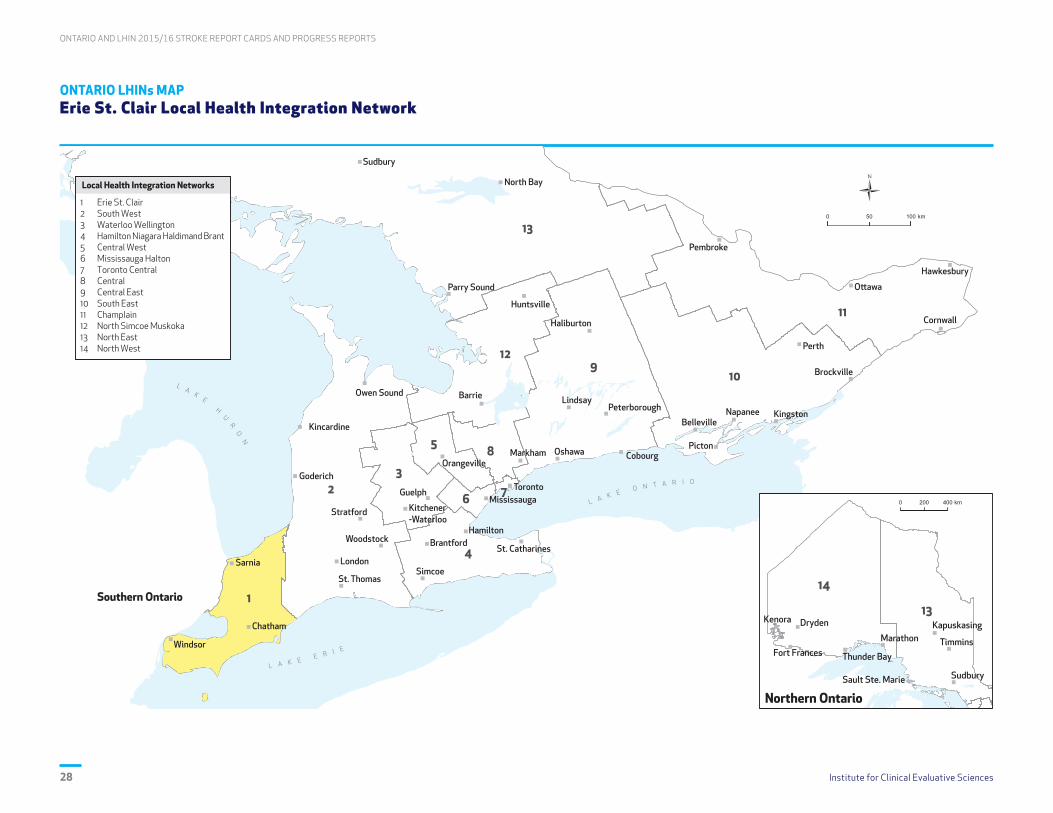
ONTARIO AND LHIN 2015/16 STROKE REPORT CARDS AND PROGRESS REPORTS
Institute for Clinical Evaluative Sciences28
ONTARIO LHINs MAP Erie St. Clair Local Health Integration Network
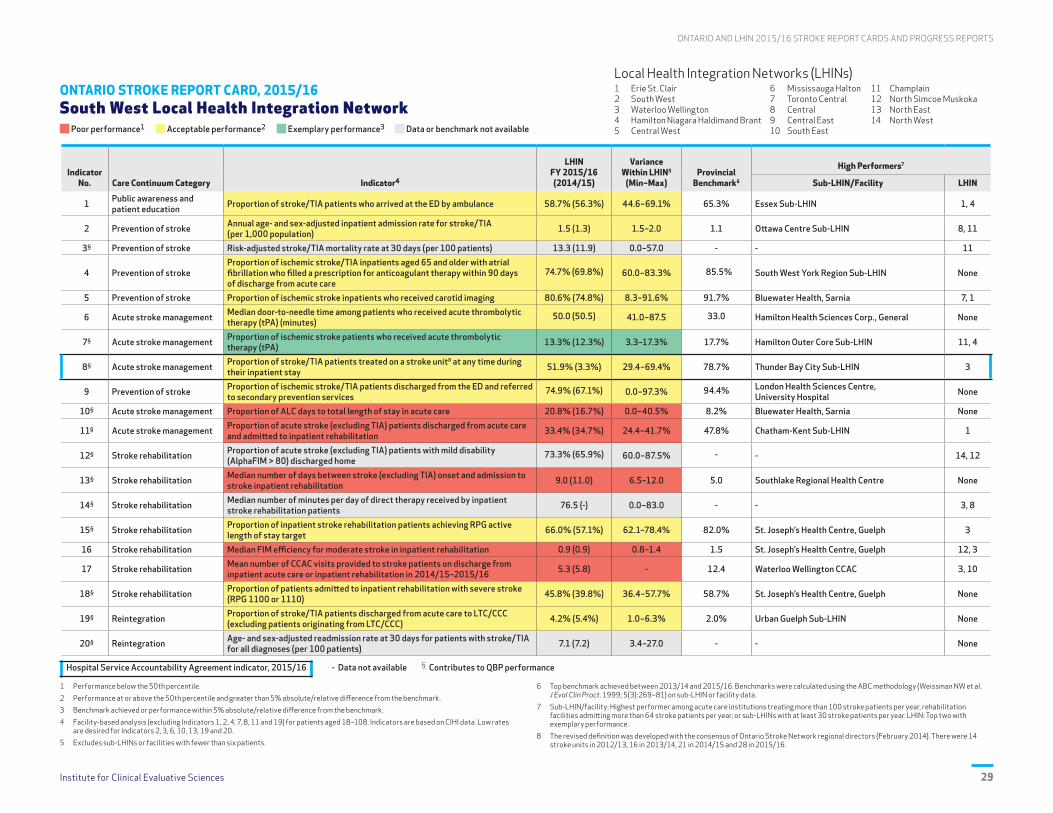
Institute for Clinical Evaluative Sciences 29
ONTARIO AND LHIN 2015/16 STROKE REPORT CARDS AND PROGRESS REPORTS
ONTARIO STROKE REPORT CARD, 2015/16 South West Local Health Integration Network
Poor performance1 Acceptable performance2 Exemplary performance3 Data or benchmark not available
Indicator No. Care Continuum Category Indicator4
LHIN FY 2015/16(2014/15)
Variance Within LHIN5
(Min–Max)Provincial
Benchmark6
High Performers7
Sub-LHIN/Facility LHIN
1 Public awareness and patient education Proportion of stroke/TIA patients who arrived at the ED by ambulance 58.7% (56.3%) 44.6–69.1% 65.3% Essex Sub-LHIN 1, 4
2 Prevention of stroke Annual age- and sex-adjusted inpatient admission rate for stroke/TIA (per 1,000 population) 1.5 (1.3) 1.5–2.0 1.1 Ottawa Centre Sub-LHIN 8, 11
3§ Prevention of stroke Risk-adjusted stroke/TIA mortality rate at 30 days (per 100 patients) 13.3 (11.9) 0.0–57.0 - - 11
4 Prevention of strokeProportion of ischemic stroke/TIA inpatients aged 65 and older with atrial fibrillation who filled a prescription for anticoagulant therapy within 90 days of discharge from acute care
74.7% (69.8%) 60.0–83.3% 85.5% South West York Region Sub-LHIN None
5 Prevention of stroke Proportion of ischemic stroke inpatients who received carotid imaging 80.6% (74.8%) 8.3–91.6% 91.7% Bluewater Health, Sarnia 7, 1
6 Acute stroke management Median door-to-needle time among patients who received acute thrombolytic therapy (tPA) (minutes)
50.0 (50.5) 41.0–87.5 33.0 Hamilton Health Sciences Corp., General None
7§ Acute stroke management Proportion of ischemic stroke patients who received acute thrombolytic therapy (tPA) 13.3% (12.3%) 3.3–17.3% 17.7% Hamilton Outer Core Sub-LHIN 11, 4
8§ Acute stroke management Proportion of stroke/TIA patients treated on a stroke unit8 at any time during their inpatient stay 51.9% (3.3%) 29.4–69.4% 78.7% Thunder Bay City Sub-LHIN 3
9 Prevention of stroke Proportion of ischemic stroke/TIA patients discharged from the ED and referred to secondary prevention services
74.9% (67.1%) 0.0–97.3% 94.4% London Health Sciences Centre, University Hospital None
10§ Acute stroke management Proportion of ALC days to total length of stay in acute care 20.8% (16.7%) 0.0–40.5% 8.2% Bluewater Health, Sarnia None
11§ Acute stroke management Proportion of acute stroke (excluding TIA) patients discharged from acute care and admitted to inpatient rehabilitation 33.4% (34.7%) 24.4–41.7% 47.8% Chatham-Kent Sub-LHIN 1
12§ Stroke rehabilitation Proportion of acute stroke (excluding TIA) patients with mild disability (AlphaFIM > 80) discharged home
73.3% (65.9%) 60.0–87.5% - - 14, 12
13§ Stroke rehabilitation Median number of days between stroke (excluding TIA) onset and admission to stroke inpatient rehabilitation 9.0 (11.0) 6.5–12.0 5.0 Southlake Regional Health Centre None
14§ Stroke rehabilitation Median number of minutes per day of direct therapy received by inpatient stroke rehabilitation patients 76.5 (-) 0.0–83.0 - - 3, 8
15§ Stroke rehabilitation Proportion of inpatient stroke rehabilitation patients achieving RPG active length of stay target 66.0% (57.1%) 62.1–78.4% 82.0% St. Joseph’s Health Centre, Guelph 3
16 Stroke rehabilitation Median FIM efficiency for moderate stroke in inpatient rehabilitation 0.9 (0.9) 0.8–1.4 1.5 St. Joseph’s Health Centre, Guelph 12, 3
17 Stroke rehabilitation Mean number of CCAC visits provided to stroke patients on discharge from inpatient acute care or inpatient rehabilitation in 2014/15–2015/16 5.3 (5.8) - 12.4 Waterloo Wellington CCAC 3, 10
18§ Stroke rehabilitation Proportion of patients admitted to inpatient rehabilitation with severe stroke (RPG 1100 or 1110) 45.8% (39.8%) 36.4–57.7% 58.7% St. Joseph’s Health Centre, Guelph None
19§ Reintegration Proportion of stroke/TIA patients discharged from acute care to LTC/CCC (excluding patients originating from LTC/CCC) 4.2% (5.4%) 1.0–6.3% 2.0% Urban Guelph Sub-LHIN None
20§ Reintegration Age- and sex-adjusted readmission rate at 30 days for patients with stroke/TIA for all diagnoses (per 100 patients) 7.1 (7.2) 3.4–27.0 - - None
Hospital Service Accountability Agreement indicator, 2015/16 - Data not available § Contributes to QBP performance
1 Performance below the 50th percentile.
2 Performance at or above the 50th percentile and greater than 5% absolute/relative difference from the benchmark.
3 Benchmark achieved or performance within 5% absolute/relative difference from the benchmark.
4 Facility-based analysis (excluding Indicators 1, 2, 4, 7, 8, 11 and 19) for patients aged 18–108. Indicators are based on CIHI data. Low rates are desired for Indicators 2, 3, 6, 10, 13, 19 and 20.
5 Excludes sub-LHINs or facilities with fewer than six patients.
6 Top benchmark achieved between 2013/14 and 2015/16. Benchmarks were calculated using the ABC methodology (Weissman NW et al. J Eval Clin Pract. 1999; 5(3):269–81) on sub-LHIN or facility data.
7 Sub-LHIN/facility: Highest performer among acute care institutions treating more than 100 stroke patients per year, rehabilitation facilities admitting more than 64 stroke patients per year, or sub-LHINs with at least 30 stroke patients per year. LHIN: Top two with exemplary performance.
8 The revised definition was developed with the consensus of Ontario Stroke Network regional directors (February 2014). There were 14 stroke units in 2012/13, 16 in 2013/14, 21 in 2014/15 and 28 in 2015/16.
Local Health Integration Networks (LHINs)1 Erie St. Clair 6 Mississauga Halton 11 Champlain2 South West 7 Toronto Central 12 North Simcoe Muskoka3 Waterloo Wellington 8 Central 13 North East4 Hamilton Niagara Haldimand Brant 9 Central East 14 North West5 Central West 10 South East

ONTARIO AND LHIN 2015/16 STROKE REPORT CARDS AND PROGRESS REPORTS
Institute for Clinical Evaluative Sciences30
STROKE PROGRESS REPORT, 2015/16 COMPARED TO 2012/13–2014/15 South West Local Health Integration Network
Progressing well1 Progressing2 Not progressing3 Data not available
Indicator No. Care Continuum Category Indicator4
LHIN FY 2015/16(Previous
3-Year Average)
Variance Within LHIN5
2015/16 (2012/13) Greatest Improvement6
Min Max Sub-LHIN/Facility LHIN
1 Public awareness and patient education Proportion of stroke/TIA patients who arrived at the ED by ambulance 58.7% (56.2%) 44.6% (43.8%) 69.1% (59.4%) Woodbridge (Vaughan) Sub-LHIN None
2 Prevention of stroke Annual age- and sex-adjusted inpatient admission rate for stroke/TIA (per 1,000 population) 1.5 (1.3) 1.5 (1.3) 2.0 (1.9) Thunder Bay District Sub-LHIN 8
3§ Prevention of stroke Risk-adjusted7 stroke/TIA mortality rate at 30 days (per 100 patients) 12.1 (13.3) 0.0 (0.0) 57.7 (43.3) - 10, 11
4 Prevention of strokeProportion of ischemic stroke/TIA inpatients aged 65 and older with atrial fibrillation who filled a prescription for anticoagulant therapy within 90 days of discharge from acute care
74.7% (70.0%) 60.0% (53.3%) 83.3% (81.3%) Chatham-Kent Sub-LHIN 9, 4
5 Prevention of stroke Proportion of ischemic stroke inpatients who received carotid imaging 80.6% (70.1%) 8.3% (9.1%) 91.6% (74.6%) North Bay Regional Health Centre 2, 1
6 Acute stroke management Median door-to-needle time among patients who received acute thrombolytic therapy (tPA) (minutes)
50.0 (57.0) 41.0 (68.0) 87.5 (74.0) University Health Network 6, 7
7§ Acute stroke management Proportion of ischemic stroke patients who received acute thrombolytic therapy (tPA) 13.3% (11.4%) 3.3% (1.2%) 17.3% (13.7%) Timiskaming Sub-LHIN 4, 11
8§ Acute stroke management Proportion of stroke/TIA patients treated on a stroke unit8 at any time during their inpatient stay 51.9% (2.2%) 29.4% (0.0%) 69.4% (4.1%) Belleville Sub-LHIN 14, 2
9 Prevention of stroke Proportion of ischemic stroke/TIA patients discharged from the ED and referred to secondary prevention services
74.9% (-) 0.0% (-) 97.3% (-) - -
10§ Acute stroke management Proportion of ALC days to total length of stay in acute care 20.8% (22.3%) 0.0% (0.0%) 40.5% (76.0%) Rouge Valley Health System, Ajax 5, 3
11§ Acute stroke management Proportion of acute stroke (excluding TIA) patients discharged from acute care and admitted to inpatient rehabilitation 33.4% (36.5%) 24.4% (23.6%) 41.7% (50.8%) Central York Region Sub-LHIN 8, 3
12§ Stroke rehabilitation Proportion of acute stroke (excluding TIA) patients with mild disability (AlphaFIM > 80) discharged home
73.3% (-) 60.0% (-) 87.5% (-) - -
13§ Stroke rehabilitation Median number of days between stroke (excluding TIA) onset and admission to stroke inpatient rehabilitation 9.0 (10.0) 6.5 (6.0) 12.0 (12.0) William Osler Health System, Brampton 5, 8, 10
14§ Stroke rehabilitation Median number of minutes per day of direct therapy received by inpatient stroke rehabilitation patients 76.5 (-) 0.0 (-) 83.0 (-) - -
15§ Stroke rehabilitation Proportion of inpatient stroke rehabilitation patients achieving RPG active length of stay target 66.0% (52.7%) 62.1% (36.6%) 78.4% (75.9%) Hotel Dieu Shaver 3, 5
16 Stroke rehabilitation Median FIM efficiency for moderate stroke in inpatient rehabilitation 0.9 (0.8) 0.8 (0.7) 1.4 (1.5) Grand River Hospital Corp., Freeport 3, 12
17 Stroke rehabilitation Mean number of CCAC visits provided to stroke patients on discharge from inpatient acute care or inpatient rehabilitation in 2014/15–2015/16 5.3 (5.5) - - Waterloo Wellington CCAC 3, 6
18§ Stroke rehabilitation Proportion of patients admitted to inpatient rehabilitation with severe stroke (RPG 1100 or 1110) 45.8% (42.0%) 36.4% (31.0%) 57.7% (56.8%) Providence Healthcare 7
19§ Reintegration Proportion of stroke/TIA patients discharged from acute care to LTC/CCC (excluding patients originating from LTC/CCC) 4.2% (5.6%) 1.0% (1.7%) 6.3% (7.1%) Belleville Sub-LHIN 10, 1
20§ Reintegration Age- and sex-adjusted7 readmission rate at 30 days for patients with stroke/TIA for all diagnoses (per 100 patients) 6.6 (7.0) 3.4 (0.0) 27.2 (24.5) - None
Hospital Service Accountability Agreement indicator, 2015/16 - Data not available § Contributes to QBP performance
1 Statistically significant improvement.
2 Performance improving but not statistically significant.
3 No change or performance decline.
4 Facility-based analysis (excluding Indicators 1, 2, 4, 7, 8, 11 and 19) for patients aged 18–108. Indicators are based on CIHI data. Low rates are desired for Indicators 2, 3, 6, 10, 13, 19 and 20.
5 Excludes sub-LHINs or facilities with fewer than six patients.
6 Sub-LHIN/facility: Greatest improvement from 2012/13 among acute care institutions treating more than 100 stroke patients per year, rehabilitation facilities admitting more than 64 stroke patients per year, or sub-LHINs with at least 30 stroke patients per year. LHIN: Top two with greatest statistically significant improvement from 2012/13.
7 The 2012/13-2015/16 LHIN rate was used in calculating the LHIN risk-adjusted rate.
8 The revised definition was developed with the consensus of Ontario Stroke Network regional directors (February 2014). There were 14 stroke units in 2012/13, 16 in 2013/14, 21 in 2014/15 and 28 in 2015/16.
Local Health Integration Networks (LHINs)1 Erie St. Clair 6 Mississauga Halton 11 Champlain2 South West 7 Toronto Central 12 North Simcoe Muskoka3 Waterloo Wellington 8 Central 13 North East4 Hamilton Niagara Haldimand Brant 9 Central East 14 North West5 Central West 10 South East

Institute for Clinical Evaluative Sciences 31
ONTARIO AND LHIN 2015/16 STROKE REPORT CARDS AND PROGRESS REPORTS
INTERPRETATION OF 2015/16 STROKE REPORT CARD South West Local Health Integration Network
PERFORMANCE OVERVIEWThe South West LHIN progressed on 14 of 17 indicators, 5 of 14 indicators showed statistically significant improvement, and Indicator 5 showed the most improvement in Ontario. Indicator 7 (tPA) had exemplary performance. London Health Sciences Centre (LHSC) was the provincial high performer for secondary stroke prevention service referrals (Indicator 9).
AREAS OF PROGRESS
Acute Stroke Management With the opening of three stroke units in 2015/16 that met the provincial definition, the proportion of patients receiving care on a stroke unit increased significantly to 51.9%, from 3.3% in 2014/15.
Stroke Prevention There was significant improvement in carotid imaging (80.6% in 2015/16 vs. 70.1% over the previous three years), with the highest rates at the regional and district stroke centres.
Acute Stroke Management Median DTN time improved significantly to 50.0 minutes; LHSC led performance in the LHIN (41.0 minutes). tPA rates were exemplary (13.3%) with most facilities surpassing the provincial benchmark (17.7%).
Stroke Rehabilitation Quality improvements in rehabilitation programs (e.g., process efficiencies, staffing) corresponded with an increase in the proportion of patients achieving their LOS target (57.1% in 2014/15 to 66.0% in 2015/16).
AREAS FOR IMPROVEMENT ASSOCIATED CURRENT OR PLANNED ACTIVITIES
AccessProportion of patients receiving care on a stroke unit improved to 51.9% (above the 50th percentile), but the proportion admitted to rehabilitation (33.4%) remained below the 50th percentile.
Due to the South West Stroke Project, there are currently four stroke units in the South West LHIN, with an integrated stroke unit (ISU) opened at St. Thomas Elgin General Hospital in April 2016. LHIN variability existed in the proportion of patients admitted to inpatient rehabilitation (24.4%–41.7%). Variation is being addressed in Middlesex and Oxford with the addition of a stroke navigator to ensure access from acute care to rehabilitation.
AccessThe median number of days to inpatient rehabilitation admission was 9.0 with wide variability across the LHIN (6.5–12 days).
Access and flow are priorities in all organizations. The South West Stroke Project has realigned care to designated stroke centres. LHSC and Parkwood Institute have been addressing realignment and process improvements to improve transitions (e.g., introducing a stroke navigator). The process for coordinated access, especially in ISUs, is being reviewed.
EffectivenessMedian number of minutes per day of direct therapy received by inpatient rehabilitation patients was 76.5 minutes. The QBP target is 180 minutes.
The Southwestern Ontario Stroke Network Rehabilitation Forum (Fall 2015) provided an environment for the region to focus on rehabilitation intensity. Weekend staffing began in some organizations; however, resources remain inadequate. Further opportunities for process improvement are being explored. There is a need for funding to support the QBP target for inpatient rehabilitation.
EffectivenessMedian FIM efficiency for moderate stroke in inpatient rehabilitation remained below the 50th percentile at 0.9 and there was wide variability across facilities (0.8–1.4).
Mandatory reporting of rehabilitation intensity as of April 2015 resulted in a greater focus on therapy time. Performance dashboards, including FIM efficiency and LOS targets, were developed at designated stroke rehabilitation centres. Inpatient rehabilitation staffing ratios, including funding, need to be considered for system improvements. Monitoring of wait times for community stroke rehabilitation team /outpatient therapy is ongoing.
OPPORTUNITIES FOR LHIN AND STROKE NETWORK COLLABORATION
• As of April 2017, the South West Stroke Project had implemented Phase I recommendations to realign stroke care from 28 hospitals to seven designated stroke centres, thus improving access to best practice care.
• Opportunities exist in the sustainability phase of this transformation for ongoing evaluation and process improvements, including the implementation of provincial recommendations to improve access to EVT.
• The SW LHIN will work with the Southwestern Ontario Stroke Network to prioritize and implement Phase 2 South West Stroke Project recommendations, which focus on the future state of secondary stroke prevention, community stroke rehabilitation and recovery.
CONTACTPaula GilmoreRegional Director Southwestern Ontario Stroke Network [email protected] (519) 685-8500, ext. 32214

ONTARIO AND LHIN 2015/16 STROKE REPORT CARDS AND PROGRESS REPORTS
Institute for Clinical Evaluative Sciences32
ONTARIO LHINs MAP South West Local Health Integration Network

Institute for Clinical Evaluative Sciences 33
ONTARIO AND LHIN 2015/16 STROKE REPORT CARDS AND PROGRESS REPORTS
ONTARIO STROKE REPORT CARD, 2015/16 Waterloo Wellington Local Health Integration Network
Poor performance1 Acceptable performance2 Exemplary performance3 Data or benchmark not available
Indicator No. Care Continuum Category Indicator4
LHIN FY 2015/16(2014/15)
Variance Within LHIN5
(Min–Max)Provincial
Benchmark6
High Performers7
Sub-LHIN/Facility LHIN
1 Public awareness and patient education Proportion of stroke/TIA patients who arrived at the ED by ambulance 59.4% (61.0%) 55.1–65.6% 65.3% Essex Sub-LHIN 1, 4
2 Prevention of stroke Annual age- and sex-adjusted inpatient admission rate for stroke/TIA (per 1,000 population) 1.6 (1.5) 1.7–2.0 1.1 Ottawa Centre Sub-LHIN 8, 11
3§ Prevention of stroke Risk-adjusted stroke/TIA mortality rate at 30 days (per 100 patients) 12.9 (12.4) 0.0–48.3 - - 11
4 Prevention of strokeProportion of ischemic stroke/TIA inpatients aged 65 and older with atrial fibrillation who filled a prescription for anticoagulant therapy within 90 days of discharge from acute care
70.1% (75.1%) 57.1–81.8% 85.5% South West York Region Sub-LHIN None
5 Prevention of stroke Proportion of ischemic stroke inpatients who received carotid imaging 84.8% (79.5%) 16.7–90.6% 91.7% Bluewater Health, Sarnia 7, 1
6 Acute stroke management Median door-to-needle time among patients who received acute thrombolytic therapy (tPA) (minutes)
61.0 (56.0) 47.0–70.5 33.0 Hamilton Health Sciences Corp., General None
7§ Acute stroke management Proportion of ischemic stroke patients who received acute thrombolytic therapy (tPA) 9.9% (11.4%) 7.7–15.8% 17.7% Hamilton Outer Core Sub-LHIN 11, 4
8§ Acute stroke management Proportion of stroke/TIA patients treated on a stroke unit8 at any time during their inpatient stay 80.6% (75.9%) 55.9–87.3% 78.7% Thunder Bay City Sub-LHIN 3
9 Prevention of stroke Proportion of ischemic stroke/TIA patients discharged from the ED and referred to secondary prevention services
64.6% (62.5%) 0.0–88.6% 94.4% London Health Sciences Centre, University Hospital None
10§ Acute stroke management Proportion of ALC days to total length of stay in acute care 14.4% (13.2%) 0.0–43.8% 8.2% Bluewater Health, Sarnia None
11§ Acute stroke management Proportion of acute stroke (excluding TIA) patients discharged from acute care and admitted to inpatient rehabilitation 40.1% (33.0%) 30.4–46.0% 47.8% Chatham-Kent Sub-LHIN 1
12§ Stroke rehabilitation Proportion of acute stroke (excluding TIA) patients with mild disability (AlphaFIM > 80) discharged home
78.7% (86.1%) 72.6–94.4% - - 14, 12
13§ Stroke rehabilitation Median number of days between stroke (excluding TIA) onset and admission to stroke inpatient rehabilitation 7.0 (8.0) 5.0–8.0 5.0 Southlake Regional Health Centre None
14§ Stroke rehabilitation Median number of minutes per day of direct therapy received by inpatient stroke rehabilitation patients 88.8 (-) 81.4–93.1 - - 3, 8
15§ Stroke rehabilitation Proportion of inpatient stroke rehabilitation patients achieving RPG active length of stay target 84.0% (79.6%) 78.6–100% 82.0% St. Joseph’s Health Centre, Guelph 3
16 Stroke rehabilitation Median FIM efficiency for moderate stroke in inpatient rehabilitation 1.7 (1.5) 1.6–1.8 1.5 St. Joseph’s Health Centre, Guelph 12, 3
17 Stroke rehabilitation Mean number of CCAC visits provided to stroke patients on discharge from inpatient acute care or inpatient rehabilitation in 2014/15–2015/16 15.0 (8.6) - 12.4 Waterloo Wellington CCAC 3, 10
18§ Stroke rehabilitation Proportion of patients admitted to inpatient rehabilitation with severe stroke (RPG 1100 or 1110) 51.2% (54.7%) 45.6–57.7% 58.7% St. Joseph’s Health Centre, Guelph None
19§ Reintegration Proportion of stroke/TIA patients discharged from acute care to LTC/CCC (excluding patients originating from LTC/CCC) 3.5% (4.3%) 0.0–6.5% 2.0% Urban Guelph Sub-LHIN None
20§ Reintegration Age- and sex-adjusted readmission rate at 30 days for patients with stroke/TIA for all diagnoses (per 100 patients) 6.6 (9.2) 0.0–15.2 - - None
Hospital Service Accountability Agreement indicator, 2015/16 - Data not available § Contributes to QBP performance
1 Performance below the 50th percentile.
2 Performance at or above the 50th percentile and greater than 5% absolute/relative difference from the benchmark.
3 Benchmark achieved or performance within 5% absolute/relative difference from the benchmark.
4 Facility-based analysis (excluding Indicators 1, 2, 4, 7, 8, 11 and 19) for patients aged 18–108. Indicators are based on CIHI data. Low rates are desired for Indicators 2, 3, 6, 10, 13, 19 and 20.
5 Excludes sub-LHINs or facilities with fewer than six patients.
6 Top benchmark achieved between 2013/14 and 2015/16. Benchmarks were calculated using the ABC methodology (Weissman NW et al. J Eval Clin Pract. 1999; 5(3):269–81) on sub-LHIN or facility data.
7 Sub-LHIN/facility: Highest performer among acute care institutions treating more than 100 stroke patients per year, rehabilitation facilities admitting more than 64 stroke patients per year, or sub-LHINs with at least 30 stroke patients per year. LHIN: Top two with exemplary performance.
8 The revised definition was developed with the consensus of Ontario Stroke Network regional directors (February 2014). There were 14 stroke units in 2012/13, 16 in 2013/14, 21 in 2014/15 and 28 in 2015/16.
Local Health Integration Networks (LHINs)1 Erie St. Clair 6 Mississauga Halton 11 Champlain2 South West 7 Toronto Central 12 North Simcoe Muskoka3 Waterloo Wellington 8 Central 13 North East4 Hamilton Niagara Haldimand Brant 9 Central East 14 North West5 Central West 10 South East
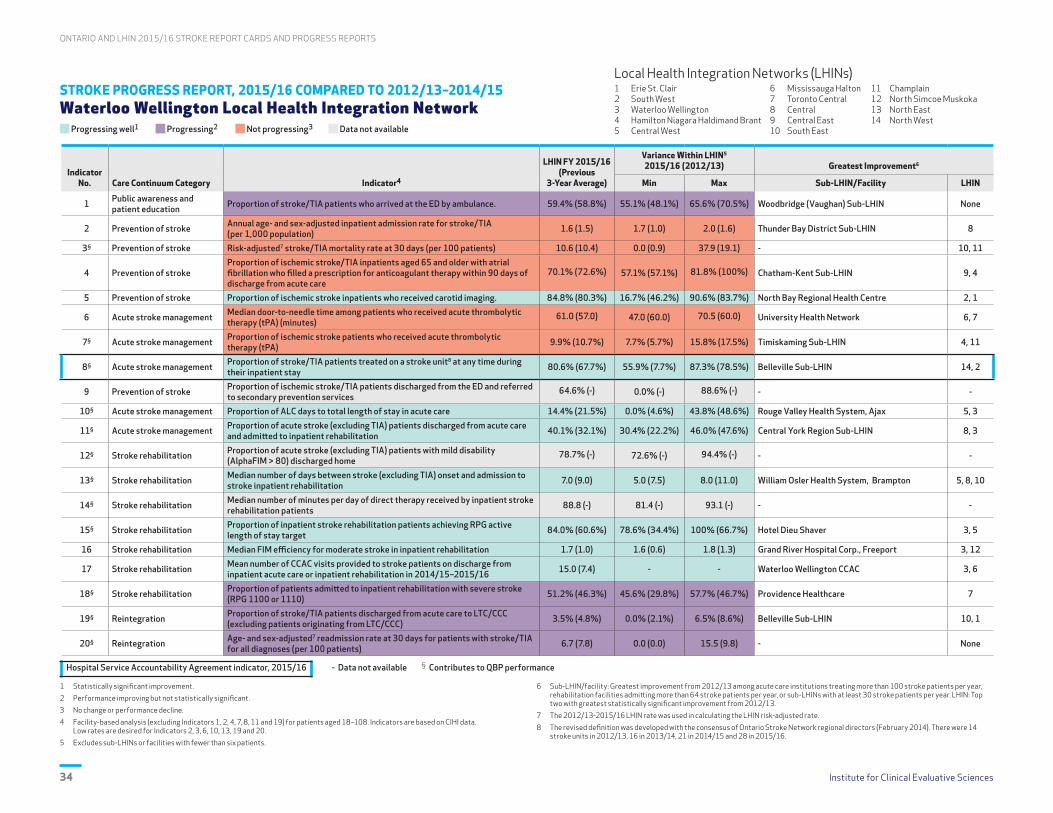
ONTARIO AND LHIN 2015/16 STROKE REPORT CARDS AND PROGRESS REPORTS
Institute for Clinical Evaluative Sciences34
STROKE PROGRESS REPORT, 2015/16 COMPARED TO 2012/13–2014/15 Waterloo Wellington Local Health Integration Network
Progressing well1 Progressing2 Not progressing3 Data not available
Indicator No. Care Continuum Category Indicator4
LHIN FY 2015/16(Previous
3-Year Average)
Variance Within LHIN5
2015/16 (2012/13) Greatest Improvement6
Min Max Sub-LHIN/Facility LHIN
1 Public awareness and patient education Proportion of stroke/TIA patients who arrived at the ED by ambulance. 59.4% (58.8%) 55.1% (48.1%) 65.6% (70.5%) Woodbridge (Vaughan) Sub-LHIN None
2 Prevention of stroke Annual age- and sex-adjusted inpatient admission rate for stroke/TIA (per 1,000 population) 1.6 (1.5) 1.7 (1.0) 2.0 (1.6) Thunder Bay District Sub-LHIN 8
3§ Prevention of stroke Risk-adjusted7 stroke/TIA mortality rate at 30 days (per 100 patients) 10.6 (10.4) 0.0 (0.9) 37.9 (19.1) - 10, 11
4 Prevention of strokeProportion of ischemic stroke/TIA inpatients aged 65 and older with atrial fibrillation who filled a prescription for anticoagulant therapy within 90 days of discharge from acute care
70.1% (72.6%) 57.1% (57.1%) 81.8% (100%) Chatham-Kent Sub-LHIN 9, 4
5 Prevention of stroke Proportion of ischemic stroke inpatients who received carotid imaging. 84.8% (80.3%) 16.7% (46.2%) 90.6% (83.7%) North Bay Regional Health Centre 2, 1
6 Acute stroke management Median door-to-needle time among patients who received acute thrombolytic therapy (tPA) (minutes)
61.0 (57.0) 47.0 (60.0) 70.5 (60.0) University Health Network 6, 7
7§ Acute stroke management Proportion of ischemic stroke patients who received acute thrombolytic therapy (tPA) 9.9% (10.7%) 7.7% (5.7%) 15.8% (17.5%) Timiskaming Sub-LHIN 4, 11
8§ Acute stroke management Proportion of stroke/TIA patients treated on a stroke unit8 at any time during their inpatient stay 80.6% (67.7%) 55.9% (7.7%) 87.3% (78.5%) Belleville Sub-LHIN 14, 2
9 Prevention of stroke Proportion of ischemic stroke/TIA patients discharged from the ED and referred to secondary prevention services
64.6% (-) 0.0% (-) 88.6% (-) - -
10§ Acute stroke management Proportion of ALC days to total length of stay in acute care 14.4% (21.5%) 0.0% (4.6%) 43.8% (48.6%) Rouge Valley Health System, Ajax 5, 3
11§ Acute stroke management Proportion of acute stroke (excluding TIA) patients discharged from acute care and admitted to inpatient rehabilitation 40.1% (32.1%) 30.4% (22.2%) 46.0% (47.6%) Central York Region Sub-LHIN 8, 3
12§ Stroke rehabilitation Proportion of acute stroke (excluding TIA) patients with mild disability (AlphaFIM > 80) discharged home
78.7% (-) 72.6% (-) 94.4% (-) - -
13§ Stroke rehabilitation Median number of days between stroke (excluding TIA) onset and admission to stroke inpatient rehabilitation 7.0 (9.0) 5.0 (7.5) 8.0 (11.0) William Osler Health System, Brampton 5, 8, 10
14§ Stroke rehabilitation Median number of minutes per day of direct therapy received by inpatient stroke rehabilitation patients 88.8 (-) 81.4 (-) 93.1 (-) - -
15§ Stroke rehabilitation Proportion of inpatient stroke rehabilitation patients achieving RPG active length of stay target 84.0% (60.6%) 78.6% (34.4%) 100% (66.7%) Hotel Dieu Shaver 3, 5
16 Stroke rehabilitation Median FIM efficiency for moderate stroke in inpatient rehabilitation 1.7 (1.0) 1.6 (0.6) 1.8 (1.3) Grand River Hospital Corp., Freeport 3, 12
17 Stroke rehabilitation Mean number of CCAC visits provided to stroke patients on discharge from inpatient acute care or inpatient rehabilitation in 2014/15–2015/16 15.0 (7.4) - - Waterloo Wellington CCAC 3, 6
18§ Stroke rehabilitation Proportion of patients admitted to inpatient rehabilitation with severe stroke (RPG 1100 or 1110) 51.2% (46.3%) 45.6% (29.8%) 57.7% (46.7%) Providence Healthcare 7
19§ Reintegration Proportion of stroke/TIA patients discharged from acute care to LTC/CCC (excluding patients originating from LTC/CCC) 3.5% (4.8%) 0.0% (2.1%) 6.5% (8.6%) Belleville Sub-LHIN 10, 1
20§ Reintegration Age- and sex-adjusted7 readmission rate at 30 days for patients with stroke/TIA for all diagnoses (per 100 patients) 6.7 (7.8) 0.0 (0.0) 15.5 (9.8) - None
Hospital Service Accountability Agreement indicator, 2015/16 - Data not available § Contributes to QBP performance
1 Statistically significant improvement.
2 Performance improving but not statistically significant.
3 No change or performance decline.
4 Facility-based analysis (excluding Indicators 1, 2, 4, 7, 8, 11 and 19) for patients aged 18–108. Indicators are based on CIHI data. Low rates are desired for Indicators 2, 3, 6, 10, 13, 19 and 20.
5 Excludes sub-LHINs or facilities with fewer than six patients.
6 Sub-LHIN/facility: Greatest improvement from 2012/13 among acute care institutions treating more than 100 stroke patients per year, rehabilitation facilities admitting more than 64 stroke patients per year, or sub-LHINs with at least 30 stroke patients per year. LHIN: Top two with greatest statistically significant improvement from 2012/13.
7 The 2012/13-2015/16 LHIN rate was used in calculating the LHIN risk-adjusted rate.
8 The revised definition was developed with the consensus of Ontario Stroke Network regional directors (February 2014). There were 14 stroke units in 2012/13, 16 in 2013/14, 21 in 2014/15 and 28 in 2015/16.
Local Health Integration Networks (LHINs)1 Erie St. Clair 6 Mississauga Halton 11 Champlain2 South West 7 Toronto Central 12 North Simcoe Muskoka3 Waterloo Wellington 8 Central 13 North East4 Hamilton Niagara Haldimand Brant 9 Central East 14 North West5 Central West 10 South East

Institute for Clinical Evaluative Sciences 35
ONTARIO AND LHIN 2015/16 STROKE REPORT CARDS AND PROGRESS REPORTS
INTERPRETATION OF 2015/16 STROKE REPORT CARD Waterloo Wellington Local Health Integration Network
PERFORMANCE OVERVIEWThe Waterloo Wellington LHIN progressed on 12 indicators (1, 5, 8, 10, 11, 13, 15, 16, 17, 18, 19, 20) and was the high performer on Indicators 8, 14, 15, 16 and 17. A sub-LHIN/facility within the LHIN is the provincial leader for Indicators 15, 16, 17, 18 and 19.
AREAS OF PROGRESS
Acute Stroke Management There was substantial improvement in the proportion of stroke/TIA patients treated on a stroke unit (80.6% vs. 75.9% in 2014/15). The Waterloo Wellington LHIN was the provincial leader on this indicator.
Stroke Rehabilitation Quality improvement initiatives in stroke inpatient rehabilitation in the Waterloo Wellington LHIN led to increased FIM efficiency (daily functional gains) for patients with moderate functional impairment (1.7 vs. 1.5 in 2014/15).
Stroke Rehabilitation Quality improvement initiatives optimized the number of minutes per day of direct therapy that stroke rehabilitation inpatients receive. The Waterloo Wellington LHIN was the provincial leader on this indicator.
Acute Stroke Management Patient flow quality improvement initiatives and a comprehensive community stroke rehabilitation program led to a significant reduction in ALC rates (14.4% vs. 21.5% over the previous three years).
AREAS FOR IMPROVEMENT ASSOCIATED CURRENT OR PLANNED ACTIVITIES
EffectivenessProportion of stroke/TIA patients who arrived at the ED by ambulance
Numerous activities are under way in the Waterloo Wellington LHIN to improve public awareness and education towards viewing stroke as a medical emergency, including outfitting EMS transport vehicles with the FAST logo. Stroke Month 2017 activities will focus on public awareness. The Central South Regional Stroke Network website continues to promote public awareness.
AppropriatenessProportion of ischemic stroke/TIA inpatients aged 65 and older with atrial fibrillation who filled a prescription for anticoagulant therapy within 90 days of discharge from acute care
Improvement initiatives for primary care providers are under way (e.g., accredited stroke prevention education sessions, access to stroke prevention services infographics, improvements to the primary care section of the stroke network website). The Grand River Hospital Meds to Beds program will facilitate improved anticoagulant therapy prescribing for patients with atrial fibrillation.
AppropriatenessProportion of ischemic stroke/TIA patients who received acute thrombolytic therapy (tPA)
Quality improvement initiatives that focus on the hyperacute management of stroke across the Central South Region (e.g., increased delivery and expedient administration of tPA, access to EVT) will drive improvement. Improved use of Telestroke in the Waterloo Wellington LHIN will also drive improvement on key hyperacute stroke care indicators.
AccessProportion of ischemic stroke/TIA patients discharged from the ED and referred to secondary prevention services
Educating ED staff on timely assessment of patients in stroke prevention clinics will improve the proportion of stroke/TIA patients referred to secondary prevention services after discharge from the ED. Quality improvement initiatives related to improving urgent access to secondary prevention services will lead to more timely intervention for stroke/TIA patients.
OPPORTUNITIES FOR LHIN AND STROKE NETWORK COLLABORATION
• The Waterloo Wellington LHIN continues to fully support the Central South Regional Stroke Network's efforts to facilitate the implementation of best practice stroke care across the continuum.
• The Waterloo Wellington LHIN and the Central South Regional Stroke Network are working collaboratively to improve hyperacute management of stroke patients, including administration of tPA and access to EVT.
• There is ongoing collaboration between the Central South Regional Stroke Network and the Waterloo Wellington LHIN on public awareness initiatives that emphasize stroke as a medical emergency.
CONTACTStefan Pagliuso Regional Director Central South Regional Stroke Network [email protected](905) 521-2100, ext. 44127

ONTARIO AND LHIN 2015/16 STROKE REPORT CARDS AND PROGRESS REPORTS
Institute for Clinical Evaluative Sciences36
ONTARIO LHINs MAP Waterloo Wellington Local Health Integration Network

Institute for Clinical Evaluative Sciences 37
ONTARIO AND LHIN 2015/16 STROKE REPORT CARDS AND PROGRESS REPORTS
ONTARIO STROKE REPORT CARD, 2015/16 Hamilton Niagara Haldimand Brant Local Health Integration Network
Poor performance1 Acceptable performance2 Exemplary performance3 Data or benchmark not available
Indicator No. Care Continuum Category Indicator4
LHIN FY 2015/16(2014/15)
Variance Within LHIN5
(Min–Max)Provincial
Benchmark6
High Performers7
Sub-LHIN/Facility LHIN
1 Public awareness and patient education Proportion of stroke/TIA patients who arrived at the ED by ambulance 60.8% (58.6%) 52.9–69.8% 65.3% Essex Sub-LHIN 1, 4
2 Prevention of stroke Annual age- and sex-adjusted inpatient admission rate for stroke/TIA (per 1,000 population) 1.4 (1.4) 1.0–4.4 1.1 Ottawa Centre Sub-LHIN 8, 11
3§ Prevention of stroke Risk-adjusted stroke/TIA mortality rate at 30 days (per 100 patients) 12.5 (11.3) 5.7–16.3 - - 11
4 Prevention of strokeProportion of ischemic stroke/TIA inpatients aged 65 and older with atrial fibrillation who filled a prescription for anticoagulant therapy within 90 days of discharge from acute care
79.6% (73.0%) 50.0–91.7% 85.5% South West York Region Sub-LHIN None
5 Prevention of stroke Proportion of ischemic stroke inpatients who received carotid imaging 78.7% (77.7%) 39.8–87.9% 91.7% Bluewater Health, Sarnia 7, 1
6 Acute stroke management Median door-to-needle time among patients who received acute thrombolytic therapy (tPA) (minutes)
37.0 (37.0) 31.0–137.0 33.0 Hamilton Health Sciences Corp., General None
7§ Acute stroke management Proportion of ischemic stroke patients who received acute thrombolytic therapy (tPA) 14.8% (13.0%) 7.7–25.0% 17.7% Hamilton Outer Core Sub-LHIN 11, 4
8§ Acute stroke management Proportion of stroke/TIA patients treated on a stroke unit8 at any time during their inpatient stay 51.5% (49.3%) 9.6–82.0% 78.7% Thunder Bay City Sub-LHIN 3
9 Prevention of stroke Proportion of ischemic stroke/TIA patients discharged from the ED and referred to secondary prevention services
85.4% (80.8%) 69.3–93.9% 94.4% London Health Sciences Centre, University Hospital None
10§ Acute stroke management Proportion of ALC days to total length of stay in acute care 21.9% (29.0%) 0.0–39.4% 8.2% Bluewater Health, Sarnia None
11§ Acute stroke management Proportion of acute stroke (excluding TIA) patients discharged from acute care and admitted to inpatient rehabilitation 35.4% (39.1%) 22.2–46.2% 47.8% Chatham-Kent Sub-LHIN 1
12§ Stroke rehabilitation Proportion of acute stroke (excluding TIA) patients with mild disability (AlphaFIM > 80) discharged home
67.8% (54.1%) 25.0–93.8% - - 14, 12
13§ Stroke rehabilitation Median number of days between stroke (excluding TIA) onset and admission to stroke inpatient rehabilitation 7.0 (9.0) 5.0–12.0 5.0 Southlake Regional Health Centre None
14§ Stroke rehabilitation Median number of minutes per day of direct therapy received by inpatient stroke rehabilitation patients 46.9 (-) 28.2–75.8 - - 3, 8
15§ Stroke rehabilitation Proportion of inpatient stroke rehabilitation patients achieving RPG active length of stay target 63.7% (49.6%) 53.8–72.0% 82.0% St. Joseph’s Health Centre, Guelph 3
16 Stroke rehabilitation Median FIM efficiency for moderate stroke in inpatient rehabilitation 1.0 (0.9) 0.8–1.2 1.5 St. Joseph’s Health Centre, Guelph 12, 3
17 Stroke rehabilitation Mean number of CCAC visits provided to stroke patients on discharge from inpatient acute care or inpatient rehabilitation in 2014/15–2015/16 8.6 (6.8) - 12.4 Waterloo Wellington CCAC 3, 10
18§ Stroke rehabilitation Proportion of patients admitted to inpatient rehabilitation with severe stroke (RPG 1100 or 1110) 32.1% (36.9%) 12.5–46.2% 58.7% St. Joseph’s Health Centre, Guelph None
19§ Reintegration Proportion of stroke/TIA patients discharged from acute care to LTC/CCC (excluding patients originating from LTC/CCC) 9.3% (10.5%) 0.0–22.2% 2.0% Urban Guelph Sub-LHIN None
20§ Reintegration Age- and sex-adjusted readmission rate at 30 days for patients with stroke/TIA for all diagnoses (per 100 patients) 6.6 (7.6) 0.0–14.1 - - None
Hospital Service Accountability Agreement indicator, 2015/16 - Data not available § Contributes to QBP performance
1 Performance below the 50th percentile.
2 Performance at or above the 50th percentile and greater than 5% absolute/relative difference from the benchmark.
3 Benchmark achieved or performance within 5% absolute/relative difference from the benchmark.
4 Facility-based analysis (excluding Indicators 1, 2, 4, 7, 8, 11 and 19) for patients aged 18–108. Indicators are based on CIHI data. Low rates are desired for Indicators 2, 3, 6, 10, 13, 19 and 20.
5 Excludes sub-LHINs or facilities with fewer than six patients.
6 Top benchmark achieved between 2013/14 and 2015/16. Benchmarks were calculated using the ABC methodology (Weissman NW et al. J Eval Clin Pract. 1999; 5(3):269–81) on sub-LHIN or facility data.
7 Sub-LHIN/facility: Highest performer among acute care institutions treating more than 100 stroke patients per year, rehabilitation facilities admitting more than 64 stroke patients per year, or sub-LHINs with at least 30 stroke patients per year. LHIN: Top two with exemplary performance.
8 The revised definition was developed with the consensus of Ontario Stroke Network regional directors (February 2014). There were 14 stroke units in 2012/13, 16 in 2013/14, 21 in 2014/15 and 28 in 2015/16.
Local Health Integration Networks (LHINs)1 Erie St. Clair 6 Mississauga Halton 11 Champlain2 South West 7 Toronto Central 12 North Simcoe Muskoka3 Waterloo Wellington 8 Central 13 North East4 Hamilton Niagara Haldimand Brant 9 Central East 14 North West5 Central West 10 South East

ONTARIO AND LHIN 2015/16 STROKE REPORT CARDS AND PROGRESS REPORTS
Institute for Clinical Evaluative Sciences38
STROKE PROGRESS REPORT, 2015/16 COMPARED TO 2012/13–2014/15 Hamilton Niagara Haldimand Brant Local Health Integration Network
Progressing well1 Progressing2 Not progressing3 Data not available
Indicator No. Care Continuum Category Indicator4
LHIN FY 2015/16(Previous
3-Year Average)
Variance Within LHIN5
2015/16 (2012/13) Greatest Improvement6
Min Max Sub-LHIN/Facility LHIN
1 Public awareness and patient education Proportion of stroke/TIA patients who arrived at the ED by ambulance 60.8% (58.8%) 52.9% (52.1%) 69.8% (78.9%) Woodbridge (Vaughan) Sub-LHIN None
2 Prevention of stroke Annual age- and sex-adjusted inpatient admission rate for stroke/TIA (per 1,000 population) 1.4 (1.4) 1.0 (1.1) 4.4 (2.1) Thunder Bay District Sub-LHIN 8
3§ Prevention of stroke Risk-adjusted7 stroke/TIA mortality rate at 30 days (per 100 patients) 12.8 (13.6) 6.2 (5.4) 17.8 (20.0) - 10, 11
4 Prevention of strokeProportion of ischemic stroke/TIA inpatients aged 65 and older with atrial fibrillation who filled a prescription for anticoagulant therapy within 90 days of discharge from acute care
79.6% (69.4%) 50.0% (36.4%) 91.7% (84.2%) Chatham-Kent Sub-LHIN 9, 4
5 Prevention of stroke Proportion of ischemic stroke inpatients who received carotid imaging 78.7% (72.9%) 39.8% (26.7%) 87.9% (81.9%) North Bay Regional Health Centre 2, 1
6 Acute stroke management Median door-to-needle time among patients who received acute thrombolytic therapy (tPA) (minutes)
37.0 (38.0) 31.0 (40.0) 137.0 (72.0) University Health Network 6, 7
7§ Acute stroke management Proportion of ischemic stroke patients who received acute thrombolytic therapy (tPA) 14.8% (12.7%) 7.7% (2.6%) 25.0% (21.2%) Timiskaming Sub-LHIN 4, 11
8§ Acute stroke management Proportion of stroke/TIA patients treated on a stroke unit8 at any time during their inpatient stay 51.5% (42.6%) 9.6% (0.0%) 82.0% (58.9%) Belleville Sub-LHIN 14, 2
9 Prevention of stroke Proportion of ischemic stroke/TIA patients discharged from the ED and referred to secondary prevention services
85.4% (-) 69.3% (-) 93.9% (-) - -
10§ Acute stroke management Proportion of ALC days to total length of stay in acute care 21.9% (25.9%) 0.0% (3.5%) 39.4% (38.1%) Rouge Valley Health System, Ajax 5, 3
11§ Acute stroke management Proportion of acute stroke (excluding TIA) patients discharged from acute care and admitted to inpatient rehabilitation 35.4% (37.0%) 22.2% (27.0%) 46.2% (43.6%) Central York Region Sub–LHIN 8, 3
12§ Stroke rehabilitation Proportion of acute stroke (excluding TIA) patients with mild disability (AlphaFIM > 80) discharged home
67.8% (-) 25.0% (-) 93.8% (-) - -
13§ Stroke rehabilitation Median number of days between stroke (excluding TIA) onset and admission to stroke inpatient rehabilitation 7.0 (9.0) 5.0 (8.0) 12.0 (10.0) William Osler Health System, Brampton 5, 8, 10
14§ Stroke rehabilitation Median number of minutes per day of direct therapy received by inpatient stroke rehabilitation patients 46.9 (-) 28.2 (-) 75.8 (-) - -
15§ Stroke rehabilitation Proportion of inpatient stroke rehabilitation patients achieving RPG active length of stay target 63.7% (43.7%) 53.8% (14.7%) 72.0% (63.3%) Hotel Dieu Shaver 3, 5
16 Stroke rehabilitation Median FIM efficiency for moderate stroke in inpatient rehabilitation 1.0 (0.8) 0.8 (0.6) 1.2 (1.1) Grand River Hospital Corp., Freeport 3, 12
17 Stroke rehabilitation Mean number of CCAC visits provided to stroke patients on discharge from inpatient acute care or inpatient rehabilitation in 2014/15–2015/16 8.6 (5.8) - - Waterloo Wellington CCAC 3, 6
18§ Stroke rehabilitation Proportion of patients admitted to inpatient rehabilitation with severe stroke (RPG 1100 or 1110) 32.1% (35.6%) 12.5% (23.5%) 46.2% (52.6%) Providence Healthcare 7
19§ Reintegration Proportion of stroke/TIA patients discharged from acute care to LTC/CCC (excluding patients originating from LTC/CCC) 9.3% (9.9%) 0.0% (0.0%) 22.2% (17.7%) Belleville Sub-LHIN 10, 1
20§ Reintegration Age- and sex-adjusted7 readmission rate at 30 days for patients with stroke/TIA for all diagnoses (per 100 patients) 6.7 (7.3) 0.0 (0.0) 14.2 (11.1) - None
Hospital Service Accountability Agreement indicator, 2015/16 - Data not available § Contributes to QBP performance
1 Statistically significant improvement.
2 Performance improving but not statistically significant.
3 No change or performance decline.
4 Facility-based analysis (excluding Indicators 1, 2, 4, 7, 8, 11 and 19) for patients aged 18–108. Indicators are based on CIHI data. Low rates are desired for Indicators 2, 3, 6, 10, 13, 19 and 20.
5 Excludes sub-LHINs or facilities with fewer than six patients.
6 Sub-LHIN/facility: Greatest improvement from 2012/13 among acute care institutions treating more than 100 stroke patients per year, rehabilitation facilities admitting more than 64 stroke patients per year, or sub-LHINs with at least 30 stroke patients per year. LHIN: Top two with greatest statistically significant improvement from 2012/13.
7 The 2012/13-2015/16 LHIN rate was used in calculating the LHIN risk-adjusted rate.
8 The revised definition was developed with the consensus of Ontario Stroke Network regional directors (February 2014). There were 14 stroke units in 2012/13, 16 in 2013/14, 21 in 2014/15 and 28 in 2015/16.
Local Health Integration Networks (LHINs)1 Erie St. Clair 6 Mississauga Halton 11 Champlain2 South West 7 Toronto Central 12 North Simcoe Muskoka3 Waterloo Wellington 8 Central 13 North East4 Hamilton Niagara Haldimand Brant 9 Central East 14 North West5 Central West 10 South East
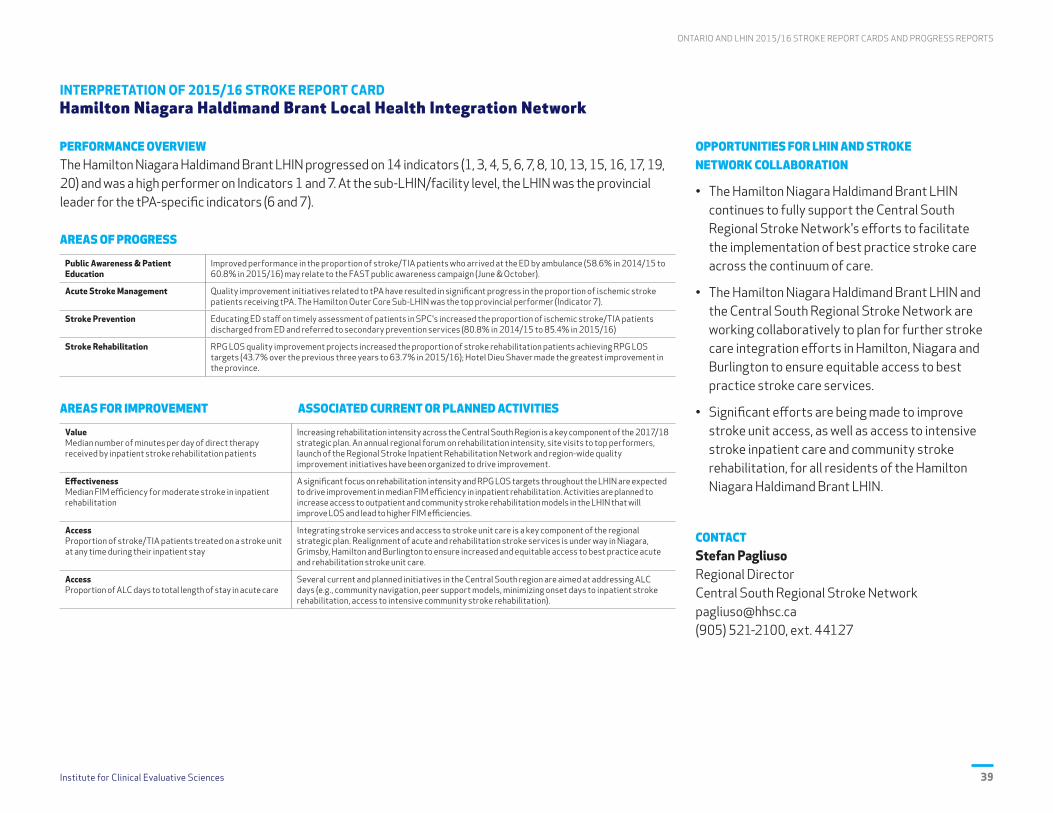
Institute for Clinical Evaluative Sciences 39
ONTARIO AND LHIN 2015/16 STROKE REPORT CARDS AND PROGRESS REPORTS
INTERPRETATION OF 2015/16 STROKE REPORT CARD Hamilton Niagara Haldimand Brant Local Health Integration Network
PERFORMANCE OVERVIEWThe Hamilton Niagara Haldimand Brant LHIN progressed on 14 indicators (1, 3, 4, 5, 6, 7, 8, 10, 13, 15, 16, 17, 19, 20) and was a high performer on Indicators 1 and 7. At the sub-LHIN/facility level, the LHIN was the provincial leader for the tPA-specific indicators (6 and 7).
AREAS OF PROGRESS
Public Awareness & Patient Education
Improved performance in the proportion of stroke/TIA patients who arrived at the ED by ambulance (58.6% in 2014/15 to 60.8% in 2015/16) may relate to the FAST public awareness campaign (June & October).
Acute Stroke Management Quality improvement initiatives related to tPA have resulted in significant progress in the proportion of ischemic stroke patients receiving tPA. The Hamilton Outer Core Sub-LHIN was the top provincial performer (Indicator 7).
Stroke Prevention Educating ED staff on timely assessment of patients in SPC's increased the proportion of ischemic stroke/TIA patients discharged from ED and referred to secondary prevention services (80.8% in 2014/15 to 85.4% in 2015/16)
Stroke Rehabilitation RPG LOS quality improvement projects increased the proportion of stroke rehabilitation patients achieving RPG LOS targets (43.7% over the previous three years to 63.7% in 2015/16); Hotel Dieu Shaver made the greatest improvement in the province.
AREAS FOR IMPROVEMENT ASSOCIATED CURRENT OR PLANNED ACTIVITIES
ValueMedian number of minutes per day of direct therapy received by inpatient stroke rehabilitation patients
Increasing rehabilitation intensity across the Central South Region is a key component of the 2017/18 strategic plan. An annual regional forum on rehabilitation intensity, site visits to top performers, launch of the Regional Stroke Inpatient Rehabilitation Network and region-wide quality improvement initiatives have been organized to drive improvement.
EffectivenessMedian FIM efficiency for moderate stroke in inpatient rehabilitation
A significant focus on rehabilitation intensity and RPG LOS targets throughout the LHIN are expected to drive improvement in median FIM efficiency in inpatient rehabilitation. Activities are planned to increase access to outpatient and community stroke rehabilitation models in the LHIN that will improve LOS and lead to higher FIM efficiencies.
AccessProportion of stroke/TIA patients treated on a stroke unit at any time during their inpatient stay
Integrating stroke services and access to stroke unit care is a key component of the regional strategic plan. Realignment of acute and rehabilitation stroke services is under way in Niagara, Grimsby, Hamilton and Burlington to ensure increased and equitable access to best practice acute and rehabilitation stroke unit care.
AccessProportion of ALC days to total length of stay in acute care
Several current and planned initiatives in the Central South region are aimed at addressing ALC days (e.g., community navigation, peer support models, minimizing onset days to inpatient stroke rehabilitation, access to intensive community stroke rehabilitation).
OPPORTUNITIES FOR LHIN AND STROKE NETWORK COLLABORATION
• The Hamilton Niagara Haldimand Brant LHIN continues to fully support the Central South Regional Stroke Network's efforts to facilitate the implementation of best practice stroke care across the continuum of care.
• The Hamilton Niagara Haldimand Brant LHIN and the Central South Regional Stroke Network are working collaboratively to plan for further stroke care integration efforts in Hamilton, Niagara and Burlington to ensure equitable access to best practice stroke care services.
• Significant efforts are being made to improve stroke unit access, as well as access to intensive stroke inpatient care and community stroke rehabilitation, for all residents of the Hamilton Niagara Haldimand Brant LHIN.
CONTACTStefan Pagliuso Regional Director Central South Regional Stroke Network [email protected](905) 521-2100, ext. 44127

ONTARIO AND LHIN 2015/16 STROKE REPORT CARDS AND PROGRESS REPORTS
Institute for Clinical Evaluative Sciences40
ONTARIO LHINs MAP Hamilton Niagara Haldimand Brant Local Health Integration Network

Institute for Clinical Evaluative Sciences 41
ONTARIO AND LHIN 2015/16 STROKE REPORT CARDS AND PROGRESS REPORTS
ONTARIO STROKE REPORT CARD, 2015/16 Central West Local Health Integration Network
Poor performance1 Acceptable performance2 Exemplary performance3 Data or benchmark not available
Indicator No. Care Continuum Category Indicator4
LHIN FY 2015/16(2014/15)
Variance Within LHIN5
(Min–Max)Provincial
Benchmark6
High Performers7
Sub-LHIN/Facility LHIN
1 Public awareness and patient education Proportion of stroke/TIA patients who arrived at the ED by ambulance 54.2% (53.1%) 47.0–72.9% 65.3% Essex Sub-LHIN 1, 4
2 Prevention of stroke Annual age- and sex-adjusted inpatient admission rate for stroke/TIA (per 1,000 population) 1.4 (1.4) 1.4–2.1 1.1 Ottawa Centre Sub-LHIN 8, 11
3§ Prevention of stroke Risk-adjusted stroke/TIA mortality rate at 30 days (per 100 patients) 12.8 (10.1) 12.2–15.5 - - 11
4 Prevention of strokeProportion of ischemic stroke/TIA inpatients aged 65 and older with atrial fibrillation who filled a prescription for anticoagulant therapy within 90 days of discharge from acute care
68.5% (71.8%) 42.9–81.3% 85.5% South West York Region Sub-LHIN None
5 Prevention of stroke Proportion of ischemic stroke inpatients who received carotid imaging 85.9% (85.5%) 75.9–94.3% 91.7% Bluewater Health, Sarnia 7, 1
6 Acute stroke management Median door-to-needle time among patients who received acute thrombolytic therapy (tPA) (minutes)
- (-) - 33.0 Hamilton Health Sciences Corp., General None
7§ Acute stroke management Proportion of ischemic stroke patients who received acute thrombolytic therapy (tPA) 12.2% (10.1%) 9.7–13.2% 17.7% Hamilton Outer Core Sub-LHIN 11, 4
8§ Acute stroke management Proportion of stroke/TIA patients treated on a stroke unit8 at any time during their inpatient stay 19.2% (16.5%) 10.6–23.3% 78.7% Thunder Bay City Sub-LHIN 3
9 Prevention of stroke Proportion of ischemic stroke/TIA patients discharged from the ED and referred to secondary prevention services
38.0% (42.4%) 33.7–54.3% 94.4% London Health Sciences Centre, University Hospital None
10§ Acute stroke management Proportion of ALC days to total length of stay in acute care 15.0% (25.3%) 1.8–22.7% 8.2% Bluewater Health, Sarnia None
11§ Acute stroke management Proportion of acute stroke (excluding TIA) patients discharged from acute care and admitted to inpatient rehabilitation 30.6% (35.8%) 14.8–37.5% 47.8% Chatham-Kent Sub-LHIN 1
12§ Stroke rehabilitation Proportion of acute stroke (excluding TIA) patients with mild disability (AlphaFIM > 80) discharged home
58.9% (71.1%) 52.5–67.2% - - 14, 12
13§ Stroke rehabilitation Median number of days between stroke (excluding TIA) onset and admission to stroke inpatient rehabilitation 11.0 (14.0) 10.5–17.0 5.0 Southlake Regional Health Centre None
14§ Stroke rehabilitation Median number of minutes per day of direct therapy received by inpatient stroke rehabilitation patients 15.3 (-) 15.3–19.0 - - 3, 8
15§ Stroke rehabilitation Proportion of inpatient stroke rehabilitation patients achieving RPG active length of stay target 50.0% (39.7%) 30.8–51.5% 82.0% St. Joseph’s Health Centre, Guelph 3
16 Stroke rehabilitation Median FIM efficiency for moderate stroke in inpatient rehabilitation 0.9 (0.8) 0.9–0.9 1.5 St. Joseph’s Health Centre, Guelph 12, 3
17 Stroke rehabilitation Mean number of CCAC visits provided to stroke patients on discharge from inpatient acute care or inpatient rehabilitation in 2014/15–2015/16 6.1 (5.6) - 12.4 Waterloo Wellington CCAC 3, 10
18§ Stroke rehabilitation Proportion of patients admitted to inpatient rehabilitation with severe stroke (RPG 1100 or 1110) 44.0% (41.7%) 40.8–85.7% 58.7% St. Joseph’s Health Centre, Guelph None
19§ Reintegration Proportion of stroke/TIA patients discharged from acute care to LTC/CCC (excluding patients originating from LTC/CCC) 4.6% (8.2%) 0.0–18.3% 2.0% Urban Guelph Sub-LHIN None
20§ Reintegration Age- and sex-adjusted readmission rate at 30 days for patients with stroke/TIA for all diagnoses (per 100 patients) 7.4 (7.9) 5.6–8.9 - - None
Hospital Service Accountability Agreement indicator, 2015/16 - Data not available § Contributes to QBP performance
1 Performance below the 50th percentile.
2 Performance at or above the 50th percentile and greater than 5% absolute/relative difference from the benchmark.
3 Benchmark achieved or performance within 5% absolute/relative difference from the benchmark.
4 Facility-based analysis (excluding Indicators 1, 2, 4, 7, 8, 11 and 19) for patients aged 18–108. Indicators are based on CIHI data. Low rates are desired for Indicators 2, 3, 6, 10, 13, 19 and 20.
5 Excludes sub-LHINs or facilities with fewer than six patients.
6 Top benchmark achieved between 2013/14 and 2015/16. Benchmarks were calculated using the ABC methodology (Weissman NW et al. J Eval Clin Pract. 1999; 5(3):269–81) on sub-LHIN or facility data.
7 Sub-LHIN/facility: Highest performer among acute care institutions treating more than 100 stroke patients per year, rehabilitation facilities admitting more than 64 stroke patients per year, or sub-LHINs with at least 30 stroke patients per year. LHIN: Top two with exemplary performance.
8 The revised definition was developed with the consensus of Ontario Stroke Network regional directors (February 2014). There were 14 stroke units in 2012/13, 16 in 2013/14, 21 in 2014/15 and 28 in 2015/16.
Local Health Integration Networks (LHINs)1 Erie St. Clair 6 Mississauga Halton 11 Champlain2 South West 7 Toronto Central 12 North Simcoe Muskoka3 Waterloo Wellington 8 Central 13 North East4 Hamilton Niagara Haldimand Brant 9 Central East 14 North West5 Central West 10 South East

ONTARIO AND LHIN 2015/16 STROKE REPORT CARDS AND PROGRESS REPORTS
Institute for Clinical Evaluative Sciences42
STROKE PROGRESS REPORT, 2015/16 COMPARED TO 2012/13–2014/15 Central West Local Health Integration Network
Progressing well1 Progressing2 Not progressing3 Data not available
Indicator No. Care Continuum Category Indicator4
LHIN FY 2015/16(Previous
3-Year Average)
Variance Within LHIN5
2015/16 (2012/13) Greatest Improvement6
Min Max Sub-LHIN/Facility LHIN
1 Public awareness and patient education Proportion of stroke/TIA patients who arrived at the ED by ambulance 54.2% (53.6%) 47.0% (46.7%) 72.9% (54.4%) Woodbridge (Vaughan) Sub-LHIN None
2 Prevention of stroke Annual age- and sex-adjusted inpatient admission rate for stroke/TIA (per 1,000 population) 1.4 (1.3) 1.4 (1.1) 2.1 (1.8) Thunder Bay District Sub-LHIN 8
3§ Prevention of stroke Risk-adjusted7 stroke/TIA mortality rate at 30 days (per 100 patients) 12.5 (10.5) 11.5 (6.0) 13.8 (7.7) - 10, 11
4 Prevention of strokeProportion of ischemic stroke/TIA inpatients aged 65 and older with atrial fibrillation who filled a prescription for anticoagulant therapy within 90 days of discharge from acute care
68.5% (67.5%) 42.9% (28.6%) 81.3% (71.4%) Chatham-Kent Sub-LHIN 9, 4
5 Prevention of stroke Proportion of ischemic stroke inpatients who received carotid imaging 85.9% (85.2%) 75.9% (74.3%) 94.3% (88.1%) North Bay Regional Health Centre 2, 1
6 Acute stroke management Median door-to-needle time among patients who received acute thrombolytic therapy (tPA) (minutes)
- - - University Health Network 6, 7
7§ Acute stroke management Proportion of ischemic stroke patients who received acute thrombolytic therapy (tPA) 12.2% (9.9%) 9.7% (4.6%) 13.2% (21.9%) Timiskaming Sub-LHIN 4, 11
8§ Acute stroke management Proportion of stroke/TIA patients treated on a stroke unit8 at any time during their inpatient stay 19.2% (15.9%) 10.6% (2.6%) 23.3% (20.4%) Belleville Sub-LHIN 14, 2
9 Prevention of stroke Proportion of ischemic stroke/TIA patients discharged from the ED and referred to secondary prevention services
38.0% (-) 33.7% (-) 54.3% (-) - -
10§ Acute stroke management Proportion of ALC days to total length of stay in acute care 15.0% (27.5%) 1.8% (2.6%) 22.7% (36.1%) Rouge Valley Health System, Ajax 5, 3
11§ Acute stroke management Proportion of acute stroke (excluding TIA) patients discharged from acute care and admitted to inpatient rehabilitation 30.6% (33.5%) 14.8% (11.1%) 37.5% (31.9%) Central York Region Sub-LHIN 8, 3
12§ Stroke rehabilitation Proportion of acute stroke (excluding TIA) patients with mild disability (AlphaFIM > 80) discharged home
58.9% (-) 52.5% (-) 67.2% (-) - -
13§ Stroke rehabilitation Median number of days between stroke (excluding TIA) onset and admission to stroke inpatient rehabilitation 11.0 (16.0) 10.5 (17.0) 17.0 (23.0) William Osler Health System, Brampton 5, 8, 10
14§ Stroke rehabilitation Median number of minutes per day of direct therapy received by inpatient stroke rehabilitation patients 15.3 (-) 15.3 (-) 19.0 (-) - -
15§ Stroke rehabilitation Proportion of inpatient stroke rehabilitation patients achieving RPG active length of stay target 50.0% (22.6%) 30.8% (0.0%) 51.5% (14.2%) Hotel Dieu Shaver 3, 5
16 Stroke rehabilitation Median FIM efficiency for moderate stroke in inpatient rehabilitation 0.9 (0.6) 0.9 (0.1) 0.9 (0.4) Grand River Hospital Corp., Freeport 3, 12
17 Stroke rehabilitation Mean number of CCAC visits provided to stroke patients on discharge from inpatient acute care or inpatient rehabilitation in 2014/15–2015/16 6.1 (5.7) - - Waterloo Wellington CCAC 3, 6
18§ Stroke rehabilitation Proportion of patients admitted to inpatient rehabilitation with severe stroke (RPG 1100 or 1110) 44.0% (37.6%) 40.8% (23.1%) 85.7% (56.3%) Providence Healthcare 7
19§ Reintegration Proportion of stroke/TIA patients discharged from acute care to LTC/CCC (excluding patients originating from LTC/CCC) 4.6% (8.2%) 0.0% (5.3%) 18.3% (17.5%) Belleville Sub-LHIN 10, 1
20§ Reintegration Age- and sex-adjusted7 readmission rate at 30 days for patients with stroke/TIA for all diagnoses (per 100 patients) 7.4 (8.0) 5.6 (7.6) 8.6 (12.6) - None
Hospital Service Accountability Agreement indicator, 2015/16 - Data not available § Contributes to QBP performance
1 Statistically significant improvement.
2 Performance improving but not statistically significant.
3 No change or performance decline.
4 Facility-based analysis (excluding Indicators 1, 2, 4, 7, 8, 11 and 19) for patients aged 18–108. Indicators are based on CIHI data. Low rates are desired for Indicators 2, 3, 6, 10, 13, 19 and 20.
5 Excludes sub-LHINs or facilities with fewer than six patients.
6 Sub-LHIN/facility: Greatest improvement from 2012/13 among acute care institutions treating more than 100 stroke patients per year, rehabilitation facilities admitting more than 64 stroke patients per year, or sub-LHINs with at least 30 stroke patients per year. LHIN: Top two with greatest statistically significant improvement from 2012/13.
7 The 2012/13-2015/16 LHIN rate was used in calculating the LHIN risk-adjusted rate.
8 The revised definition was developed with the consensus of Ontario Stroke Network regional directors (February 2014). There were 14 stroke units in 2012/13, 16 in 2013/14, 21 in 2014/15 and 28 in 2015/16.
Local Health Integration Networks (LHINs)1 Erie St. Clair 6 Mississauga Halton 11 Champlain2 South West 7 Toronto Central 12 North Simcoe Muskoka3 Waterloo Wellington 8 Central 13 North East4 Hamilton Niagara Haldimand Brant 9 Central East 14 North West5 Central West 10 South East

Institute for Clinical Evaluative Sciences 43
ONTARIO AND LHIN 2015/16 STROKE REPORT CARDS AND PROGRESS REPORTS
INTERPRETATION OF 2015/16 STROKE REPORT CARD Central West Local Health Integration Network
PERFORMANCE OVERVIEWThe Central West LHIN progressed on 13 of the 16 indicators. The greatest progress continues to be in stroke rehabilitation. Opportunities remain for establishing a stroke unit at William Osler Health System (WOHS) and increasing community services in the LHIN.
AREAS OF PROGRESS
Acute Stroke Management Proportion of ALC days to total LOS in acute care decreased from 27.5% in the previous three years to 15.0% in 2015/16. This was a statistically significant improvement.
Stroke Rehabilitation Median number of days between stroke onset and admission to rehabilitation decreased from 16.0 days in the previous three years to 11.0 days in 2015/16. Timely transition from acute care to rehabilitation has improved.
Stroke Rehabilitation Proportion of stroke rehabilitation inpatients achieving LOS targets more than doubled, from the 22.6% in the previous three years to 50.0% in 2015/16.
Community Reintegration There was a significant decline in the proportion of stroke/TIA patients discharged to CCC/LTC following acute stroke; from 8.2% in the previous three years to 4.6% in 2015/16.
AREAS FOR IMPROVEMENT ASSOCIATED CURRENT OR PLANNED ACTIVITIES
AccessStroke unit care
There are no stroke units in the Central West LHIN. Work is under way at WOHS to establish a stroke unit; ideally at both sites. This is a priority due to stroke QBP and the introduction of EVT, where all stroke patients receiving EVT are to be repatriated to a stroke unit.
AccessPrevention of stroke
The proportion of stroke/TIA patients discharged from the ED and referred to secondary prevention services (new indicator) decreased from 42.4% in 2014/15 to 38.0% in 2015/16; the provincial benchmark is 94.4%. Education is planned with physicians in the ED and health records coders to ensure that this information is documented in, and coded from, patient charts.
AccessAdmission to inpatient rehabilitation
Although the wait time for inpatient rehabilitation decreased from 14.0 to 11.0 days, the proportion of stroke patients admitted to inpatient rehabilitation also decreased from 35.8% to 30.6%. Evaluating the AlphaFIM scores in acute care will help to understand the decline in admission to inpatient rehabilitation.
AccessCCAC rehabilitation visits
The mean number of CCAC rehabilitation visits in the Central West LHIN (6.1) is less than half the provincial benchmark (12.4). Discussion with the LHIN regarding the need for outpatient/community stroke rehabilitation services is ongoing.
OPPORTUNITIES FOR LHIN AND STROKE NETWORK COLLABORATION
• The West GTA Stroke Network and the Central West LHIN continue to work collaboratively to improve stroke care throughout the continuum of care.
• Following the launch of Ontario's Quality-Based Procedures: Clinical Handbook for Stroke, the creation of a stroke unit at WOHS (ideally at both the Brampton and Etobicoke sites), and efforts to increase community resources to enable reintegration of the stroke population, remain priorities.
• The emphasis on decreasing LOS in both acute and inpatient rehabilitation has made the enhancement of community services for stroke patients a necessary priority.
CONTACTNicole PageauRegional DirectorWest GTA Stroke [email protected] (416) 409-4095

ONTARIO AND LHIN 2015/16 STROKE REPORT CARDS AND PROGRESS REPORTS
Institute for Clinical Evaluative Sciences44
ONTARIO LHINs MAP Central West Local Health Integration Network
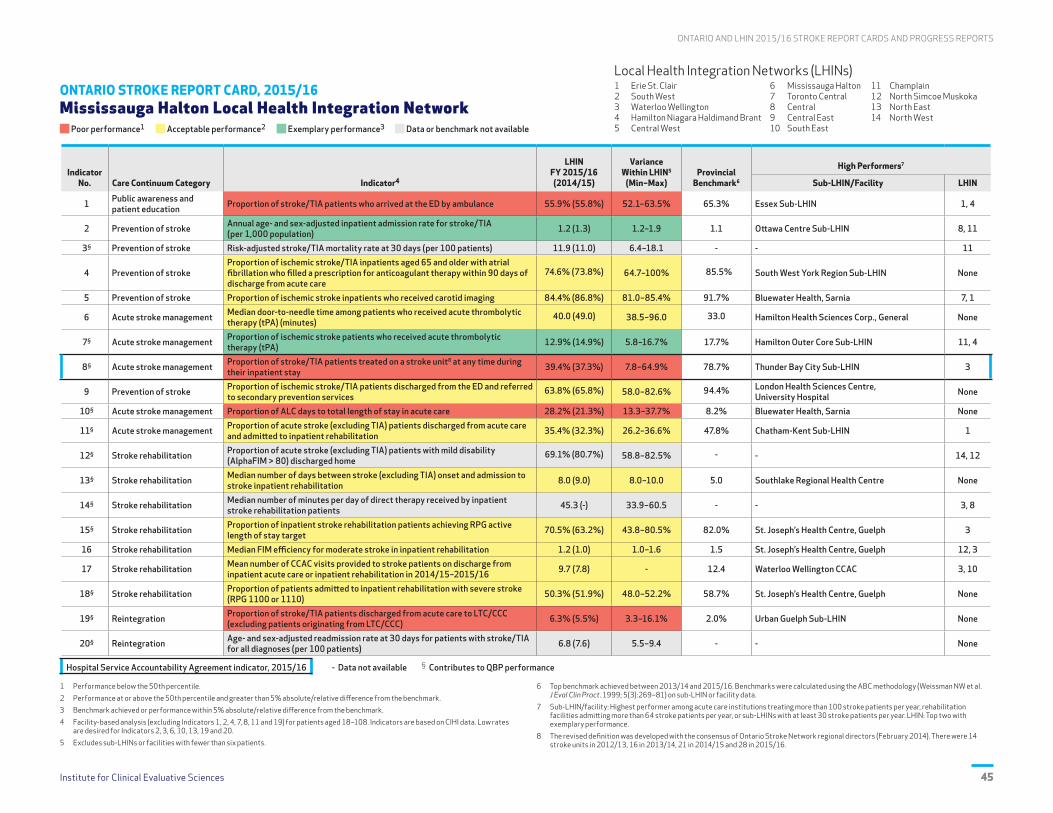
Institute for Clinical Evaluative Sciences 45
ONTARIO AND LHIN 2015/16 STROKE REPORT CARDS AND PROGRESS REPORTS
ONTARIO STROKE REPORT CARD, 2015/16 Mississauga Halton Local Health Integration Network
Poor performance1 Acceptable performance2 Exemplary performance3 Data or benchmark not available
Indicator No. Care Continuum Category Indicator4
LHIN FY 2015/16(2014/15)
Variance Within LHIN5
(Min–Max)Provincial
Benchmark6
High Performers7
Sub-LHIN/Facility LHIN
1 Public awareness and patient education Proportion of stroke/TIA patients who arrived at the ED by ambulance 55.9% (55.8%) 52.1–63.5% 65.3% Essex Sub-LHIN 1, 4
2 Prevention of stroke Annual age- and sex-adjusted inpatient admission rate for stroke/TIA (per 1,000 population) 1.2 (1.3) 1.2–1.9 1.1 Ottawa Centre Sub-LHIN 8, 11
3§ Prevention of stroke Risk-adjusted stroke/TIA mortality rate at 30 days (per 100 patients) 11.9 (11.0) 6.4–18.1 - - 11
4 Prevention of strokeProportion of ischemic stroke/TIA inpatients aged 65 and older with atrial fibrillation who filled a prescription for anticoagulant therapy within 90 days of discharge from acute care
74.6% (73.8%) 64.7–100% 85.5% South West York Region Sub-LHIN None
5 Prevention of stroke Proportion of ischemic stroke inpatients who received carotid imaging 84.4% (86.8%) 81.0–85.4% 91.7% Bluewater Health, Sarnia 7, 1
6 Acute stroke management Median door-to-needle time among patients who received acute thrombolytic therapy (tPA) (minutes)
40.0 (49.0) 38.5–96.0 33.0 Hamilton Health Sciences Corp., General None
7§ Acute stroke management Proportion of ischemic stroke patients who received acute thrombolytic therapy (tPA) 12.9% (14.9%) 5.8–16.7% 17.7% Hamilton Outer Core Sub-LHIN 11, 4
8§ Acute stroke management Proportion of stroke/TIA patients treated on a stroke unit8 at any time during their inpatient stay 39.4% (37.3%) 7.8–64.9% 78.7% Thunder Bay City Sub-LHIN 3
9 Prevention of stroke Proportion of ischemic stroke/TIA patients discharged from the ED and referred to secondary prevention services
63.8% (65.8%) 58.0–82.6% 94.4% London Health Sciences Centre, University Hospital None
10§ Acute stroke management Proportion of ALC days to total length of stay in acute care 28.2% (21.3%) 13.3–37.7% 8.2% Bluewater Health, Sarnia None
11§ Acute stroke management Proportion of acute stroke (excluding TIA) patients discharged from acute care and admitted to inpatient rehabilitation 35.4% (32.3%) 26.2–36.6% 47.8% Chatham-Kent Sub-LHIN 1
12§ Stroke rehabilitation Proportion of acute stroke (excluding TIA) patients with mild disability (AlphaFIM > 80) discharged home
69.1% (80.7%) 58.8–82.5% - - 14, 12
13§ Stroke rehabilitation Median number of days between stroke (excluding TIA) onset and admission to stroke inpatient rehabilitation 8.0 (9.0) 8.0–10.0 5.0 Southlake Regional Health Centre None
14§ Stroke rehabilitation Median number of minutes per day of direct therapy received by inpatient stroke rehabilitation patients 45.3 (-) 33.9–60.5 - - 3, 8
15§ Stroke rehabilitation Proportion of inpatient stroke rehabilitation patients achieving RPG active length of stay target 70.5% (63.2%) 43.8–80.5% 82.0% St. Joseph’s Health Centre, Guelph 3
16 Stroke rehabilitation Median FIM efficiency for moderate stroke in inpatient rehabilitation 1.2 (1.0) 1.0–1.6 1.5 St. Joseph’s Health Centre, Guelph 12, 3
17 Stroke rehabilitation Mean number of CCAC visits provided to stroke patients on discharge from inpatient acute care or inpatient rehabilitation in 2014/15–2015/16 9.7 (7.8) - 12.4 Waterloo Wellington CCAC 3, 10
18§ Stroke rehabilitation Proportion of patients admitted to inpatient rehabilitation with severe stroke (RPG 1100 or 1110) 50.3% (51.9%) 48.0–52.2% 58.7% St. Joseph’s Health Centre, Guelph None
19§ Reintegration Proportion of stroke/TIA patients discharged from acute care to LTC/CCC (excluding patients originating from LTC/CCC) 6.3% (5.5%) 3.3–16.1% 2.0% Urban Guelph Sub-LHIN None
20§ Reintegration Age- and sex-adjusted readmission rate at 30 days for patients with stroke/TIA for all diagnoses (per 100 patients) 6.8 (7.6) 5.5–9.4 - - None
Hospital Service Accountability Agreement indicator, 2015/16 - Data not available § Contributes to QBP performance
1 Performance below the 50th percentile.
2 Performance at or above the 50th percentile and greater than 5% absolute/relative difference from the benchmark.
3 Benchmark achieved or performance within 5% absolute/relative difference from the benchmark.
4 Facility-based analysis (excluding Indicators 1, 2, 4, 7, 8, 11 and 19) for patients aged 18–108. Indicators are based on CIHI data. Low rates are desired for Indicators 2, 3, 6, 10, 13, 19 and 20.
5 Excludes sub-LHINs or facilities with fewer than six patients.
6 Top benchmark achieved between 2013/14 and 2015/16. Benchmarks were calculated using the ABC methodology (Weissman NW et al. J Eval Clin Pract. 1999; 5(3):269–81) on sub-LHIN or facility data.
7 Sub-LHIN/facility: Highest performer among acute care institutions treating more than 100 stroke patients per year, rehabilitation facilities admitting more than 64 stroke patients per year, or sub-LHINs with at least 30 stroke patients per year. LHIN: Top two with exemplary performance.
8 The revised definition was developed with the consensus of Ontario Stroke Network regional directors (February 2014). There were 14 stroke units in 2012/13, 16 in 2013/14, 21 in 2014/15 and 28 in 2015/16.
Local Health Integration Networks (LHINs)1 Erie St. Clair 6 Mississauga Halton 11 Champlain2 South West 7 Toronto Central 12 North Simcoe Muskoka3 Waterloo Wellington 8 Central 13 North East4 Hamilton Niagara Haldimand Brant 9 Central East 14 North West5 Central West 10 South East

ONTARIO AND LHIN 2015/16 STROKE REPORT CARDS AND PROGRESS REPORTS
Institute for Clinical Evaluative Sciences46
STROKE PROGRESS REPORT, 2015/16 COMPARED TO 2012/13–2014/15 Mississauga Halton Local Health Integration Network
Progressing well1 Progressing2 Not progressing3 Data not available
Indicator No. Care Continuum Category Indicator4
LHIN FY 2015/16(Previous
3-Year Average)
Variance Within LHIN5
2015/16 (2012/13) Greatest Improvement6
Min Max Sub-LHIN/Facility LHIN
1 Public awareness and patient education Proportion of stroke/TIA patients who arrived at the ED by ambulance 55.9% (57.1%) 52.1% (43.1%) 63.5% (64.4%) Woodbridge (Vaughan) Sub-LHIN None
2 Prevention of stroke Annual age- and sex-adjusted inpatient admission rate for stroke/TIA (per 1,000 population) 1.2 (1.2) 1.2 (1.0) 1.9 (1.7) Thunder Bay District Sub-LHIN 8
3§ Prevention of stroke Risk-adjusted7 stroke/TIA mortality rate at 30 days (per 100 patients) 12.1 (12.7) 6.6 (10.1) 18.9 (22.7) - 10, 11
4 Prevention of strokeProportion of ischemic stroke/TIA inpatients aged 65 and older with atrial fibrillation who filled a prescription for anticoagulant therapy within 90 days of discharge from acute care
74.6% (71.5%) 64.7% (37.5%) 100% (79.3%) Chatham-Kent Sub-LHIN 9, 4
5 Prevention of stroke Proportion of ischemic stroke inpatients who received carotid imaging 84.4% (83.1%) 81.0% (66.7%) 85.4% (88.2%) North Bay Regional Health Centre 2, 1
6 Acute stroke management Median door-to-needle time among patients who received acute thrombolytic therapy (tPA) (minutes)
40.0 (60.0) 38.5 (65.0) 96.0 (65.0) University Health Network 6, 7
7§ Acute stroke management Proportion of ischemic stroke patients who received acute thrombolytic therapy (tPA) 12.9% (12.2%) 5.8% (8.1%) 16.7% (17.6%) Timiskaming Sub-LHIN 4, 11
8§ Acute stroke management Proportion of stroke/TIA patients treated on a stroke unit8 at any time during their inpatient stay 39.4% (34.9%) 7.8% (6.5%) 64.9% (54.1%) Belleville Sub-LHIN 14, 2
9 Prevention of stroke Proportion of ischemic stroke/TIA patients discharged from the ED and referred to secondary prevention services
63.8% (-) 58.0% (-) 82.6% (-) - -
10§ Acute stroke management Proportion of ALC days to total length of stay in acute care 28.2% (23.1%) 13.3% (7.0%) 37.7% (27.2%) Rouge Valley Health System, Ajax 5, 3
11§ Acute stroke management Proportion of acute stroke (excluding TIA) patients discharged from acute care and admitted to inpatient rehabilitation 35.4% (33.5%) 26.2% (16.7%) 36.6% (40.8%) Central York Region Sub-LHIN 8, 3
12§ Stroke rehabilitation Proportion of acute stroke (excluding TIA) patients with mild disability (AlphaFIM > 80) discharged home
69.1% (-) 58.8% (-) 82.5% (-) - -
13§ Stroke rehabilitation Median number of days between stroke (excluding TIA) onset and admission to stroke inpatient rehabilitation 8.0 (9.0) 8.0 (8.5) 10.0 (25.0) William Osler Health System, Brampton 5, 8, 10
14§ Stroke rehabilitation Median number of minutes per day of direct therapy received by inpatient stroke rehabilitation patients 45.3 (-) 33.9 (-) 60.5 (-) - -
15§ Stroke rehabilitation Proportion of inpatient stroke rehabilitation patients achieving RPG active length of stay target 70.5% (60.0%) 43.8% (31.3%) 80.5% (79.8%) Hotel Dieu Shaver 3, 5
16 Stroke rehabilitation Median FIM efficiency for moderate stroke in inpatient rehabilitation 1.2 (1.0) 1.0 (0.8) 1.6 (1.4) Grand River Hospital Corp., Freeport 3, 12
17 Stroke rehabilitation Mean number of CCAC visits provided to stroke patients on discharge from inpatient acute care or inpatient rehabilitation in 2014/15–2015/16 9.7 (6.4) - - Waterloo Wellington CCAC 3, 6
18§ Stroke rehabilitation Proportion of patients admitted to inpatient rehabilitation with severe stroke (RPG 1100 or 1110) 50.3% (49.2%) 48.0% (43.1%) 52.2% (47.6%) Providence Healthcare 7
19§ Reintegration Proportion of stroke/TIA patients discharged from acute care to LTC/CCC (excluding patients originating from LTC/CCC) 6.3% (7.2%) 3.3% (1.6%) 16.1% (14.0%) Belleville Sub-LHIN 10, 1
20§ Reintegration Age- and sex-adjusted7 readmission rate at 30 days for patients with stroke/TIA for all diagnoses (per 100 patients) 6.9 (7.7) 5.4 (0.0) 9.5 (10.4) - None
Hospital Service Accountability Agreement indicator, 2015/16 - Data not available § Contributes to QBP performance
1 Statistically significant improvement.
2 Performance improving but not statistically significant.
3 No change or performance decline.
4 Facility-based analysis (excluding Indicators 1, 2, 4, 7, 8, 11 and 19) for patients aged 18–108. Indicators are based on CIHI data. Low rates are desired for Indicators 2, 3, 6, 10, 13, 19 and 20.
5 Excludes sub-LHINs or facilities with fewer than six patients.
6 Sub-LHIN/facility: Greatest improvement from 2012/13 among acute care institutions treating more than 100 stroke patients per year, rehabilitation facilities admitting more than 64 stroke patients per year, or sub-LHINs with at least 30 stroke patients per year. LHIN: Top two with greatest statistically significant improvement from 2012/13.
7 The 2012/13-2015/16 LHIN rate was used in calculating the LHIN risk-adjusted rate.
8 The revised definition was developed with the consensus of Ontario Stroke Network regional directors (February 2014). There were 14 stroke units in 2012/13, 16 in 2013/14, 21 in 2014/15 and 28 in 2015/16.
Local Health Integration Networks (LHINs)1 Erie St. Clair 6 Mississauga Halton 11 Champlain2 South West 7 Toronto Central 12 North Simcoe Muskoka3 Waterloo Wellington 8 Central 13 North East4 Hamilton Niagara Haldimand Brant 9 Central East 14 North West5 Central West 10 South East

Institute for Clinical Evaluative Sciences 47
ONTARIO AND LHIN 2015/16 STROKE REPORT CARDS AND PROGRESS REPORTS
INTERPRETATION OF 2015/16 STROKE REPORT CARD Mississauga Halton Local Health Integration Network
PERFORMANCE OVERVIEWThe Mississauga Halton LHIN progressed on 14/17 indicators compared to the previous three years, with the greatest improvements in DTN time for tPA and LOS targets for inpatient rehabilitation. ALC days in acute care remain the biggest challenge for the LHIN.
AREAS OF PROGRESS
Acute Stroke Management The median DTN time was 40.0 minutes in 2015/16; a twenty-minute reduction from the previous three years. The provincial benchmark is 33 minutes.
Acute Stroke Management Access to a stroke unit remained low (39.4%) but there was statistically significant improvement from the previous three years. In August 2016, another stroke unit opened at the Oakville site of Halton Healthcare Services.
Stroke Rehabilitation In 2015/16, 70.5% of inpatient stroke rehabilitation patients achieved the RPG LOS target, compared to 60.0% in the previous three years.
Community Reintegration There was an increase in the number of CCAC visits provided to stroke patients on discharge from inpatient acute care or inpatient rehabilitation (9.7 in 2015/16 vs. 6.4 in the previous three years).
AREAS FOR IMPROVEMENT ASSOCIATED CURRENT OR PLANNED ACTIVITIES
AppropriatenessPublic awareness and patient education
The proportion of stroke/TIA patients who arrived at the ED by ambulance decreased to 55.9% (from 57.1% in the previous three years). The West GTA Stroke Network is committed to supporting public education opportunities to raise awareness of the need for patients to call 911 in the event of a stroke.
AccessAccess to a stroke prevention clinic
The proportion of stroke/TIA patients discharged from the ED and referred to secondary prevention services (new indicator) decreased from 65.8% in 2014/15 to 63.8% in 2015/16; the provincial benchmark is 94.4%. Education is planned with physicians in the ED and health records coders to ensure that this information is documented in, and coded from, patient charts.
AccessProportion of ALC days to total length of stay in acute care
The proportion of ALC days in acute care increased to 28.2% (from 23.1% in the previous three years). A small proportion of ALC days can be attributed to waiting for rehabilitation, but most are related to wait times for LTC, which has a direct impact on access to the stroke unit for new acute stroke patients. Strategies for decreasing LOS and improving flows are being implemented.
OPPORTUNITIES FOR LHIN AND STROKE NETWORK COLLABORATION
• The West GTA Stroke Network and the Mississauga Halton LHIN continue to work collaboratively to improve stroke care within the LHIN.
• The greatest opportunities for improvement in the Mississauga Halton LHIN remain to improve access to stroke units for stroke patients and to improve community services that enable reintegration of stroke patients back into their homes.
• Public awareness of stroke symptoms and the importance of calling 911 will also be a focus, given that timely interventions can have a significant impact on outcomes.
CONTACTNicole PageauRegional DirectorWest GTA Stroke [email protected] (416) 409-4095
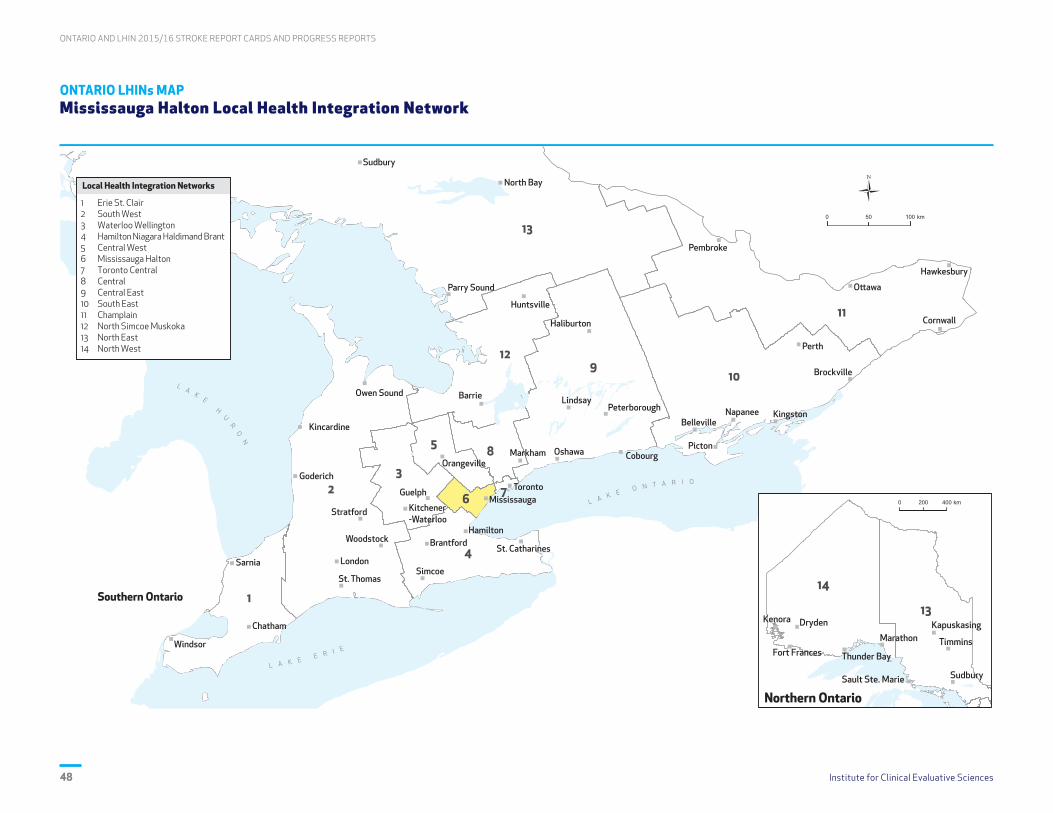
ONTARIO AND LHIN 2015/16 STROKE REPORT CARDS AND PROGRESS REPORTS
Institute for Clinical Evaluative Sciences48
ONTARIO LHINs MAP Mississauga Halton Local Health Integration Network

Institute for Clinical Evaluative Sciences 49
ONTARIO AND LHIN 2015/16 STROKE REPORT CARDS AND PROGRESS REPORTS
ONTARIO STROKE REPORT CARD, 2015/16 Toronto Central Local Health Integration Network
Poor performance1 Acceptable performance2 Exemplary performance3 Data or benchmark not available
Indicator No. Care Continuum Category Indicator4
LHIN FY 2015/16(2014/15)
Variance Within LHIN5
(Min–Max)Provincial
Benchmark6
High Performers7
Sub-LHIN/Facility LHIN
1 Public awareness and patient education Proportion of stroke/TIA patients who arrived at the ED by ambulance 59.9% (58.9%) 52.6–65.7% 65.3% Essex Sub-LHIN 1, 4
2 Prevention of stroke Annual age- and sex-adjusted inpatient admission rate for stroke/TIA (per 1,000 population) 1.2 (1.2) 1.1–1.4 1.1 Ottawa Centre Sub-LHIN 8, 11
3§ Prevention of stroke Risk-adjusted stroke/TIA mortality rate at 30 days (per 100 patients) 11.4 (10.1) 7.9–15.0 - - 11
4 Prevention of strokeProportion of ischemic stroke/TIA inpatients aged 65 and older with atrial fibrillation who filled a prescription for anticoagulant therapy within 90 days of discharge from acute care
67.2% (67.8%) 58.8–80.0% 85.5% South West York Region Sub-LHIN None
5 Prevention of stroke Proportion of ischemic stroke inpatients who received carotid imaging 88.6% (87.7%) 68.1–96.7% 91.7% Bluewater Health, Sarnia 7, 1
6 Acute stroke management Median door-to-needle time among patients who received acute thrombolytic therapy (tPA) (minutes)
51.0 (52.0) 47.0–61.0 33.0 Hamilton Health Sciences Corp., General None
7§ Acute stroke management Proportion of ischemic stroke patients who received acute thrombolytic therapy (tPA) 11.4% (12.1%) 7.3–15.1% 17.7% Hamilton Outer Core Sub-LHIN 11, 4
8§ Acute stroke management Proportion of stroke/TIA patients treated on a stroke unit8 at any time during their inpatient stay 51.1% (43.2%) 35.3–60.7% 78.7% Thunder Bay City Sub-LHIN 3
9 Prevention of stroke Proportion of ischemic stroke/TIA patients discharged from the ED and referred to secondary prevention services
74.9% (75.6%) 25.7–92.0% 94.4% London Health Sciences Centre, University Hospital None
10§ Acute stroke management Proportion of ALC days to total length of stay in acute care 25.2% (29.6%) 10.8–34.5% 8.2% Bluewater Health, Sarnia None
11§ Acute stroke management Proportion of acute stroke (excluding TIA) patients discharged from acute care and admitted to inpatient rehabilitation 33.7% (35.9%) 26.3–37.1% 47.8% Chatham-Kent Sub-LHIN 1
12§ Stroke rehabilitation Proportion of acute stroke (excluding TIA) patients with mild disability (AlphaFIM > 80) discharged home
64.9% (63.5%) 49.2–73.8% - - 14, 12
13§ Stroke rehabilitation Median number of days between stroke (excluding TIA) onset and admission to stroke inpatient rehabilitation 10.0 (11.0) 8.0–12.0 5.0 Southlake Regional Health Centre None
14§ Stroke rehabilitation Median number of minutes per day of direct therapy received by inpatient stroke rehabilitation patients 82.8 (-) 65.6–160.8 - - 3, 8
15§ Stroke rehabilitation Proportion of inpatient stroke rehabilitation patients achieving RPG active length of stay target 61.9% (56.8%) 53.3–81.6% 82.0% St. Joseph’s Health Centre, Guelph 3
16 Stroke rehabilitation Median FIM efficiency for moderate stroke in inpatient rehabilitation 1.2 (1.0) 0.9–1.4 1.5 St. Joseph’s Health Centre, Guelph 12, 3
17 Stroke rehabilitation Mean number of CCAC visits provided to stroke patients on discharge from inpatient acute care or inpatient rehabilitation in 2014/15–2015/16 5.9 (6.3) - 12.4 Waterloo Wellington CCAC 3, 10
18§ Stroke rehabilitation Proportion of patients admitted to inpatient rehabilitation with severe stroke (RPG 1100 or 1110) 36.6% (36.2%) 27.3–53.3% 58.7% St. Joseph’s Health Centre, Guelph None
19§ Reintegration Proportion of stroke/TIA patients discharged from acute care to LTC/CCC (excluding patients originating from LTC/CCC) 8.9% (9.9%) 6.0–12.7% 2.0% Urban Guelph Sub-LHIN None
20§ Reintegration Age- and sex-adjusted readmission rate at 30 days for patients with stroke/TIA for all diagnoses (per 100 patients) 8.4 (8.4) 6.9–12.6 - - None
Hospital Service Accountability Agreement indicator, 2015/16 - Data not available § Contributes to QBP performance
1 Performance below the 50th percentile.
2 Performance at or above the 50th percentile and greater than 5% absolute/relative difference from the benchmark.
3 Benchmark achieved or performance within 5% absolute/relative difference from the benchmark.
4 Facility-based analysis (excluding Indicators 1, 2, 4, 7, 8, 11 and 19) for patients aged 18–108. Indicators are based on CIHI data. Low rates are desired for Indicators 2, 3, 6, 10, 13, 19 and 20.
5 Excludes sub-LHINs or facilities with fewer than six patients.
6 Top benchmark achieved between 2013/14 and 2015/16. Benchmarks were calculated using the ABC methodology (Weissman NW et al. J Eval Clin Pract. 1999; 5(3):269–81) on sub-LHIN or facility data.
7 Sub-LHIN/facility: Highest performer among acute care institutions treating more than 100 stroke patients per year, rehabilitation facilities admitting more than 64 stroke patients per year, or sub-LHINs with at least 30 stroke patients per year. LHIN: Top two with exemplary performance.
8 The revised definition was developed with the consensus of Ontario Stroke Network regional directors (February 2014). There were 14 stroke units in 2012/13, 16 in 2013/14, 21 in 2014/15 and 28 in 2015/16.
Local Health Integration Networks (LHINs)1 Erie St. Clair 6 Mississauga Halton 11 Champlain2 South West 7 Toronto Central 12 North Simcoe Muskoka3 Waterloo Wellington 8 Central 13 North East4 Hamilton Niagara Haldimand Brant 9 Central East 14 North West5 Central West 10 South East

ONTARIO AND LHIN 2015/16 STROKE REPORT CARDS AND PROGRESS REPORTS
Institute for Clinical Evaluative Sciences50
STROKE PROGRESS REPORT, 2015/16 COMPARED TO 2012/13–2014/15 Toronto Central Local Health Integration Network
Progressing well1 Progressing2 Not progressing3 Data not available
Indicator No. Care Continuum Category Indicator4
LHIN FY 2015/16(Previous
3-Year Average)
Variance Within LHIN5
2015/16 (2012/13) Greatest Improvement6
Min Max Sub-LHIN/Facility LHIN
1 Public awareness and patient education Proportion of stroke/TIA patients who arrived at the ED by ambulance 59.9% (59.6%) 52.6% (53.6%) 65.7% (63.4%) Woodbridge (Vaughan) Sub-LHIN None
2 Prevention of stroke Annual age- and sex-adjusted inpatient admission rate for stroke/TIA (per 1,000 population) 1.2 (1.1) 1.1 (1.1) 1.4 (1.3) Thunder Bay District Sub-LHIN 8
3§ Prevention of stroke Risk-adjusted7 stroke/TIA mortality rate at 30 days (per 100 patients) 13.1 (11.6) 9.3 (6.4) 17.7 (12.6) - 10, 11
4 Prevention of strokeProportion of ischemic stroke/TIA inpatients aged 65 and older with atrial fibrillation who filled a prescription for anticoagulant therapy within 90 days of discharge from acute care
67.2% (68.9%) 58.8% (50.0%) 80.0% (76.7%) Chatham-Kent Sub-LHIN 9, 4
5 Prevention of stroke Proportion of ischemic stroke inpatients who received carotid imaging 88.6% (84.8%) 68.1% (64.3%) 96.7% (88.7%) North Bay Regional Health Centre 2, 1
6 Acute stroke management Median door-to-needle time among patients who received acute thrombolytic therapy (tPA) (minutes)
51.0 (62.5) 47.0 (71.0) 61.0 (79.0) University Health Network 6, 7
7§ Acute stroke management Proportion of ischemic stroke patients who received acute thrombolytic therapy (tPA) 11.4% (11.6%) 7.3% (3.1%) 15.1% (15.9%) Timiskaming Sub-LHIN 4, 11
8§ Acute stroke management Proportion of stroke/TIA patients treated on a stroke unit8 at any time during their inpatient stay 51.1% (46.0%) 35.3% (25.0%) 60.7% (61.7%) Belleville Sub-LHIN 14, 2
9 Prevention of stroke Proportion of ischemic stroke/TIA patients discharged from the ED and referred to secondary prevention services
74.9% (-) 25.7% (-) 92.0% (-) - -
10§ Acute stroke management Proportion of ALC days to total length of stay in acute care 25.2% (29.8%) 10.8% (16.1%) 34.5% (37.2%) Rouge Valley Health System, Ajax 5, 3
11§ Acute stroke management Proportion of acute stroke (excluding TIA) patients discharged from acute care and admitted to inpatient rehabilitation 33.7% (33.7%) 26.3% (20.0%) 37.1% (43.4%) Central York Region Sub-LHIN 8, 3
12§ Stroke rehabilitation Proportion of acute stroke (excluding TIA) patients with mild disability (AlphaFIM > 80) discharged home
64.9% (-) 49.2% (-) 73.8% (-) - -
13§ Stroke rehabilitation Median number of days between stroke (excluding TIA) onset and admission to stroke inpatient rehabilitation 10.0 (11.0) 8.0 (9.0) 12.0 (14.5) William Osler Health System, Brampton 5, 8, 10
14§ Stroke rehabilitation Median number of minutes per day of direct therapy received by inpatient stroke rehabilitation patients 82.8 (-) 65.6 (-) 160.8 (-) - -
15§ Stroke rehabilitation Proportion of inpatient stroke rehabilitation patients achieving RPG active length of stay target 61.9% (47.1%) 53.3% (16.4%) 81.6% (68.4%) Hotel Dieu Shaver 3, 5
16 Stroke rehabilitation Median FIM efficiency for moderate stroke in inpatient rehabilitation 1.2 (0.9) 0.9 (0.6) 1.4 (1.0) Grand River Hospital Corp., Freeport 3, 12
17 Stroke rehabilitation Mean number of CCAC visits provided to stroke patients on discharge from inpatient acute care or inpatient rehabilitation in 2014/15–2015/16 5.9 (5.0) - - Waterloo Wellington CCAC 3, 6
18§ Stroke rehabilitation Proportion of patients admitted to inpatient rehabilitation with severe stroke (RPG 1100 or 1110) 36.6% (32.1%) 27.3% (21.6%) 53.3% (31.6%) Providence Healthcare 7
19§ Reintegration Proportion of stroke/TIA patients discharged from acute care to LTC/CCC (excluding patients originating from LTC/CCC) 8.9% (10.8%) 6.0% (5.2%) 12.7% (16.7%) Belleville Sub-LHIN 10, 1
20§ Reintegration Age- and sex-adjusted7 readmission rate at 30 days for patients with stroke/TIA for all diagnoses (per 100 patients) 8.3 (8.5) 6.8 (7.6) 12.5 (10.7) - None
Hospital Service Accountability Agreement indicator, 2015/16 - Data not available § Contributes to QBP performance
1 Statistically significant improvement.
2 Performance improving but not statistically significant.
3 No change or performance decline.
4 Facility-based analysis (excluding Indicators 1, 2, 4, 7, 8, 11 and 19) for patients aged 18–108. Indicators are based on CIHI data. Low rates are desired for Indicators 2, 3, 6, 10, 13, 19 and 20.
5 Excludes sub-LHINs or facilities with fewer than six patients.
6 Sub-LHIN/facility: Greatest improvement from 2012/13 among acute care institutions treating more than 100 stroke patients per year, rehabilitation facilities admitting more than 64 stroke patients per year, or sub-LHINs with at least 30 stroke patients per year. LHIN: Top two with greatest statistically significant improvement from 2012/13.
7 The 2012/13-2015/16 LHIN rate was used in calculating the LHIN risk-adjusted rate.
8 The revised definition was developed with the consensus of Ontario Stroke Network regional directors (February 2014). There were 14 stroke units in 2012/13, 16 in 2013/14, 21 in 2014/15 and 28 in 2015/16.
Local Health Integration Networks (LHINs)1 Erie St. Clair 6 Mississauga Halton 11 Champlain2 South West 7 Toronto Central 12 North Simcoe Muskoka3 Waterloo Wellington 8 Central 13 North East4 Hamilton Niagara Haldimand Brant 9 Central East 14 North West5 Central West 10 South East

Institute for Clinical Evaluative Sciences 51
ONTARIO AND LHIN 2015/16 STROKE REPORT CARDS AND PROGRESS REPORTS
INTERPRETATION OF 2015/16 STROKE REPORT CARD Toronto Central Local Health Integration Network
PERFORMANCE OVERVIEWThe Toronto Central LHIN progressed significantly on seven indicators and made progress on five indicators across the care continuum. Compared to other LHINs, the Toronto Central LHIN had exemplary or acceptable performance on seven indicators and poor performance on nine. Variation within LHIN remains an issue.
AREAS OF PROGRESS
Stroke Prevention There is a four-year trend of continuous improvement in carotid imaging; the Toronto Central LHIN was the highest performing LHIN this year on Indicator 5. Inpatient admission rate continued as exemplary compared to the provincial benchmark (Indicator 2).
Acute Stroke Management Local organization efforts facilitated significant progress in stroke unit access (Indicator 8). The Toronto Central LHIN was among the LHINs with greatest improvement in median DTN time for patients who received tPA (Indicator 6).
Stroke Rehabilitation The LHIN progressed well on rehabilitation indicators (13,15,16,18) compared to the previous three years. Performance was still poor on severe stroke inpatient rehabilitation admission (Indicator 18) but only the Toronto Central LHIN had significant improvement.
Community Reintegration Progress continued with fewer patients discharged to LTC/CCC from acute care and decreasing 30-day readmission rates. Improvements were not as large as in other LHINs.
AREAS FOR IMPROVEMENT ASSOCIATED CURRENT OR PLANNED ACTIVITIES
IntegrationCoordinated approach to support access to secondary prevention services, consistency in health service provider practices and improved data quality.
Support efforts at the provincial level to establish a reliable and sustainable data collection approach for secondary prevention clinics. Secondary prevention elements to be integrated into cross-LHIN planning for community-based care (i.e., QBP). Discussions are in progress with local organizations to address prevention practices, documentation and optimal use of designated clinics.
IntegrationSupport QBP implementation including EVT, acute stroke unit access (east and west subregions) and coverage with allied health seven days/week to optimize patient outcomes and flow.
A streamlined process for accessing EVT in the GTA (flow across LHINs) is currently in development for future implementation. Facilitate automatic acceptance for patients with AlphaFIM 60–80 into inpatient rehabilitation. Cross-system planning is under way to improve the flow of severe and complex stroke patients.
EffectivenessSupport QBP implementation including rehabilitation intensity (seven days/week) and six days/week access to rehabilitation beds for all stroke types, including those with complex needs; leverage system data for quality improvement.
Opportunities exist to engage in cross-system planning, build capacity for care within rehabilitation beds and promote shared accountability to optimize patient outcomes and flow with a focus on severe/complex patients. Initiate merger of E-Stroke rehabilitation referral system to resource matching and referral (RM&R) system to retain timely access to rehabilitation and system improvement data.
AccessSupport QBP recommendations by creating and implementing a standard model of community-based rehabilitation care (outpatient rehabilitation, home-based and early-supported discharge, secondary prevention) within the LHIN.
Cross-LHIN planning discussions initiated in 2016 will continue to create equitable access to community-based rehabilitation services that align with Patients First, and to incorporate learnings from the IFM for stroke.
OPPORTUNITIES FOR LHIN AND STROKE NETWORK COLLABORATION
• Provide ongoing leadership with peer LHINs to advance the cross-LHIN, community-based rehabilitation collaboration.
• Support the spread of IFM more broadly.
• Provide support and focus for stroke through linkages to the Toronto Central LHIN alternate level of care (ALC) initiatives relative to the cross-system planning for improved flow for severe and complex patients.
• Provide continued leadership with peer LHINs to facilitate integration of the E-Stroke rehabilitation referral system elements within the RM&R system to support continued efficient rehabilitation access and a sustainable data set to continue to drive system improvement.
CONTACTShelley Sharp Regional DirectorToronto West Stroke Network [email protected] (416) 603-5076

ONTARIO AND LHIN 2015/16 STROKE REPORT CARDS AND PROGRESS REPORTS
Institute for Clinical Evaluative Sciences52
ONTARIO LHINs MAP Toronto Central Local Health Integration Network
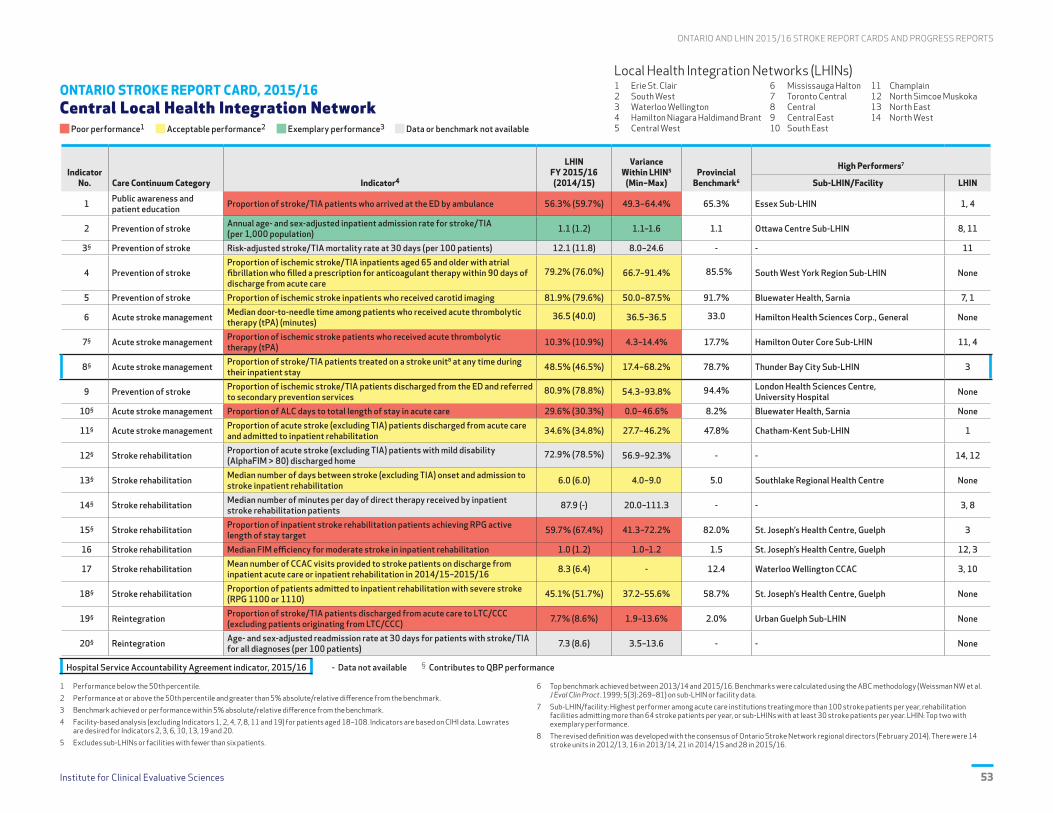
Institute for Clinical Evaluative Sciences 53
ONTARIO AND LHIN 2015/16 STROKE REPORT CARDS AND PROGRESS REPORTS
ONTARIO STROKE REPORT CARD, 2015/16 Central Local Health Integration Network
Poor performance1 Acceptable performance2 Exemplary performance3 Data or benchmark not available
Indicator No. Care Continuum Category Indicator4
LHIN FY 2015/16(2014/15)
Variance Within LHIN5
(Min–Max)Provincial
Benchmark6
High Performers7
Sub-LHIN/Facility LHIN
1 Public awareness and patient education Proportion of stroke/TIA patients who arrived at the ED by ambulance 56.3% (59.7%) 49.3–64.4% 65.3% Essex Sub-LHIN 1, 4
2 Prevention of stroke Annual age- and sex-adjusted inpatient admission rate for stroke/TIA (per 1,000 population) 1.1 (1.2) 1.1–1.6 1.1 Ottawa Centre Sub-LHIN 8, 11
3§ Prevention of stroke Risk-adjusted stroke/TIA mortality rate at 30 days (per 100 patients) 12.1 (11.8) 8.0–24.6 - - 11
4 Prevention of strokeProportion of ischemic stroke/TIA inpatients aged 65 and older with atrial fibrillation who filled a prescription for anticoagulant therapy within 90 days of discharge from acute care
79.2% (76.0%) 66.7–91.4% 85.5% South West York Region Sub-LHIN None
5 Prevention of stroke Proportion of ischemic stroke inpatients who received carotid imaging 81.9% (79.6%) 50.0–87.5% 91.7% Bluewater Health, Sarnia 7, 1
6 Acute stroke management Median door-to-needle time among patients who received acute thrombolytic therapy (tPA) (minutes)
36.5 (40.0) 36.5–36.5 33.0 Hamilton Health Sciences Corp., General None
7§ Acute stroke management Proportion of ischemic stroke patients who received acute thrombolytic therapy (tPA) 10.3% (10.9%) 4.3–14.4% 17.7% Hamilton Outer Core Sub-LHIN 11, 4
8§ Acute stroke management Proportion of stroke/TIA patients treated on a stroke unit8 at any time during their inpatient stay 48.5% (46.5%) 17.4–68.2% 78.7% Thunder Bay City Sub-LHIN 3
9 Prevention of stroke Proportion of ischemic stroke/TIA patients discharged from the ED and referred to secondary prevention services
80.9% (78.8%) 54.3–93.8% 94.4% London Health Sciences Centre, University Hospital None
10§ Acute stroke management Proportion of ALC days to total length of stay in acute care 29.6% (30.3%) 0.0–46.6% 8.2% Bluewater Health, Sarnia None
11§ Acute stroke management Proportion of acute stroke (excluding TIA) patients discharged from acute care and admitted to inpatient rehabilitation 34.6% (34.8%) 27.7–46.2% 47.8% Chatham-Kent Sub-LHIN 1
12§ Stroke rehabilitation Proportion of acute stroke (excluding TIA) patients with mild disability (AlphaFIM > 80) discharged home
72.9% (78.5%) 56.9–92.3% - - 14, 12
13§ Stroke rehabilitation Median number of days between stroke (excluding TIA) onset and admission to stroke inpatient rehabilitation 6.0 (6.0) 4.0–9.0 5.0 Southlake Regional Health Centre None
14§ Stroke rehabilitation Median number of minutes per day of direct therapy received by inpatient stroke rehabilitation patients 87.9 (-) 20.0–111.3 - - 3, 8
15§ Stroke rehabilitation Proportion of inpatient stroke rehabilitation patients achieving RPG active length of stay target 59.7% (67.4%) 41.3–72.2% 82.0% St. Joseph’s Health Centre, Guelph 3
16 Stroke rehabilitation Median FIM efficiency for moderate stroke in inpatient rehabilitation 1.0 (1.2) 1.0–1.2 1.5 St. Joseph’s Health Centre, Guelph 12, 3
17 Stroke rehabilitation Mean number of CCAC visits provided to stroke patients on discharge from inpatient acute care or inpatient rehabilitation in 2014/15–2015/16 8.3 (6.4) - 12.4 Waterloo Wellington CCAC 3, 10
18§ Stroke rehabilitation Proportion of patients admitted to inpatient rehabilitation with severe stroke (RPG 1100 or 1110) 45.1% (51.7%) 37.2–55.6% 58.7% St. Joseph’s Health Centre, Guelph None
19§ Reintegration Proportion of stroke/TIA patients discharged from acute care to LTC/CCC (excluding patients originating from LTC/CCC) 7.7% (8.6%) 1.9–13.6% 2.0% Urban Guelph Sub-LHIN None
20§ Reintegration Age- and sex-adjusted readmission rate at 30 days for patients with stroke/TIA for all diagnoses (per 100 patients) 7.3 (8.6) 3.5–13.6 - - None
Hospital Service Accountability Agreement indicator, 2015/16 - Data not available § Contributes to QBP performance
1 Performance below the 50th percentile.
2 Performance at or above the 50th percentile and greater than 5% absolute/relative difference from the benchmark.
3 Benchmark achieved or performance within 5% absolute/relative difference from the benchmark.
4 Facility-based analysis (excluding Indicators 1, 2, 4, 7, 8, 11 and 19) for patients aged 18–108. Indicators are based on CIHI data. Low rates are desired for Indicators 2, 3, 6, 10, 13, 19 and 20.
5 Excludes sub-LHINs or facilities with fewer than six patients.
6 Top benchmark achieved between 2013/14 and 2015/16. Benchmarks were calculated using the ABC methodology (Weissman NW et al. J Eval Clin Pract. 1999; 5(3):269–81) on sub-LHIN or facility data.
7 Sub-LHIN/facility: Highest performer among acute care institutions treating more than 100 stroke patients per year, rehabilitation facilities admitting more than 64 stroke patients per year, or sub-LHINs with at least 30 stroke patients per year. LHIN: Top two with exemplary performance.
8 The revised definition was developed with the consensus of Ontario Stroke Network regional directors (February 2014). There were 14 stroke units in 2012/13, 16 in 2013/14, 21 in 2014/15 and 28 in 2015/16.
Local Health Integration Networks (LHINs)1 Erie St. Clair 6 Mississauga Halton 11 Champlain2 South West 7 Toronto Central 12 North Simcoe Muskoka3 Waterloo Wellington 8 Central 13 North East4 Hamilton Niagara Haldimand Brant 9 Central East 14 North West5 Central West 10 South East
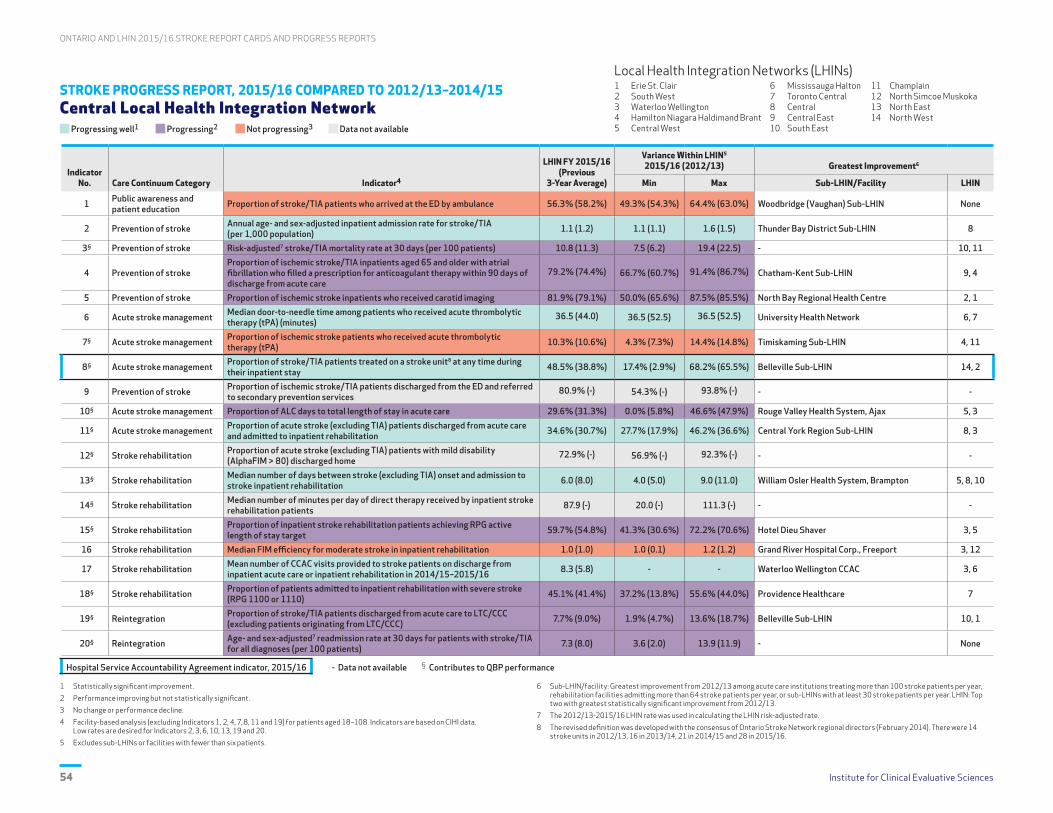
ONTARIO AND LHIN 2015/16 STROKE REPORT CARDS AND PROGRESS REPORTS
Institute for Clinical Evaluative Sciences54
STROKE PROGRESS REPORT, 2015/16 COMPARED TO 2012/13–2014/15 Central Local Health Integration Network
Progressing well1 Progressing2 Not progressing3 Data not available
Indicator No. Care Continuum Category Indicator4
LHIN FY 2015/16(Previous
3-Year Average)
Variance Within LHIN5
2015/16 (2012/13) Greatest Improvement6
Min Max Sub-LHIN/Facility LHIN
1 Public awareness and patient education Proportion of stroke/TIA patients who arrived at the ED by ambulance 56.3% (58.2%) 49.3% (54.3%) 64.4% (63.0%) Woodbridge (Vaughan) Sub-LHIN None
2 Prevention of stroke Annual age- and sex-adjusted inpatient admission rate for stroke/TIA (per 1,000 population) 1.1 (1.2) 1.1 (1.1) 1.6 (1.5) Thunder Bay District Sub-LHIN 8
3§ Prevention of stroke Risk-adjusted7 stroke/TIA mortality rate at 30 days (per 100 patients) 10.8 (11.3) 7.5 (6.2) 19.4 (22.5) - 10, 11
4 Prevention of strokeProportion of ischemic stroke/TIA inpatients aged 65 and older with atrial fibrillation who filled a prescription for anticoagulant therapy within 90 days of discharge from acute care
79.2% (74.4%) 66.7% (60.7%) 91.4% (86.7%) Chatham-Kent Sub-LHIN 9, 4
5 Prevention of stroke Proportion of ischemic stroke inpatients who received carotid imaging 81.9% (79.1%) 50.0% (65.6%) 87.5% (85.5%) North Bay Regional Health Centre 2, 1
6 Acute stroke management Median door-to-needle time among patients who received acute thrombolytic therapy (tPA) (minutes)
36.5 (44.0) 36.5 (52.5) 36.5 (52.5) University Health Network 6, 7
7§ Acute stroke management Proportion of ischemic stroke patients who received acute thrombolytic therapy (tPA) 10.3% (10.6%) 4.3% (7.3%) 14.4% (14.8%) Timiskaming Sub-LHIN 4, 11
8§ Acute stroke management Proportion of stroke/TIA patients treated on a stroke unit8 at any time during their inpatient stay 48.5% (38.8%) 17.4% (2.9%) 68.2% (65.5%) Belleville Sub-LHIN 14, 2
9 Prevention of stroke Proportion of ischemic stroke/TIA patients discharged from the ED and referred to secondary prevention services
80.9% (-) 54.3% (-) 93.8% (-) - -
10§ Acute stroke management Proportion of ALC days to total length of stay in acute care 29.6% (31.3%) 0.0% (5.8%) 46.6% (47.9%) Rouge Valley Health System, Ajax 5, 3
11§ Acute stroke management Proportion of acute stroke (excluding TIA) patients discharged from acute care and admitted to inpatient rehabilitation 34.6% (30.7%) 27.7% (17.9%) 46.2% (36.6%) Central York Region Sub-LHIN 8, 3
12§ Stroke rehabilitation Proportion of acute stroke (excluding TIA) patients with mild disability (AlphaFIM > 80) discharged home
72.9% (-) 56.9% (-) 92.3% (-) - -
13§ Stroke rehabilitation Median number of days between stroke (excluding TIA) onset and admission to stroke inpatient rehabilitation 6.0 (8.0) 4.0 (5.0) 9.0 (11.0) William Osler Health System, Brampton 5, 8, 10
14§ Stroke rehabilitation Median number of minutes per day of direct therapy received by inpatient stroke rehabilitation patients 87.9 (-) 20.0 (-) 111.3 (-) - -
15§ Stroke rehabilitation Proportion of inpatient stroke rehabilitation patients achieving RPG active length of stay target 59.7% (54.8%) 41.3% (30.6%) 72.2% (70.6%) Hotel Dieu Shaver 3, 5
16 Stroke rehabilitation Median FIM efficiency for moderate stroke in inpatient rehabilitation 1.0 (1.0) 1.0 (0.1) 1.2 (1.2) Grand River Hospital Corp., Freeport 3, 12
17 Stroke rehabilitation Mean number of CCAC visits provided to stroke patients on discharge from inpatient acute care or inpatient rehabilitation in 2014/15–2015/16 8.3 (5.8) - - Waterloo Wellington CCAC 3, 6
18§ Stroke rehabilitation Proportion of patients admitted to inpatient rehabilitation with severe stroke (RPG 1100 or 1110) 45.1% (41.4%) 37.2% (13.8%) 55.6% (44.0%) Providence Healthcare 7
19§ Reintegration Proportion of stroke/TIA patients discharged from acute care to LTC/CCC (excluding patients originating from LTC/CCC) 7.7% (9.0%) 1.9% (4.7%) 13.6% (18.7%) Belleville Sub-LHIN 10, 1
20§ Reintegration Age- and sex-adjusted7 readmission rate at 30 days for patients with stroke/TIA for all diagnoses (per 100 patients) 7.3 (8.0) 3.6 (2.0) 13.9 (11.9) - None
Hospital Service Accountability Agreement indicator, 2015/16 - Data not available § Contributes to QBP performance
1 Statistically significant improvement.
2 Performance improving but not statistically significant.
3 No change or performance decline.
4 Facility-based analysis (excluding Indicators 1, 2, 4, 7, 8, 11 and 19) for patients aged 18–108. Indicators are based on CIHI data. Low rates are desired for Indicators 2, 3, 6, 10, 13, 19 and 20.
5 Excludes sub-LHINs or facilities with fewer than six patients.
6 Sub-LHIN/facility: Greatest improvement from 2012/13 among acute care institutions treating more than 100 stroke patients per year, rehabilitation facilities admitting more than 64 stroke patients per year, or sub-LHINs with at least 30 stroke patients per year. LHIN: Top two with greatest statistically significant improvement from 2012/13.
7 The 2012/13-2015/16 LHIN rate was used in calculating the LHIN risk-adjusted rate.
8 The revised definition was developed with the consensus of Ontario Stroke Network regional directors (February 2014). There were 14 stroke units in 2012/13, 16 in 2013/14, 21 in 2014/15 and 28 in 2015/16.
Local Health Integration Networks (LHINs)1 Erie St. Clair 6 Mississauga Halton 11 Champlain2 South West 7 Toronto Central 12 North Simcoe Muskoka3 Waterloo Wellington 8 Central 13 North East4 Hamilton Niagara Haldimand Brant 9 Central East 14 North West5 Central West 10 South East

Institute for Clinical Evaluative Sciences 55
ONTARIO AND LHIN 2015/16 STROKE REPORT CARDS AND PROGRESS REPORTS
INTERPRETATION OF 2015/16 STROKE REPORT CARD Central Local Health Integration Network
PERFORMANCE OVERVIEWThe Central LHIN improved significantly on six indicators with no noted improvement on three, and was the high performer on Indicators 2 and 14. The LHIN remained below the benchmark on all but one indicator. Variation continued. System planning within and across LHINs is necessary to improve performance.
AREAS OF PROGRESS
Stroke Prevention Performance was maintained on associated indicators through sustained investment in secondary prevention. Indicator 2 was exemplary and showed significant improvement compared to the previous three years.
Acute Stroke Management Stroke unit access remains a focus, with three of six sites meeting the QBP definition. Progress on Indicator 8 is contributing to improvements on other indicators. DTN time for tPA improved.
Stroke Rehabilitation Timely access to inpatient rehabilitation improved (greatest improvement on Indicators 11 and 13) and the Central LHIN was a high performer for rehabilitation intensity. There is continued influence of the Toronto Central LHIN supporting rehabilitation for Central LHIN patients.
Community Reintegration Progress was made in increasing the number of CCAC rehabilitation visits, reducing 30-day readmissions and decreasing the proportion of patients discharged to LTC/CCC.
AREAS FOR IMPROVEMENT ASSOCIATED CURRENT OR PLANNED ACTIVITIES
IntegrationSupport QBP implementation, including EVT and stroke unit access with seven days/week allied health coverage, to optimize outcomes.
Local efforts will be supported through a systems approach to stroke services to ensure access to stroke unit care with a minimum of six days/week allied health coverage, and LHIN-wide processes to ensure access to tPA. Streamlined processes for patients in the Central LHIN to access EVT will be developed and implemented (i.e., flow across LHINs).
IntegrationImplement QBP recommendations through a standard model of community-based stroke rehabilitation (outpatient rehabilitation, home- based and early-supported discharge, prevention) across LHINs.
Cross-LHIN planning (initiated in 2016) will focus on implementation of a common model of community stroke care that ensures equitable access to community-based rehabilitation that aligns with Patients First and incorporates learnings from the IFM project for stroke.
EffectivenessSupport QBP implementation including rehabilitation intensity seven days/week and six days/week access to rehabilitation beds for all stroke types (including those with complex needs); leverage data for quality improvement.
Engage in cross-system planning, expand capacity for care within rehabilitation beds, and promote shared accountability to optimize patient outcomes and flow with a focus on severe/complex patients.
EffectivenessCoordinated approach to support access to secondary prevention services, consistency in health service provider practices and improved data quality.
Support efforts are under way at the provincial level to establish reliable and sustainable data collection for secondary prevention clinics. Secondary prevention core elements are being incorporated into cross-LHIN planning for community-based care (QBP). Discussions are needed with local organizations to address prevention practices, documentation and optimal use of designated clinics.
OPPORTUNITIES FOR LHIN AND STROKE NETWORK COLLABORATION
• Continue to partner with the stroke networks to advance a systems approach to stroke care across the Central LHIN.
• Leverage the opportunity of a common community-based rehabilitation model for stroke to advance Patients First implementation in the Central LHIN.
• Collaborate with GTA LHINs to facilitate streamlined access to EVT and rehabilitation, as well as to implement a common model of community-based stroke rehabilitation.
• Work with organizations to ensure data quality and standardized reporting to facilitate system- and facility-level improvement.
CONTACTBeth LinkewichRegional DirectorNorth & East GTA Stroke [email protected] (416) 480-6100, ext. 7300

ONTARIO AND LHIN 2015/16 STROKE REPORT CARDS AND PROGRESS REPORTS
Institute for Clinical Evaluative Sciences56
ONTARIO LHINs MAP Central Local Health Integration Network

Institute for Clinical Evaluative Sciences 57
ONTARIO AND LHIN 2015/16 STROKE REPORT CARDS AND PROGRESS REPORTS
ONTARIO STROKE REPORT CARD, 2015/16 Central East Local Health Integration Network
Poor performance1 Acceptable performance2 Exemplary performance3 Data or benchmark not available
Indicator No. Care Continuum Category Indicator4
LHIN FY 2015/16(2014/15)
Variance Within LHIN5
(Min–Max)Provincial
Benchmark6
High Performers7
Sub-LHIN/Facility LHIN
1 Public awareness and patient education Proportion of stroke/TIA patients who arrived at the ED by ambulance 58.8% (59.0%) 56.2–62.1% 65.3% Essex Sub-LHIN 1, 4
2 Prevention of stroke Annual age- and sex-adjusted inpatient admission rate for stroke/TIA (per 1,000 population) 1.3 (1.2) 1.3–1.7 1.1 Ottawa Centre Sub-LHIN 8, 11
3§ Prevention of stroke Risk-adjusted stroke/TIA mortality rate at 30 days (per 100 patients) 11.4 (11.7) 0.0–26.4 - - 11
4 Prevention of strokeProportion of ischemic stroke/TIA inpatients aged 65 and older with atrial fibrillation who filled a prescription for anticoagulant therapy within 90 days of discharge from acute care
75.7% (73.6%) 73.5–78.4% 85.5% South West York Region Sub-LHIN None
5 Prevention of stroke Proportion of ischemic stroke inpatients who received carotid imaging 76.7% (70.8%) 26.3–90.4% 91.7% Bluewater Health, Sarnia 7, 1
6 Acute stroke management Median door-to-needle time among patients who received acute thrombolytic therapy (tPA) (minutes)
59.0 (68.0) 53.0–207.0 33.0 Hamilton Health Sciences Corp., General None
7§ Acute stroke management Proportion of ischemic stroke patients who received acute thrombolytic therapy (tPA) 13.4% (12.0%) 10.8–15.4% 17.7% Hamilton Outer Core Sub-LHIN 11, 4
8§ Acute stroke management Proportion of stroke/TIA patients treated on a stroke unit8 at any time during their inpatient stay 55.3% (42.7%) 54.4–56.1% 78.7% Thunder Bay City Sub-LHIN 3
9 Prevention of stroke Proportion of ischemic stroke/TIA patients discharged from the ED and referred to secondary prevention services
72.7% (61.3%) 32.3–91.7% 94.4% London Health Sciences Centre, University Hospital None
10§ Acute stroke management Proportion of ALC days to total length of stay in acute care 30.8% (20.2%) 0.0–52.3% 8.2% Bluewater Health, Sarnia None
11§ Acute stroke management Proportion of acute stroke (excluding TIA) patients discharged from acute care and admitted to inpatient rehabilitation 41.8% (41.9%) 33.2–48.1% 47.8% Chatham-Kent Sub-LHIN 1
12§ Stroke rehabilitation Proportion of acute stroke (excluding TIA) patients with mild disability (AlphaFIM > 80) discharged home
66.2% (66.2%) 40.7–84.2% - - 14, 12
13§ Stroke rehabilitation Median number of days between stroke (excluding TIA) onset and admission to stroke inpatient rehabilitation 6.0 (6.0) 5.0–11.0 5.0 Southlake Regional Health Centre None
14§ Stroke rehabilitation Median number of minutes per day of direct therapy received by inpatient stroke rehabilitation patients 39.7 (-) 19.6–62.4 - - 3, 8
15§ Stroke rehabilitation Proportion of inpatient stroke rehabilitation patients achieving RPG active length of stay target 70.8% (68.8%) 57.0–79.6% 82.0% St. Joseph’s Health Centre, Guelph 3
16 Stroke rehabilitation Median FIM efficiency for moderate stroke in inpatient rehabilitation 1.2 (1.4) 0.8–1.6 1.5 St. Joseph’s Health Centre, Guelph 12, 3
17 Stroke rehabilitation Mean number of CCAC visits provided to stroke patients on discharge from inpatient acute care or inpatient rehabilitation in 2014/15–2015/16 5.9 (6.7) - 12.4 Waterloo Wellington CCAC 3, 10
18§ Stroke rehabilitation Proportion of patients admitted to inpatient rehabilitation with severe stroke (RPG 1100 or 1110) 47.6% (52.9%) 35.7–54.1% 58.7% St. Joseph’s Health Centre, Guelph None
19§ Reintegration Proportion of stroke/TIA patients discharged from acute care to LTC/CCC (excluding patients originating from LTC/CCC) 8.0% (6.9%) 4.3–13.5% 2.0% Urban Guelph Sub-LHIN None
20§ Reintegration Age- and sex-adjusted readmission rate at 30 days for patients with stroke/TIA for all diagnoses (per 100 patients) 7.0 (7.9) 0.0–14.1 - - None
Hospital Service Accountability Agreement indicator, 2015/16 - Data not available § Contributes to QBP performance
1 Performance below the 50th percentile.
2 Performance at or above the 50th percentile and greater than 5% absolute/relative difference from the benchmark.
3 Benchmark achieved or performance within 5% absolute/relative difference from the benchmark.
4 Facility-based analysis (excluding Indicators 1, 2, 4, 7, 8, 11 and 19) for patients aged 18–108. Indicators are based on CIHI data. Low rates are desired for Indicators 2, 3, 6, 10, 13, 19 and 20.
5 Excludes sub-LHINs or facilities with fewer than six patients.
6 Top benchmark achieved between 2013/14 and 2015/16. Benchmarks were calculated using the ABC methodology (Weissman NW et al. J Eval Clin Pract. 1999; 5(3):269–81) on sub-LHIN or facility data.
7 Sub-LHIN/facility: Highest performer among acute care institutions treating more than 100 stroke patients per year, rehabilitation facilities admitting more than 64 stroke patients per year, or sub-LHINs with at least 30 stroke patients per year. LHIN: Top two with exemplary performance.
8 The revised definition was developed with the consensus of Ontario Stroke Network regional directors (February 2014). There were 14 stroke units in 2012/13, 16 in 2013/14, 21 in 2014/15 and 28 in 2015/16.
Local Health Integration Networks (LHINs)1 Erie St. Clair 6 Mississauga Halton 11 Champlain2 South West 7 Toronto Central 12 North Simcoe Muskoka3 Waterloo Wellington 8 Central 13 North East4 Hamilton Niagara Haldimand Brant 9 Central East 14 North West5 Central West 10 South East

ONTARIO AND LHIN 2015/16 STROKE REPORT CARDS AND PROGRESS REPORTS
Institute for Clinical Evaluative Sciences58
STROKE PROGRESS REPORT, 2015/16 COMPARED TO 2012/13–2014/15 Central East Local Health Integration Network
Progressing well1 Progressing2 Not progressing3 Data not available
Indicator No. Care Continuum Category Indicator4
LHIN FY 2015/16(Previous
3-Year Average)
Variance Within LHIN5
2015/16 (2012/13) Greatest Improvement6
Min Max Sub-LHIN/Facility LHIN
1 Public awareness and patient education Proportion of stroke/TIA patients who arrived at the ED by ambulance 58.8% (58.8%) 56.2% (58.6%) 62.1% (62.1%) Woodbridge (Vaughan) Sub-LHIN None
2 Prevention of stroke Annual age- and sex-adjusted inpatient admission rate for stroke/TIA (per 1,000 population) 1.3 (1.2) 1.3 (1.2) 1.7 (1.5) Thunder Bay District Sub-LHIN 8
3§ Prevention of stroke Risk-adjusted7 stroke/TIA mortality rate at 30 days (per 100 patients) 11.1 (11.8) 0.0 (6.5) 27.0 (34.1) - 10, 11
4 Prevention of strokeProportion of ischemic stroke/TIA inpatients aged 65 and older with atrial fibrillation who filled a prescription for anticoagulant therapy within 90 days of discharge from acute care
75.7% (69.3%) 73.5% (59.7%) 78.4% (78.7%) Chatham-Kent Sub-LHIN 9, 4
5 Prevention of stroke Proportion of ischemic stroke inpatients who received carotid imaging 76.7% (70.9%) 26.3% (23.5%) 90.4% (89.0%) North Bay Regional Health Centre 2, 1
6 Acute stroke management Median door-to-needle time among patients who received acute thrombolytic therapy (tPA) (minutes)
59.0 (66.0) 53.0 (66.0) 207.0 (258.5) University Health Network 6, 7
7§ Acute stroke management Proportion of ischemic stroke patients who received acute thrombolytic therapy (tPA) 13.4% (12.8%) 10.8% (10.6%) 15.4% (17.3%) Timiskaming Sub-LHIN 4, 11
8§ Acute stroke management Proportion of stroke/TIA patients treated on a stroke unit8 at any time during their inpatient stay 55.3% (37.9%) 54.4% (15.9%) 56.1% (46.0%) Belleville Sub-LHIN 14, 2
9 Prevention of stroke Proportion of ischemic stroke/TIA patients discharged from the ED and referred to secondary prevention services
72.7% (-) 32.3% (-) 91.7% (-) - -
10§ Acute stroke management Proportion of ALC days to total length of stay in acute care 30.8% (25.9%) 0.0% (0.0%) 52.3% (39.4%) Rouge Valley Health System, Ajax 5, 3
11§ Acute stroke management Proportion of acute stroke (excluding TIA) patients discharged from acute care and admitted to inpatient rehabilitation 41.8% (39.4%) 33.2% (27.2%) 48.1% (45.5%) Central York Region Sub-LHIN 8, 3
12§ Stroke rehabilitation Proportion of acute stroke (excluding TIA) patients with mild disability (AlphaFIM > 80) discharged home
66.2% (-) 40.7% (-) 84.2% (-) - -
13§ Stroke rehabilitation Median number of days between stroke (excluding TIA) onset and admission to stroke inpatient rehabilitation 6.0 (6.0) 5.0 (6.0) 11.0 (22.0) William Osler Health System, Brampton 5, 8, 10
14§ Stroke rehabilitation Median number of minutes per day of direct therapy received by inpatient stroke rehabilitation patients 39.7 (-) 19.6 (-) 62.4 (-) - -
15§ Stroke rehabilitation Proportion of inpatient stroke rehabilitation patients achieving RPG active length of stay target 70.8% (62.8%) 57.0% (40.0%) 79.6% (100%) Hotel Dieu Shaver 3, 5
16 Stroke rehabilitation Median FIM efficiency for moderate stroke in inpatient rehabilitation 1.2 (1.2) 0.8 (1.0) 1.6 (2.0) Grand River Hospital Corp., Freeport 3, 12
17 Stroke rehabilitation Mean number of CCAC visits provided to stroke patients on discharge from inpatient acute care or inpatient rehabilitation in 2014/15–2015/16 5.9 (6.0) - - Waterloo Wellington CCAC 3, 6
18§ Stroke rehabilitation Proportion of patients admitted to inpatient rehabilitation with severe stroke (RPG 1100 or 1110) 47.6% (48.6%) 35.7% (24.1%) 54.1% (55.6%) Providence Healthcare 7
19§ Reintegration Proportion of stroke/TIA patients discharged from acute care to LTC/CCC (excluding patients originating from LTC/CCC) 8.0% (7.1%) 4.3% (2.0%) 13.5% (10.7%) Belleville Sub-LHIN 10, 1
20§ Reintegration Age- and sex-adjusted7 readmission rate at 30 days for patients with stroke/TIA for all diagnoses (per 100 patients) 7.1 (8.0) 0.0 (4.4) 14.5 (13.4) - None
Hospital Service Accountability Agreement indicator, 2015/16 - Data not available § Contributes to QBP performance
1 Statistically significant improvement.
2 Performance improving but not statistically significant.
3 No change or performance decline.
4 Facility-based analysis (excluding Indicators 1, 2, 4, 7, 8, 11 and 19) for patients aged 18–108. Indicators are based on CIHI data. Low rates are desired for Indicators 2, 3, 6, 10, 13, 19 and 20.
5 Excludes sub-LHINs or facilities with fewer than six patients.
6 Sub-LHIN/facility: Greatest improvement from 2012/13 among acute care institutions treating more than 100 stroke patients per year, rehabilitation facilities admitting more than 64 stroke patients per year, or sub-LHINs with at least 30 stroke patients per year. LHIN: Top two with greatest statistically significant improvement from 2012/13.
7 The 2012/13-2015/16 LHIN rate was used in calculating the LHIN risk-adjusted rate.
8 The revised definition was developed with the consensus of Ontario Stroke Network regional directors (February 2014). There were 14 stroke units in 2012/13, 16 in 2013/14, 21 in 2014/15 and 28 in 2015/16.
Local Health Integration Networks (LHINs)1 Erie St. Clair 6 Mississauga Halton 11 Champlain2 South West 7 Toronto Central 12 North Simcoe Muskoka3 Waterloo Wellington 8 Central 13 North East4 Hamilton Niagara Haldimand Brant 9 Central East 14 North West5 Central West 10 South East

Institute for Clinical Evaluative Sciences 59
ONTARIO AND LHIN 2015/16 STROKE REPORT CARDS AND PROGRESS REPORTS
INTERPRETATION OF 2015/16 STROKE REPORT CARD Central East Local Health Integration Network
PERFORMANCE OVERVIEWThe Central East LHIN had exemplary performance on Indicator 7 (tPA), poor performance on three indicators and progressed well on four indicators linked to local efforts. There was no notable progress on eight indicators. Variation remained an issue. System and cross-LHIN planning is required to improve performance.
AREAS OF PROGRESS
Stroke Prevention Local efforts led to marked improvement (progressing well compared to previous three years) and reduced variation within the LHIN for carotid imaging and anticoagulation (Indicators 4 and 5; among the most improved LHINs).
Acute Stroke Management Stroke unit access remains a focus with five of 15 sites meeting the QBP definition, which resulted in improvement on most acute indicators. There was notable improvement in tPA access and DTN time.
Stroke Rehabilitation Performance remains stable with minimal improvement on most rehabilitation indicators; however, significant improvement was achieved in the proportion of patients meeting RPG LOS targets.
Community Reintegration 30-day readmission rates improved (7.1% in 2015/16 compared to 8.0% over the previous three years).
AREAS FOR IMPROVEMENT ASSOCIATED CURRENT OR PLANNED ACTIVITIES
AccessSupport QBP implementation including EVT and stroke unit access with seven days/week allied health coverage to optimize outcomes.
Local efforts will be supported through reorganization of acute and rehabilitation stroke services to achieve critical mass, enable establishment of additional stroke units, and develop LHIN-wide processes to ensure access to stroke unit care. Streamlined processes to access EVT for patients in the Central East LHIN will be developed and implemented (i.e., flow across LHINs).
AccessCoordinated approach to support access to secondary prevention services, consistency in health service provider practices and improved data quality.
Efforts at the provincial level to establish a reliable and sustainable data collection approach for secondary prevention clinics will be supported. The core elements of secondary prevention will be integrated into cross-LHIN planning for community-based care (QBP). Discussions are planned with local organizations to address prevention practices, documentation and optimal use of designated clinics.
EffectivenessSupport QBP implementation, including rehabilitation intensity seven days/week and six days/week access to rehabilitation beds for all stroke types (including those with complex needs); leverage data for quality improvement.
Engage cross-system planning, build capacity for care within rehabilitation beds, and promote shared accountability to optimize patient outcomes and flow with a focus on severe/complex patients.
AccessSupport QBP recommendations by creating and implementing a standard model of community-based rehabilitation care (outpatient rehabilitation, home-based and early-supported discharge, secondary prevention) within the LHIN.
Cross-LHIN planning discussions initiated in 2016 will continue, to develop and implement a common model of community care with equitable access to community-based rehabilitation services, align with Patients First, and incorporate learnings from the IFM project for stroke.
OPPORTUNITIES FOR LHIN AND STROKE NETWORK COLLABORATION
• Continued partnership in stroke system reorganization to support the above improvement priorities.
• Cross-LHIN collaboration to facilitate equitable access to EVT and to advance the community-based rehabilitation model.
• Work with organizations to ensure data quality and standardized reporting that will facilitate system and facility level improvement.
• Support the realignment of stroke services, associated with the Rouge Valley Health System merger/integration, incorporating the Quality-Based Procedures: Clinical Handbook for Stroke recommendations.
CONTACTJacqueline WillemsRegional Director South East Toronto Stroke [email protected] (416) 864-6060, ext. 3537
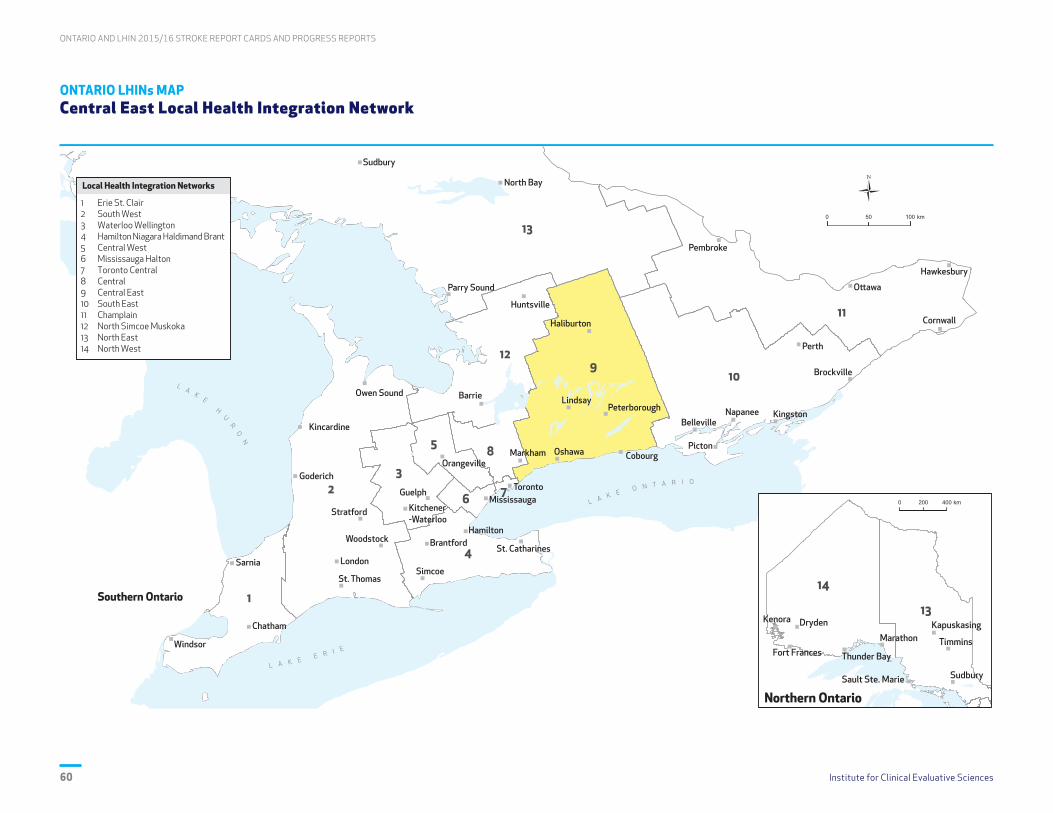
ONTARIO AND LHIN 2015/16 STROKE REPORT CARDS AND PROGRESS REPORTS
Institute for Clinical Evaluative Sciences60
ONTARIO LHINs MAP Central East Local Health Integration Network
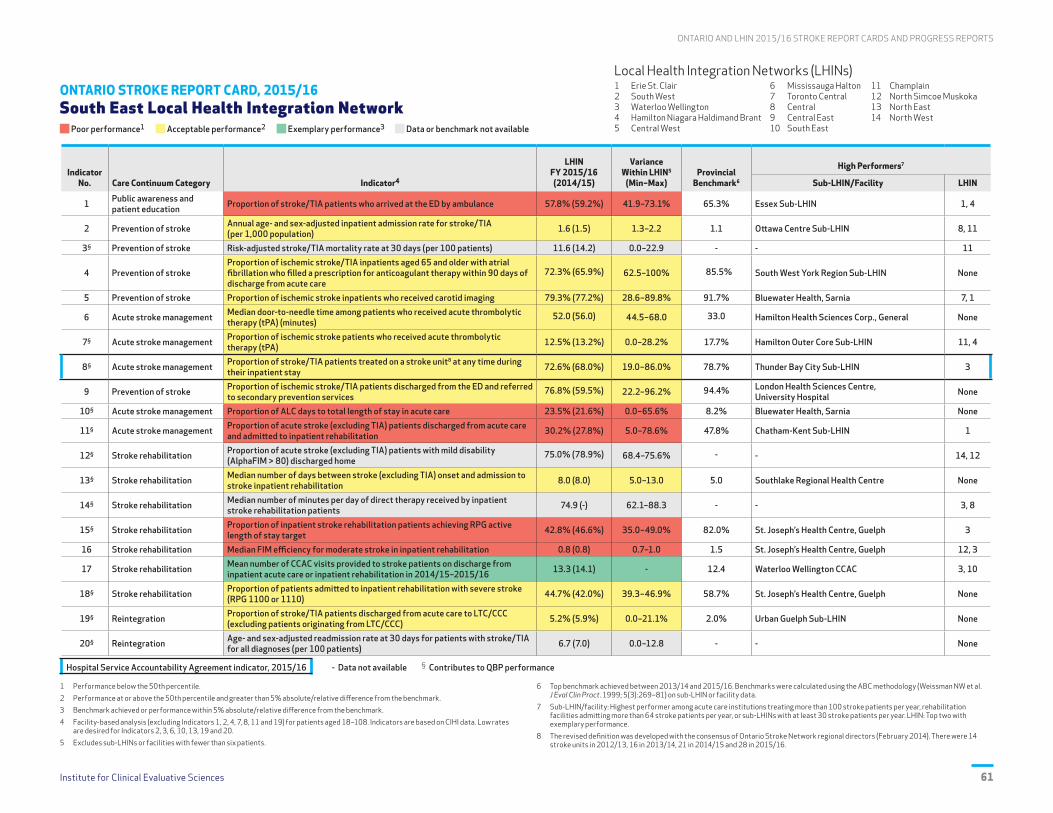
Institute for Clinical Evaluative Sciences 61
ONTARIO AND LHIN 2015/16 STROKE REPORT CARDS AND PROGRESS REPORTS
ONTARIO STROKE REPORT CARD, 2015/16 South East Local Health Integration Network
Poor performance1 Acceptable performance2 Exemplary performance3 Data or benchmark not available
Indicator No. Care Continuum Category Indicator4
LHIN FY 2015/16(2014/15)
Variance Within LHIN5
(Min–Max)Provincial
Benchmark6
High Performers7
Sub-LHIN/Facility LHIN
1 Public awareness and patient education Proportion of stroke/TIA patients who arrived at the ED by ambulance 57.8% (59.2%) 41.9–73.1% 65.3% Essex Sub-LHIN 1, 4
2 Prevention of stroke Annual age- and sex-adjusted inpatient admission rate for stroke/TIA (per 1,000 population) 1.6 (1.5) 1.3–2.2 1.1 Ottawa Centre Sub-LHIN 8, 11
3§ Prevention of stroke Risk-adjusted stroke/TIA mortality rate at 30 days (per 100 patients) 11.6 (14.2) 0.0–22.9 - - 11
4 Prevention of strokeProportion of ischemic stroke/TIA inpatients aged 65 and older with atrial fibrillation who filled a prescription for anticoagulant therapy within 90 days of discharge from acute care
72.3% (65.9%) 62.5–100% 85.5% South West York Region Sub-LHIN None
5 Prevention of stroke Proportion of ischemic stroke inpatients who received carotid imaging 79.3% (77.2%) 28.6–89.8% 91.7% Bluewater Health, Sarnia 7, 1
6 Acute stroke management Median door-to-needle time among patients who received acute thrombolytic therapy (tPA) (minutes)
52.0 (56.0) 44.5–68.0 33.0 Hamilton Health Sciences Corp., General None
7§ Acute stroke management Proportion of ischemic stroke patients who received acute thrombolytic therapy (tPA) 12.5% (13.2%) 0.0–28.2% 17.7% Hamilton Outer Core Sub-LHIN 11, 4
8§ Acute stroke management Proportion of stroke/TIA patients treated on a stroke unit8 at any time during their inpatient stay 72.6% (68.0%) 19.0–86.0% 78.7% Thunder Bay City Sub-LHIN 3
9 Prevention of stroke Proportion of ischemic stroke/TIA patients discharged from the ED and referred to secondary prevention services
76.8% (59.5%) 22.2–96.2% 94.4% London Health Sciences Centre, University Hospital None
10§ Acute stroke management Proportion of ALC days to total length of stay in acute care 23.5% (21.6%) 0.0–65.6% 8.2% Bluewater Health, Sarnia None
11§ Acute stroke management Proportion of acute stroke (excluding TIA) patients discharged from acute care and admitted to inpatient rehabilitation 30.2% (27.8%) 5.0–78.6% 47.8% Chatham-Kent Sub-LHIN 1
12§ Stroke rehabilitation Proportion of acute stroke (excluding TIA) patients with mild disability (AlphaFIM > 80) discharged home
75.0% (78.9%) 68.4–75.6% - - 14, 12
13§ Stroke rehabilitation Median number of days between stroke (excluding TIA) onset and admission to stroke inpatient rehabilitation 8.0 (8.0) 5.0–13.0 5.0 Southlake Regional Health Centre None
14§ Stroke rehabilitation Median number of minutes per day of direct therapy received by inpatient stroke rehabilitation patients 74.9 (-) 62.1–88.3 - - 3, 8
15§ Stroke rehabilitation Proportion of inpatient stroke rehabilitation patients achieving RPG active length of stay target 42.8% (46.6%) 35.0–49.0% 82.0% St. Joseph’s Health Centre, Guelph 3
16 Stroke rehabilitation Median FIM efficiency for moderate stroke in inpatient rehabilitation 0.8 (0.8) 0.7–1.0 1.5 St. Joseph’s Health Centre, Guelph 12, 3
17 Stroke rehabilitation Mean number of CCAC visits provided to stroke patients on discharge from inpatient acute care or inpatient rehabilitation in 2014/15–2015/16 13.3 (14.1) - 12.4 Waterloo Wellington CCAC 3, 10
18§ Stroke rehabilitation Proportion of patients admitted to inpatient rehabilitation with severe stroke (RPG 1100 or 1110) 44.7% (42.0%) 39.3–46.9% 58.7% St. Joseph’s Health Centre, Guelph None
19§ Reintegration Proportion of stroke/TIA patients discharged from acute care to LTC/CCC (excluding patients originating from LTC/CCC) 5.2% (5.9%) 0.0–21.1% 2.0% Urban Guelph Sub-LHIN None
20§ Reintegration Age- and sex-adjusted readmission rate at 30 days for patients with stroke/TIA for all diagnoses (per 100 patients) 6.7 (7.0) 0.0–12.8 - - None
Hospital Service Accountability Agreement indicator, 2015/16 - Data not available § Contributes to QBP performance
1 Performance below the 50th percentile.
2 Performance at or above the 50th percentile and greater than 5% absolute/relative difference from the benchmark.
3 Benchmark achieved or performance within 5% absolute/relative difference from the benchmark.
4 Facility-based analysis (excluding Indicators 1, 2, 4, 7, 8, 11 and 19) for patients aged 18–108. Indicators are based on CIHI data. Low rates are desired for Indicators 2, 3, 6, 10, 13, 19 and 20.
5 Excludes sub-LHINs or facilities with fewer than six patients.
6 Top benchmark achieved between 2013/14 and 2015/16. Benchmarks were calculated using the ABC methodology (Weissman NW et al. J Eval Clin Pract. 1999; 5(3):269–81) on sub-LHIN or facility data.
7 Sub-LHIN/facility: Highest performer among acute care institutions treating more than 100 stroke patients per year, rehabilitation facilities admitting more than 64 stroke patients per year, or sub-LHINs with at least 30 stroke patients per year. LHIN: Top two with exemplary performance.
8 The revised definition was developed with the consensus of Ontario Stroke Network regional directors (February 2014). There were 14 stroke units in 2012/13, 16 in 2013/14, 21 in 2014/15 and 28 in 2015/16.
Local Health Integration Networks (LHINs)1 Erie St. Clair 6 Mississauga Halton 11 Champlain2 South West 7 Toronto Central 12 North Simcoe Muskoka3 Waterloo Wellington 8 Central 13 North East4 Hamilton Niagara Haldimand Brant 9 Central East 14 North West5 Central West 10 South East

ONTARIO AND LHIN 2015/16 STROKE REPORT CARDS AND PROGRESS REPORTS
Institute for Clinical Evaluative Sciences62
STROKE PROGRESS REPORT, 2015/16 COMPARED TO 2012/13–2014/15 South East Local Health Integration Network
Progressing well1 Progressing2 Not progressing3 Data not available
Indicator No. Care Continuum Category Indicator4
LHIN FY 2015/16(Previous
3-Year Average)
Variance Within LHIN5
2015/16 (2012/13) Greatest Improvement6
Min Max Sub-LHIN/Facility LHIN
1 Public awareness and patient education Proportion of stroke/TIA patients who arrived at the ED by ambulance 57.8% (59.1%) 41.9% (28.6%) 73.1% (71.2%) Woodbridge (Vaughan) Sub-LHIN None
2 Prevention of stroke Annual age- and sex-adjusted inpatient admission rate for stroke/TIA (per 1,000 population) 1.6 (1.4) 1.3 (0.8) 2.2 (2.0) Thunder Bay District Sub-LHIN 8
3§ Prevention of stroke Risk-adjusted7 stroke/TIA mortality rate at 30 days (per 100 patients) 12.3 (16.6) 0.0 (14.1) 21.8 (27.4) - 10, 11
4 Prevention of strokeProportion of ischemic stroke/TIA inpatients aged 65 and older with atrial fibrillation who filled a prescription for anticoagulant therapy within 90 days of discharge from acute care
72.3% (66.0%) 62.5% (16.7%) 100% (67.9%) Chatham-Kent Sub-LHIN 9, 4
5 Prevention of stroke Proportion of ischemic stroke inpatients who received carotid imaging 79.3% (73.0%) 28.6% (37.5%) 89.8% (100%) North Bay Regional Health Centre 2, 1
6 Acute stroke management Median door-to-needle time among patients who received acute thrombolytic therapy (tPA) (minutes)
52.0 (56.0) 44.5 (62.5) 68.0 (67.0) University Health Network 6, 7
7§ Acute stroke management Proportion of ischemic stroke patients who received acute thrombolytic therapy (tPA) 12.5% (14.2%) 0.0% (0.0%) 28.2% (29.4%) Timiskaming Sub-LHIN 4, 11
8§ Acute stroke management Proportion of stroke/TIA patients treated on a stroke unit8 at any time during their inpatient stay 72.6% (49.8%) 19.0% (2.5%) 86.0% (83.2%) Belleville Sub-LHIN 14, 2
9 Prevention of stroke Proportion of ischemic stroke/TIA patients discharged from the ED and referred to secondary prevention services
76.8% (-) 22.2% (-) 96.2% (-) - -
10§ Acute stroke management Proportion of ALC days to total length of stay in acute care 23.5% (21.7%) 0.0% (0.0%) 65.6% (31.4%) Rouge Valley Health System, Ajax 5, 3
11§ Acute stroke management Proportion of acute stroke (excluding TIA) patients discharged from acute care and admitted to inpatient rehabilitation 30.2% (29.4%) 5.0% (7.4%) 78.6% (54.5%) Central York Region Sub-LHIN 8, 3
12§ Stroke rehabilitation Proportion of acute stroke (excluding TIA) patients with mild disability (AlphaFIM > 80) discharged home
75.0% (-) 68.4% (-) 75.6% (-) - -
13§ Stroke rehabilitation Median number of days between stroke (excluding TIA) onset and admission to stroke inpatient rehabilitation 8.0 (10.0) 5.0 (6.0) 13.0 (17.0) William Osler Health System, Brampton 5, 8, 10
14§ Stroke rehabilitation Median number of minutes per day of direct therapy received by inpatient stroke rehabilitation patients 74.9 (-) 62.1 (-) 88.3 (-) - -
15§ Stroke rehabilitation Proportion of inpatient stroke rehabilitation patients achieving RPG active length of stay target 42.8% (44.4%) 35.0% (19.0%) 49.0% (59.1%) Hotel Dieu Shaver 3, 5
16 Stroke rehabilitation Median FIM efficiency for moderate stroke in inpatient rehabilitation 0.8 (0.8) 0.7 (0.5) 1.0 (1.0) Grand River Hospital Corp., Freeport 3, 12
17 Stroke rehabilitation Mean number of CCAC visits provided to stroke patients on discharge from inpatient acute care or inpatient rehabilitation in 2014/15–2015/16 13.3 (14.2) - - Waterloo Wellington CCAC 3, 6
18§ Stroke rehabilitation Proportion of patients admitted to inpatient rehabilitation with severe stroke (RPG 1100 or 1110) 44.7% (46.0%) 39.3% (44.4%) 46.9% (56.5%) Providence Healthcare 7
19§ Reintegration Proportion of stroke/TIA patients discharged from acute care to LTC/CCC (excluding patients originating from LTC/CCC) 5.2% (8.9%) 0.0% (0.0%) 21.1% (20.3%) Belleville Sub-LHIN 10, 1
20§ Reintegration Age- and sex-adjusted7 readmission rate at 30 days for patients with stroke/TIA for all diagnoses (per 100 patients) 7.0 (7.8) 0.0 (3.9) 13.2 (13.0) - None
Hospital Service Accountability Agreement indicator, 2015/16 - Data not available § Contributes to QBP performance
1 Statistically significant improvement.
2 Performance improving but not statistically significant.
3 No change or performance decline.
4 Facility-based analysis (excluding Indicators 1, 2, 4, 7, 8, 11 and 19) for patients aged 18–108. Indicators are based on CIHI data. Low rates are desired for Indicators 2, 3, 6, 10, 13, 19 and 20.
5 Excludes sub-LHINs or facilities with fewer than six patients.
6 Sub-LHIN/facility: Greatest improvement from 2012/13 among acute care institutions treating more than 100 stroke patients per year, rehabilitation facilities admitting more than 64 stroke patients per year, or sub-LHINs with at least 30 stroke patients per year. LHIN: Top two with greatest statistically significant improvement from 2012/13.
7 The 2012/13-2015/16 LHIN rate was used in calculating the LHIN risk-adjusted rate.
8 The revised definition was developed with the consensus of Ontario Stroke Network regional directors (February 2014). There were 14 stroke units in 2012/13, 16 in 2013/14, 21 in 2014/15 and 28 in 2015/16.
Local Health Integration Networks (LHINs)1 Erie St. Clair 6 Mississauga Halton 11 Champlain2 South West 7 Toronto Central 12 North Simcoe Muskoka3 Waterloo Wellington 8 Central 13 North East4 Hamilton Niagara Haldimand Brant 9 Central East 14 North West5 Central West 10 South East
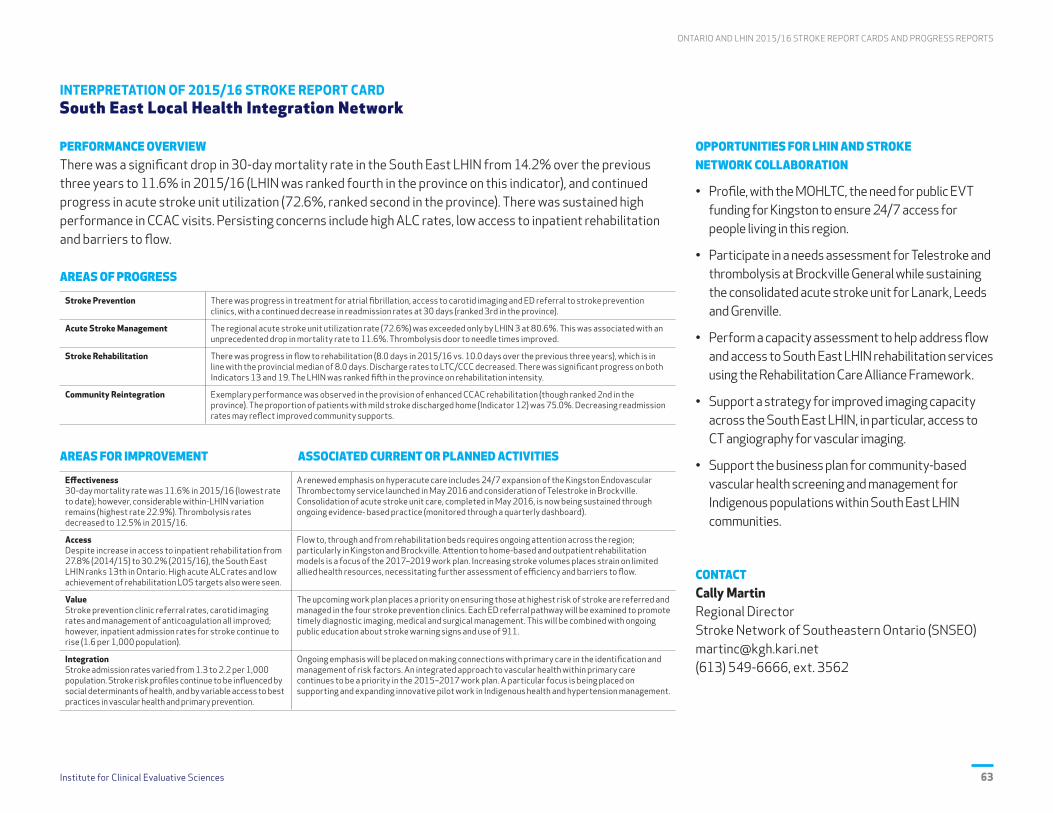
Institute for Clinical Evaluative Sciences 63
ONTARIO AND LHIN 2015/16 STROKE REPORT CARDS AND PROGRESS REPORTS
INTERPRETATION OF 2015/16 STROKE REPORT CARD South East Local Health Integration Network
PERFORMANCE OVERVIEWThere was a significant drop in 30-day mortality rate in the South East LHIN from 14.2% over the previous three years to 11.6% in 2015/16 (LHIN was ranked fourth in the province on this indicator), and continued progress in acute stroke unit utilization (72.6%, ranked second in the province). There was sustained high performance in CCAC visits. Persisting concerns include high ALC rates, low access to inpatient rehabilitation and barriers to flow.
AREAS OF PROGRESS
Stroke Prevention There was progress in treatment for atrial fibrillation, access to carotid imaging and ED referral to stroke prevention clinics, with a continued decrease in readmission rates at 30 days (ranked 3rd in the province).
Acute Stroke Management The regional acute stroke unit utilization rate (72.6%) was exceeded only by LHIN 3 at 80.6%. This was associated with an unprecedented drop in mortality rate to 11.6%. Thrombolysis door to needle times improved.
Stroke Rehabilitation There was progress in flow to rehabilitation (8.0 days in 2015/16 vs. 10.0 days over the previous three years), which is in line with the provincial median of 8.0 days. Discharge rates to LTC/CCC decreased. There was significant progress on both Indicators 13 and 19. The LHIN was ranked fifth in the province on rehabilitation intensity.
Community Reintegration Exemplary performance was observed in the provision of enhanced CCAC rehabilitation (though ranked 2nd in the province). The proportion of patients with mild stroke discharged home (Indicator 12) was 75.0%. Decreasing readmission rates may reflect improved community supports.
AREAS FOR IMPROVEMENT ASSOCIATED CURRENT OR PLANNED ACTIVITIES
Effectiveness30-day mortality rate was 11.6% in 2015/16 (lowest rate to date); however, considerable within-LHIN variation remains (highest rate 22.9%). Thrombolysis rates decreased to 12.5% in 2015/16.
A renewed emphasis on hyperacute care includes 24/7 expansion of the Kingston Endovascular Thrombectomy service launched in May 2016 and consideration of Telestroke in Brockville. Consolidation of acute stroke unit care, completed in May 2016, is now being sustained through ongoing evidence- based practice (monitored through a quarterly dashboard).
AccessDespite increase in access to inpatient rehabilitation from 27.8% (2014/15) to 30.2% (2015/16), the South East LHIN ranks 13th in Ontario. High acute ALC rates and low achievement of rehabilitation LOS targets also were seen.
Flow to, through and from rehabilitation beds requires ongoing attention across the region; particularly in Kingston and Brockville. Attention to home-based and outpatient rehabilitation models is a focus of the 2017–2019 work plan. Increasing stroke volumes places strain on limited allied health resources, necessitating further assessment of efficiency and barriers to flow.
ValueStroke prevention clinic referral rates, carotid imaging rates and management of anticoagulation all improved; however, inpatient admission rates for stroke continue to rise (1.6 per 1,000 population).
The upcoming work plan places a priority on ensuring those at highest risk of stroke are referred and managed in the four stroke prevention clinics. Each ED referral pathway will be examined to promote timely diagnostic imaging, medical and surgical management. This will be combined with ongoing public education about stroke warning signs and use of 911.
IntegrationStroke admission rates varied from 1.3 to 2.2 per 1,000 population. Stroke risk profiles continue to be influenced by social determinants of health, and by variable access to best practices in vascular health and primary prevention.
Ongoing emphasis will be placed on making connections with primary care in the identification and management of risk factors. An integrated approach to vascular health within primary care continues to be a priority in the 2015–2017 work plan. A particular focus is being placed on supporting and expanding innovative pilot work in Indigenous health and hypertension management.
OPPORTUNITIES FOR LHIN AND STROKE NETWORK COLLABORATION
• Profile, with the MOHLTC, the need for public EVT funding for Kingston to ensure 24/7 access for people living in this region.
• Participate in a needs assessment for Telestroke and thrombolysis at Brockville General while sustaining the consolidated acute stroke unit for Lanark, Leeds and Grenville.
• Perform a capacity assessment to help address flow and access to South East LHIN rehabilitation services using the Rehabilitation Care Alliance Framework.
• Support a strategy for improved imaging capacity across the South East LHIN, in particular, access to CT angiography for vascular imaging.
• Support the business plan for community-based vascular health screening and management for Indigenous populations within South East LHIN communities.
CONTACTCally MartinRegional DirectorStroke Network of Southeastern Ontario (SNSEO)[email protected] (613) 549-6666, ext. 3562

ONTARIO AND LHIN 2015/16 STROKE REPORT CARDS AND PROGRESS REPORTS
Institute for Clinical Evaluative Sciences64
ONTARIO LHINs MAP South East Local Health Integration Network

Institute for Clinical Evaluative Sciences 65
ONTARIO AND LHIN 2015/16 STROKE REPORT CARDS AND PROGRESS REPORTS
ONTARIO STROKE REPORT CARD, 2015/16 Champlain Local Health Integration Network
Poor performance1 Acceptable performance2 Exemplary performance3 Data or benchmark not available
Indicator No. Care Continuum Category Indicator4
LHIN FY 2015/16(2014/15)
Variance Within LHIN5
(Min–Max)Provincial
Benchmark6
High Performers7
Sub-LHIN/Facility LHIN
1 Public awareness and patient education Proportion of stroke/TIA patients who arrived at the ED by ambulance 56.9% (58.2%) 51.3–60.2% 65.3% Essex Sub-LHIN 1, 4
2 Prevention of stroke Annual age- and sex-adjusted inpatient admission rate for stroke/TIA (per 1,000 population) 1.1 (1.2) 1.0–1.8 1.1 Ottawa Centre Sub-LHIN 8, 11
3§ Prevention of stroke Risk-adjusted stroke/TIA mortality rate at 30 days (per 100 patients) 9.8 (10.6) 0.0–34.2 - - 11
4 Prevention of strokeProportion of ischemic stroke/TIA inpatients aged 65 and older with atrial fibrillation who filled a prescription for anticoagulant therapy within 90 days of discharge from acute care
75.7% (77.9%) 61.3–82.9% 85.5% South West York Region Sub-LHIN None
5 Prevention of stroke Proportion of ischemic stroke inpatients who received carotid imaging 81.6% (76.2%) 20.0–89.1% 91.7% Bluewater Health, Sarnia 7, 1
6 Acute stroke management Median door-to-needle time among patients who received acute thrombolytic therapy (tPA) (minutes)
39.5 (46.0) 35.0–57.0 33.0 Hamilton Health Sciences Corp., General None
7§ Acute stroke management Proportion of ischemic stroke patients who received acute thrombolytic therapy (tPA) 15.0% (11.8%) 7.8–18.5% 17.7% Hamilton Outer Core Sub-LHIN 11, 4
8§ Acute stroke management Proportion of stroke/TIA patients treated on a stroke unit8 at any time during their inpatient stay 10.4% (1.4%) 0.0–72.0% 78.7% Thunder Bay City Sub-LHIN 3
9 Prevention of stroke Proportion of ischemic stroke/TIA patients discharged from the ED and referred to secondary prevention services
87.6% (86.1%) 30.0–94.6% 94.4% London Health Sciences Centre, University Hospital None
10§ Acute stroke management Proportion of ALC days to total length of stay in acute care 30.1% (29.9%) 0.0–47.2% 8.2% Bluewater Health, Sarnia None
11§ Acute stroke management Proportion of acute stroke (excluding TIA) patients discharged from acute care and admitted to inpatient rehabilitation 30.8% (30.7%) 15.4–42.5% 47.8% Chatham-Kent Sub-LHIN 1
12§ Stroke rehabilitation Proportion of acute stroke (excluding TIA) patients with mild disability (AlphaFIM > 80) discharged home
78.0% (77.0%) 42.1–90.8% - - 14, 12
13§ Stroke rehabilitation Median number of days between stroke (excluding TIA) onset and admission to stroke inpatient rehabilitation 15.0 (16.0) 5.0–24.0 5.0 Southlake Regional Health Centre None
14§ Stroke rehabilitation Median number of minutes per day of direct therapy received by inpatient stroke rehabilitation patients 57.4 (-) 36.8–91.5 - - 3, 8
15§ Stroke rehabilitation Proportion of inpatient stroke rehabilitation patients achieving RPG active length of stay target 67.6% (65.5%) 45.6–80.5% 82.0% St. Joseph’s Health Centre, Guelph 3
16 Stroke rehabilitation Median FIM efficiency for moderate stroke in inpatient rehabilitation 0.9 (0.9) 0.7–1.4 1.5 St. Joseph’s Health Centre, Guelph 12, 3
17 Stroke rehabilitation Mean number of CCAC visits provided to stroke patients on discharge from inpatient acute care or inpatient rehabilitation in 2014/15–2015/16 6.9 (5.8) - 12.4 Waterloo Wellington CCAC 3, 10
18§ Stroke rehabilitation Proportion of patients admitted to inpatient rehabilitation with severe stroke (RPG 1100 or 1110) 33.4% (33.8%) 9.1–58.3% 58.7% St. Joseph’s Health Centre, Guelph None
19§ Reintegration Proportion of stroke/TIA patients discharged from acute care to LTC/CCC (excluding patients originating from LTC/CCC) 6.1% (6.6%) 2.5–8.8% 2.0% Urban Guelph Sub-LHIN None
20§ Reintegration Age- and sex-adjusted readmission rate at 30 days for patients with stroke/TIA for all diagnoses (per 100 patients) 7.2 (7.8) 0.0–17.6 - - None
Hospital Service Accountability Agreement indicator, 2015/16 - Data not available § Contributes to QBP performance
1 Performance below the 50th percentile.
2 Performance at or above the 50th percentile and greater than 5% absolute/relative difference from the benchmark.
3 Benchmark achieved or performance within 5% absolute/relative difference from the benchmark.
4 Facility-based analysis (excluding Indicators 1, 2, 4, 7, 8, 11 and 19) for patients aged 18–108. Indicators are based on CIHI data. Low rates are desired for Indicators 2, 3, 6, 10, 13, 19 and 20.
5 Excludes sub-LHINs or facilities with fewer than six patients.
6 Top benchmark achieved between 2013/14 and 2015/16. Benchmarks were calculated using the ABC methodology (Weissman NW et al. J Eval Clin Pract. 1999; 5(3):269–81) on sub-LHIN or facility data.
7 Sub-LHIN/facility: Highest performer among acute care institutions treating more than 100 stroke patients per year, rehabilitation facilities admitting more than 64 stroke patients per year, or sub-LHINs with at least 30 stroke patients per year. LHIN: Top two with exemplary performance.
8 The revised definition was developed with the consensus of Ontario Stroke Network regional directors (February 2014). There were 14 stroke units in 2012/13, 16 in 2013/14, 21 in 2014/15 and 28 in 2015/16.
Local Health Integration Networks (LHINs)1 Erie St. Clair 6 Mississauga Halton 11 Champlain2 South West 7 Toronto Central 12 North Simcoe Muskoka3 Waterloo Wellington 8 Central 13 North East4 Hamilton Niagara Haldimand Brant 9 Central East 14 North West5 Central West 10 South East

ONTARIO AND LHIN 2015/16 STROKE REPORT CARDS AND PROGRESS REPORTS
Institute for Clinical Evaluative Sciences66
STROKE PROGRESS REPORT, 2015/16 COMPARED TO 2012/13–2014/15 Champlain Local Health Integration Network
Progressing well1 Progressing2 Not progressing3 Data not available
Indicator No. Care Continuum Category Indicator4
LHIN FY 2015/16(Previous
3-Year Average)
Variance Within LHIN5
2015/16 (2012/13) Greatest Improvement6
Min Max Sub-LHIN/Facility LHIN
1 Public awareness and patient education Proportion of stroke/TIA patients who arrived at the ED by ambulance 56.9% (59.1%) 51.3% (56.1%) 60.2% (62.5%) Woodbridge (Vaughan) Sub-LHIN None
2 Prevention of stroke Annual age- and sex-adjusted inpatient admission rate for stroke/TIA (per 1,000 population) 1.1 (1.1) 1.0 (1.0) 1.8 (1.6) Thunder Bay District Sub-LHIN 8
3§ Prevention of stroke Risk-adjusted7 stroke/TIA mortality rate at 30 days (per 100 patients) 10.8 (12.7) 0.0 (7.1) 40.7 (55.1) - 10, 11
4 Prevention of strokeProportion of ischemic stroke/TIA inpatients aged 65 and older with atrial fibrillation who filled a prescription for anticoagulant therapy within 90 days of discharge from acute care
75.7% (71.2%) 61.3% (58.3%) 82.9% (71.1%) Chatham-Kent Sub-LHIN 9, 4
5 Prevention of stroke Proportion of ischemic stroke inpatients who received carotid imaging 81.6% (72.4%) 20.0% (16.7%) 89.1% (78.1%) North Bay Regional Health Centre 2, 1
6 Acute stroke management Median door-to-needle time among patients who received acute thrombolytic therapy (tPA) (minutes)
39.5 (47.0) 35.0 (47.0) 57.0 (62.0) University Health Network 6, 7
7§ Acute stroke management Proportion of ischemic stroke patients who received acute thrombolytic therapy (tPA) 15.0% (12.7%) 7.8% (7.8%) 18.5% (16.9%) Timiskaming Sub-LHIN 4, 11
8§ Acute stroke management Proportion of stroke/TIA patients treated on a stroke unit8 at any time during their inpatient stay 10.4% (0.6%) 0.0% (0.0%) 72.0% (5.9%) Belleville Sub-LHIN 14, 2
9 Prevention of stroke Proportion of ischemic stroke/TIA patients discharged from the ED and referred to secondary prevention services
87.6% (-) 30.0% (-) 94.6% (-) - -
10§ Acute stroke management Proportion of ALC days to total length of stay in acute care 30.1% (28.5%) 0.0% (0.0%) 47.2% (46.3%) Rouge Valley Health System, Ajax 5, 3
11§ Acute stroke management Proportion of acute stroke (excluding TIA) patients discharged from acute care and admitted to inpatient rehabilitation 30.8% (29.6%) 15.4% (20.5%) 42.5% (48.3%) Central York Region Sub-LHIN 8, 3
12§ Stroke rehabilitation Proportion of acute stroke (excluding TIA) patients with mild disability (AlphaFIM > 80) discharged home
78.0% (-) 42.1% (-) 90.8% (-) - -
13§ Stroke rehabilitation Median number of days between stroke (excluding TIA) onset and admission to stroke inpatient rehabilitation 15.0 (14.0) 5.0 (6.0) 24.0 (15.0) William Osler Health System, Brampton 5, 8, 10
14§ Stroke rehabilitation Median number of minutes per day of direct therapy received by inpatient stroke rehabilitation patients 57.4 (-) 36.8 (-) 91.5 (-) - -
15§ Stroke rehabilitation Proportion of inpatient stroke rehabilitation patients achieving RPG active length of stay target 67.6% (54.0%) 45.6% (32.0%) 80.5% (72.7%) Hotel Dieu Shaver 3, 5
16 Stroke rehabilitation Median FIM efficiency for moderate stroke in inpatient rehabilitation 0.9 (0.9) 0.7 (0.8) 1.4 (1.3) Grand River Hospital Corp., Freeport 3, 12
17 Stroke rehabilitation Mean number of CCAC visits provided to stroke patients on discharge from inpatient acute care or inpatient rehabilitation in 2014/15–2015/16 6.9 (5.9) - - Waterloo Wellington CCAC 3, 6
18§ Stroke rehabilitation Proportion of patients admitted to inpatient rehabilitation with severe stroke (RPG 1100 or 1110) 33.4% (33.9%) 9.1% (9.1%) 58.3% (46.2%) Providence Healthcare 7
19§ Reintegration Proportion of stroke/TIA patients discharged from acute care to LTC/CCC (excluding patients originating from LTC/CCC) 6.1% (8.8%) 2.5% (1.4%) 8.8% (12.8%) Belleville Sub-LHIN 10, 1
20§ Reintegration Age- and sex-adjusted7 readmission rate at 30 days for patients with stroke/TIA for all diagnoses (per 100 patients) 6.8 (7.1) 0.0 (0.0) 17.5 (54.9) - None
Hospital Service Accountability Agreement indicator, 2015/16 - Data not available § Contributes to QBP performance
1 Statistically significant improvement.
2 Performance improving but not statistically significant.
3 No change or performance decline.
4 Facility-based analysis (excluding Indicators 1, 2, 4, 7, 8, 11 and 19) for patients aged 18–108. Indicators are based on CIHI data. Low rates are desired for Indicators 2, 3, 6, 10, 13, 19 and 20.
5 Excludes sub-LHINs or facilities with fewer than six patients.
6 Sub-LHIN/facility: Greatest improvement from 2012/13 among acute care institutions treating more than 100 stroke patients per year, rehabilitation facilities admitting more than 64 stroke patients per year, or sub-LHINs with at least 30 stroke patients per year. LHIN: Top two with greatest statistically significant improvement from 2012/13.
7 The 2012/13-2015/16 LHIN rate was used in calculating the LHIN risk-adjusted rate.
8 The revised definition was developed with the consensus of Ontario Stroke Network regional directors (February 2014). There were 14 stroke units in 2012/13, 16 in 2013/14, 21 in 2014/15 and 28 in 2015/16.
Local Health Integration Networks (LHINs)1 Erie St. Clair 6 Mississauga Halton 11 Champlain2 South West 7 Toronto Central 12 North Simcoe Muskoka3 Waterloo Wellington 8 Central 13 North East4 Hamilton Niagara Haldimand Brant 9 Central East 14 North West5 Central West 10 South East

Institute for Clinical Evaluative Sciences 67
ONTARIO AND LHIN 2015/16 STROKE REPORT CARDS AND PROGRESS REPORTS
INTERPRETATION OF 2015/16 STROKE REPORT CARD Champlain Local Health Integration Network
PERFORMANCE OVERVIEWThe Champlain Regional Stroke Network (CRSN) continued exemplary/acceptable performance on stroke prevention indicators. Progress was made on eight out of twelve acute and rehabilitation indicators; however, further work is needed to improve flow and access to stroke rehabilitation.
AREAS OF PROGRESS
Stroke Prevention Proportion of ischemic inpatient stroke patients receiving carotid imagining increased (81.6% in 2015/16 vs. 72.4% over the previous three years). Work will continue to address variance within the LHIN.
Acute Stroke Management Progress continued towards achieving the DTN target of 30 mins; median DTN was 39.5 minutes in 2015/16 (7.5 minutes less compared to the previous three years). The Regional Stroke Centre achieved a median DTN time of 35 minutes.
Acute Stroke Management Pembroke Regional Hospital was the first stroke centre within the LHIN to achieve the OSN stroke unit definition, and as a result there was a 9.8% increase in patients receiving stroke unit care.
Stroke Rehabilitation There was a 13.6% increase compared to the previous three years in the proportion of inpatient stroke rehabilitation patients achieving their RPG active LOS target.
AREAS FOR IMPROVEMENT ASSOCIATED CURRENT OR PLANNED ACTIVITIES
EffectivenessStroke unit care: Only 10.4% of Champlain LHIN stroke patients received stroke unit care. The provincial benchmark is 78.7%.
CRSN worked in partnership with The Ottawa Hospital (TOH) to implement another stroke unit at the Regional Stroke Centre in 2016. The plan in 2017/18 is to develop a regional strategy/template for the five other acute hospitals with adequate stroke volumes to support developing site-specific implementation plans.
AccessAccess to CCAC rehabilitation services: The mean number of CCAC visits provided to stroke/TIA patients in the Champlain LHIN was 6.9 compared to the provincial benchmark of 12.4.
In partnership with the CCAC, a Community Stroke Rehabilitation service was implemented in 2016 targeting the eastern counties. Early reports of this initiative demonstrate positive patient experiences and outcomes. The plan for 2017/18 is to develop an expansion strategy on this initiative to Renfrew Counties and Hawkesbury areas.
IntegrationTimely access: The median number of days between stroke onset and admission to stroke inpatient rehabilitation was 15 days in the Champlain LHIN. The provincial benchmark is five days.
CRSN has established partnership tables to develop strategies to improve door-to-transfer time between Elizabeth Bruyère and TOH-Civic, as well as between Glengarry Memorial Hospital and Cornwall Community Hospital. These partnerships have resulted in the implementation of multiple initiatives. In 2017/18 the plan is to include other sites within the LHIN (i.e., Queensway-Carleton Hospital, Hôpital Montfort).
AccessThe stroke QBP handbook recommends a rehabilitation intensity target for inpatient stroke of 180 minutes per day. The median rehabilitation intensity for patients in the Champlain LHIN was 57.4 minutes, with a range from 36.8 to 91.5 minutes across facilities.
Specific strategies (e.g., site visits, monthly data reporting, performance targets, site audits by CRSN Best Practice Team, patient flow improvement strategies) were identified at the 2015/16 regional rehabilitation intensity workshop. Work will continue in 2017/18, with updates on strategies provided at regional rehabilitation operations group. The 2017/18 regional target for rehabilitation intensity is a 10% improvement.
OPPORTUNITIES FOR LHIN AND STROKE NETWORK COLLABORATION
• The Champlain LHIN Sub-Acute Care Capacity Steering Committee has initiated work related to a 2015/16 report that focused on timely access to sub-acute care in the LHIN.
• This report highlighted recommendations for creating integrated inpatient stroke units (acute and rehabilitation), as well as specialized outpatient rehabilitation services.
• Working within the specialized rehabilitation stream of the Champlain LHIN's sub-acute implementation plan, CRSN will take a leadership role in providing recommendations and strategic planning for the future directions of stroke services in Champlain.
• The Champlain LHIN and the Champlain Regional Stroke Network will work collaboratively on this initiative over the next 12 to 18 months.
CONTACTSean GehringRegional DirectorChamplain Regional Stroke Network [email protected] (613) 798-5555, ext. 16167
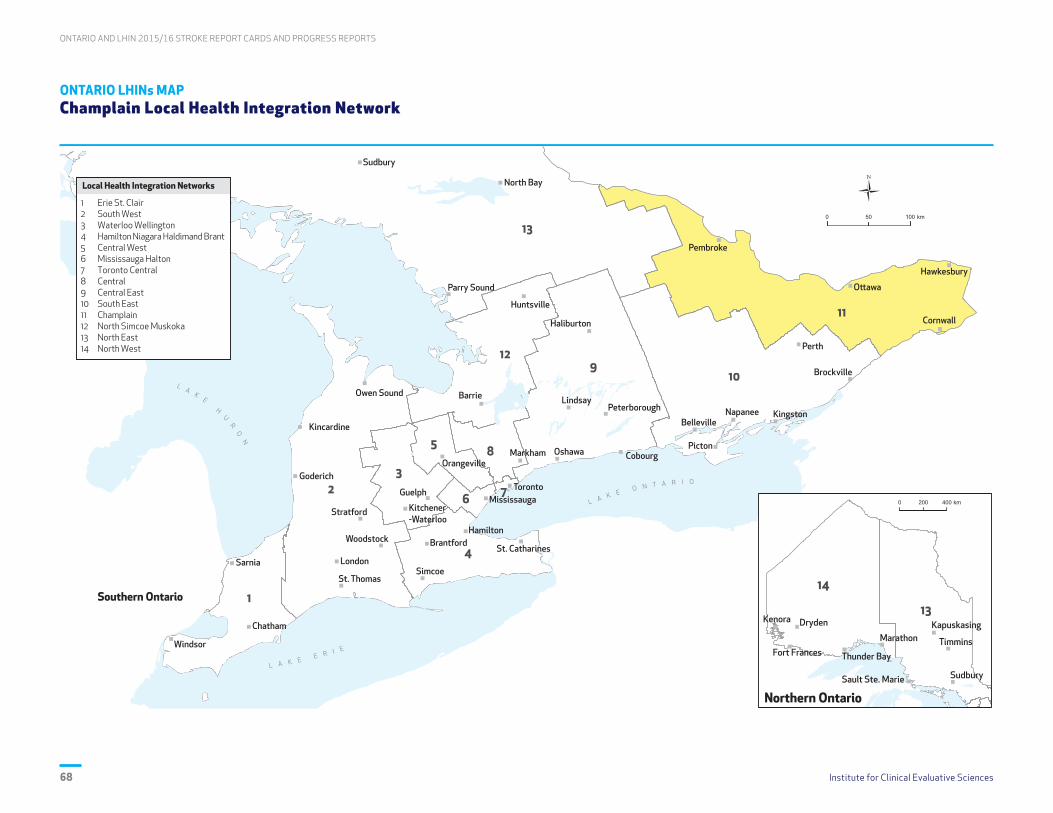
ONTARIO AND LHIN 2015/16 STROKE REPORT CARDS AND PROGRESS REPORTS
Institute for Clinical Evaluative Sciences68
ONTARIO LHINs MAP Champlain Local Health Integration Network

Institute for Clinical Evaluative Sciences 69
ONTARIO AND LHIN 2015/16 STROKE REPORT CARDS AND PROGRESS REPORTS
ONTARIO STROKE REPORT CARD, 2015/16 North Simcoe Muskoka Local Health Integration Network
Poor performance1 Acceptable performance2 Exemplary performance3 Data or benchmark not available
Indicator No. Care Continuum Category Indicator4
LHIN FY 2015/16(2014/15)
Variance Within LHIN5
(Min–Max)Provincial
Benchmark6
High Performers7
Sub-LHIN/Facility LHIN
1 Public awareness and patient education Proportion of stroke/TIA patients who arrived at the ED by ambulance 56.0% (54.3%) 49.3–63.0% 65.3% Essex Sub-LHIN 1, 4
2 Prevention of stroke Annual age- and sex-adjusted inpatient admission rate for stroke/TIA (per 1,000 population) 1.5 (1.5) 1.4–2.2 1.1 Ottawa Centre Sub-LHIN 8, 11
3§ Prevention of stroke Risk-adjusted stroke/TIA mortality rate at 30 days (per 100 patients) 13.2 (12.1) 9.6–17.5 - - 11
4 Prevention of strokeProportion of ischemic stroke/TIA inpatients aged 65 and older with atrial fibrillation who filled a prescription for anticoagulant therapy within 90 days of discharge from acute care
75.5% (80.2%) 57.1–83.3% 85.5% South West York Region Sub-LHIN None
5 Prevention of stroke Proportion of ischemic stroke inpatients who received carotid imaging 72.5% (71.2%) 17.0–96.1% 91.7% Bluewater Health, Sarnia 7, 1
6 Acute stroke management Median door-to-needle time among patients who received acute thrombolytic therapy (tPA) (minutes)
58.0 (45.0) 54.0–76.0 33.0 Hamilton Health Sciences Corp., General None
7§ Acute stroke management Proportion of ischemic stroke patients who received acute thrombolytic therapy (tPA) 11.9% (12.4%) 6.3–16.7% 17.7% Hamilton Outer Core Sub-LHIN 11, 4
8§ Acute stroke management Proportion of stroke/TIA patients treated on a stroke unit8 at any time during their inpatient stay 5.9% (5.8%) 3.2–12.1% 78.7% Thunder Bay City Sub-LHIN 3
9 Prevention of stroke Proportion of ischemic stroke/TIA patients discharged from the ED and referred to secondary prevention services
54.4% (50.0%) 0.0–85.7% 94.4% London Health Sciences Centre, University Hospital None
10§ Acute stroke management Proportion of ALC days to total length of stay in acute care 27.4% (32.1%) 14.1–52.6% 8.2% Bluewater Health, Sarnia None
11§ Acute stroke management Proportion of acute stroke (excluding TIA) patients discharged from acute care and admitted to inpatient rehabilitation 20.9% (27.2%) 19.0–24.4% 47.8% Chatham-Kent Sub-LHIN 1
12§ Stroke rehabilitation Proportion of acute stroke (excluding TIA) patients with mild disability (AlphaFIM > 80) discharged home
82.5% (82.9%) 78.2–95.0% - - 14, 12
13§ Stroke rehabilitation Median number of days between stroke (excluding TIA) onset and admission to stroke inpatient rehabilitation 10.0 (12.0) 8.0–12.0 5.0 Southlake Regional Health Centre None
14§ Stroke rehabilitation Median number of minutes per day of direct therapy received by inpatient stroke rehabilitation patients 43.9 (-) 30.8–58.0 - - 3, 8
15§ Stroke rehabilitation Proportion of inpatient stroke rehabilitation patients achieving RPG active length of stay target 56.1% (54.1%) 31.3–71.4% 82.0% St. Joseph’s Health Centre, Guelph 3
16 Stroke rehabilitation Median FIM efficiency for moderate stroke in inpatient rehabilitation 1.9 (1.6) 1.3–2.2 1.5 St. Joseph’s Health Centre, Guelph 12, 3
17 Stroke rehabilitation Mean number of CCAC visits provided to stroke patients on discharge from inpatient acute care or inpatient rehabilitation in 2014/15–2015/16 8.2 (9.4) - 12.4 Waterloo Wellington CCAC 3, 10
18§ Stroke rehabilitation Proportion of patients admitted to inpatient rehabilitation with severe stroke (RPG 1100 or 1110) 39.4% (42.6%) 33.3–57.7% 58.7% St. Joseph’s Health Centre, Guelph None
19§ Reintegration Proportion of stroke/TIA patients discharged from acute care to LTC/CCC (excluding patients originating from LTC/CCC) 4.2% (4.3%) 2.0–6.9% 2.0% Urban Guelph Sub-LHIN None
20§ Reintegration Age- and sex-adjusted readmission rate at 30 days for patients with stroke/TIA for all diagnoses (per 100 patients) 7.6 (8.6) 4.3–11.2 - - None
Hospital Service Accountability Agreement indicator, 2015/16 - Data not available § Contributes to QBP performance
1 Performance below the 50th percentile.
2 Performance at or above the 50th percentile and greater than 5% absolute/relative difference from the benchmark.
3 Benchmark achieved or performance within 5% absolute/relative difference from the benchmark.
4 Facility-based analysis (excluding Indicators 1, 2, 4, 7, 8, 11 and 19) for patients aged 18–108. Indicators are based on CIHI data. Low rates are desired for Indicators 2, 3, 6, 10, 13, 19 and 20.
5 Excludes sub-LHINs or facilities with fewer than six patients.
6 Top benchmark achieved between 2013/14 and 2015/16. Benchmarks were calculated using the ABC methodology (Weissman NW et al. J Eval Clin Pract. 1999; 5(3):269–81) on sub-LHIN or facility data.
7 Sub-LHIN/facility: Highest performer among acute care institutions treating more than 100 stroke patients per year, rehabilitation facilities admitting more than 64 stroke patients per year, or sub-LHINs with at least 30 stroke patients per year. LHIN: Top two with exemplary performance.
8 The revised definition was developed with the consensus of Ontario Stroke Network regional directors (February 2014). There were 14 stroke units in 2012/13, 16 in 2013/14, 21 in 2014/15 and 28 in 2015/16.
Local Health Integration Networks (LHINs)1 Erie St. Clair 6 Mississauga Halton 11 Champlain2 South West 7 Toronto Central 12 North Simcoe Muskoka3 Waterloo Wellington 8 Central 13 North East4 Hamilton Niagara Haldimand Brant 9 Central East 14 North West5 Central West 10 South East

ONTARIO AND LHIN 2015/16 STROKE REPORT CARDS AND PROGRESS REPORTS
Institute for Clinical Evaluative Sciences70
STROKE PROGRESS REPORT, 2015/16 COMPARED TO 2012/13–2014/15 North Simcoe Muskoka Local Health Integration Network
Progressing well1 Progressing2 Not progressing3 Data not available
Indicator No. Care Continuum Category Indicator4
LHIN FY 2015/16(Previous
3-Year Average)
Variance Within LHIN5
2015/16 (2012/13) Greatest Improvement6
Min Max Sub-LHIN/Facility LHIN
1 Public awareness and patient education Proportion of stroke/TIA patients who arrived at the ED by ambulance 56.0% (57.1%) 49.3% (46.7%) 63.0% (64.3%) Woodbridge (Vaughan) Sub-LHIN None
2 Prevention of stroke Annual age- and sex-adjusted inpatient admission rate for stroke/TIA (per 1,000 population) 1.5 (1.4) 1.4 (1.2) 2.2 (2.0) Thunder Bay District Sub-LHIN 8
3§ Prevention of stroke Risk-adjusted7 stroke/TIA mortality rate at 30 days (per 100 patients) 12.2 (12.9) 8.6 (12.9) 14.6 (15.8) - 10, 11
4 Prevention of strokeProportion of ischemic stroke/TIA inpatients aged 65 and older with atrial fibrillation who filled a prescription for anticoagulant therapy within 90 days of discharge from acute care
75.5% (72.4%) 57.1% (45.5%) 83.3% (69.2%) Chatham-Kent Sub-LHIN 9, 4
5 Prevention of stroke Proportion of ischemic stroke inpatients who received carotid imaging 72.5% (67.7%) 17.0% (36.9%) 96.1% (74.9%) North Bay Regional Health Centre 2, 1
6 Acute stroke management Median door-to-needle time among patients who received acute thrombolytic therapy (tPA) (minutes)
58.0 (58.0) 54.0 (71.5) 76.0 (74.0) University Health Network 6, 7
7§ Acute stroke management Proportion of ischemic stroke patients who received acute thrombolytic therapy (tPA) 11.9% (11.8%) 6.3% (10.4%) 16.7% (15.3%) Timiskaming Sub-LHIN 4, 11
8§ Acute stroke management Proportion of stroke/TIA patients treated on a stroke unit8 at any time during their inpatient stay 5.9% (4.8%) 3.2% (1.0%) 12.1% (7.0%) Belleville Sub-LHIN 14, 2
9 Prevention of stroke Proportion of ischemic stroke/TIA patients discharged from the ED and referred to secondary prevention services
54.4% (-) 0.0% (-) 85.7% (-) - –
10§ Acute stroke management Proportion of ALC days to total length of stay in acute care 27.4% (31.9%) 14.1% (22.5%) 52.6% (44.9%) Rouge Valley Health System, Ajax 5, 3
11§ Acute stroke management Proportion of acute stroke (excluding TIA) patients discharged from acute care and admitted to inpatient rehabilitation 20.9% (30.4%) 19.0% (22.4%) 24.4% (41.5%) Central York Region Sub-LHIN 8, 3
12§ Stroke rehabilitation Proportion of acute stroke (excluding TIA) patients with mild disability (AlphaFIM > 80) discharged home
82.5% (-) 78.2% (-) 95.0% (-) - -
13§ Stroke rehabilitation Median number of days between stroke (excluding TIA) onset and admission to stroke inpatient rehabilitation 10.0 (10.0) 8.0 (7.0) 12.0 (18.5) William Osler Health System, Brampton 5, 8, 10
14§ Stroke rehabilitation Median number of minutes per day of direct therapy received by inpatient stroke rehabilitation patients 43.9 (-) 30.8 (-) 58.0 (-) - -
15§ Stroke rehabilitation Proportion of inpatient stroke rehabilitation patients achieving RPG active length of stay target 56.1% (50.9%) 31.3% (17.4%) 71.4% (65.2%) Hotel Dieu Shaver 3, 5
16 Stroke rehabilitation Median FIM efficiency for moderate stroke in inpatient rehabilitation 1.9 (1.3) 1.3 (0.6) 2.2 (1.3) Grand River Hospital Corp., Freeport 3, 12
17 Stroke rehabilitation Mean number of CCAC visits provided to stroke patients on discharge from inpatient acute care or inpatient rehabilitation in 2014/15–2015/16 8.2 (10.6) - - Waterloo Wellington CCAC 3, 6
18§ Stroke rehabilitation Proportion of patients admitted to inpatient rehabilitation with severe stroke (RPG 1100 or 1110) 39.4% (44.4%) 33.3% (30.0%) 57.7% (56.0%) Providence Healthcare 7
19§ Reintegration Proportion of stroke/TIA patients discharged from acute care to LTC/CCC (excluding patients originating from LTC/CCC) 4.2% (4.6%) 2.0% (1.2%) 6.9% (9.9%) Belleville Sub-LHIN 10, 1
20§ Reintegration Age- and sex-adjusted7 readmission rate at 30 days for patients with stroke/TIA for all diagnoses (per 100 patients) 7.9 (9.2) 4.4 (5.5) 11.4 (12.5) - None
Hospital Service Accountability Agreement indicator, 2015/16 - Data not available § Contributes to QBP performance
1 Statistically significant improvement.
2 Performance improving but not statistically significant.
3 No change or performance decline.
4 Facility-based analysis (excluding Indicators 1, 2, 4, 7, 8, 11 and 19) for patients aged 18–108. Indicators are based on CIHI data. Low rates are desired for Indicators 2, 3, 6, 10, 13, 19 and 20.
5 Excludes sub-LHINs or facilities with fewer than six patients.
6 Sub-LHIN/facility: Greatest improvement from 2012/13 among acute care institutions treating more than 100 stroke patients per year, rehabilitation facilities admitting more than 64 stroke patients per year, or sub-LHINs with at least 30 stroke patients per year. LHIN: Top two with greatest statistically significant improvement from 2012/13.
7 The 2012/13-2015/16 LHIN rate was used in calculating the LHIN risk-adjusted rate.
8 The revised definition was developed with the consensus of Ontario Stroke Network regional directors (February 2014). There were 14 stroke units in 2012/13, 16 in 2013/14, 21 in 2014/15 and 28 in 2015/16.
Local Health Integration Networks (LHINs)1 Erie St. Clair 6 Mississauga Halton 11 Champlain2 South West 7 Toronto Central 12 North Simcoe Muskoka3 Waterloo Wellington 8 Central 13 North East4 Hamilton Niagara Haldimand Brant 9 Central East 14 North West5 Central West 10 South East

Institute for Clinical Evaluative Sciences 71
ONTARIO AND LHIN 2015/16 STROKE REPORT CARDS AND PROGRESS REPORTS
INTERPRETATION OF 2015/16 STROKE REPORT CARD North Simcoe Muskoka Local Health Integration Network
PERFORMANCE OVERVIEWThe North Simcoe Muskoka LHIN progressed significantly on two indicators. There was no noted improvement on seven indicators. Compared to other LHINs, there was exemplary/acceptable performance on eight indicators and poor performance on eight indicators. Variation within the LHIN remained an issue for all indicators.
AREAS OF PROGRESS
Stroke Prevention Trended data demonstrated continuous improvement in carotid imaging (Indicator 5); this indicator was highly variable within the LHIN (yellow/acceptable performance).
Stroke Prevention Local efforts resulted in increased referrals to secondary prevention (Indicator 9); continued attention is required (red/poor performance).
Stroke Rehabilitation The LHIN had exemplary performance in FIM efficiency (Indicator 16). The IDEAS project is under way to evaluate data quality, as this indicator is well above the benchmark.
Community Reintegration Thirty-day readmission rates improved from 8.6 over the previous three years to 7.6 in 2015/16 (Indicator 20).
AREAS FOR IMPROVEMENT ASSOCIATED CURRENT OR PLANNED ACTIVITIES
IntegrationSupport QBP implementation, including a coordinated approach to urgent secondary stroke prevention and stroke unit access.
Ongoing efforts to implement a North Simcoe Muskoka integrated stroke program include completion of Phase One, implementation planning for Phase Two and readiness discussions for Phase Three. Provincial efforts to establish a reliable and sustainable data collection approach for secondary prevention clinics and execution of a Stroke Prevention Model of Care (core elements) will be supported.
EffectivenessSupport QBP implementation, including rehabilitation intensity seven days/week and six days/week access to rehabilitation beds for all stroke types (including those with complex needs).
Support organizational efforts to use rehabilitation intensity data for the development of local quality improvement initiatives that will improve quantity of rehabilitation intensity and achieve three hours per day of rehabilitation intensity for patients in inpatient rehabilitation.
AppropriatenessSupport QBP recommendations by implementing a standard model of community-based rehabilitation care (outpatient rehabilitation, home-based and early-supported discharge).
Plans will be advanced for the North Simcoe Muskoka Integrated Stroke Program to create capacity and equitable access to community-based rehabilitation services that align with the QBP Clinical Handbook for Stroke.
AccessSupport QBP implementation to develop processes to ensure access to EVT in response to provincial planning.
Collaboration with cross-LHIN and local stakeholders will aim to develop a plan for implementing a streamlined process for accessing EVT. Participate in provincial capacity planning discussions to develop access to EVT for patients living where there is currently a greater than two-hour patient transfer time to an EVT Centre.
OPPORTUNITIES FOR LHIN AND STROKE NETWORK COLLABORATION
• Continue partnerships to advance QBP implementation and all phases of the North Simcoe Muskoka Integrated Stroke Program.
• Collaborate and support planning to ensure access for emerging best practice for EVT, including capacity discussions.
CONTACTCheryl MoherRegional DirectorCentral East Stroke [email protected] (705) 728-9090, ext. 46300
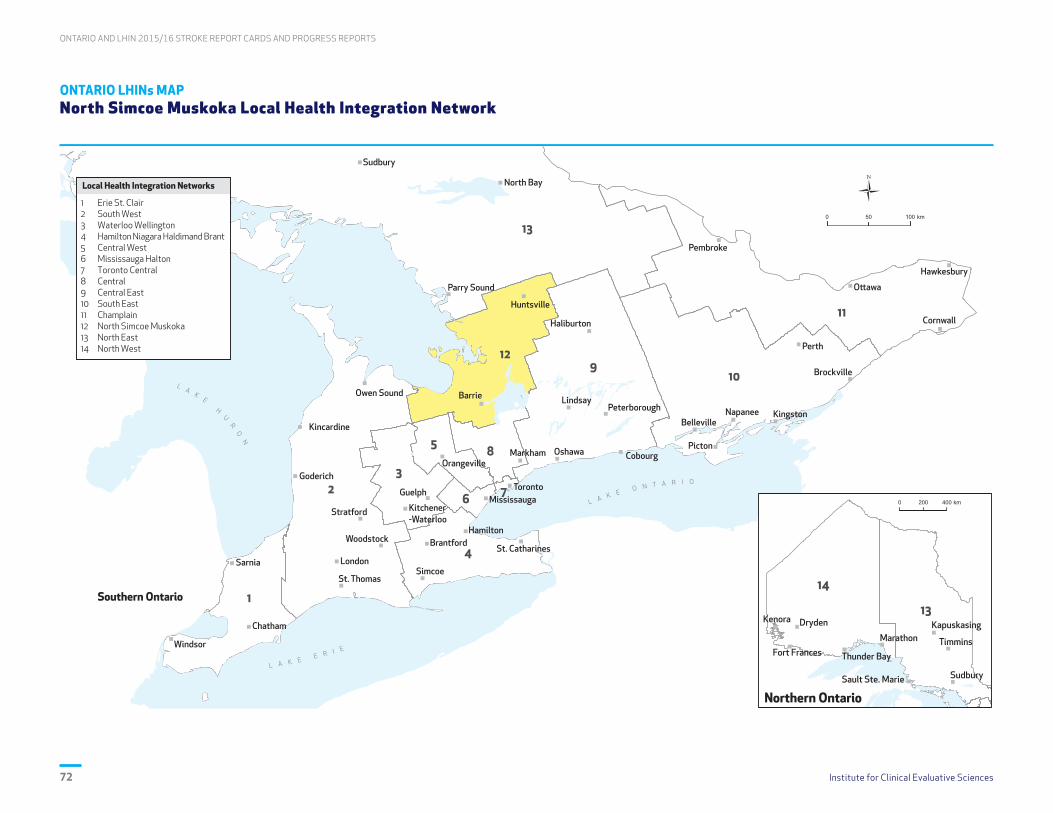
ONTARIO AND LHIN 2015/16 STROKE REPORT CARDS AND PROGRESS REPORTS
Institute for Clinical Evaluative Sciences72
ONTARIO LHINs MAP North Simcoe Muskoka Local Health Integration Network

Institute for Clinical Evaluative Sciences 73
ONTARIO AND LHIN 2015/16 STROKE REPORT CARDS AND PROGRESS REPORTS
ONTARIO STROKE REPORT CARD, 2015/16 North East Local Health Integration Network
Poor performance1 Acceptable performance2 Exemplary performance3 Data or benchmark not available
Indicator No. Care Continuum Category Indicator4
LHIN FY 2015/16(2014/15)
Variance Within LHIN5
(Min–Max)Provincial
Benchmark6
High Performers7
Sub-LHIN/Facility LHIN
1 Public awareness and patient education Proportion of stroke/TIA patients who arrived at the ED by ambulance 56.8% (57.6%) 33.3–63.4% 65.3% Essex Sub-LHIN 1, 4
2 Prevention of stroke Annual age- and sex-adjusted inpatient admission rate for stroke/TIA (per 1,000 population) 1.7 (1.8) 1.7–5.0 1.1 Ottawa Centre Sub-LHIN 8, 11
3§ Prevention of stroke Risk-adjusted stroke/TIA mortality rate at 30 days (per 100 patients) 15.2 (13.2) 0.0–49.6 - - 11
4 Prevention of strokeProportion of ischemic stroke/TIA inpatients aged 65 and older with atrial fibrillation who filled a prescription for anticoagulant therapy within 90 days of discharge from acute care
66.9% (70.2%) 33.3–72.0% 85.5% South West York Region Sub-LHIN None
5 Prevention of stroke Proportion of ischemic stroke inpatients who received carotid imaging 81.8% (77.2%) 14.3–90.8% 91.7% Bluewater Health, Sarnia 7, 1
6 Acute stroke management Median door-to-needle time among patients who received acute thrombolytic therapy (tPA) (minutes)
72.0 (76.5) 59.0–104.5 33.0 Hamilton Health Sciences Corp., General None
7§ Acute stroke management Proportion of ischemic stroke patients who received acute thrombolytic therapy (tPA) 11.8% (10.1%) 0.0–14.0% 17.7% Hamilton Outer Core Sub-LHIN 11, 4
8§ Acute stroke management Proportion of stroke/TIA patients treated on a stroke unit8 at any time during their inpatient stay 2.6% (2.1%) 0.0–6.0% 78.7% Thunder Bay City Sub-LHIN 3
9 Prevention of stroke Proportion of ischemic stroke/TIA patients discharged from the ED and referred to secondary prevention services
51.3% (53.3%) 0.0–81.8% 94.4% London Health Sciences Centre, University Hospital None
10§ Acute stroke management Proportion of ALC days to total length of stay in acute care 42.8% (25.3%) 0.0–66.9% 8.2% Bluewater Health, Sarnia None
11§ Acute stroke management Proportion of acute stroke (excluding TIA) patients discharged from acute care and admitted to inpatient rehabilitation 39.9% (36.6%) 21.6–51.3% 47.8% Chatham-Kent Sub-LHIN 1
12§ Stroke rehabilitation Proportion of acute stroke (excluding TIA) patients with mild disability (AlphaFIM > 80) discharged home
72.0% (62.2%) 44.7–97.2% - - 14, 12
13§ Stroke rehabilitation Median number of days between stroke (excluding TIA) onset and admission to stroke inpatient rehabilitation 9.0 (9.5) 7.0–10.0 5.0 Southlake Regional Health Centre None
14§ Stroke rehabilitation Median number of minutes per day of direct therapy received by inpatient stroke rehabilitation patients 71.6 (-) 41.9–97.9 - - 3, 8
15§ Stroke rehabilitation Proportion of inpatient stroke rehabilitation patients achieving RPG active length of stay target 37.9% (40.1%) 26.8–72.2% 82.0% St. Joseph’s Health Centre, Guelph 3
16 Stroke rehabilitation Median FIM efficiency for moderate stroke in inpatient rehabilitation 0.7 (0.7) 0.6–1.5 1.5 St. Joseph’s Health Centre, Guelph 12, 3
17 Stroke rehabilitation Mean number of CCAC visits provided to stroke patients on discharge from inpatient acute care or inpatient rehabilitation in 2014/15–2015/16 8.3 (10.3) - 12.4 Waterloo Wellington CCAC 3, 10
18§ Stroke rehabilitation Proportion of patients admitted to inpatient rehabilitation with severe stroke (RPG 1100 or 1110) 31.1% (31.5%) 22.2–55.6% 58.7% St. Joseph’s Health Centre, Guelph None
19§ Reintegration Proportion of stroke/TIA patients discharged from acute care to LTC/CCC (excluding patients originating from LTC/CCC) 4.9% (3.5%) 0.0–7.4% 2.0% Urban Guelph Sub-LHIN None
20§ Reintegration Age- and sex-adjusted readmission rate at 30 days for patients with stroke/TIA for all diagnoses (per 100 patients) 8.5 (8.4) 0.0–23.4 - - None
Hospital Service Accountability Agreement indicator, 2015/16 - Data not available § Contributes to QBP performance
1 Performance below the 50th percentile.
2 Performance at or above the 50th percentile and greater than 5% absolute/relative difference from the benchmark.
3 Benchmark achieved or performance within 5% absolute/relative difference from the benchmark.
4 Facility-based analysis (excluding Indicators 1, 2, 4, 7, 8, 11 and 19) for patients aged 18–108. Indicators are based on CIHI data. Low rates are desired for Indicators 2, 3, 6, 10, 13, 19 and 20.
5 Excludes sub-LHINs or facilities with fewer than six patients.
6 Top benchmark achieved between 2013/14 and 2015/16. Benchmarks were calculated using the ABC methodology (Weissman NW et al. J Eval Clin Pract. 1999; 5(3):269–81) on sub-LHIN or facility data.
7 Sub-LHIN/facility: Highest performer among acute care institutions treating more than 100 stroke patients per year, rehabilitation facilities admitting more than 64 stroke patients per year, or sub-LHINs with at least 30 stroke patients per year. LHIN: Top two with exemplary performance.
8 The revised definition was developed with the consensus of Ontario Stroke Network regional directors (February 2014). There were 14 stroke units in 2012/13, 16 in 2013/14, 21 in 2014/15 and 28 in 2015/16.
Local Health Integration Networks (LHINs)1 Erie St. Clair 6 Mississauga Halton 11 Champlain2 South West 7 Toronto Central 12 North Simcoe Muskoka3 Waterloo Wellington 8 Central 13 North East4 Hamilton Niagara Haldimand Brant 9 Central East 14 North West5 Central West 10 South East
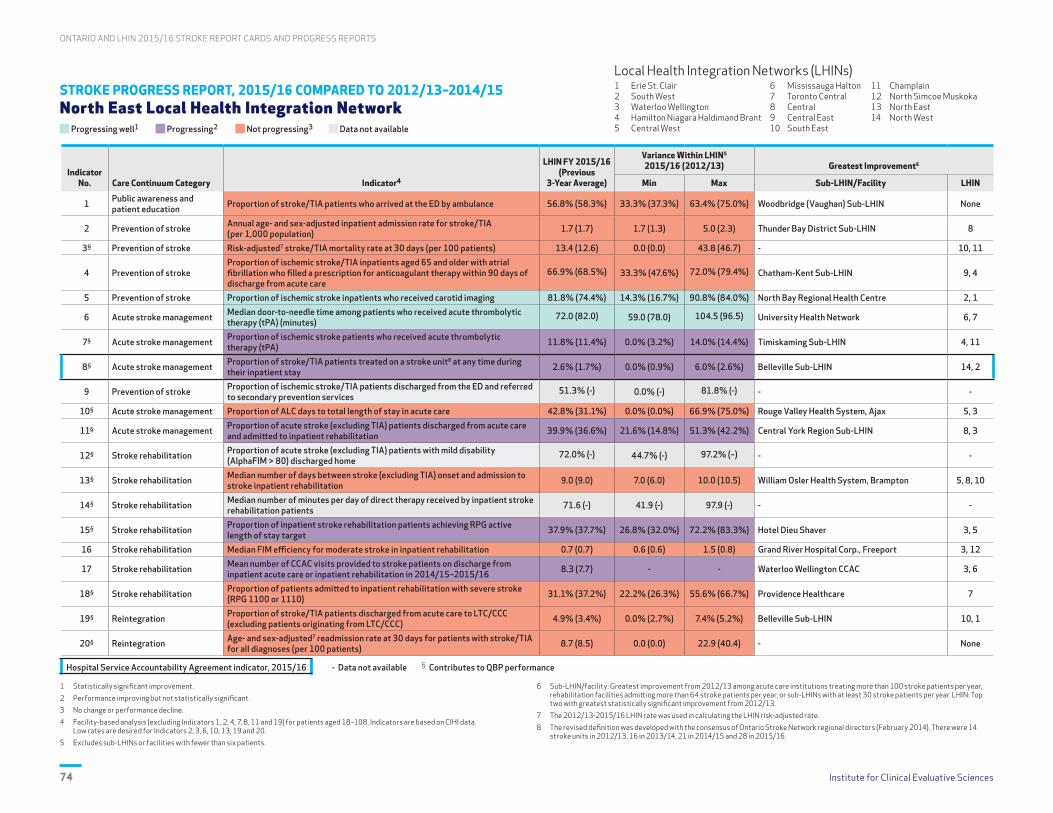
ONTARIO AND LHIN 2015/16 STROKE REPORT CARDS AND PROGRESS REPORTS
Institute for Clinical Evaluative Sciences74
STROKE PROGRESS REPORT, 2015/16 COMPARED TO 2012/13–2014/15 North East Local Health Integration Network
Progressing well1 Progressing2 Not progressing3 Data not available
Indicator No. Care Continuum Category Indicator4
LHIN FY 2015/16(Previous
3-Year Average)
Variance Within LHIN5
2015/16 (2012/13) Greatest Improvement6
Min Max Sub-LHIN/Facility LHIN
1 Public awareness and patient education Proportion of stroke/TIA patients who arrived at the ED by ambulance 56.8% (58.3%) 33.3% (37.3%) 63.4% (75.0%) Woodbridge (Vaughan) Sub-LHIN None
2 Prevention of stroke Annual age- and sex-adjusted inpatient admission rate for stroke/TIA (per 1,000 population) 1.7 (1.7) 1.7 (1.3) 5.0 (2.3) Thunder Bay District Sub-LHIN 8
3§ Prevention of stroke Risk-adjusted7 stroke/TIA mortality rate at 30 days (per 100 patients) 13.4 (12.6) 0.0 (0.0) 43.8 (46.7) - 10, 11
4 Prevention of strokeProportion of ischemic stroke/TIA inpatients aged 65 and older with atrial fibrillation who filled a prescription for anticoagulant therapy within 90 days of discharge from acute care
66.9% (68.5%) 33.3% (47.6%) 72.0% (79.4%) Chatham-Kent Sub-LHIN 9, 4
5 Prevention of stroke Proportion of ischemic stroke inpatients who received carotid imaging 81.8% (74.4%) 14.3% (16.7%) 90.8% (84.0%) North Bay Regional Health Centre 2, 1
6 Acute stroke management Median door-to-needle time among patients who received acute thrombolytic therapy (tPA) (minutes)
72.0 (82.0) 59.0 (78.0) 104.5 (96.5) University Health Network 6, 7
7§ Acute stroke management Proportion of ischemic stroke patients who received acute thrombolytic therapy (tPA) 11.8% (11.4%) 0.0% (3.2%) 14.0% (14.4%) Timiskaming Sub-LHIN 4, 11
8§ Acute stroke management Proportion of stroke/TIA patients treated on a stroke unit8 at any time during their inpatient stay 2.6% (1.7%) 0.0% (0.9%) 6.0% (2.6%) Belleville Sub-LHIN 14, 2
9 Prevention of stroke Proportion of ischemic stroke/TIA patients discharged from the ED and referred to secondary prevention services
51.3% (-) 0.0% (-) 81.8% (-) - -
10§ Acute stroke management Proportion of ALC days to total length of stay in acute care 42.8% (31.1%) 0.0% (0.0%) 66.9% (75.0%) Rouge Valley Health System, Ajax 5, 3
11§ Acute stroke management Proportion of acute stroke (excluding TIA) patients discharged from acute care and admitted to inpatient rehabilitation 39.9% (36.6%) 21.6% (14.8%) 51.3% (42.2%) Central York Region Sub-LHIN 8, 3
12§ Stroke rehabilitation Proportion of acute stroke (excluding TIA) patients with mild disability (AlphaFIM > 80) discharged home
72.0% (-) 44.7% (-) 97.2% (–) - -
13§ Stroke rehabilitation Median number of days between stroke (excluding TIA) onset and admission to stroke inpatient rehabilitation 9.0 (9.0) 7.0 (6.0) 10.0 (10.5) William Osler Health System, Brampton 5, 8, 10
14§ Stroke rehabilitation Median number of minutes per day of direct therapy received by inpatient stroke rehabilitation patients 71.6 (-) 41.9 (-) 97.9 (-) - -
15§ Stroke rehabilitation Proportion of inpatient stroke rehabilitation patients achieving RPG active length of stay target 37.9% (37.7%) 26.8% (32.0%) 72.2% (83.3%) Hotel Dieu Shaver 3, 5
16 Stroke rehabilitation Median FIM efficiency for moderate stroke in inpatient rehabilitation 0.7 (0.7) 0.6 (0.6) 1.5 (0.8) Grand River Hospital Corp., Freeport 3, 12
17 Stroke rehabilitation Mean number of CCAC visits provided to stroke patients on discharge from inpatient acute care or inpatient rehabilitation in 2014/15–2015/16 8.3 (7.7) - - Waterloo Wellington CCAC 3, 6
18§ Stroke rehabilitation Proportion of patients admitted to inpatient rehabilitation with severe stroke (RPG 1100 or 1110) 31.1% (37.2%) 22.2% (26.3%) 55.6% (66.7%) Providence Healthcare 7
19§ Reintegration Proportion of stroke/TIA patients discharged from acute care to LTC/CCC (excluding patients originating from LTC/CCC) 4.9% (3.4%) 0.0% (2.7%) 7.4% (5.2%) Belleville Sub-LHIN 10, 1
20§ Reintegration Age- and sex-adjusted7 readmission rate at 30 days for patients with stroke/TIA for all diagnoses (per 100 patients) 8.7 (8.5) 0.0 (0.0) 22.9 (40.4) - None
Hospital Service Accountability Agreement indicator, 2015/16 - Data not available § Contributes to QBP performance
1 Statistically significant improvement.
2 Performance improving but not statistically significant.
3 No change or performance decline.
4 Facility-based analysis (excluding Indicators 1, 2, 4, 7, 8, 11 and 19) for patients aged 18–108. Indicators are based on CIHI data. Low rates are desired for Indicators 2, 3, 6, 10, 13, 19 and 20.
5 Excludes sub-LHINs or facilities with fewer than six patients.
6 Sub-LHIN/facility: Greatest improvement from 2012/13 among acute care institutions treating more than 100 stroke patients per year, rehabilitation facilities admitting more than 64 stroke patients per year, or sub-LHINs with at least 30 stroke patients per year. LHIN: Top two with greatest statistically significant improvement from 2012/13.
7 The 2012/13-2015/16 LHIN rate was used in calculating the LHIN risk-adjusted rate.
8 The revised definition was developed with the consensus of Ontario Stroke Network regional directors (February 2014). There were 14 stroke units in 2012/13, 16 in 2013/14, 21 in 2014/15 and 28 in 2015/16.
Local Health Integration Networks (LHINs)1 Erie St. Clair 6 Mississauga Halton 11 Champlain2 South West 7 Toronto Central 12 North Simcoe Muskoka3 Waterloo Wellington 8 Central 13 North East4 Hamilton Niagara Haldimand Brant 9 Central East 14 North West5 Central West 10 South East
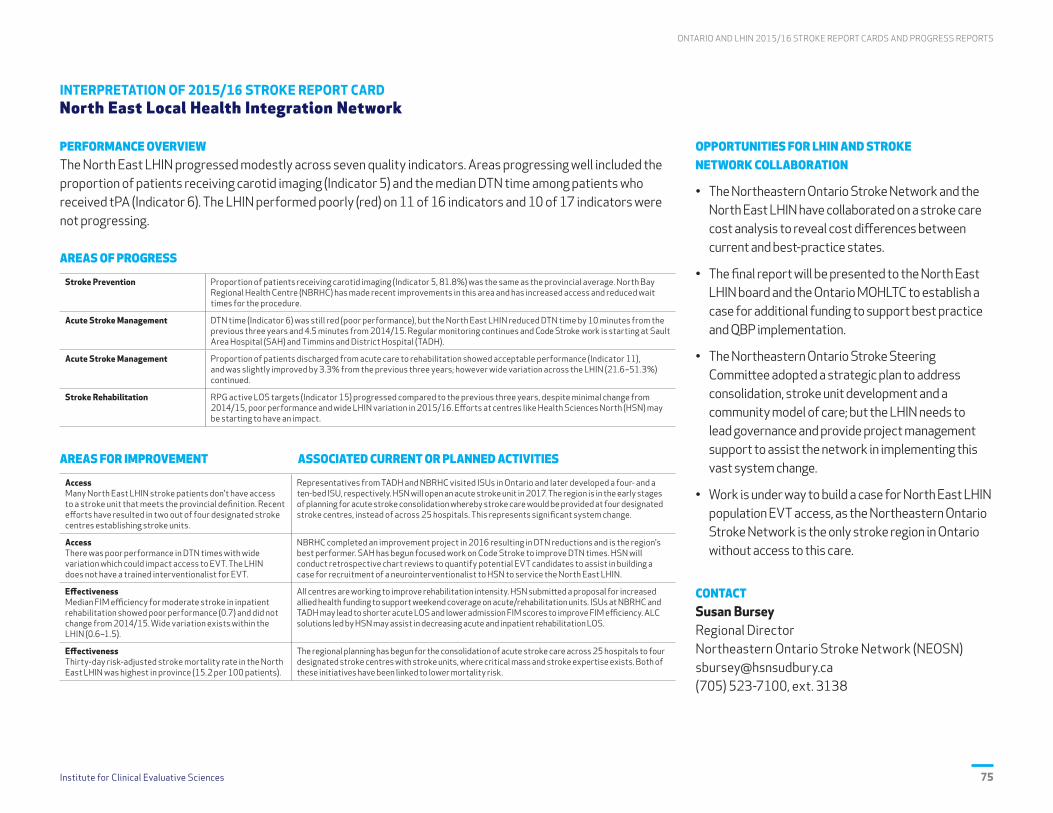
Institute for Clinical Evaluative Sciences 75
ONTARIO AND LHIN 2015/16 STROKE REPORT CARDS AND PROGRESS REPORTS
INTERPRETATION OF 2015/16 STROKE REPORT CARD North East Local Health Integration Network
PERFORMANCE OVERVIEWThe North East LHIN progressed modestly across seven quality indicators. Areas progressing well included the proportion of patients receiving carotid imaging (Indicator 5) and the median DTN time among patients who received tPA (Indicator 6). The LHIN performed poorly (red) on 11 of 16 indicators and 10 of 17 indicators were not progressing.
AREAS OF PROGRESS
Stroke Prevention Proportion of patients receiving carotid imaging (Indicator 5, 81.8%) was the same as the provincial average. North Bay Regional Health Centre (NBRHC) has made recent improvements in this area and has increased access and reduced wait times for the procedure.
Acute Stroke Management DTN time (Indicator 6) was still red (poor performance), but the North East LHIN reduced DTN time by 10 minutes from the previous three years and 4.5 minutes from 2014/15. Regular monitoring continues and Code Stroke work is starting at Sault Area Hospital (SAH) and Timmins and District Hospital (TADH).
Acute Stroke Management Proportion of patients discharged from acute care to rehabilitation showed acceptable performance (Indicator 11), and was slightly improved by 3.3% from the previous three years; however wide variation across the LHIN (21.6–51.3%) continued.
Stroke Rehabilitation RPG active LOS targets (Indicator 15) progressed compared to the previous three years, despite minimal change from 2014/15, poor performance and wide LHIN variation in 2015/16. Efforts at centres like Health Sciences North (HSN) may be starting to have an impact.
AREAS FOR IMPROVEMENT ASSOCIATED CURRENT OR PLANNED ACTIVITIES
AccessMany North East LHIN stroke patients don't have access to a stroke unit that meets the provincial definition. Recent efforts have resulted in two out of four designated stroke centres establishing stroke units.
Representatives from TADH and NBRHC visited ISUs in Ontario and later developed a four- and a ten-bed ISU, respectively. HSN will open an acute stroke unit in 2017. The region is in the early stages of planning for acute stroke consolidation whereby stroke care would be provided at four designated stroke centres, instead of across 25 hospitals. This represents significant system change.
AccessThere was poor performance in DTN times with wide variation which could impact access to EVT. The LHIN does not have a trained interventionalist for EVT.
NBRHC completed an improvement project in 2016 resulting in DTN reductions and is the region's best performer. SAH has begun focused work on Code Stroke to improve DTN times. HSN will conduct retrospective chart reviews to quantify potential EVT candidates to assist in building a case for recruitment of a neurointerventionalist to HSN to service the North East LHIN.
EffectivenessMedian FIM efficiency for moderate stroke in inpatient rehabilitation showed poor performance (0.7) and did not change from 2014/15. Wide variation exists within the LHIN (0.6–1.5).
All centres are working to improve rehabilitation intensity. HSN submitted a proposal for increased allied health funding to support weekend coverage on acute/rehabilitation units. ISUs at NBRHC and TADH may lead to shorter acute LOS and lower admission FIM scores to improve FIM efficiency. ALC solutions led by HSN may assist in decreasing acute and inpatient rehabilitation LOS.
EffectivenessThirty-day risk-adjusted stroke mortality rate in the North East LHIN was highest in province (15.2 per 100 patients).
The regional planning has begun for the consolidation of acute stroke care across 25 hospitals to four designated stroke centres with stroke units, where critical mass and stroke expertise exists. Both of these initiatives have been linked to lower mortality risk.
OPPORTUNITIES FOR LHIN AND STROKE NETWORK COLLABORATION
• The Northeastern Ontario Stroke Network and the North East LHIN have collaborated on a stroke care cost analysis to reveal cost differences between current and best-practice states.
• The final report will be presented to the North East LHIN board and the Ontario MOHLTC to establish a case for additional funding to support best practice and QBP implementation.
• The Northeastern Ontario Stroke Steering Committee adopted a strategic plan to address consolidation, stroke unit development and a community model of care; but the LHIN needs to lead governance and provide project management support to assist the network in implementing this vast system change.
• Work is under way to build a case for North East LHIN population EVT access, as the Northeastern Ontario Stroke Network is the only stroke region in Ontario without access to this care.
CONTACTSusan BurseyRegional DirectorNortheastern Ontario Stroke Network (NEOSN)[email protected] (705) 523-7100, ext. 3138

ONTARIO AND LHIN 2015/16 STROKE REPORT CARDS AND PROGRESS REPORTS
Institute for Clinical Evaluative Sciences76
ONTARIO LHINs MAP North East Local Health Integration Network

Institute for Clinical Evaluative Sciences 77
ONTARIO AND LHIN 2015/16 STROKE REPORT CARDS AND PROGRESS REPORTS
ONTARIO STROKE REPORT CARD, 2015/16 North West Local Health Integration Network
Poor performance1 Acceptable performance2 Exemplary performance3 Data or benchmark not available
Indicator No. Care Continuum Category Indicator4
LHIN FY 2015/16(2014/15)
Variance Within LHIN5
(Min–Max)Provincial
Benchmark6
High Performers7
Sub-LHIN/Facility LHIN
1 Public awareness and patient education Proportion of stroke/TIA patients who arrived at the ED by ambulance 48.2% (49.0%) 34.5–51.8% 65.3% Essex Sub-LHIN 1, 4
2 Prevention of stroke Annual age- and sex-adjusted inpatient admission rate for stroke/TIA (per 1,000 population) 1.9 (1.8) 1.9–2.8 1.1 Ottawa Centre Sub-LHIN 8, 11
3§ Prevention of stroke Risk-adjusted stroke/TIA mortality rate at 30 days (per 100 patients) 14.2 (12.2) 10.7–30.4 - - 11
4 Prevention of strokeProportion of ischemic stroke/TIA inpatients aged 65 and older with atrial fibrillation who filled a prescription for anticoagulant therapy within 90 days of discharge from acute care
71.6% (71.2%) 33.3–81.1% 85.5% South West York Region Sub-LHIN None
5 Prevention of stroke Proportion of ischemic stroke inpatients who received carotid imaging 78.5% (74.5%) 35.3–85.4% 91.7% Bluewater Health, Sarnia 7, 1
6 Acute stroke management Median door-to-needle time among patients who received acute thrombolytic therapy (tPA) (minutes)
68.0 (70.0) 58.0–58.0 33.0 Hamilton Health Sciences Corp., General None
7§ Acute stroke management Proportion of ischemic stroke patients who received acute thrombolytic therapy (tPA) 10.7% (14.0%) 3.1–12.0% 17.7% Hamilton Outer Core Sub-LHIN 11, 4
8§ Acute stroke management Proportion of stroke/TIA patients treated on a stroke unit8 at any time during their inpatient stay 69.7% (1.3%) 33.0–87.1% 78.7% Thunder Bay City Sub-LHIN 3
9 Prevention of stroke Proportion of ischemic stroke/TIA patients discharged from the ED and referred to secondary prevention services
81.0% (56.1%) 25.0–91.5% 94.4% London Health Sciences Centre, University Hospital None
10§ Acute stroke management Proportion of ALC days to total length of stay in acute care 25.0% (32.3%) 0.0–63.1% 8.2% Bluewater Health, Sarnia None
11§ Acute stroke management Proportion of acute stroke (excluding TIA) patients discharged from acute care and admitted to inpatient rehabilitation 40.6% (39.9%) 30.0–46.4% 47.8% Chatham-Kent Sub-LHIN 1
12§ Stroke rehabilitation Proportion of acute stroke (excluding TIA) patients with mild disability (AlphaFIM > 80) discharged home
83.9% (-) 84.8–84.8% - - 14, 12
13§ Stroke rehabilitation Median number of days between stroke (excluding TIA) onset and admission to stroke inpatient rehabilitation 8.0 (10.0) 8.0–8.0 5.0 Southlake Regional Health Centre None
14§ Stroke rehabilitation Median number of minutes per day of direct therapy received by inpatient stroke rehabilitation patients 57.1 (-) - - - 3, 8
15§ Stroke rehabilitation Proportion of inpatient stroke rehabilitation patients achieving RPG active length of stay target 58.0% (47.5%) 51.7–51.7% 82.0% St. Joseph’s Health Centre, Guelph 3
16 Stroke rehabilitation Median FIM efficiency for moderate stroke in inpatient rehabilitation 1.1 (0.8) 1.1–1.1 1.5 St. Joseph’s Health Centre, Guelph 12, 3
17 Stroke rehabilitation Mean number of CCAC visits provided to stroke patients on discharge from inpatient acute care or inpatient rehabilitation in 2014/15–2015/16 5.8 (5.9) - 12.4 Waterloo Wellington CCAC 3, 10
18§ Stroke rehabilitation Proportion of patients admitted to inpatient rehabilitation with severe stroke (RPG 1100 or 1110) 42.9% (40.0%) 42.9–42.9% 58.7% St. Joseph’s Health Centre, Guelph None
19§ Reintegration Proportion of stroke/TIA patients discharged from acute care to LTC/CCC (excluding patients originating from LTC/CCC) 6.5% (7.7%) 1.9–7.9% 2.0% Urban Guelph Sub-LHIN None
20§ Reintegration Age- and sex-adjusted readmission rate at 30 days for patients with stroke/TIA for all diagnoses (per 100 patients) 7.6 (9.1) 0.0–31.6 - - None
Hospital Service Accountability Agreement indicator, 2015/16 - Data not available § Contributes to QBP performance
1 Performance below the 50th percentile.
2 Performance at or above the 50th percentile and greater than 5% absolute/relative difference from the benchmark.
3 Benchmark achieved or performance within 5% absolute/relative difference from the benchmark.
4 Facility-based analysis (excluding Indicators 1, 2, 4, 7, 8, 11 and 19) for patients aged 18–108. Indicators are based on CIHI data. Low rates are desired for Indicators 2, 3, 6, 10, 13, 19 and 20.
5 Excludes sub-LHINs or facilities with fewer than six patients.
6 Top benchmark achieved between 2013/14 and 2015/16. Benchmarks were calculated using the ABC methodology (Weissman NW et al. J Eval Clin Pract. 1999; 5(3):269–81) on sub-LHIN or facility data.
7 Sub-LHIN/facility: Highest performer among acute care institutions treating more than 100 stroke patients per year, rehabilitation facilities admitting more than 64 stroke patients per year, or sub-LHINs with at least 30 stroke patients per year. LHIN: Top two with exemplary performance.
8 The revised definition was developed with the consensus of Ontario Stroke Network regional directors (February 2014). There were 14 stroke units in 2012/13, 16 in 2013/14, 21 in 2014/15 and 28 in 2015/16.
Local Health Integration Networks (LHINs)1 Erie St. Clair 6 Mississauga Halton 11 Champlain2 South West 7 Toronto Central 12 North Simcoe Muskoka3 Waterloo Wellington 8 Central 13 North East4 Hamilton Niagara Haldimand Brant 9 Central East 14 North West5 Central West 10 South East
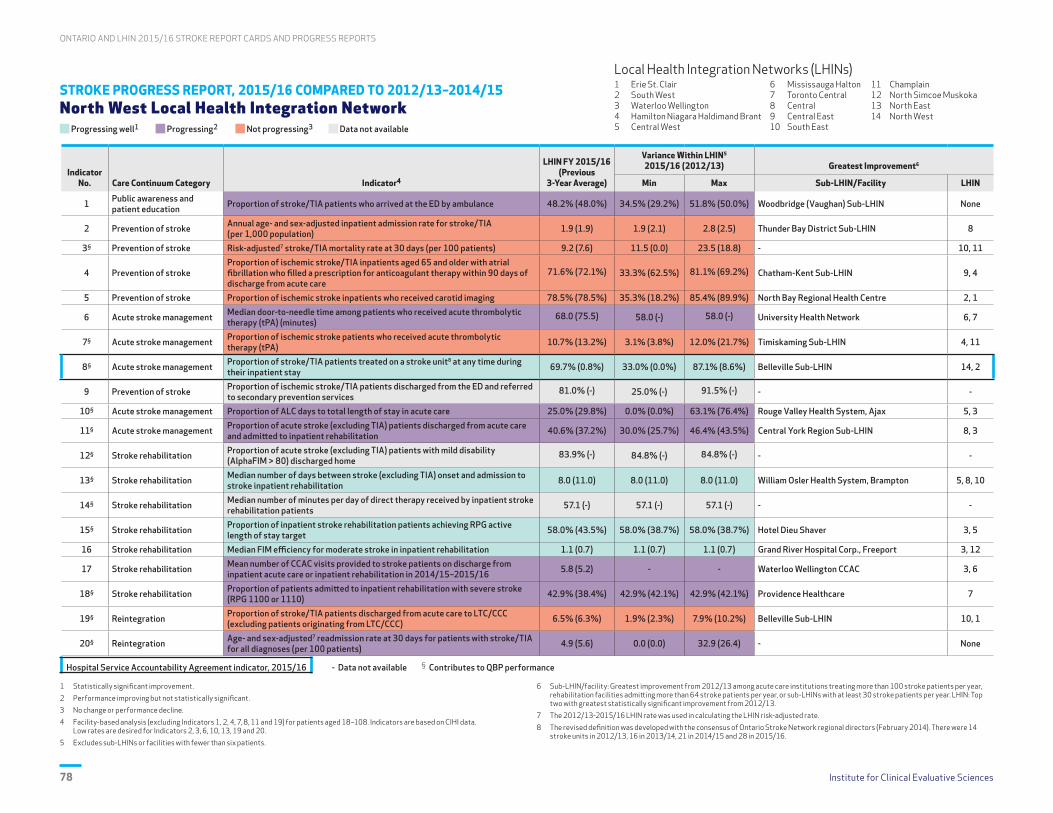
ONTARIO AND LHIN 2015/16 STROKE REPORT CARDS AND PROGRESS REPORTS
Institute for Clinical Evaluative Sciences78
STROKE PROGRESS REPORT, 2015/16 COMPARED TO 2012/13–2014/15 North West Local Health Integration Network
Progressing well1 Progressing2 Not progressing3 Data not available
Indicator No. Care Continuum Category Indicator4
LHIN FY 2015/16(Previous
3-Year Average)
Variance Within LHIN5
2015/16 (2012/13) Greatest Improvement6
Min Max Sub-LHIN/Facility LHIN
1 Public awareness and patient education Proportion of stroke/TIA patients who arrived at the ED by ambulance 48.2% (48.0%) 34.5% (29.2%) 51.8% (50.0%) Woodbridge (Vaughan) Sub-LHIN None
2 Prevention of stroke Annual age- and sex-adjusted inpatient admission rate for stroke/TIA (per 1,000 population) 1.9 (1.9) 1.9 (2.1) 2.8 (2.5) Thunder Bay District Sub-LHIN 8
3§ Prevention of stroke Risk-adjusted7 stroke/TIA mortality rate at 30 days (per 100 patients) 9.2 (7.6) 11.5 (0.0) 23.5 (18.8) - 10, 11
4 Prevention of strokeProportion of ischemic stroke/TIA inpatients aged 65 and older with atrial fibrillation who filled a prescription for anticoagulant therapy within 90 days of discharge from acute care
71.6% (72.1%) 33.3% (62.5%) 81.1% (69.2%) Chatham-Kent Sub-LHIN 9, 4
5 Prevention of stroke Proportion of ischemic stroke inpatients who received carotid imaging 78.5% (78.5%) 35.3% (18.2%) 85.4% (89.9%) North Bay Regional Health Centre 2, 1
6 Acute stroke management Median door-to-needle time among patients who received acute thrombolytic therapy (tPA) (minutes)
68.0 (75.5) 58.0 (-) 58.0 (-) University Health Network 6, 7
7§ Acute stroke management Proportion of ischemic stroke patients who received acute thrombolytic therapy (tPA) 10.7% (13.2%) 3.1% (3.8%) 12.0% (21.7%) Timiskaming Sub-LHIN 4, 11
8§ Acute stroke management Proportion of stroke/TIA patients treated on a stroke unit8 at any time during their inpatient stay 69.7% (0.8%) 33.0% (0.0%) 87.1% (8.6%) Belleville Sub-LHIN 14, 2
9 Prevention of stroke Proportion of ischemic stroke/TIA patients discharged from the ED and referred to secondary prevention services
81.0% (-) 25.0% (-) 91.5% (-) - -
10§ Acute stroke management Proportion of ALC days to total length of stay in acute care 25.0% (29.8%) 0.0% (0.0%) 63.1% (76.4%) Rouge Valley Health System, Ajax 5, 3
11§ Acute stroke management Proportion of acute stroke (excluding TIA) patients discharged from acute care and admitted to inpatient rehabilitation 40.6% (37.2%) 30.0% (25.7%) 46.4% (43.5%) Central York Region Sub-LHIN 8, 3
12§ Stroke rehabilitation Proportion of acute stroke (excluding TIA) patients with mild disability (AlphaFIM > 80) discharged home
83.9% (-) 84.8% (-) 84.8% (-) - -
13§ Stroke rehabilitation Median number of days between stroke (excluding TIA) onset and admission to stroke inpatient rehabilitation 8.0 (11.0) 8.0 (11.0) 8.0 (11.0) William Osler Health System, Brampton 5, 8, 10
14§ Stroke rehabilitation Median number of minutes per day of direct therapy received by inpatient stroke rehabilitation patients 57.1 (-) 57.1 (-) 57.1 (-) - -
15§ Stroke rehabilitation Proportion of inpatient stroke rehabilitation patients achieving RPG active length of stay target 58.0% (43.5%) 58.0% (38.7%) 58.0% (38.7%) Hotel Dieu Shaver 3, 5
16 Stroke rehabilitation Median FIM efficiency for moderate stroke in inpatient rehabilitation 1.1 (0.7) 1.1 (0.7) 1.1 (0.7) Grand River Hospital Corp., Freeport 3, 12
17 Stroke rehabilitation Mean number of CCAC visits provided to stroke patients on discharge from inpatient acute care or inpatient rehabilitation in 2014/15–2015/16 5.8 (5.2) - - Waterloo Wellington CCAC 3, 6
18§ Stroke rehabilitation Proportion of patients admitted to inpatient rehabilitation with severe stroke (RPG 1100 or 1110) 42.9% (38.4%) 42.9% (42.1%) 42.9% (42.1%) Providence Healthcare 7
19§ Reintegration Proportion of stroke/TIA patients discharged from acute care to LTC/CCC (excluding patients originating from LTC/CCC) 6.5% (6.3%) 1.9% (2.3%) 7.9% (10.2%) Belleville Sub-LHIN 10, 1
20§ Reintegration Age- and sex-adjusted7 readmission rate at 30 days for patients with stroke/TIA for all diagnoses (per 100 patients) 4.9 (5.6) 0.0 (0.0) 32.9 (26.4) - None
Hospital Service Accountability Agreement indicator, 2015/16 - Data not available § Contributes to QBP performance
1 Statistically significant improvement.
2 Performance improving but not statistically significant.
3 No change or performance decline.
4 Facility-based analysis (excluding Indicators 1, 2, 4, 7, 8, 11 and 19) for patients aged 18–108. Indicators are based on CIHI data. Low rates are desired for Indicators 2, 3, 6, 10, 13, 19 and 20.
5 Excludes sub-LHINs or facilities with fewer than six patients.
6 Sub-LHIN/facility: Greatest improvement from 2012/13 among acute care institutions treating more than 100 stroke patients per year, rehabilitation facilities admitting more than 64 stroke patients per year, or sub-LHINs with at least 30 stroke patients per year. LHIN: Top two with greatest statistically significant improvement from 2012/13.
7 The 2012/13-2015/16 LHIN rate was used in calculating the LHIN risk-adjusted rate.
8 The revised definition was developed with the consensus of Ontario Stroke Network regional directors (February 2014). There were 14 stroke units in 2012/13, 16 in 2013/14, 21 in 2014/15 and 28 in 2015/16.
Local Health Integration Networks (LHINs)1 Erie St. Clair 6 Mississauga Halton 11 Champlain2 South West 7 Toronto Central 12 North Simcoe Muskoka3 Waterloo Wellington 8 Central 13 North East4 Hamilton Niagara Haldimand Brant 9 Central East 14 North West5 Central West 10 South East

Institute for Clinical Evaluative Sciences 79
ONTARIO AND LHIN 2015/16 STROKE REPORT CARDS AND PROGRESS REPORTS
INTERPRETATION OF 2015/16 STROKE REPORT CARD North West Local Health Integration Network
PERFORMANCE OVERVIEWThe North West LHIN progressed on 11 of 17 indicators, where comparative data existed. Access to acute stroke unit care had the Thunder Bay City Sub-LHIN as provincial high performer. Significant gains were noted in the rehabilitation sector with three indicators demonstrating improved efficiencies.
AREAS OF PROGRESS
Acute Stroke Management The regional stroke unit at Thunder Bay Regional Health Sciences Centre (TBRHSC) opened in April 2015 with excellent access in the Thunder Bay City Sub-LHIN (87.1%), and in the overall LHIN (69.7% in 2015/16 vs. 1.3% in 2014/15).
Acute Stroke Management The time for patients to receive acute thrombolytic therapy (tPA) improved to 68.0 minutes for the North West LHIN (70.0 minutes in 2014/15). Implementing Code Stroke (December 2015) reduced times to 58.0 minutes at TBRHSC.
Stroke Rehabilitation Patients with stroke are accessing inpatient rehabilitation two days faster from acute care (8.0 days in 2015/16 vs. 10.0 days 2014/15), positively impacting patient flow and ALC days.
Stroke Rehabilitation Enhanced therapy on weekends was implemented at St. Joseph’s Care Group with an observed increase in daily functional improvement (FIM efficiency) from 0.8 in 2014/15 to 1.1 in 2015/16.
AREAS FOR IMPROVEMENT ASSOCIATED CURRENT OR PLANNED ACTIVITIES
AppropriatenessProportion of stroke/TIA patients who arrived at the ED by ambulance in the North West LHIN remained the lowest rate in the province (48.2%).
Numerous public awareness and education engagement events aimed at supporting FAST, activating EMS, and understanding the essential role of paramedics have occurred and will continue. Ongoing collaboration with EMS professionals (central ambulance communications centre, paramedics, first responders) is planned with the focus of best practice training and education around pre-hospital stroke care.
AccessProportion of ischemic stroke patients who received acute thrombolytic therapy (tPA) was slightly lower than 2014/15. Low numbers of activations are noted at Telestroke sites.
Code Stroke was implemented at TBRHSC in December 2015, to rapidly activate clinical team and facilitate timely and improved access to tPA. The number of tPA cases at TBRHSC in 2016/17 (Q1–3) surpassed 2015/16. As of March 2017, implementation of EMS protocols for direct transportation to EDs that provide acute stroke treatment will continue to enhance progress.
AppropriatenessAnnual age- and sex-adjusted inpatient admission rate for stroke/TIA (per 1,000 population) in the North West LHIN remained high (1.9) when compared to the Ontario rate of 1.3.
A regional triage toolkit for patients with TIA and mild non-disabling stroke has been implemented to facilitate timely access to stroke specialists and diagnostic imaging in order to avoid hospital admissions when possible. In addition, ongoing support of community stroke prevention services and integration with vascular health initiatives is planned.
EffectivenessNumber of minutes per day of direct therapy that inpatient stroke rehabilitation patients received was approximately 1/3 of the time recommended, and was similar throughout Ontario. This is a new indicator based on the recommendation for three hours/day of therapy.
A rehabilitation intensity working group has been struck and continues to actively seek efficiencies in provision of direct clinical care while minimizing non-patient care activity (through exploration of electronic scheduling systems and extension of the patient's therapeutic day). Improvements were seen in 2016/17, Q1–3 (71 minutes/day) which is above the provincial average.
OPPORTUNITIES FOR LHIN AND STROKE NETWORK COLLABORATION
• Continued collaboration with the North West LHIN is needed to support the network's strategic plan to:
– improve access for the people of the North West LHIN to acute stroke treatment, enhanced Telestroke and stroke unit care;
– build endovascular treatment (mechanical thrombectomy) capacity beyond a single interventionalist model at TBRHSC;
– investigate options to implement mobile stroke unit ambulance equipped with CT;
– provide access to a CT scanner east of Thunder Bay;
– access to rapid assessment clinics for TIA and mild, non-disabling stroke.
• Regional rehabilitation planning has been ongoing and will continue in collaboration along with the North West LHIN post-acute review.
CONTACTEsmé FrenchInterim Regional DirectorNorthwestern Ontario Regional Stroke [email protected] (807) 684-6498
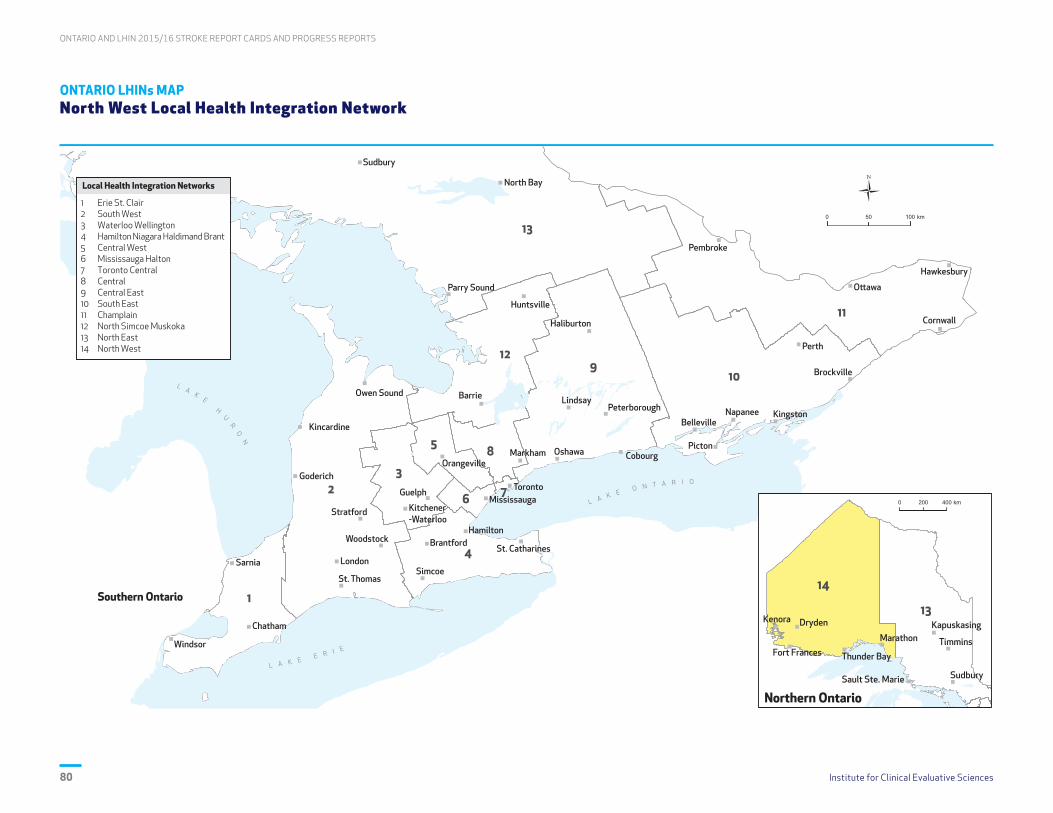
ONTARIO AND LHIN 2015/16 STROKE REPORT CARDS AND PROGRESS REPORTS
Institute for Clinical Evaluative Sciences80
ONTARIO LHINs MAP North West Local Health Integration Network

Institute for Clinical Evaluative Sciences 81
ONTARIO AND LHIN 2015/16 STROKE REPORT CARDS AND PROGRESS REPORTS
References
ONTARIO AND LHIN 2015/16 STROKE REPORT CARDS AND PROGRESS REPORTS
1. Health Quality Ontario. Mechanical thrombectomy for patients with acute ischemic stroke: OHTAC recommendation. Toronto, ON: HQO; February 2016. Accessed May 12, 2017 at http://www.hqontario.ca/portals/0/documents/evidence/reports/recommendation-mechanical-thrombectomy-1602-en.pdf.
2. Hoffmeister L, Lavados PM, Mar J, Comas M, Arrospide A, Castells X. Minimum intravenous thrombolysis utilization rates in acute ischemic stroke to achieve population effects on disability: A discrete-event simulation model. J Neurol Sci. 2016; 365:59–64.
3. Langhorne P, and on behalf of the Stroke Unit Trialists Collaboration. Organized inpatient (stroke unit) care for stroke. Stroke. 2014; 45:e14–e15.
4. Health Quality Ontario; Ministry of Health and Long-Term Care. Quality-Based Procedures: Clinical Handbook for Stroke (Acute and Postacute). Toronto, ON: HQO; December 2016. Accessed May 7, 2017 at http://health.gov.on.ca/en/pro/programs/ecfa/docs/qbp_stroke.pdf.
5. Tu JV, Gong Y. Trends in treatment and outcomes for acute stroke patients in Ontario, 1992–1998. Arch Intern Med. 2003; 163:293–7.
6. CSS Information and Evaluation Working Group. Canadian Stroke Strategy Performance Measurement Manual: A Supplement to the Canadian Stroke Strategy Best Practices Recommendations for Stroke Care (Update 2008). Accessed May 6, 2017 at http://www.strokebestpractices.ca/wp-content/uploads/2012/07/CSS-Performance-Manual-2008_EN.pdf.
7. Weissman NW, Allison JJ, Kiefe CI, Farmer RM, Weaver MT, Williams OD et al. Achievable benchmarks of care: the ABCs of benchmarking. J Eval Clin Pract. 1999; 5(3):269–81.

ONTARIO AND LHIN 2015/16 STROKE REPORT CARDS AND PROGRESS REPORTS
Institute for Clinical Evaluative Sciences82
8. Katzan IL, Spertus J, Bettger JP, Bravata DM, Reeves MJ, Smith EE et al. Risk adjustment of ischemic stroke outcomes for comparing hospital performance: a statement for healthcare professionals from the American Heart Association/American Stroke Association. Stroke. 2014; 45(3):918–44.
9. Hall R, Khan F, O’Callaghan C, Kapral MK, Levi J, Cullen A, Wu J, Fang J, Bayley M. Ontario Stroke Evaluation Report 2014: On Target for Stroke Prevention and Care. Toronto, ON: Institute for Clinical Evaluative Sciences; 2014.
10. Berkhemer OA, Fransen PS, Beumer D, van den Berg LA, Lingsma HF, Yoo AJ et al. A randomized trial of intraarterial treatment for acute ischemic stroke. N Engl J Med. 2015; 372(1):11–20.
11. Goyal M, Demchuk AM, Menon BK, Eesa M, Rempel JL, Thornton J et al. Randomized assessment of rapid endovascular treatment of ischemic stroke. N Engl J Med. 2015; 372(11):1019–30.
12. Heart and Stroke Foundation; Canadian Stroke Best Practices, Stroke Quality Advisory Committee. Quality of Stroke Care in Canada: Stroke Key Quality Indicators and Stroke Case Definitions. August 2016. Accessed June 6, 2017 at http://www.strokebestpractices.ca/wp-content/uploads/2016/09/2016-StrokeCase Defn-KQI-Update-FINAL-Sept2016.pdf.
13. Canadian Institute for Health Information. All Patients Readmitted to Hospital. Accessed May 13, 2017 at https://yourhealthsystem.cihi.ca/hsp/inbrief.#!/indicators/006/all-patients-readmitted-to-hospital/;mapC1;mapLevel2;/.
14. Kamal N, Benavente O, Boyle K, Buck B, Butcher K, Casaubon LK et al. Good is not good enough: the benchmark stroke door-to-needle time should be 30 minutes. Can J Neurol Sci. 2014; 41: 694–6.

Institute for Clinical Evaluative Sciences 83
ONTARIO AND LHIN 2015/16 STROKE REPORT CARDS AND PROGRESS REPORTS
Appendices
ONTARIO AND LHIN 2015/16 STROKE REPORT CARDS AND PROGRESS REPORTS
Institute for Clinical Evaluative Sciences83

ONTARIO AND LHIN 2015/16 STROKE REPORT CARDS AND PROGRESS REPORTS
Institute for Clinical Evaluative Sciences84
APPENDIX A Indicator Definitions, Calculations and Data Sources
IndicatorNo. Care Continuum Category Definition Calculation Data Source
1 Public Awareness and Patient Education
Proportion of stroke/TIA patients who arrived at the ED by ambulance
Numerator: Number of stroke/TIA patients transported by ambulanceDenominator: Total number of patients admitted to an ED for stroke/TIA *Population-based analysis (patient’s LHIN)
CIHI-NACRS
2 Prevention of Stroke Annual age- and sex-adjusted inpatient admission rate for stroke/TIA (per 1,000 population)
Adult stroke/TIA admissions to acute care inpatient setting per 1,000 population *Population-based analysis (patient’s LHIN), standardized using Ontario’s 2003/04 population
CIHI-DAD
3 Prevention of Stroke Risk-adjusted stroke/TIA mortality rate at 30 days (per 100 patients)
Risk-adjusted mortality rate per 100 patients within 30 days of stroke/TIA; index event between April 1, 2015 and March 31, 2016 (among inpatients only) Risk-adjusted model: Age + sex + ambulance arrival + atrial fibrillation + stroke/TIA + coronary artery disease or percutaneous coronary intervention or coronary artery bypass graft + carotid disease or carotid endarterectomy/stent+ diabetes + hypertension + peripheral vascular disease + hyperlipidemia + stroke type
CIHI-DAD, RPDB
4 Prevention of Stroke Proportion of ischemic stroke/TIA inpatients aged 65 and older with atrial fibrillation who filled a prescription for anticoagulant therapy within 90 days of discharge from acute care
Numerator: Number of ischemic stroke/TIA inpatients with atrial fibrillation who filled a prescription for anticoagulant therapy within 90 days of acute care dischargeDenominator: Total number of ischemic stroke/TIA patients (excluding query diagnoses and those that became palliative during acute care admission) aged 65 and older at the time of discharge with a diagnosis of atrial fibrillation discharged alive from inpatient acute care *Population-based analysis (patient's LHIN)
CIHI-DAD, ODB
5 Prevention of Stroke Proportion of ischemic stroke inpatients who received carotid imaging
Numerator: Number of ischemic stroke patients who underwent carotid imaging (carotid doppler, carotid CTA, carotid MRA or carotid angiography)Denominator: All admitted patients with ischemic stroke
CIHI-DAD, CIHI-NACRS, OHIP Billing
6 Acute Stroke Management Median door-to-needle time among patients who received acute thrombolytic therapy (tPA) (minutes)
Median number of minutes from ED arrival (registration time) to administration of tPA Denominator: All patients who receive IV, IA or IV/IA thrombolysis in an ED or are admitted as inpatients with date/time of registration and tPA given date/time (includes only tPA capacity sites; see Exhibit 1)
CIHI-DAD Special Project 340, CIHI-NACRS Special Project 340
7 Acute Stroke Management Proportion of ischemic stroke patients who received acute thrombolytic therapy (tPA)
Numerator: Number of ischemic stroke patients who receive IV, IA or IV/IA thrombolysis (includes only tPA capacity sites; see Exhibit 1)Denominator: Number of ischemic stroke patients presenting to the ED or admitted to inpatient care*Population-based analysis (patient’s LHIN)
CIHI-DAD Special Project 340, CIHI-NACRS Special Project 340
8 Acute Stroke Management Proportion of stroke/TIA patients treated on a stroke unit at any time during their inpatient stay (HSAA indicator)
Numerator: Number of stroke/TIA inpatients treated in an acute care stroke unit at any time during hospital stay Denominator: Total number of stroke/TIA patients admitted to hospital *Population-based analysis (patient’s LHIN)**A stroke unit (revised definition) is a geographical unit with identifiable co-located beds (e.g., 5A-7, 5A-8, 5A-9, 5A-10) that are occupied by stroke patients 75% of the time and have a dedicated interprofessional team with expertise in stroke care including, at a minimum, nursing, physiotherapy, occupational therapy and speech-language pathology.
CIHI-DAD Special Project 340
9 Prevention of Stroke Proportion of ischemic stroke/TIA patients discharged from the ED and referred to secondary prevention services
Numerator: Number of ischemic stroke/TIA patients referred to secondary prevention servicesDenominator: Total number of ischemic stroke/TIA patients (excluding query diagnoses and those that became palliative during acute care admission) discharged from the ED back to the community
CIHI-NACRS Special Project 340
10 Acute Stroke Management Proportion of ALC days to total length of stay in acute care Numerator: Sum of ALC days Denominator: Total number of LOS days among stroke/TIA patients admitted to inpatient care
CIHI-DAD
11 Acute Stroke Management Proportion of acute stroke (excluding TIA) patients discharged from acute care and admitted to inpatient rehabilitation
Numerator: Number of stroke inpatients admitted to inpatient rehabilitation Denominator: Total number of stroke inpatients discharged alive from acute care (excludes TIA patients and those that became palliative during acute care admission) *Population-based analysis (patient’s LHIN)
CIHI-DAD, CIHI-NRS
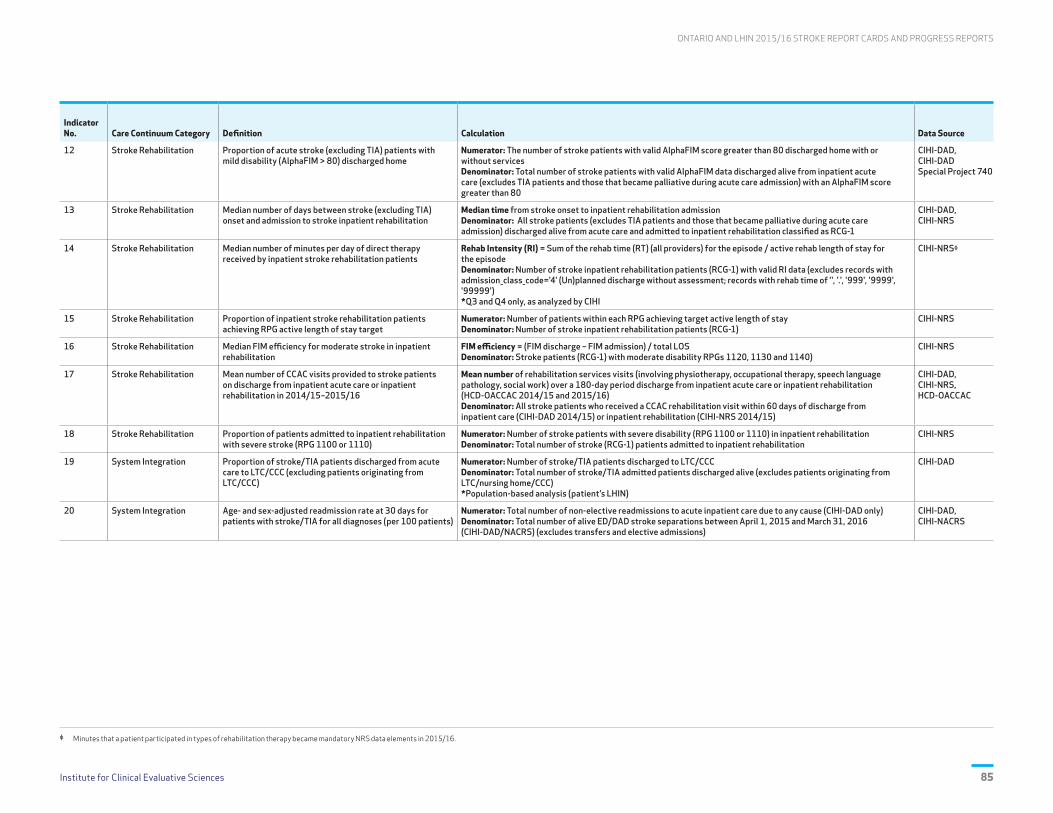
Institute for Clinical Evaluative Sciences 85
ONTARIO AND LHIN 2015/16 STROKE REPORT CARDS AND PROGRESS REPORTS
IndicatorNo. Care Continuum Category Definition Calculation Data Source
12 Stroke Rehabilitation Proportion of acute stroke (excluding TIA) patients with mild disability (AlphaFIM > 80) discharged home
Numerator: The number of stroke patients with valid AlphaFIM score greater than 80 discharged home with or without servicesDenominator: Total number of stroke patients with valid AlphaFIM data discharged alive from inpatient acute care (excludes TIA patients and those that became palliative during acute care admission) with an AlphaFIM score greater than 80
CIHI-DAD, CIHI-DAD Special Project 740
13 Stroke Rehabilitation Median number of days between stroke (excluding TIA) onset and admission to stroke inpatient rehabilitation
Median time from stroke onset to inpatient rehabilitation admissionDenominator: All stroke patients (excludes TIA patients and those that became palliative during acute care admission) discharged alive from acute care and admitted to inpatient rehabilitation classified as RCG-1
CIHI-DAD, CIHI-NRS
14 Stroke Rehabilitation Median number of minutes per day of direct therapy received by inpatient stroke rehabilitation patients
Rehab Intensity (RI) = Sum of the rehab time (RT) (all providers) for the episode / active rehab length of stay for the episodeDenominator: Number of stroke inpatient rehabilitation patients (RCG-1) with valid RI data (excludes records with admission_class_code='4' (Un)planned discharge without assessment; records with rehab time of '', '.', '999', '9999', '99999')*Q3 and Q4 only, as analyzed by CIHI
CIHI-NRSᶲ
15 Stroke Rehabilitation Proportion of inpatient stroke rehabilitation patients achieving RPG active length of stay target
Numerator: Number of patients within each RPG achieving target active length of stayDenominator: Number of stroke inpatient rehabilitation patients (RCG-1)
CIHI-NRS
16 Stroke Rehabilitation Median FIM efficiency for moderate stroke in inpatient rehabilitation
FIM efficiency = (FIM discharge – FIM admission) / total LOSDenominator: Stroke patients (RCG-1) with moderate disability RPGs 1120, 1130 and 1140)
CIHI-NRS
17 Stroke Rehabilitation Mean number of CCAC visits provided to stroke patients on discharge from inpatient acute care or inpatient rehabilitation in 2014/15–2015/16
Mean number of rehabilitation services visits (involving physiotherapy, occupational therapy, speech language pathology, social work) over a 180-day period discharge from inpatient acute care or inpatient rehabilitation (HCD-OACCAC 2014/15 and 2015/16) Denominator: All stroke patients who received a CCAC rehabilitation visit within 60 days of discharge from inpatient care (CIHI-DAD 2014/15) or inpatient rehabilitation (CIHI-NRS 2014/15)
CIHI-DAD, CIHI-NRS, HCD-OACCAC
18 Stroke Rehabilitation Proportion of patients admitted to inpatient rehabilitation with severe stroke (RPG 1100 or 1110)
Numerator: Number of stroke patients with severe disability (RPG 1100 or 1110) in inpatient rehabilitation Denominator: Total number of stroke (RCG-1) patients admitted to inpatient rehabilitation
CIHI-NRS
19 System Integration Proportion of stroke/TIA patients discharged from acute care to LTC/CCC (excluding patients originating from LTC/CCC)
Numerator: Number of stroke/TIA patients discharged to LTC/CCC Denominator: Total number of stroke/TIA admitted patients discharged alive (excludes patients originating from LTC/nursing home/CCC) *Population-based analysis (patient’s LHIN)
CIHI-DAD
20 System Integration Age- and sex-adjusted readmission rate at 30 days for patients with stroke/TIA for all diagnoses (per 100 patients)
Numerator: Total number of non-elective readmissions to acute inpatient care due to any cause (CIHI-DAD only) Denominator: Total number of alive ED/DAD stroke separations between April 1, 2015 and March 31, 2016 (CIHI-DAD/NACRS) (excludes transfers and elective admissions)
CIHI-DAD, CIHI-NACRS
ᶲ Minutes that a patient participated in types of rehabilitation therapy became mandatory NRS data elements in 2015/16.
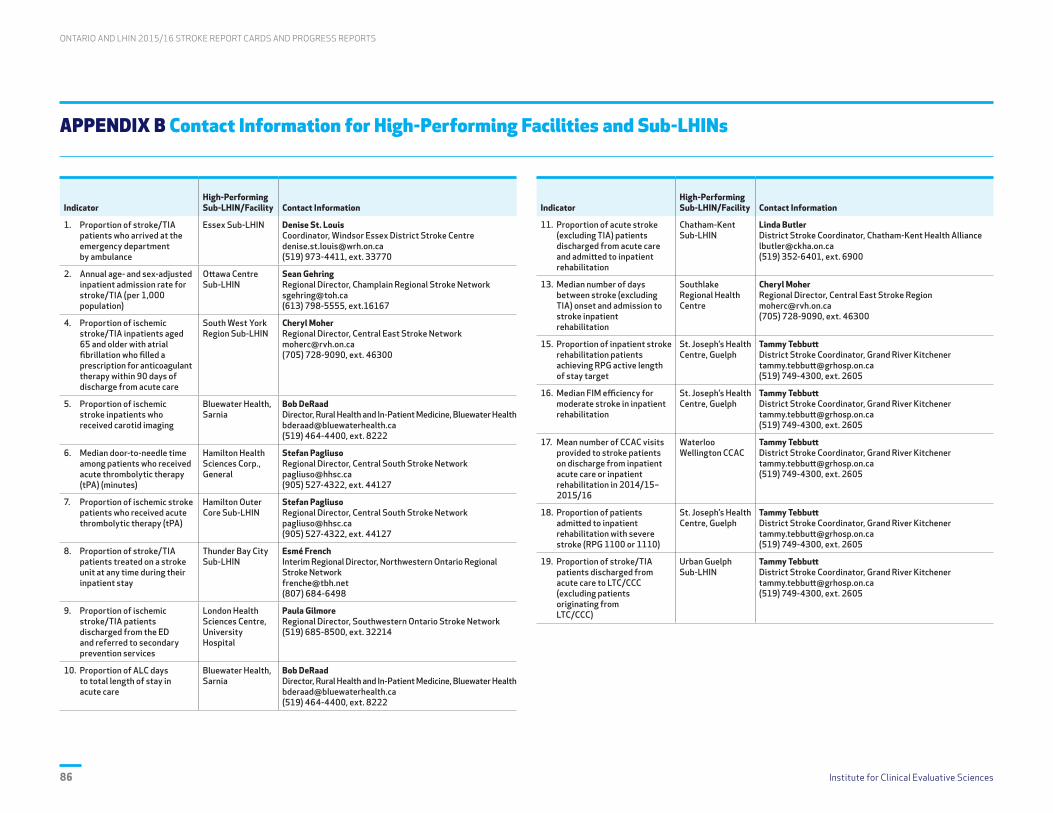
ONTARIO AND LHIN 2015/16 STROKE REPORT CARDS AND PROGRESS REPORTS
Institute for Clinical Evaluative Sciences86
APPENDIX B Contact Information for High-Performing Facilities and Sub-LHINs
IndicatorHigh-Performing Sub-LHIN/Facility Contact Information
1. Proportion of stroke/TIA patients who arrived at the emergency department by ambulance
Essex Sub-LHIN Denise St. LouisCoordinator, Windsor Essex District Stroke [email protected](519) 973-4411, ext. 33770
2. Annual age- and sex-adjusted inpatient admission rate for stroke/TIA (per 1,000 population)
Ottawa Centre Sub-LHIN
Sean GehringRegional Director, Champlain Regional Stroke [email protected](613) 798-5555, ext.16167
4. Proportion of ischemic stroke/TIA inpatients aged 65 and older with atrial fibrillation who filled a prescription for anticoagulant therapy within 90 days of discharge from acute care
South West York Region Sub-LHIN
Cheryl MoherRegional Director, Central East Stroke [email protected](705) 728-9090, ext. 46300
5. Proportion of ischemic stroke inpatients who received carotid imaging
Bluewater Health, Sarnia
Bob DeRaadDirector, Rural Health and In-Patient Medicine, Bluewater [email protected](519) 464-4400, ext. 8222
6. Median door-to-needle time among patients who received acute thrombolytic therapy (tPA) (minutes)
Hamilton Health Sciences Corp., General
Stefan PagliusoRegional Director, Central South Stroke [email protected](905) 527-4322, ext. 44127
7. Proportion of ischemic stroke patients who received acute thrombolytic therapy (tPA)
Hamilton Outer Core Sub-LHIN
Stefan PagliusoRegional Director, Central South Stroke [email protected](905) 527-4322, ext. 44127
8. Proportion of stroke/TIA patients treated on a stroke unit at any time during their inpatient stay
Thunder Bay City Sub-LHIN
Esmé FrenchInterim Regional Director, Northwestern Ontario Regional Stroke [email protected](807) 684-6498
9. Proportion of ischemic stroke/TIA patients discharged from the ED and referred to secondary prevention services
London Health Sciences Centre, University Hospital
Paula GilmoreRegional Director, Southwestern Ontario Stroke Network(519) 685-8500, ext. 32214
10. Proportion of ALC days to total length of stay in acute care
Bluewater Health, Sarnia
Bob DeRaadDirector, Rural Health and In-Patient Medicine, Bluewater [email protected](519) 464-4400, ext. 8222
IndicatorHigh-Performing Sub-LHIN/Facility Contact Information
11. Proportion of acute stroke (excluding TIA) patients discharged from acute care and admitted to inpatient rehabilitation
Chatham-Kent Sub-LHIN
Linda ButlerDistrict Stroke Coordinator, Chatham-Kent Health [email protected](519) 352-6401, ext. 6900
13. Median number of days between stroke (excluding TIA) onset and admission to stroke inpatient rehabilitation
Southlake Regional Health Centre
Cheryl MoherRegional Director, Central East Stroke [email protected](705) 728-9090, ext. 46300
15. Proportion of inpatient stroke rehabilitation patients achieving RPG active length of stay target
St. Joseph’s Health Centre, Guelph
Tammy TebbuttDistrict Stroke Coordinator, Grand River Kitchener [email protected](519) 749-4300, ext. 2605
16. Median FIM efficiency for moderate stroke in inpatient rehabilitation
St. Joseph’s Health Centre, Guelph
Tammy TebbuttDistrict Stroke Coordinator, Grand River Kitchener [email protected](519) 749-4300, ext. 2605
17. Mean number of CCAC visits provided to stroke patients on discharge from inpatient acute care or inpatient rehabilitation in 2014/15–2015/16
Waterloo Wellington CCAC
Tammy TebbuttDistrict Stroke Coordinator, Grand River Kitchener [email protected](519) 749-4300, ext. 2605
18. Proportion of patients admitted to inpatient rehabilitation with severe stroke (RPG 1100 or 1110)
St. Joseph’s Health Centre, Guelph
Tammy TebbuttDistrict Stroke Coordinator, Grand River Kitchener [email protected](519) 749-4300, ext. 2605
19. Proportion of stroke/TIA patients discharged from acute care to LTC/CCC (excluding patients originating from LTC/CCC)
Urban Guelph Sub-LHIN
Tammy TebbuttDistrict Stroke Coordinator, Grand River Kitchener [email protected](519) 749-4300, ext. 2605

Institute for Clinical Evaluative Sciences 87
ONTARIO AND LHIN 2015/16 STROKE REPORT CARDS AND PROGRESS REPORTS
APPENDIX C Glossary
Term/Acronym Definition
ABC methodology Achievable Benchmarks of Care methodology
ALC
Alternate level of care. An ALC patient is one who has finished the acute care phase of his/her treatment, but remains in an acute bed. This classification is invoked when the patient’s physician gives an order to change the level of care from acute care and requests a transfer for the patient.
AlphaFIMStandardized method of assessing patient disability/functional status in the acute care setting. AlphaFIM® is a registered trademark of Uniform Data System for Medical Rehabilitation, a division of UB Foundation Activities, Inc.
ARTIC Adopting Research to Improve Care program
CCAC Community Care Access Centre
CCC Complex continuing care
CIHI Canadian Institute for Health Information
CIHI-DADCIHI’s Discharge Abstract Database; captures administrative, clinical and demographic information on hospital discharges (including deaths, sign-outs and transfers). Some provinces and territories also use the DAD to capture day surgery.
CIHI-NACRS CIHI’s National Ambulatory Care Reporting System; contains data for all hospital- and community-based ambulatory care.
CIHI-NRS CIHI’s National Rehabilitation Reporting System; contains client data collected from participating adult inpatient rehabilitation facilities and programs across Canada.
CSS Canadian Stroke Strategy
CT Computed tomography
CTA Computed tomography angiography
Direct therapy See rehabilitation intensity.
Discharge Link Service An initiative that delivers enhanced rehabilitation therapy in community settings through CCAC-contracted providers.
District stroke centre
A facility that has written stroke protocols for emergency services, emergency department care and acute care including: transport and triage protocols; ability to offer thrombolytic therapy to suitable ischemic stroke patients; timely computed tomography (CT) scanning and expert interpretation; clinicians with stroke expertise; and linkages to rehabilitation and secondary prevention.
DTN Door-to-needle time; the time from patient arrival to patient receiving tissue plasminogen activator (tPA).
Dysphagia Difficulty in swallowing.
ED Emergency department
EMS Emergency medical services
eRehab Utilizes trained rehabilitation technicians at the bedside to carry out interventions under the direction of a therapist connected remotely in real time via technology.
Term/Acronym Definition
E-Stroke
A web-based rehabilitation referral and patient-tracking system that provides timely, equitable and efficient access to stroke rehabilitation and enables reporting of unique patient and system information to support local organization- and system-based quality improvement. E-Stroke is utilized by 19 acute and rehabilitation hospital sites in Toronto (crossing GTA LHIN regions). Membership is held under a formal memorandum of understanding since 2008. E-Stroke is considered a standard of practice in Toronto.
EVT
Endovascular thrombectomy or endovascular treatment. The Ontario Health Technology Advisory Committee (OHTAC) review of EVT in February 2015 considered mechanical thrombectomy to be a cost-effective intervention and recommended public funding of EVT for eligible patients with acute ischemic stroke in selected stroke centres identified by the Ontario Stroke Network (OSN).
FAST
A national public awareness campaign launched by Heart & Stroke to help Canadians recognize stroke symptoms by promoting the acronym FAST:
Face is it drooping?Arms can you raise both?Speech is it slurred or jumbled?Time to call 9-1-1 right away
FIM Functional Independence Measure. FIM® is a registered trademark of Uniform Data System for Medical Rehabilitation, a division of UB Foundation Activities, Inc.
FIM efficiency FIM efficiency = (FIM discharge – FIM admission) / total length of stay
GTA Greater Toronto Area
HCD-OACCAC Home Care Database, from the Ontario Association of Community Care Access Centres.
HSAA Hospital Service Accountability Agreement
ICES Institute for Clinical Evaluative Sciences
IFM Integrated funding model
Ischemic stroke Stroke caused by the interruption of blood flow to the brain due to a blood clot.
ISU Integrated stroke unit
LHINLocal Health Integration Network; one of 14 not-for-profit corporations established in Ontario by the MOHLTC, each with specific geographic boundaries. Each LHIN is responsible for planning, integrating and funding local health services.
LOS Length of stay
LTC Long-term care
MOHLTC Ontario Ministry of Health and Long-Term Care
MRA Magnetic resonance angiography
MRI Magnetic resonance imaging
ODB Ontario drug benefit claims database

ONTARIO AND LHIN 2015/16 STROKE REPORT CARDS AND PROGRESS REPORTS
Institute for Clinical Evaluative Sciences88
Term/Acronym Definition
OSN Ontario Stroke Network; provides provincial leadership and coordination for the 11 Ontario Regional Stroke Networks.
OT Occupational therapy
PT Physiotherapy
QBP
Quality-Based Procedure. A specific group of patient services that offers opportunities for health care providers to share best practices that will allow the system to achieve better quality and system efficiencies. Quality-Based Procedures: Clinical Handbook for Stroke (Acute) includes best practices for the emergency department, acute care and inpatient rehabilitation (Phase 1; April 2013). The updated Quality-Based Procedures: Clinical Handbook for Stroke (Acute and Postacute) also includes best practices for TIA and stroke prevention clinics, early supported discharge, outpatient and community rehabilitation and endovascular treatment (Phase 2; December 2016).
RCG Rehabilitation Client Group. In the CIHI-NRS, the RCG describes the primary reason for admission to rehabilitation.
Regional stroke centre A facility that has all the requirements of a district stroke centre, plus neurosurgical facilities and interventional radiology.
Rehabilitation intensity
Developed through literature review, expert consensus and stakeholder engagement by the Stroke Reference Group, and approved by the Ontario Stroke Network, rehabilitation intensity is the amount of time the patient spends in individual, goal-directed rehabilitation therapy, focused on physical, functional, cognitive, perceptual and social goals to maximize the patient’s recovery over a seven day/week period. It is the time that a patient is engaged in active face-to-face treatment, which is monitored or guided by a therapist.
RM&RResource matching and referral is an electronic information and referral management system that matches the patient’s health care needs to the services available and manages the referral process (e.g., referral, booking appointment).
Term/Acronym Definition
RPDB Registered Persons Database; provides basic demographic information about anyone who has ever received an Ontario health card number.
RPG Rehabilitation Patient Group. In the CIHI-NRS, the RPG describes stroke severity.
Separation Release of a patient from a course of care.
SEQC Stroke Evaluation and Quality Committee
SLP Speech language pathology
SPC Secondary stroke prevention clinic; an ambulatory care clinic that aims to reduce recurrent vascular events following an initial or suspected stroke.
Stroke Occurs when a vessel in the brain ruptures or is blocked by a blood clot.
Stroke unit
A geographical unit with identifiable co-located beds (e.g., 5A-7, 5A-8, 5A-9, 5A-10) that are occupied by stroke patients 75% of the time and have a dedicated interprofessional team with expertise in stroke care including, at a minimum, nursing, physiotherapy, occupational therapy and speech-language pathology.
Sub-LHIN Smaller subdivisions for each of the 14 Local Health Integration Networks.
SW Social work
Telestroke Ontario Telemedicine Network and Criticall provide stroke expertise via audio/video technology to facilities without stroke physician expertise available onsite.
TIA Transient ischemic attack or mini-stroke.
tPATissue plasminogen activator. A protein that can be used to break down blood clots in people who are having an ischemic stroke. The route of delivery of tPA can be intra-arterial (IA), intravenous (IV) or combined IA/IV.

Institute for Clinical Evaluative Sciences 89
ONTARIO AND LHIN 2015/16 STROKE REPORT CARDS AND PROGRESS REPORTS

Data Discovery Better Health
Institute for Clinical Evaluative Sciences G1 06, 2075 Bayview Avenue Toronto, Ontario M4N 3M5www.ices.on.ca