online technology ownership
TRANSCRIPT

1
Online Technology Ownership
The Multicultural Marketing Equation Study 2007: Report # 2
MARCH 2008
The 2007-2008 Florida State University/DMS Research Multicultural Marketing Research Program
This is the second in a series of reports summarizing the data of the 2007 Multicultural Marketing Equation Study conducted by the Center for
Hispanic Marketing Communication at Florida State University and DMS Research (an AOL LLC company). The Multicultural Marketing Equation
Study was first conducted in 2006.
By
Felipe Korzenny, Ph.D., Director
And
Betty Ann Korzenny, Ph.D., Associate Director
Both at the Center for Hispanic Marketing Communication, Florida State University
With the Collaboration of senior researchers at DMS Research, and Madhurima Sarkar, doctoral student at Florida State
University
This study was made possible by the contributions from the following students in the Spring 2007 Seminar on Multicultural
Marketing Communication at Florida State University:
Ledvi Beza, Punchalee Buraruk, Rosemeire Carbonell, Pei-Hui Chang, Szu-Wei Chen, Eddy Meola, Yarbrah Peeples, Adah-Duval Pittman-
Delancey, Eunjung Shin, Shanna Tumbleson, John Tyndall, and Mary Warmka
We want to thank John Zarrella, President of Research Results, and his excellent team of survey specialists for their contributions to this study.

2
Table of Contents Executive Summary ............................................................................................................................................................................................5
Introduction .......................................................................................................................................................................................................8
Methodology for the 2007 Study ........................................................................................................................................................................8
Online Technology Ownership in the 2007 Study ............................................................................................................................................8
Use of Figures and Tables in the study ............................................................................................................................................................9
Main Findings .....................................................................................................................................................................................................9
Online Sharing Technology..............................................................................................................................................................................9
Mobile technology ownership .......................................................................................................................................................................13
Access to the Internet ...................................................................................................................................................................................16
Type of computing equipment ......................................................................................................................................................................19
Digital Cameras .............................................................................................................................................................................................21
Television and Radio Technology ..................................................................................................................................................................25
Electronic Games and MP3 Players ...............................................................................................................................................................29
The Multicultural Marketing Equation ..............................................................................................................................................................31
Commonalities ..............................................................................................................................................................................................31
Differences ...................................................................................................................................................................................................31
Methodological Note ........................................................................................................................................................................................32
Online Interviewing Method – ......................................................................................................................................................................32
Additional details: .........................................................................................................................................................................................33
Appendix ..........................................................................................................................................................................................................34

3
Table of figures Figure 1 Blog ........................................................................................................................................................................................................10
Figure 2 Website ..................................................................................................................................................................................................11
Figure 3 Podcast ...................................................................................................................................................................................................12
Figure 4 Cellular phone without camera ...............................................................................................................................................................13
Figure 5 Cellular phone with camera.....................................................................................................................................................................14
Figure 6 Cellular Phone with MP3 Player..............................................................................................................................................................15
Figure 7 Dialup Internet access .............................................................................................................................................................................16
Figure 8 High speed Internet access ......................................................................................................................................................................17
Figure 9 Wi-Fi or wireless Internet access .............................................................................................................................................................18
Figure 10 Desktop Computer ................................................................................................................................................................................19
Figure 11 Laptop Computer ..................................................................................................................................................................................20
Figure 12 Digital photo camera .............................................................................................................................................................................21
Figure 13 Digital video camera..............................................................................................................................................................................22
Figure 14 DVD Player ............................................................................................................................................................................................23
Figure 15 DVD Burner ...........................................................................................................................................................................................24
Figure 16 Satellite Radio .......................................................................................................................................................................................26
Figure 17 Satellite TV ............................................................................................................................................................................................27
Figure 18 TIVO or some other Digital Video Recorder ...........................................................................................................................................28
Figure 19 Electronic Games ..................................................................................................................................................................................29
Figure 20 MP3 Player............................................................................................................................................................................................30

4
Table of Tables Table 1. Blog ........................................................................................................................................................................................................34
Table 2 Website....................................................................................................................................................................................................35
Table 3 Podcast ....................................................................................................................................................................................................35
Table 4 Cellular phone without camera ................................................................................................................................................................36
Table 5 Cellular phone with camera ......................................................................................................................................................................36
Table 6 Cellular phone with MP3 player................................................................................................................................................................37
Table 7 Dialup Internet access ..............................................................................................................................................................................37
Table 8 High speed Internet access .......................................................................................................................................................................38
Table 9 Wi-Fi or wireless Internet access ..............................................................................................................................................................38
Table 10 Desktop Computer .................................................................................................................................................................................39
Table 11 Laptop Computer ...................................................................................................................................................................................39
Table 12 Digital Photo Camera..............................................................................................................................................................................40
Table 13 Digital Video Camera ..............................................................................................................................................................................40
Table 14 DVD Player .............................................................................................................................................................................................41
Table 15 Having a DVD Burner ..............................................................................................................................................................................41
Table 16 Satellite Radio ........................................................................................................................................................................................42
Table 17 Satellite TV .............................................................................................................................................................................................42
Table 18 TIVO or some other Digital Video Recorder ............................................................................................................................................43
Table 19 Electronic Games....................................................................................................................................................................................43
Table 20 MP3 Player .............................................................................................................................................................................................44
Table 21 Having a Blog, by Culture Group and Age................................................................................................................................................45
Table 22 Cellular phone with MP3 player by Cultural Group and Age ....................................................................................................................47
Table 23 Household Income by Cultural Group .....................................................................................................................................................51

5
Executive Summary
Background
In the Spring of 2007, The Center for Hispanic Marketing Communication at Florida State University and DMS Research conducted a second
online Multicultural Marketing Equation Study with approximately 2500 respondents, divided almost equally among five cultural groups: Non-
Hispanic Whites (NHW), African Americans (AA), Asians (A), Hispanics who completed the questionnaire in English (HE), and Hispanics who
completed the questionnaire in Spanish (HS). This 2007 version of the study refined the 2006 research by allowing Hispanics who preferred to
respond in Spanish to contribute their opinions. The purpose of the study was to shed further light on whether a multicultural marketing
approach common to all groups or a culture specific approach directed to each of these groups is most effective. The first report of the 2007
study, Old and New Media Use, provided insights into cultural similarities and differences concentrated on the media. This report, the second of
the 2007 Multicultural Marketing Equation Study series, concentrates on online technology ownership.
In addition, all respondents were surveyed for current ownership of new technologies as well as intent to purchase within the next year. This
provided insight not only into immediate patterns among these diverse groups, but near term future aspirations. Demographic information on
income and age permitted further analysis of findings as relevant.
The technology ownership investigated in this study included: blog, website, pod cast, cellular phone with and without camera, cellular phone
with MP3, Digital Photo Camera, Digital Video Camera, DVD, DVD burner, High Speed Internet Access, Dial-up Internet Access, Desktop
Computer, Laptop Computer, MP3/iPod, Satellite Radio, Satellite TV, TIVO/DVR, and Wi-Fi/Wireless Internet.
Overall Trends
The emerging minority groups in this study are expanding their technology ownership to a relatively wide range of new categories. This is in
contrast to NHW who tend to stick to the main trends and show little aspiration for expanding into innovations on the market. Technology
acquisition appears like an acculturation progression from A, who have the highest levels of ownership in a wide variety of new technologies, to
HE who follow closely in levels of technology ownership, to the HS who have the lowest ownership but are the most aspirational in the near
term. Looking at the fit of these findings to acculturation levels—It is A on the high end of the acculturation continuum, who have been a part of
the US mainstream culture for a longer period of time, are by far more affluent than other minorities, and operate largely in English in the wider
society. It is HS closing in on the high end of the acculturation continuum, who have either been in the US a longer period of time or were born
here, who prefer English and are proficient in the language, and enjoy a higher level of income than other Hispanics. Finally, it is HS on the less

6
acculturated end of the continuum, who prefer Spanish, and who have a lower level of income. So, perhaps the story of growth in technology
ownership is also the story of the dynamic integration of minorities into this country. Ironically, it is the NHW who have been considered the
mainstream market of this country, who are the least turned-on by new technology.
AA, also a growing minority group, has generally lower technology ownership levels than A and HE, although there are a few noteworthy
exceptions. AA are part of this country’s history, so the term acculturation does not apply. Yet as minorities they have a lower level of income
than other groups and remain aspirational in several aspects of technology ownership.
Cultural preferences known to each of the emerging minority groups appear to predominate in technology ownership patterns. A are strongly
into a wide variety of new technology ownership, both HE and HS have preferences for technologies which connect them to others, and AA are
strong and aspirational in entertainment related technology.
Conclusions
Overall, the balance of the multicultural marketing equation is tilted toward more differences than commonalities in technology ownership.
These findings clearly and graphically illustrate that the energy in terms of technology ownership and expansion is with emerging minorities.
Again, as in the Old and New Media Use report of these 2007 findings and in our 2006 Multicultural Marketing Equation study, NHW are
laggards in innovation among the online population.
For marketers of new technologies, the lesson from the Multicultural Marketing Equation study, Part #2, Online Technology Ownership Report,
is emerging minorities are the exciting targets for the moment and the near term future! From the online sharing technology of blogs, websites
and podcasts to the latest digital photography equipment, to MP3’s, and satellite and wireless technologies, A, HE, HS, are either ready or will be
soon to be owners of these technologies. AA are slowly catching up as well and have aspirations in several areas.
The burgeoning market is not in the old mainstream NHW target. While NHW may be up to speed in having high-speed wireless connections
and cell phones with cameras they show little evidence of branching soon into the more innovative parameters of the technology world. The
dynamic of technological growth is in the acculturating markets which already have made many of the new technologies their own, or are
intending to do it within the year.
Recommendations
Marketers and producers of new technologies need to target their products to each of these five segments of this study—A, HE, HS, AA, and
NHW individually, making use of this research and their own internal studies. It is important to understand which markets are not viable long
7
term targets for their technology products, and which are currently there or will be soon. Marketers will also need to clarify for new product
development which markets are ready for innovations, and what type of innovation will meet the cultural interests of these groups.
It may be worthwhile to think of creating a grid with new technologies on one axis and cultural groups on the other. This research study and
other research marketers may conduct for their own products could be used to create a target score for each cultural group by technology. The
score could be higher for cultural groups who have already demonstrated a purchase affinity for a particular form of technology and there is
cultural relevance for that type of technology. For instance, it may make sense to give a relatively high score for a cell phone with MP3 player
for A, HE, HS, and AA because of their ownership and purchase intent patterns, plus the cultural relevance of the technology for these groups.
However, it would merit a low target score for NHW because of current low ownership and future interest. (See Figure 6)
The information in this report on new technology ownership among five cultural groups can act as a powerful targeting tool in marketing. It can
support near and long term planning, which will tap into the drive for the latest in technology evident in emerging markets. It can also prevent
concentration in markets which have become stagnant, and the waste of resources involved in pursuing them. Marketers will need to refer to
other parts of the Multicultural Marketing Study (Old and New Media Use) for guidance on selecting media which are most effective for reaching
their intended markets. Finally, to win the hearts and minds of each of these cultural groups, research into the informational needs and the
emotional benefits derived from technology ownership is needed for crafting effective targeted advertising.

8
Introduction
Understanding the Multicultural Marketing Equation in our rapidly changing United States population is a critical concern for marketers and the
organizations they serve. How do they balance communication to diverse consumers in the U.S.? Should they use an overall homogeneous
multicultural approach common to all, or diverse messages for the various cultural groups that make up our complex society? Little is known
about the contrasting consumer behaviors of Hispanics, Asians, African Americans, and Non-Hispanic Whites to guide decision making. This
series of reports will summarize data from the 2007 Multicultural Marketing Equation Study by Florida State University and DMS Research,
according to topics. It will make comparisons as appropriate with the 2006 data published in a comprehensive summary report last year.
Methodology for the 2007 Study The 2007 Multicultural Marketing Equation Study was conducted online with 2500 respondents, including the following groups: Non-Hispanic
Whites (NHW), Hispanics who completed questionnaires in English (HE), Hispanics who completed questionnaires in Spanish (HS), African
Americans (AA), and Asians (A). There were approximately 500 respondents in each of these groups, with the total Hispanic sample reaching
approximately 1000, and the AA sample somewhat larger at over 560. In contrast to the 2006 study, Hispanics were provided the opportunity to
respond to the questionnaire in English or in Spanish. The HE sample included 428 completed questionnaires. These robust numbers provided
the opportunity for between group comparisons with differences reported at a level of Probability of ≤ .05. More specific information on
methodology is provided in the Methodological Note at the end of this report.
Online technology ownership by the different segments of the Multicultural Marketing Equation is the focus of this second report of the 2007
series.
Online Technology Ownership in the 2007 Study
In this 2007 study we asked respondents to tell us whether or not they have, plan to have within the next year, or do not plan to have within the
next year for the first time:
A blog
A website
A podcast
Cellular phone without camera
Cellular phone with camera

9
Cellular phone with MP3 player
Digital photo camera
Digital video camera
DVD burner
DVD player
High speed internet access
Dialup internet access
Desktop computer
Laptop computer
MP3 player or an iPod
Satellite radio
Satellite TV
TIVO or some other Digital Video Recorder for your TV
Wi-Fi or wireless Internet access
Electronic games
Use of Figures and Tables in the study
The findings of the study are described in the body of the report and illustrated by Figures, which are graphs of the percentages of having and
intent to have within the next year for each of the five cultural groups studied. Tables are included in the Appendix for each of the technology
areas, which provide the number of respondents and the percentages of having and intent to have within the next year for each of the five
cultural groups. In addition, there are tables in the Appendix on household income levels of the respondents in each of the five cultural groups.
There are also tables by age and income for having a blog and an MP3 player.
Main Findings
Online Sharing Technology
In this section we will cluster for discussion the findings regarding the possession of blogs, websites, and podcasts.
Perhaps the most interesting indicator of innovativeness online is having a blog to disseminate one’s thoughts and perspectives. Figure 1,
below, shows who has this technology, who does not but plans to have it within a year, and who does not have it and does not plan to have it
within the next year for the first time. Hispanics who responded in English (HE) are the most likely, of all groups to have a blog, closely followed
by Asians (A), and then by African Americans (AA). Demonstrating their interest in this communication outlet, Hispanics who responded in

10
Spanish (HS) are the most likely to indicate they will have a blog within a year, and they are similarly very closely followed by A, and then by AA.
Non Hispanic Whites (NHW) indicated they are least likely to have a blog and to have the intention to have one within the next year.
Figure 1 Blog
To most observers these tendencies should logically be explained by age because members of emerging minorities tend to be younger than
NHW. Table 21 in the Appendix shows, however, that age is not an explanation for these tendencies. As the reader can see in the table, NHW
continue to be less likely to have a Blog regardless of age.

11
As can be seen in Figure 2, having a website is also most popular among Hispanics but in this case it is among HS. This is perhaps because more
recent immigrants are more likely to want to share more of their life in pictures with others in their country of origin or in other remote
locations. This HS group along with AA are also most likely to plan to have a website within the next year. HE, AA, and A own websites at about
the same rate of just below 30%. The trend set by NHW is further reinforced here by their being the least likely to have a website. The
implications are outstanding for observers of the growth of the online world. Emerging minorities lead the way into the virtual realm.
Figure 2 Website

12
As can be seen in Figure 3, having a podcast follows a similar trend as that observed for the two prior technologies, except that having podcasts
is much less common overall. Still there seems to be a certain degree of enthusiasm for having this communication tool within the next year,
particularly on the part of HS and the rest of emerging minority groups. The exception as before is NHW, as they tend to be much more
reluctant to use these technologies. It is perhaps that cultures that place a high value on connectedness tend to adopt these technologies to a
larger extent to share their thoughts, images, sounds, and rhythms. These are in many ways revolutionary technologies that seem to be allowing
those who had been marginal before to express themselves now.
Figure 3 Podcast
13
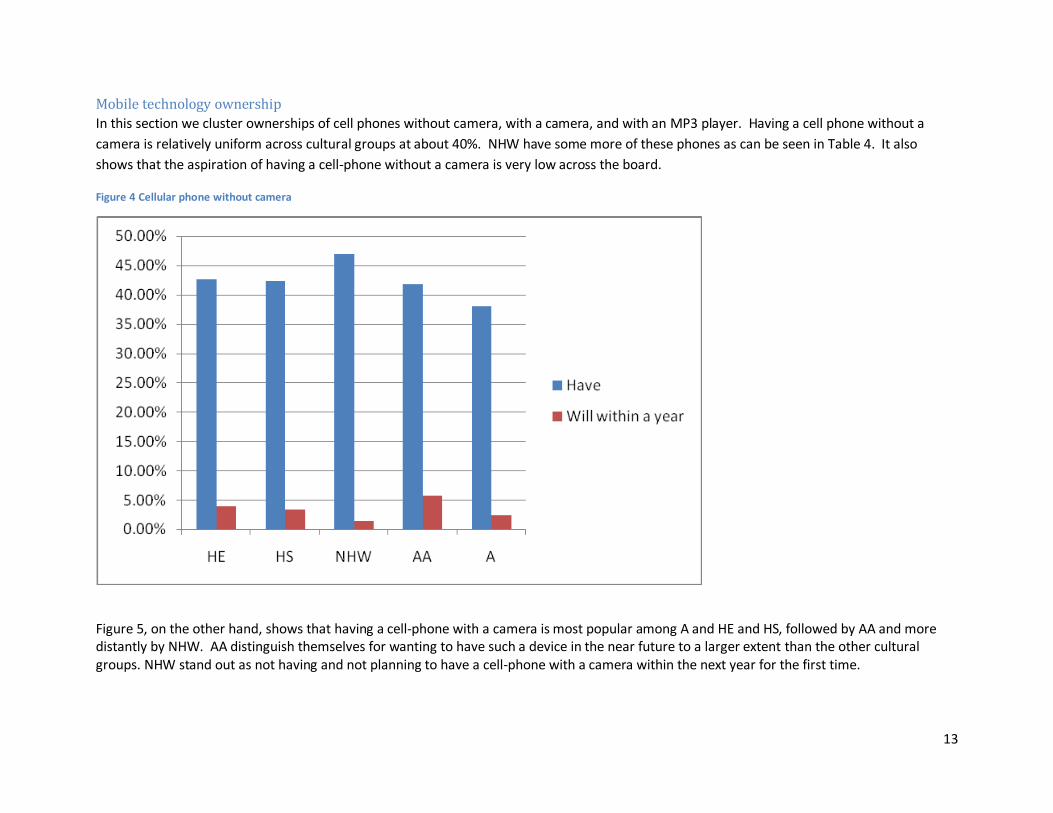
Mobile technology ownership
In this section we cluster ownerships of cell phones without camera, with a camera, and with an MP3 player. Having a cell phone without a
camera is relatively uniform across cultural groups at about 40%. NHW have some more of these phones as can be seen in Table 4. It also
shows that the aspiration of having a cell-phone without a camera is very low across the board.
Figure 4 Cellular phone without camera
Figure 5, on the other hand, shows that having a cell-phone with a camera is most popular among A and HE and HS, followed by AA and more distantly by NHW. AA distinguish themselves for wanting to have such a device in the near future to a larger extent than the other cultural groups. NHW stand out as not having and not planning to have a cell-phone with a camera within the next year for the first time.

14
Figure 5 Cellular phone with camera
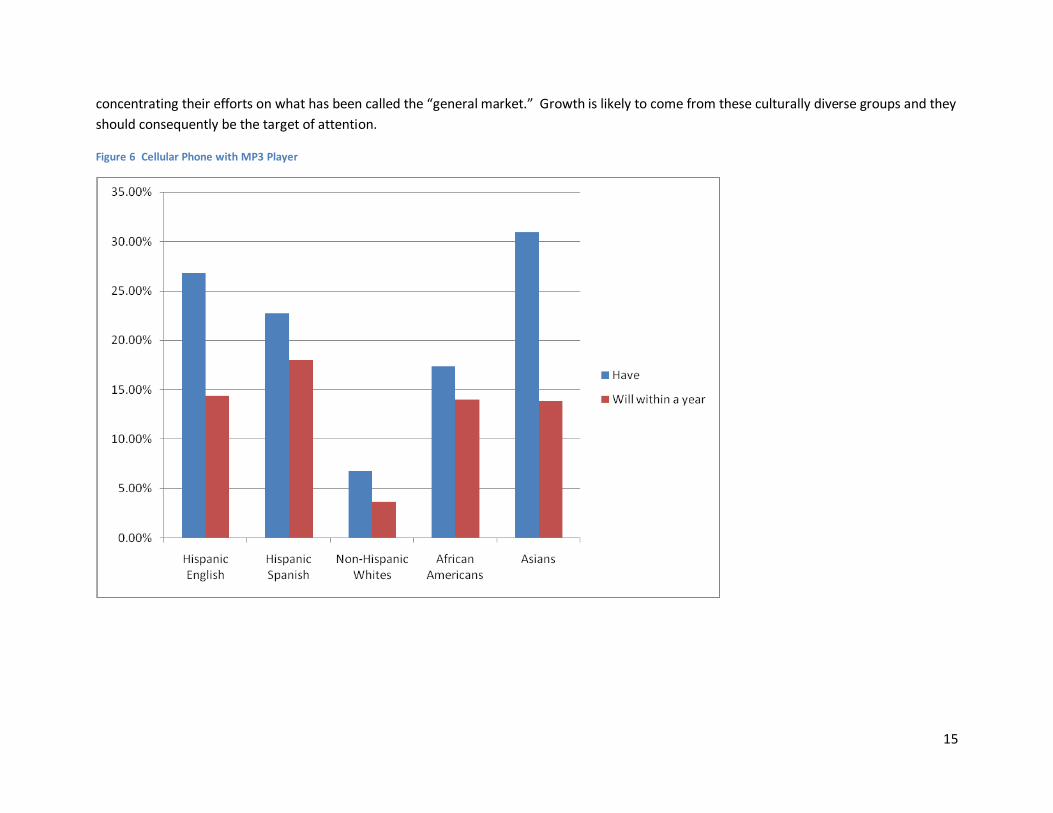
Figure 6 shows that A, HE, and HS are most likely to have an MP3 player in their cell-phone, distantly followed by AA and even more distantly by
NHW. The aspiration of having one of these devices in the next year is relatively high among all groups with the clear exception of NHW, as the
trend has been established in these findings.
Again, an alternative explanation for these findings could be age. The second table in the Appendix, however, indicates that NHW continue to
be less likely to have a cellular phone with an MP3 player across age groups. It is interesting that age is not an explanation for these differences.
This suggests that NHW are less interested in these innovative technologies. It also suggests that marketers may be misplacing their efforts by
15
concentrating their efforts on what has been called the “general market.” Growth is likely to come from these culturally diverse groups and they
should consequently be the target of attention.
Figure 6 Cellular Phone with MP3 Player

16
Access to the Internet
Figures 7, 8, and 9 below detail how these online consumers access the Internet. It is clear that HS is the group with less high speed Internet
access and still is the most reliant on dialup access for their online activities. NHW are least likely to depend on dialup. It is interesting that A
seem to be more likely to have high speed and dialup access simultaneously to a larger extent than other groups. This may suggest that they
connect from different places with different types of access. A are most likely to have a wireless connection to the Internet than anyone else,
followed by HE. HS are least likely to have wireless Internet access. Most of the symptoms seen in these tables suggest that affluence is a key
determinant of the type of access to the Internet. Still, despite income differences, A and HE continue to be more eager to adopt these
technologies than others. HS, interestingly are most likely than anyone else to want to adopt high speed and wireless access within the next
year, thus demonstrating the high priority they place on having a technological edge.
Figure 7 Dialup Internet access

17
Figure 8 High speed Internet access

18
Figure 9 Wi-Fi or wireless Internet access

19
Type of computing equipment
While stationary computing is quite evenly distributed among these groups, mobile computing on a laptop is much more popular among A and
then HE, with little difference among the other three groups. The aspiration, however, for having a laptop in the next year is highest for HS and
AA. It seems that the higher cost of laptops may be preventing some of these consumers from mobile computing. Figures 10 and 11 show these
trends.
Figure 10 Desktop Computer

20
Figure 11 Laptop Computer

21
Digital Cameras
Figures 12 and 13 show the trends for digital camera ownership. A and HE are most likely to have a digital photo camera, followed by HS, NHW, and finally by AA. Interestingly AA and HS are most likely to state that they will acquire this type of equipment in the next year. AA and NHW are also most likely to state they do not plan to purchase a digital photo camera in the next year for the first time. Having a digital video camera is most prevalent among HS, A, and HE as contrasted to the other groups. Because of their emphasis on family this is not surprising on the part of Hispanics and Asians. This technology would allow for capturing important family occasions, as well as sharing with other extended family members. NHW and AA are most likely to state they will not acquire a digital video camera in the next year. Figure 12 Digital photo camera

22
Figure 13 Digital video camera
23
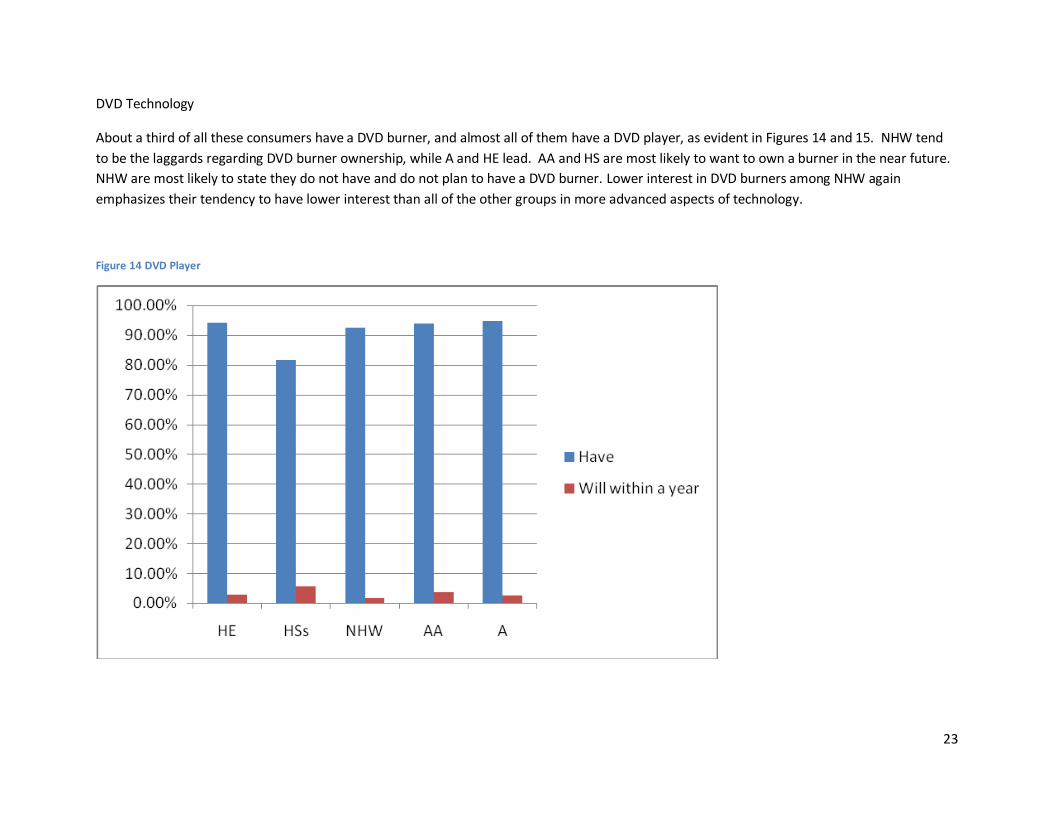
DVD Technology
About a third of all these consumers have a DVD burner, and almost all of them have a DVD player, as evident in Figures 14 and 15. NHW tend
to be the laggards regarding DVD burner ownership, while A and HE lead. AA and HS are most likely to want to own a burner in the near future.
NHW are most likely to state they do not have and do not plan to have a DVD burner. Lower interest in DVD burners among NHW again
emphasizes their tendency to have lower interest than all of the other groups in more advanced aspects of technology.
Figure 14 DVD Player

24
Figure 15 DVD Burner
25
Television and Radio Technology
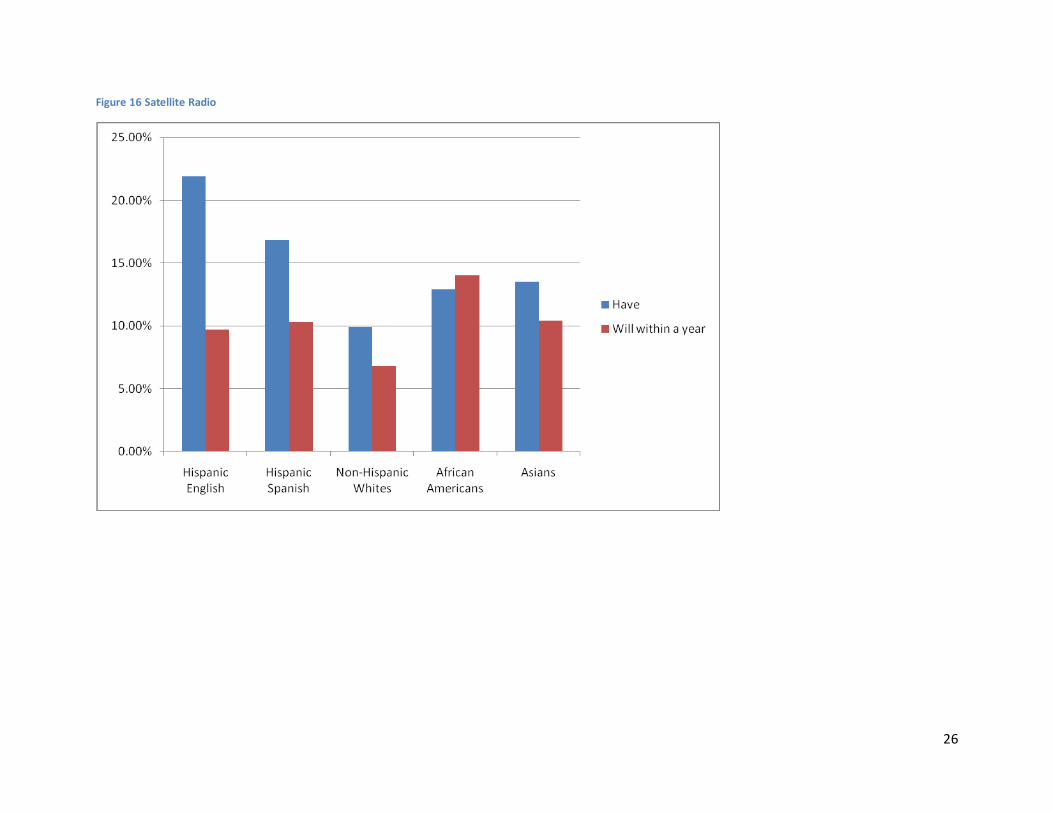
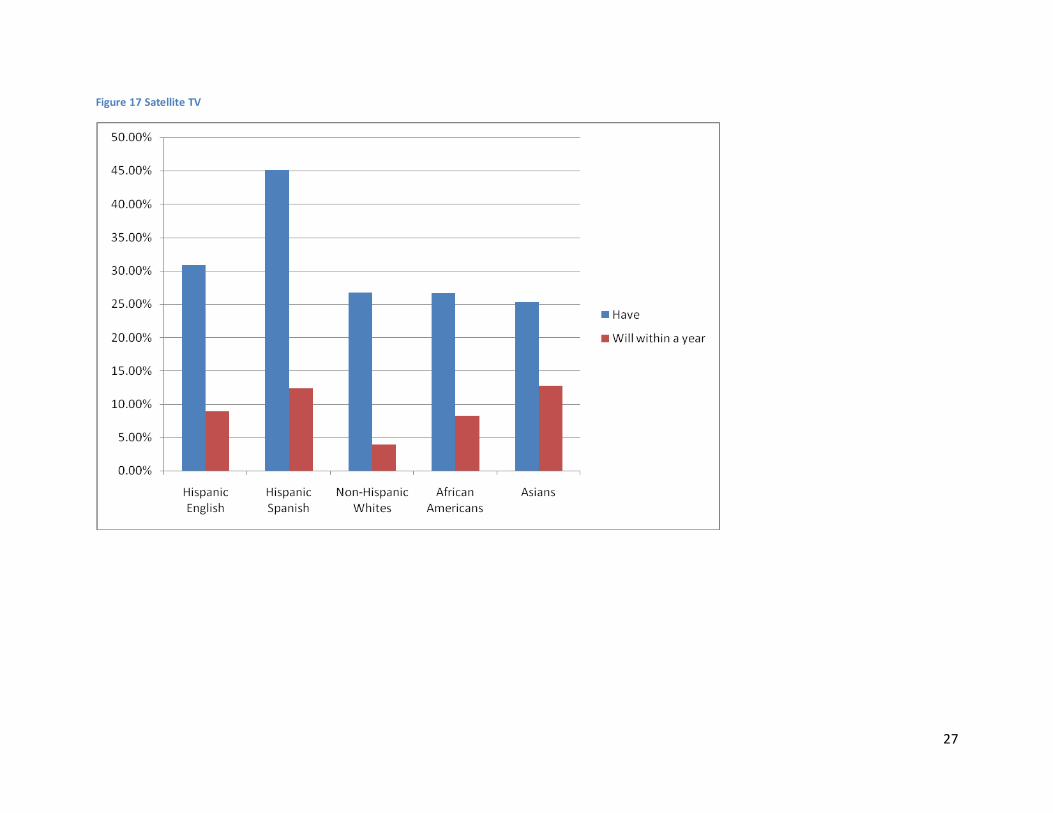
Figures 16, 17, and 18 illustrate trends in television and radio technology. Satellite radio, as expected, has gained the favor of Hispanics in first
place, while A and AA follow, and NHW show their technological reluctance once more by being least likely to have this technology, or to show a
future interest in it. The highest incidence of satellite TV is among HS distantly followed by HE, and then the other groups. This may be
explained by some of the rural geographic locations where HS are likely to live, and also by the fact that in their countries of origin satellite TV is
quite common. Digital video recorders are more prevalent among A and HE, and least among HS. As in other cases, the suspected reason is
lower income levels.
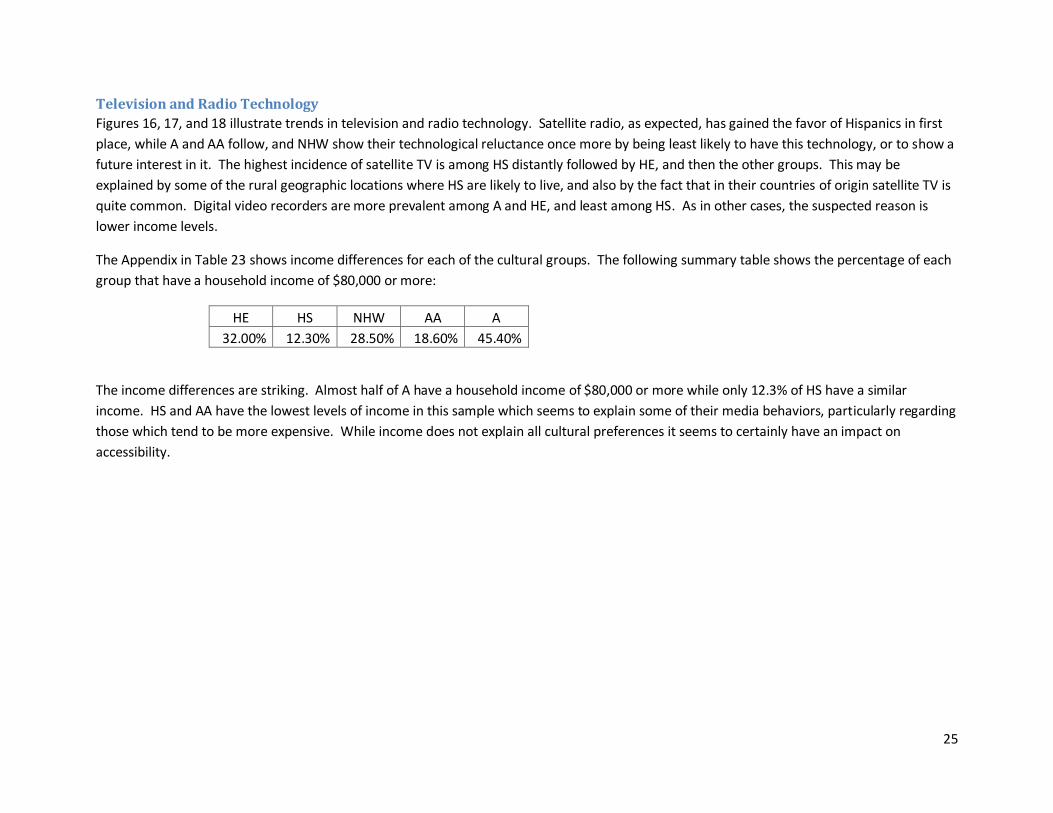
The Appendix in Table 23 shows income differences for each of the cultural groups. The following summary table shows the percentage of each
group that have a household income of $80,000 or more:
HE HS NHW AA A
32.00% 12.30% 28.50% 18.60% 45.40%
The income differences are striking. Almost half of A have a household income of $80,000 or more while only 12.3% of HS have a similar
income. HS and AA have the lowest levels of income in this sample which seems to explain some of their media behaviors, particularly regarding
those which tend to be more expensive. While income does not explain all cultural preferences it seems to certainly have an impact on
accessibility.
26
Figure 16 Satellite Radio
27
Figure 17 Satellite TV

28
Figure 18 TIVO or some other Digital Video Recorder

29
Electronic Games and MP3 Players
About half of these consumers have electronic games and about 40% have MP3 players, and they tend to be heavily concentrated in the hands
of A and HE, as can be seen in Figures 19 and 20. NHW, again, are least likely to own these forms of entertainment, or to think about having
them in the near future. MP3 players differ from electronic games in that a large number of consumers in each group do want to own one in the
near future. It may be that electronic games have reached a saturation point while MP3 players are still gaining momentum.
Figure 19 Electronic Games

30
Figure 20 MP3 Player
31
Epilogue
This report on the 2007 Multicultural Marketing Equation Study speaks to the ownership phase of commitment to new technologies. Patterns of
ownership among the five cultural groups studied show fascinating differences ranging from a clear hunger for technology among emerging
minorities to a low level interest in the latest technology innovations among NHW. Interestingly, A closely followed by HE are the most avid
owners of technology, particularly the latest innovations such as having a blog, a cell phone with MP3 player, an MP3 player, and Wi-Fi wireless
Internet access. Although HS did not have as high a level of ownership as A and HE in most categories, they demonstrated high aspirations for
new technology ownership within the next year; thus, indicating that they intend to catch up to the ownership levels of A and HE.
Similar to 2006 findings, ownership patterns of NHW are strong only in more common technology areas such as having high speed Internet
access, a digital camera and DVD player. However, even in these latter two areas they had lower levels of ownership than most other groups.
AA tended to rank lower than A and HE in ownership of most areas of new technologies with the exception of DVD players and Burners.
However, similar to HS, they showed strong aspirations in several areas. Since both HS and AA have lower levels of income than the other
groups, some of their lower ownership patterns may be affected by a lack of resources.
HS and HE demonstrated strong ownership in several culturally relevant areas. Given that staying in touch with family is of such high value in
the Hispanic culture, ownership of technology which facilitates closeness makes cultural sense. For example, blogs and websites were highest
among Hispanics, as well as cell phones with digital cameras, and digital cameras alone. Satellite radio and TV ownership was also strong among
Hispanics likely due to the heritage from ownership of technology for satellite transmissions in Mexico.
The Multicultural Marketing Equation
Commonalities
Commonalities among all five cultural groups were strongest in the most popular of the new technologies such as high speed Internet
connections, digital cameras, and cell phones with digital cameras. However, commonalities were strongest among the four emerging minority
groups, particular A and HE, who were the clear leaders in adapting to ownership of new technologies.
Differences
Differences in the Multicultural Marketing Equation again abound in the technology ownership patterns of this 2007 study. It appears that there
are patterns which suggest that levels of acculturation among emerging minorities particularly Asians and Hispanics are connected with the rate

32
at which they acquire new technology. A, who are by far the most affluent and acculturated of these groups, are known for their passion for
technology and have clearly demonstrated that in this study. However, HE, the more acculturated Hispanics in this study, are very close and
almost parallel with A in levels of ownership patterns. AA are less affluent than A and HE and fall somewhat below the A and HE level of
ownership in most areas. However, there are clearly strong areas of AA interest such as DVD ownership. HS stand out in their ownership
patterns of technology which keep them in touch with families and friends such as websites and digital video cameras; and they are the most
aspirational of all cultural groups in wanting to reach levels of new technology ownership similar to A and HE within the next year.
Marketers should take notice of the tremendous swell of ownership in the ranks of emerging minorities. It is clear that as levels of acculturation
and income increase among emerging minority groups, they stand out as current and potential leading edge technology purchasers. However,
there are cultural differences among each of these minority groups that merit close attention. Marketers need to understand these differences
as they relate to new technologies, select groups which have the highest interest in the various innovations, and create campaigns which are
culturally appropriate.
Methodological Note
Online Interviewing Method –
In 2007, sample sources were expanded to accommodate new sample requirements which included a segment of respondents that
would answer the questionnaire in Spanish in addition to Hispanics that would answer the questionnaire in English.
Therefore, for the sample of those answering in English, respondents were originally sampled via the Opinion Place online "river"
methodology. This method has also been referred to as "RDD for the web" as it uses broadcast promotional intercepts to generate a
flow of respondents to the Opinion Place site. Respondents are screened and assigned to surveys in real-time, and are not
considered registered panelists since most do not return to the site for ongoing survey participation.
For the sample of those answering in Spanish, respondents were invited from Tu Opinión Latina, a bilingual online Hispanic panel.
For the overall study, given the quota requirements, a random sample of respondents was selected based on their demographic
characteristics and invited to participate in this special survey opportunity via a custom email invitation using the Opinion Place online
“river” methodology. Respondents completed the survey by clicking on a link in the email invitation, which connected them with the
online questionnaire.

33
Additional details:
Fieldwork was executed from March 7 - 27, 2007.
Respondents were required to be 18 years of age or older.
The actual number of completes per quota group is as follows: o n=513 Non-Hispanic Whites o n=493 Hispanic (English version) o n=428 Hispanic (Spanish version) o n=564 African Americans o n=502 Asians
Each respondent received a small incentive for completing the survey.
English Speaking Segment
Spanish Speaking Segment
Average survey length 22 minutes 31 minutes Response rate 28% 20%
Completion rate 79% 82%
Online programming and the assembly of the final data file were provided courtesy of Research Results, Inc. Our gratitude goes to
John Zarrella, President of Research Results, and his excellent team of survey specialists.

34
Appendix Table 1. Blog
A Blog Cultural Group Total
Hispanic English
Hispanic Spanish
Non-Hispanic Whites
African Americans
Asians
Have Count 95 50 32 84 93 354
% within Cultural Group 19.3% 11.7% 6.2% 14.9% 18.5% 14.2%
Plan to have within the next year for the first time
Count
48 60 16 47 52 223
% within Cultural Group 9.7% 14.0% 3.1% 8.3% 10.4% 8.9%
Do not have and do not plan to have within the next year for the first time
Count 350 318 465 433 357 1923
% within Cultural Group 71.0% 74.3% 90.6% 76.8% 71.1% 76.9%
Total Count 493 428 513 564 502 2500
% within Cultural Group 100.0% 100.0% 100.0% 100.0% 100.0% 100.0%

35
Table 2 Website
A Website Cultural Group Total
Hispanic English
Hispanic Spanish
Non-Hispanic Whites
African Americans
Asians
Have Count 144 150 78 157 143 672
% within Cultural Group 29.2% 35.0% 15.2% 27.8% 28.5% 26.9%
Plan to have within the next year for the first time
Count 59 66 25 83 64 297
% within Cultural Group 12.0% 15.4% 4.9% 14.7% 12.7% 11.9%
Do not have and do not plan to have within the next year for the first time
Count 290 212 410 324 295 1531
% within Cultural Group 58.8% 49.5% 79.9% 57.4% 58.8% 61.2%
Total Count 493 428 513 564 502 2500
% within Cultural Group 100.0% 100.0% 100.0% 100.0% 100.0% 100.0%
Table 3 Podcast
A Podcast Cultural Group Total
Hispanic English
Hispanic Spanish
Non-Hispanic Whites
African Americans
Asians
Have Count 40 19 7 24 40 130
% within Cultural Group 8.1% 4.4% 1.4% 4.3% 8.0% 5.2%
Plan to have within the next year for the first time
Count 53 63 20 50 51 237
% within Cultural Group 10.8% 14.7% 3.9% 8.9% 10.2% 9.5%
Do not have and do not plan to have within the next year for the first time
Count 400 346 486 490 411 2133
% within Cultural Group 81.1% 80.8% 94.7% 86.9% 81.9% 85.3%
Total Count 493 428 513 564 502 2500
% within Cultural Group 100.0% 100.0% 100.0% 100.0% 100.0% 100.0%

36
Table 4 Cellular phone without camera
Table 5 Cellular phone with camera
Cellular phone with camera Cultural Group Total
Hispanic English
Hispanic Spanish
Non-Hispanic Whites
African Americans
Asians
Have Count 338 276 213 314 365 1506
% within Cultural Group 68.6% 64.5% 41.5% 55.7% 72.7% 60.2%
Plan to have within the next year for the first time
Count 47 45 48 79 51 270
% within Cultural Group 9.5% 10.5% 9.4% 14.0% 10.2% 10.8%
Do not have and do not plan to have within the next year for the first time
Count 108 107 252 171 86 724
% within Cultural Group 21.9% 25.0% 49.1% 30.3% 17.1% 29.0%
Total Count 493 428 513 564 502 2500
% within Cultural Group 100.0% 100.0% 100.0% 100.0% 100.0% 100.0%
Cellular phone without camera Cultural Group Total
Hispanic English
Hispanic Spanish
Non-Hispanic Whites
African Americans
Asians
Have Count 210 181 241 236 191 1059
% within Cultural Group 42.6% 42.3% 47.0% 41.8% 38.0% 42.4%
Plan to have within the next year for the first time
Count 19 14 7 32 12 84
% within Cultural Group 3.9% 3.3% 1.4% 5.7% 2.4% 3.4%
Do not have and do not plan to have within the next year for the first time
Count 264 233 265 296 299 1357
% within Cultural Group 53.5% 54.4% 51.7% 52.5% 59.6% 54.3%
Total Count 493 428 513 564 502 2500
% within Cultural Group 100.0% 100.0% 100.0% 100.0% 100.0% 100.0%
37
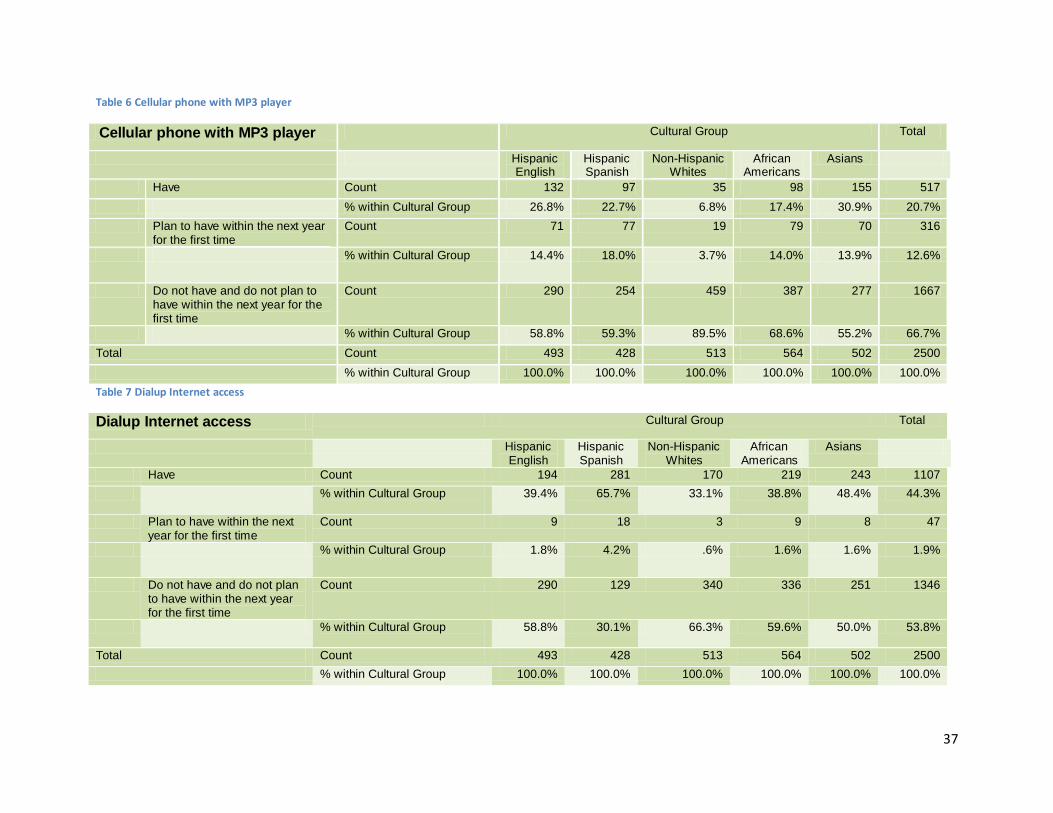
Table 6 Cellular phone with MP3 player
Cellular phone with MP3 player Cultural Group Total
Hispanic English
Hispanic Spanish
Non-Hispanic Whites
African Americans
Asians
Have Count 132 97 35 98 155 517
% within Cultural Group 26.8% 22.7% 6.8% 17.4% 30.9% 20.7%
Plan to have within the next year for the first time
Count 71 77 19 79 70 316
% within Cultural Group 14.4% 18.0% 3.7% 14.0% 13.9% 12.6%
Do not have and do not plan to have within the next year for the first time
Count 290 254 459 387 277 1667
% within Cultural Group 58.8% 59.3% 89.5% 68.6% 55.2% 66.7%
Total Count 493 428 513 564 502 2500
% within Cultural Group 100.0% 100.0% 100.0% 100.0% 100.0% 100.0%
Table 7 Dialup Internet access
Dialup Internet access Cultural Group Total
Hispanic English
Hispanic Spanish
Non-Hispanic Whites
African Americans
Asians
Have Count 194 281 170 219 243 1107
% within Cultural Group
39.4% 65.7% 33.1% 38.8% 48.4% 44.3%
Plan to have within the next year for the first time
Count 9 18 3 9 8 47
% within Cultural Group 1.8% 4.2% .6% 1.6% 1.6% 1.9%
Do not have and do not plan to have within the next year for the first time
Count 290 129 340 336 251 1346
% within Cultural Group
58.8% 30.1% 66.3% 59.6% 50.0% 53.8%
Total Count 493 428 513 564 502 2500
% within Cultural Group 100.0% 100.0% 100.0% 100.0% 100.0% 100.0%

38
Table 8 High speed Internet access
High speed Internet access Cultural Group Total
Hispanic English
Hispanic Spanish
Non-Hispanic Whites
African Americans
Asians
Have Count 351 202 374 402 362 1691
% within Cultural Group 71.2% 47.2% 72.9% 71.3% 72.1% 67.6%
Plan to have within the next year for the first time
Count 74 144 64 98 85 465
% within Cultural Group 15.0% 33.6% 12.5% 17.4% 16.9% 18.6%
Do not have and do not plan to have within the next year for the first time
Count 68 82 75 64 55 344
% within Cultural Group 13.8% 19.2% 14.6% 11.3% 11.0% 13.8%
Total Count 493 428 513 564 502 2500
% within Cultural Group 100.0% 100.0% 100.0% 100.0% 100.0% 100.0%
Table 9 Wi-Fi or wireless Internet access
Wi-Fi or wireless Internet Access Cultural Group Total
Hispanic English
Hispanic Spanish
Non-Hispanic Whites
African Americans
Asians
Have Count 179 71 131 139 240 760
% within Cultural Group 36.3% 16.6% 25.5% 24.6% 47.8% 30.4%
Plan to have within the next year for the first time
Count 82 113 48 112 93 448
% within Cultural Group 16.6% 26.4% 9.4% 19.9% 18.5% 17.9%
Do not have and do not plan to have within the next year for the first time
Count 232 244 334 313 169 1292
% within Cultural Group 47.1% 57.0% 65.1% 55.5% 33.7% 51.7%
Total Count 493 428 513 564 502 2500
% within Cultural Group 100.0% 100.0% 100.0% 100.0% 100.0% 100.0%

39
Table 10 Desktop Computer
Desktop computer Cultural Group Total
Hispanic English
Hispanic Spanish
Non-Hispanic Whites
African Americans
Asians
Have Count 434 364 473 515 450 2236
% within Cultural Group 88.0% 85.0% 92.2% 91.3% 89.6% 89.4%
Plan to have within the next year for the first time
Count 11 26 7 11 10 65
% within Cultural Group 2.2% 6.1% 1.4% 2.0% 2.0% 2.6%
Do not have and do not plan to have within the next year for the first time
Count 48 38 33 38 42 199
% within Cultural Group 9.7% 8.9% 6.4% 6.7% 8.4% 8.0%
Total Count 493 428 513 564 502 2500
% within Cultural Group 100.0% 100.0% 100.0% 100.0% 100.0% 100.0%
Table 11 Laptop Computer
Laptop computer Cultural Group Total
Hispanic English
Hispanic Spanish
Non-Hispanic Whites
African Americans
Asians
Have Count 242 164 192 217 334 1149
% within Cultural Group 49.1% 38.3% 37.4% 38.5% 66.5% 46.0%
Plan to have within the next year for the first time
Count 107 130 76 159 72 544
% within Cultural Group 21.7% 30.4% 14.8% 28.2% 14.3% 21.8%
Do not have and do not plan to have within the next year for the first time
Count 144 134 245 188 96 807
% within Cultural Group 29.2% 31.3% 47.8% 33.3% 19.1% 32.3%
Total Count 493 428 513 564 502 2500
% within Cultural Group 100.0% 100.0% 100.0% 100.0% 100.0% 100.0%

40
Table 12 Digital Photo Camera
Digital photo camera Cultural Group Total
Hispanic English
Hispanic Spanish
Non-Hispanic Whites
African Americans
Asians
Have Count 391 318 351 309 412 1781
% within Cultural Group 79.3% 74.3% 68.4% 54.8% 82.1% 71.2%
Plan to have within the next year for the first time
Count 52 75 47 119 48 341
% within Cultural Group 10.5% 17.5% 9.2% 21.1% 9.6% 13.6%
Do not have and do not plan to have within the next year for the first time
Count 50 35 115 136 42 378
% within Cultural Group 10.1% 8.2% 22.4% 24.1% 8.4% 15.1%
Total Count 493 428 513 564 502 2500
% within Cultural Group 100.0% 100.0% 100.0% 100.0% 100.0% 100.0%
Table 13 Digital Video Camera
Digital video camera Cultural Group Total
Hispanic English
Hispanic Spanish
Non-Hispanic Whites
African Americans
Asians
Have Count 243 241 158 180 256 1078
% within Cultural Group 49.3% 56.3% 30.8% 31.9% 51.0% 43.1%
Plan to have within the next year for the first time
Count 90 93 59 151 95 488
% within Cultural Group 18.3% 21.7% 11.5% 26.8% 18.9% 19.5%
Do not have and do not plan to have within the next year for the first time
Count 160 94 296 233 151 934
% within Cultural Group 32.5% 22.0% 57.7% 41.3% 30.1% 37.4%
Total Count 493 428 513 564 502 2500
% within Cultural Group 100.0% 100.0% 100.0% 100.0% 100.0% 100.0%

41
Table 14 DVD Player
DVD player Cultural Group Total
Hispanic English
Hispanic Spanish
Non-Hispanic Whites
African Americans
Asians
Have Count 464 349 475 529 476 2293
% within Cultural Group 94.1% 81.5% 92.6% 93.8% 94.8% 91.7%
Plan to have within the next year for the first time
Count 14 24 8 20 12 78
% within Cultural Group 2.8% 5.6% 1.6% 3.5% 2.4% 3.1%
Do not have and do not plan to have within the next year for the first time
Count 15 55 30 15 14 129
% within Cultural Group 3.0% 12.9% 5.8% 2.7% 2.8% 5.2%
Total Count 493 428 513 564 502 2500
% within Cultural Group 100.0% 100.0% 100.0% 100.0% 100.0% 100.0%
Table 15 Having a DVD Burner
DVD burner Cultural Group Total
Hispanic English
Hispanic Spanish
Non-Hispanic Whites
African Americans
Asians
Have Count 323 260 256 320 346 1505
% within Cultural Group 65.5% 60.7% 49.9% 56.7% 68.9% 60.2%
Plan to have within the next year for the first time
Count 66 63 39 116 58 342
% within Cultural Group 13.4% 14.7% 7.6% 20.6% 11.6% 13.7%
Do not have and do not plan to have within the next year for the first time
Count 104 105 218 128 98 653
% within Cultural Group 21.1% 24.5% 42.5% 22.7% 19.5% 26.1%
Total Count 493 428 513 564 502 2500
% within Cultural Group 100.0% 100.0% 100.0% 100.0% 100.0% 100.0%

42
Table 16 Satellite Radio
Satellite radio Cultural Group Total
Hispanic English
Hispanic Spanish
Non-Hispanic Whites
African Americans
Asians
Have Count 108 72 51 73 68 372
% within Cultural Group 21.9% 16.8% 9.9% 12.9% 13.5% 14.9%
Plan to have within the next year for the first time
Count 48 44 35 79 52 258
% within Cultural Group 9.7% 10.3% 6.8% 14.0% 10.4% 10.3%
Do not have and do not plan to have within the next year for the first time
Count 337 312 427 412 382 1870
% within Cultural Group 68.4% 72.9% 83.2% 73.0% 76.1% 74.8%
Total Count 493 428 513 564 502 2500
% within Cultural Group 100.0% 100.0% 100.0% 100.0% 100.0% 100.0%
Table 17 Satellite TV
Satellite TV Cultural Group Total
Hispanic English
Hispanic Spanish
Non-Hispanic Whites
African Americans
Asians
Have Count 152 193 137 150 127 759
% within Cultural Group 30.8% 45.1% 26.7% 26.6% 25.3% 30.4%
Plan to have within the next year for the first time
Count 44 53 20 46 64 227
% within Cultural Group 8.9% 12.4% 3.9% 8.2% 12.7% 9.1%
Do not have and do not plan to have within the next year for the first time
Count 297 182 356 368 311 1514
% within Cultural Group 60.2% 42.5% 69.4% 65.2% 62.0% 60.6%
Total Count 493 428 513 564 502 2500
% within Cultural Group 100.0% 100.0% 100.0% 100.0% 100.0% 100.0%

43
Table 18 TIVO or some other Digital Video Recorder
TIVO or some other Digital Video Recorder for your TV
Cultural Group Total
Hispanic English
Hispanic Spanish
Non-Hispanic Whites
African Americans
Asians
Have Count 147 77 131 143 150 648
% within Cultural Group 29.8% 18.0% 25.5% 25.4% 29.9% 25.9%
Plan to have within the next year for the first time
Count 109 71 53 106 96 435
% within Cultural Group 22.1% 16.6% 10.3% 18.8% 19.1% 17.4%
Do not have and do not plan to have within the next year for the first time
Count 237 280 329 315 256 1417
% within Cultural Group 48.1% 65.4% 64.1% 55.9% 51.0% 56.7%
Total Count 493 428 513 564 502 2500
% within Cultural Group 100.0% 100.0% 100.0% 100.0% 100.0% 100.0%
Table 19 Electronic Games
Electronic games Cultural Group Total
Hispanic English
Hispanic Spanish
Non-Hispanic Whites
African Americans
Asians
Have Count 305 221 194 270 328 1318
% within Cultural Group 61.9% 51.6% 37.8% 47.9% 65.3% 52.7%
Plan to have within the next year for the first time
Count 29 26 9 39 25 128
% within Cultural Group 5.9% 6.1% 1.8% 6.9% 5.0% 5.1%
Do not have and do not plan to have within the next year for the first time
Count 159 181 310 255 149 1054
% within Cultural Group 32.3% 42.3% 60.4% 45.2% 29.7% 42.2%
Total Count 493 428 513 564 502 2500
% within Cultural Group 100.0% 100.0% 100.0% 100.0% 100.0% 100.0%

44
Table 20 MP3 Player
MP3 player Cultural Group Total
Hispanic English
Hispanic Spanish
Non-Hispanic Whites
African Americans
Asians
Have Count 261 158 112 169 278 978
% within Cultural Group 52.9% 36.9% 21.8% 30.0% 55.4% 39.1%
Plan to have within the next year for the first time
Count 67 87 43 112 62 371
% within Cultural Group 13.6% 20.3% 8.4% 19.9% 12.4% 14.8%
Do not have and do not plan to have within the next year for the first time
Count 165 183 358 283 162 1151
% within Cultural Group 33.5% 42.8% 69.8% 50.2% 32.3% 46.0%
Total Count 493 428 513 564 502 2500
% within Cultural Group 100.0% 100.0% 100.0% 100.0% 100.0% 100.0%

45
Table 21 Having a Blog, by Culture Group and Age
Age Categories
Have a Blog Total
Have
Plan to have within the next
year for the first time
Do not have and do not
plan to have within the next
year for the first time Have
18-30 Cultural Group
Hispanic English Count 49 13 86 148
% within Have a Blog 28.0% 30.2% 30.1% 29.4%
Hispanic Spanish Count 18 10 58 86
% within Have a Blog 10.3% 23.3% 20.3% 17.1%
Non-Hispanic Whites Count 12 2 21 35
% within Have a Blog 6.9% 4.7% 7.3% 6.9%
African Americans Count 43 7 50 100
% within Have a Blog 24.6% 16.3% 17.5% 19.8%
Asians Count 53 11 71 135
% within Have a Blog 30.3% 25.6% 24.8% 26.8%
Total Count 175 43 286 504
% within Have a Blog 100.0% 100.0% 100.0% 100.0%
31-40 Cultural Group
Hispanic English Count 31 13 115 159
% within Have a Blog 29.8% 18.1% 22.2% 22.9%
Hispanic Spanish Count 16 30 115 161
% within Have a Blog 15.4% 41.7% 22.2% 23.2%
Non-Hispanic Whites Count 7 3 60 70
% within Have a Blog 6.7% 4.2% 11.6% 10.1%
African Americans Count 20 11 111 142
% within Have a Blog 19.2% 15.3% 21.5% 20.5%
Asians Count 30 15 116 161
% within Have a Blog 28.8% 20.8% 22.4% 23.2%

46
Total Count 104 72 517 693
% within Have a Blog 100.0% 100.0% 100.0% 100.0%
41-50 Cultural Group
Hispanic English Count 11 12 93 116
% within Have a Blog 23.4% 19.7% 18.0% 18.6%
Hispanic Spanish Count 12 12 79 103
% within Have a Blog 25.5% 19.7% 15.3% 16.5%
Non-Hispanic Whites Count 5 4 127 136
% within Have a Blog 10.6% 6.6% 24.6% 21.8%
African Americans Count 11 15 122 148
% within Have a Blog 23.4% 24.6% 23.6% 23.7%
Asians Count 8 18 95 121
% within Have a Blog 17.0% 29.5% 18.4% 19.4%
Total Count 47 61 516 624
% within Have a Blog 100.0% 100.0% 100.0% 100.0%
41-60 Cultural Group
Hispanic English Count 3 7 39 49
% within Have a Blog 14.3% 17.9% 10.5% 11.3%
Hispanic Spanish Count 3 8 44 55
% within Have a Blog 14.3% 20.5% 11.8% 12.7%
Non-Hispanic Whites Count 5 6 135 146
% within Have a Blog 23.8% 15.4% 36.2% 33.7%
African Americans Count 8 13 103 124
% within Have a Blog 38.1% 33.3% 27.6% 28.6%
Asians Count 2 5 52 59
% within Have a Blog 9.5% 12.8% 13.9% 13.6%
Total Count 21 39 373 433
% within Have a Blog 100.0% 100.0% 100.0% 100.0%
61-75 Cultural Group
Hispanic English Count 1 3 17 21
% within Have a Blog 14.3% 37.5% 7.4% 8.5%
Hispanic Spanish Count 1 0 22 23
% within Have a Blog 14.3% .0% 9.5% 9.3%
Non-Hispanic Whites Count 3 1 122 126
% within Have a Blog 42.9% 12.5% 52.8% 51.2%
African Americans Count 2 1 47 50
% within Have a Blog 28.6% 12.5% 20.3% 20.3%

47
Asians Count 0 3 23 26
% within Have a Blog .0% 37.5% 10.0% 10.6%
Total Count 7 8 231 246
% within Have a Blog 100.0% 100.0% 100.0% 100.0%
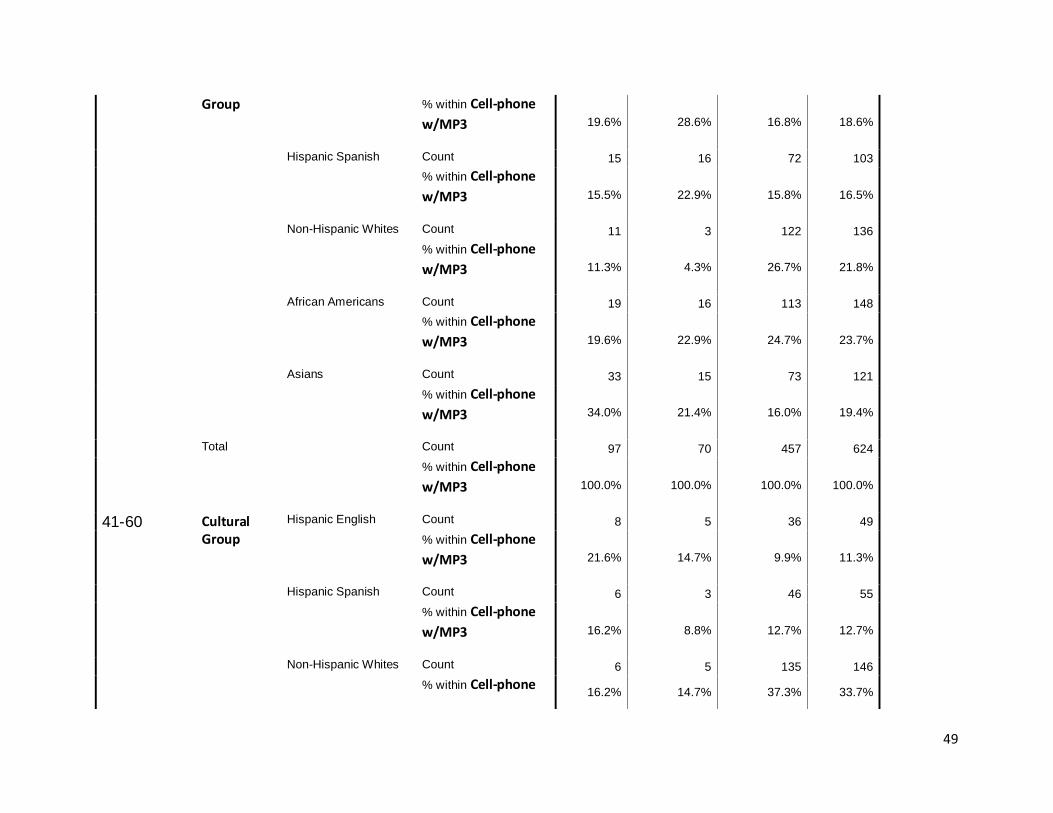
Table 22 Cellular phone with MP3 player by Cultural Group and Age
Age
Categories
Have a cellular phone with MP3 Total
Have
Plan to have within the next
year for the first time
Do not have and do not
plan to have within the next
year for the first time Have
18-30 Cultural Group
Hispanic English Count 59 27 62 148
% within Cell-phone
w/MP3 29.1% 28.7% 30.0% 29.4%
Hispanic Spanish Count 35 20 31 86
% within Cell-phone
w/MP3 17.2% 21.3% 15.0% 17.1%
Non-Hispanic Whites Count 7 7 21 35
% within Cell-phone
w/MP3 3.4% 7.4% 10.1% 6.9%
African Americans Count 36 20 44 100
% within Cell-phone
w/MP3 17.7% 21.3% 21.3% 19.8%

48
Asians Count 66 20 49 135
% within Cell-phone
w/MP3 32.5% 21.3% 23.7% 26.8%
Total Count 203 94 207 504
% within Cell-phone
w/MP3 100.0% 100.0% 100.0% 100.0%
31-40 Cultural Group
Hispanic English Count 45 18 96 159
% within Cell-phone
w/MP3 26.5% 16.2% 23.3% 22.9%
Hispanic Spanish Count 40 36 85 161
% within Cell-phone
w/MP3 23.5% 32.4% 20.6% 23.2%
Non-Hispanic Whites Count 9 4 57 70
% within Cell-phone
w/MP3 5.3% 3.6% 13.8% 10.1%
African Americans Count 28 30 84 142
% within Cell-phone
w/MP3 16.5% 27.0% 20.4% 20.5%
Asians Count 48 23 90 161
% within Cell-phone
w/MP3 28.2% 20.7% 21.8% 23.2%
Total Count 170 111 412 693
% within Cell-phone
w/MP3 100.0% 100.0% 100.0% 100.0%
41-50 Cultural Hispanic English Count 19 20 77 116
49
Group % within Cell-phone
w/MP3 19.6% 28.6% 16.8% 18.6%
Hispanic Spanish Count 15 16 72 103
% within Cell-phone
w/MP3 15.5% 22.9% 15.8% 16.5%
Non-Hispanic Whites Count 11 3 122 136
% within Cell-phone
w/MP3 11.3% 4.3% 26.7% 21.8%
African Americans Count 19 16 113 148
% within Cell-phone
w/MP3 19.6% 22.9% 24.7% 23.7%
Asians Count 33 15 73 121
% within Cell-phone
w/MP3 34.0% 21.4% 16.0% 19.4%
Total Count 97 70 457 624
% within Cell-phone
w/MP3 100.0% 100.0% 100.0% 100.0%
41-60 Cultural Group
Hispanic English Count 8 5 36 49
% within Cell-phone
w/MP3 21.6% 14.7% 9.9% 11.3%
Hispanic Spanish Count 6 3 46 55
% within Cell-phone
w/MP3 16.2% 8.8% 12.7% 12.7%
Non-Hispanic Whites Count 6 5 135 146
% within Cell-phone 16.2% 14.7% 37.3% 33.7%

50
w/MP3
African Americans Count 10 12 102 124
% within Cell-phone
w/MP3 27.0% 35.3% 28.2% 28.6%
Asians Count 7 9 43 59
% within Cell-phone
w/MP3 18.9% 26.5% 11.9% 13.6%
Total Count 37 34 362 433
% within Cell-phone
w/MP3 100.0% 100.0% 100.0% 100.0%
61-75 Cultural Group
Hispanic English Count 1 1 19 21
% within Cell-phone
w/MP3 10.0% 14.3% 8.3% 8.5%
Hispanic Spanish Count 1 2 20 23
% within Cell-phone
w/MP3 10.0% 28.6% 8.7% 9.3%
Non-Hispanic Whites Count 2 0 124 126
% within Cell-phone
w/MP3 20.0% .0% 54.1% 51.2%
African Americans Count 5 1 44 50
% within Cell-phone
w/MP3 50.0% 14.3% 19.2% 20.3%
Asians Count 1 3 22 26
% within Cell-phone
w/MP3 10.0% 42.9% 9.6% 10.6%

51
Total Count 10 7 229 246
% within Cell-phone
w/MP3 100.0% 100.0% 100.0% 100.0%
Table 23 Household Income by Cultural Group
Quota on Ethnic
What is your household income? Hispanic English
Hispanic Spanish
Non-Hispanic Whites
African Americans Asians
$19,999 or less N 40 67 50 86 31
%
9.1% 19.6% 11.4% 17.8% 7.5%
$20,000 to 29,999 N 55 66 58 82 30
%
12.5% 19.3% 13.2% 17.0% 7.2%
$30,000 to 39,999 N 64 56 55 61 40
%
14.5% 16.4% 12.5% 12.7% 9.6%
$40,000 to 49,999 N 61 63 50 59 43
%
13.9% 18.4% 11.4% 12.2% 10.3%
$50,000 to 59,999 N 42 31 53 58 44
%
9.5% 9.1% 12.0% 12.0% 10.6%
$60,000 to 69,999 N 37 17 49 46 39
%
8.4% 5.0% 11.1% 9.5% 9.4%
$70,000 to 79,999 N 41 12 32 26 39
%
9.3% 3.5% 7.3% 5.4% 9.4%
$80,000 to 89,999 N 23 11 15 15 33
%
5.2% 3.2% 3.4% 3.1% 7.9%
$90,000 to 99,999 N 21 5 25 17 27
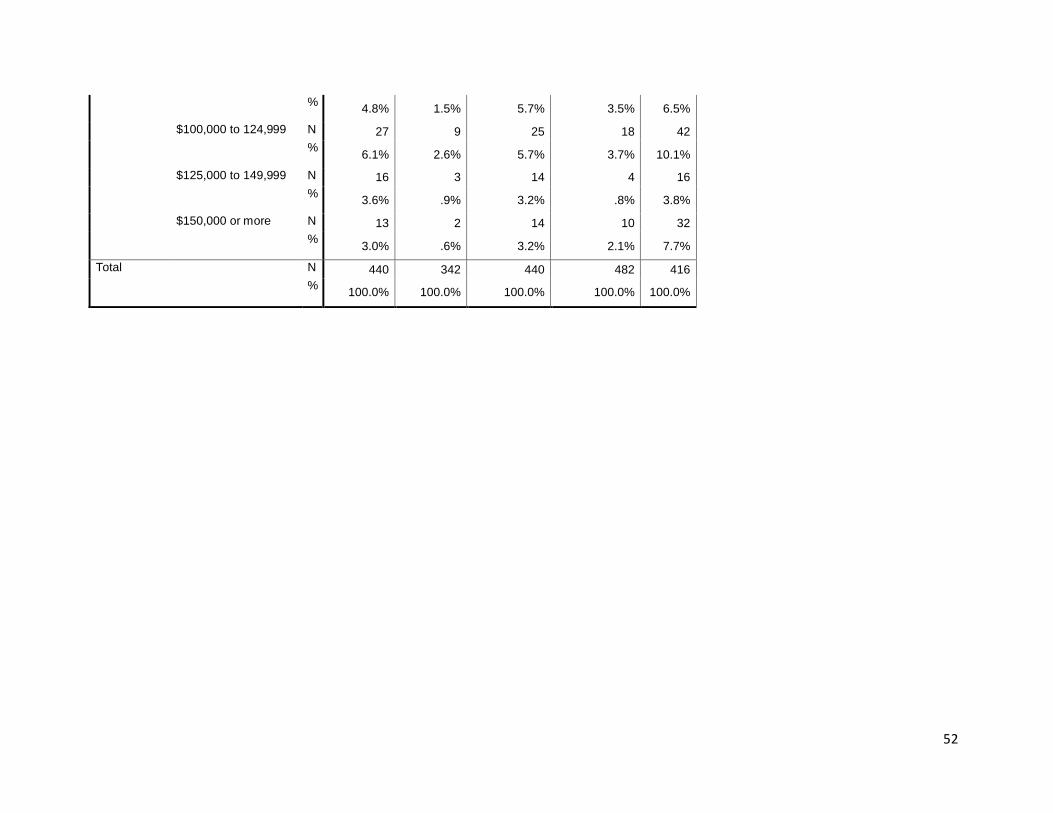
52
%
4.8% 1.5% 5.7% 3.5% 6.5%
$100,000 to 124,999 N 27 9 25 18 42
%
6.1% 2.6% 5.7% 3.7% 10.1%
$125,000 to 149,999 N 16 3 14 4 16
%
3.6% .9% 3.2% .8% 3.8%
$150,000 or more N 13 2 14 10 32
%
3.0% .6% 3.2% 2.1% 7.7%
Total N 440 342 440 482 416
%
100.0% 100.0% 100.0% 100.0% 100.0%