online appendix - northwestern · pdf fileobtained from historical atlas by william r....
TRANSCRIPT

Online Appendix Variables definitions
A. Measures of civic capital
Number of non-profit organizations: the measure is obtained from the Istat 2001 National Census which
collects data on all types of non-profit and voluntary organizations existing in Italy at times of census. It
reports data on the total number of non-profit organizations, and separately on the number of voluntary
associations, social cooperatives and foundations, excluding church based organizations. The total number of
non-profit organizations includes all the above types; voluntary organizations are the bulk of the total.
Presence of an organ donation organization: The indicator of existence of an organ donation organization in
the city was obtained from the Ministero del Lavoro (2005), which assembles registries from each regions
which contain information for all Voluntary Associations at the Provincial level. The registries report the
name, mission and address of the voluntary organizations located in each province. For all regions in the
Center North the registries contained information on the presence of a branch of AIDO – the only organ
donation organization in Italy – in each municipality. However, several regions in the South, did not compile
registries of voluntary associations. Thus, for the Southern sample we obtained the information by contacting
directly each AIDO organization in each province and asked for the list of municipalities in their province with
an AIDO branch. AIDO was founded in 1973 and is present in about 2,060 municipalities (out of 8,000 in the
country) and counts 1,129,662 donors.
Cheating in math: Indicator of cheating in math computed by Invalsi for the 2009 Invalsi test among the
population of grade 8 Italian students (INVALSI, 2014). INVALSI is an agency under the supervision of the
Ministry of Education which performs periodic and systematic evaluations of public school students using
standardized tests. Invalsi uses measures of average performance and of concentration in performance to

identify cheating behavior in the test at the level of the school. Our indicator is the mean index of cheating in
the city standardized with its standard deviation.
B. Historical variables
Commune (or free city state): this is an indicator variable equal to 1 if the town was a commune according to
two historical maps of Italy contained in De Agostini (2007). We use two maps. The first map shows lists of
free cities around the time of the war between the communal cities and the Holy Roman Emperor Frederick I
“Barbarossa” in the year 1167. This map is reported in Figure A1 (corresponding to map 28 in De Agostini,
2007). The red line in the map marks the border of the Kingdom of Italy under the Holy Roman Empire.
Communes are those marked with a black dot. This constitutes our first measure of free cities. The second
measure is obtained combining information from the map previously described and the map of Italy around the
year 1300, shown in Figure A2 (map 29 in De Agostini, 2007); free cities are those that were listed as
independent at least by one of the two maps.
Communes belonging to the Lombard League, allied with the Emperor and neutral cities. The map also
distinguishes which cities joined the Lombard League (names written in red) in the war for independence
against the Emperor and which were allied to the Emperor (names written in blue). The remaining cities were
neutral.
Length of independence: Information on when independence was acquired and when it was lost has been
obtained through a search from different sources: the main one is Treccani (1949); when the information was
not available in Treccani (1949), we relied on the Touring Club Italiano (2000) which report for each region a
brief historical summary of the cities listed in the guide and the historical summary on the official web page of
the various cities.

Ease of coordination. Following historians, we proxy the ease of coordination with an indicator whether the
city was a seat of a Bishop before 1000 C.E. This identifier is obtained from the map “Italia altomedievale:
sedi vescovili” from Treccani (2007), maps n. 152, 153 , 154, 155 that reports the Bishop cities in the late
Middle Ages. Bishop cities were mostly formed between the first and the third century C.E., as the Christian
movement spread out.
New seat of a Bishop after 1400 C.E: This variable is equal to 1 if a city has become a bishop city after year
1400, roughly after the end of the communal experience. Late bishop cities have been identified from the full
list of the Italian Bishop cities as listed in the following link https://it.wikipedia.org/wiki/Diocesi_italiane
http://it.wikipedia.org/wiki/Elenco_delle_diocesi_italiane which also summarizes their history and reports the
year or century in which the bishop city was founded. Since some bishop cities that were active in the XI
century were subsequently discontinued or moved somewhere else (e.g. Udine and Gorizia which replaced
Aquileia) we have used the map “Italia altomedievale: sedi vescovili” from Treccani (2007), maps n. 152, 153,
154, 155 to identify the old bishop cities and the list of current bishop cities to identify those created after the
year 1400.
Size of city in year 1300 C.E.: We have classified two indicators for the size of cities in the year 1300: Large
is a dummy variable equal to 1 if the city population exceeds 10,000 people in year 1300; Medium is a dummy
variable equal to 1 if the city population is between 1,000 and 10,000 people in that year. The information on
city size is obtained from Bairoch, Batou and Chevre (1988, pp. 40-49) who reports the population of
European cities from year 800 up to year 1850 at a frequency of about every 100 years. The criteria for
including a city in the list are that it must have had at least 5,000 inhabitants once between 800 and 1850.
Needless to say, the more one goes back on time the more difficult it is to find information on population,
which results in a missing observation. We have chosen the population in the year 1300 to balance the need to
go as far back as possible and closer to year 1,000, while at the same time being able to have enough
information on city population. The year 1300 is the first for which missing data appear to be limited.

City located at an intersection of Roman roads: variable equals to 1 if the city is located on a relevant Roman
road or at the intersection between two or more Roman roads. Roman roads are identified from the Touring
Club Italiano (1994) and from the “Reference Map of Ancient Italy” and then by comparing today’s location
of the city using Google Maps with the map of the Roman cities. The Reference Map of Ancient Italy is
obtained from Historical Atlas by William R. Shepherd - Perry-Castañeda Map Collection:
http://www.lib.utexas.edu/maps/historical/history_shepherd_1923.html , North and Southern parts.
City belonged to a marches: is equal to 1 if the city in the Center-North was part of a marches in the regional
organization at the time of Charlemagne, from Treccani (2007).
Medal of honor: is equal to 1 if the city has been awarded a gold medal for the heroism of its population in
fighting against the Nazi-Fascists in the 1943-1945 period. The source is ANPI, Resistenzaitaliana.it,
http://www.storiaxxisecolo.it/documenti/documenti12.html.
C. City controls and measures of economic development
The main source for several city controls and variables is the database assembled by Ancitel “Le Misure dei
Comuni,” 2003-2004 Edition. This database is assembled by Ancitel, the association of municipal
administrations and reports about 320 variables measuring various items at the level of the city ranging from
population to income, bank deposits and households.
City elevation: It is measured in meters from the sea level. Source: Ancitel.
Max difference in elevation: It is the difference between the highest and the lowest point in the city territory, in
meters. Source: Ancitel.
Current Population: number of inhabitants according to the 2001 Census. Source: Ancitel.

Population at unification: number inhabitants in 1871 according to the 1871 Census. Source: Istat, “Census
Data.”
Gross per capita disposable income: level of disposable income per capita: euros in the year 2000; the figure is
obtained from tax filings at the city level and the original source is the Ministry of Finance. Source: Ancitel.
Gini land ownership inequality index: computed using data on the size distribution of agricultural firms in the
year 2000 based on information from the 2001 Census. Source: Ancitel.
D. Invalsi questionnaire The attribution style measures are obtained from the answers to the 8 questions below asked in the
questionnaire submitted to 5th grade student as part of the Invalsi test in the academic year 2009-2010.
Questions 1, 3, 4, 6 and 8 are in the domain of successes; questions 2, 5 and 7 in the domain of failures.
“The situations described below can happen at school. Image you find yourself in one of them. Please choose
the answers that fits you best”
1. Your teacher has asked to make a drawing. You do it very well. How did you do? a) I received help; b) I
was lucky; c) it was easy; d) I am clever; e) I put effort.
2. Your teacher asks you to write an essay. You make several mistakes. Why? a) Nobody helped; b) I was
unlucky; c) it was difficult; d) I am not good; e) I did not put effort
3. Your teacher asked to repeat a story that you read in class. You tell it very well. How did you do? a) I
received help; b) I was lucky; c) it was easy; d) I am clever; e) I put effort
4. The first day of class your teacher asked to describe how you spent you vacation. You tell it so well that all
your classmates are amused. How did you do? a) I received help; b) I was lucky; c) it was easy; d) I am clever;
e) I put effort.
5. Your teacher asked to recite a poem you studied in class. But you do not remember it well and do a poor
job. How did you do? a) I received no help; b) I was unlucky; c) it was difficult; d) I am not good; e) I did not
put effort.
6. Your do an end-of-year play and you performs so well that all applauded. How did you do? a) I received
help; b) I was lucky; c) it was easy; d) I am clever; e) I put effort.
7. Your teacher asks to complete a project for Christmas but you do so badly that you have to do it again.
How did you do? a) I received no help; b) I was unlucky; c) it was difficult; d) I am not good; e) I did not put
effort.
8. Your teacher asks you to solve a math problem on the blackboard and you do it very well. How did you
do? a) I received help; b) I was lucky; c) it was easy; d) I am clever; e) I put effort.
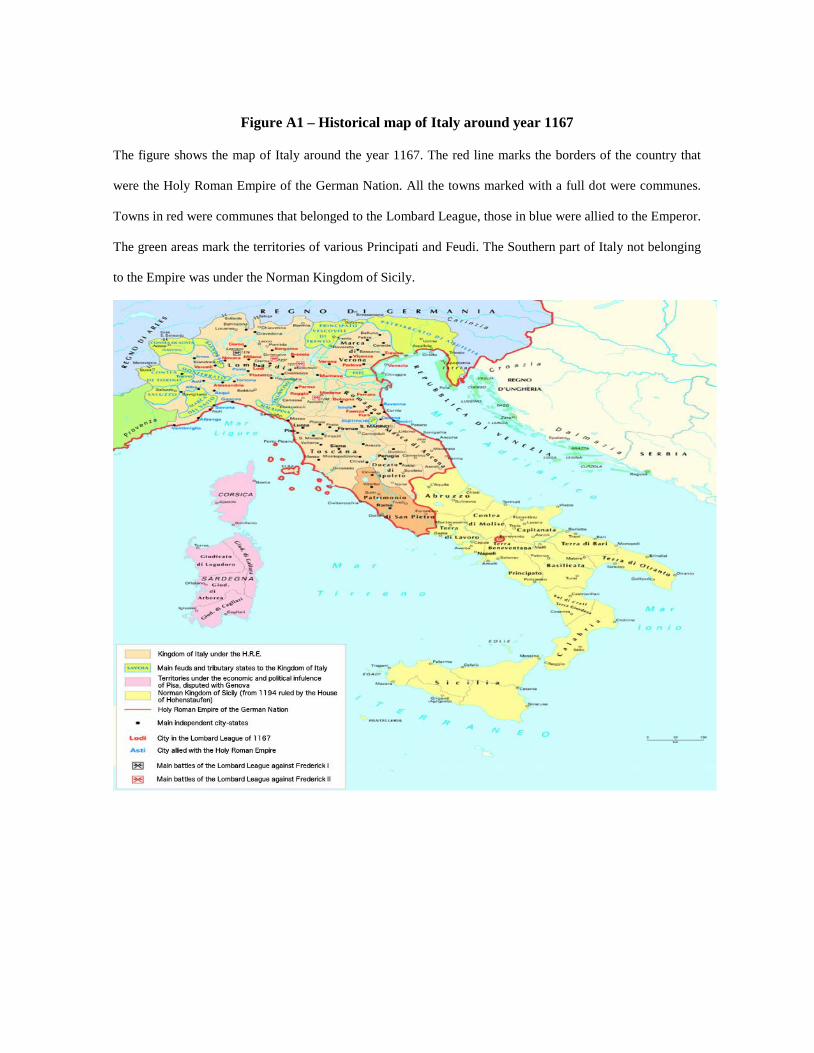
Figure A1 – Historical map of Italy around year 1167
The figure shows the map of Italy around the year 1167. The red line marks the borders of the country that
were the Holy Roman Empire of the German Nation. All the towns marked with a full dot were communes.
Towns in red were communes that belonged to the Lombard League, those in blue were allied to the Emperor.
The green areas mark the territories of various Principati and Feudi. The Southern part of Italy not belonging
to the Empire was under the Norman Kingdom of Sicily.

Figure A2 – Historical map of Italy around year 1300
The figure shows the map of Italy at around year 1300. It shows the communes and their territory (contado),
as well as the principati that were ruling in various areas.

Figure A3 – Cross-cities distribution of self efficacy
The figure shows the cross-cities distribution of self-efficacy over the domain of success, the domain of
failure and the overall indicator, obtained by weighting the indicator over the domain of success by 0.6 and
the score over the domain of failure. By 0.4

Table A1: Tests for differences in means across samples
The table shows mean values, differences in mean values and test of significance of the difference in means between
commune and no commune cities for then main controls in the regressions. P-values are in parentheses.. *** significant
at less than 1%; ** significant at 5%; * significant at 10%.
Variable Commune Non-commune Difference Significance Elevation 0.151 0.342 -0.191 *** (0.000) Max difference in elevation
0.519 0,.639 -0.121 (0.179)
City is on the coast
0.156 0.031 0.125 *** (0.000)
Population (in millions)
0.118 0.005 0.136 *** (0.000)
Large city (historically)
0.453 0.0006 0.453 *** (0.000)
Medium city (historically)
0.141 0.002 0.139 *** (0.000)
Gini Land 0.640 0.587 0.052 *** (0.020) Gini income 0.419 0.381 Income per capita
16.47 13.22 0.038 *** (0.000)
Bishop city 0.922 0.022 0.899 *** (0.000)

Table A2: Robustness
Panel A reports regressions of the effects of free cities on civic capital on the sample of the largest 400 cities in the Center North of Italy (as of 1871) using the same
specification as in Table 4, Panel A, column II (for the first three columns) and expanding the set of historical controls (for the remaining columns); Panel B shows non-
weighted OLS estimates of the effect of having been an independent city on measures of civic capital today. Panel C shows the estimates on the total sample of Center-
North cities for a Commune identifier obtained as the union of the free cities in 1167 C.E. and in 1300 C.E. Panel D adds 11 regional dummies (out of 12 regions), Panel E
restricts the sample to cities with population size above the 90th percentile while Panel F drops also cities with more than 300,000 people (5 observations). Panel G uses
referenda turnout as a measure of civic capital, available for the 400 cities sample. *** significant at less than 1%; ** significant at 5%; * significant at 10%. Robust
standard errors are reported in parentheses.
A. Sample of 400 largest northern cities
I Non-profit org.
II Organ donation org.
III Cheating in math
IV Non-profit org
V Organ donation org.
VI Cheating in math
Commune 1.10** 0.13** -0.21*** 1.17*** 0.12** -0.15*** (0.33) (0.06) (0.05) (0.390) (0.060) (0.055)
Elevation 0.23 -0.22 0.27 1.34* -0.20 0.30 (0.85) (0.18) (0.21) (0.780) (0.184) (0.208) Max difference in elevation within city territory 0.74* -0.07 0.05 0.53** -0.05 0.02 (0.31) (0.05) (0.05) (0.269) (0.045) (0.051) City is on the coast -0.31 0.05 -0.11* -0.26 0.02 -0.08 (0.36) (0.06) (0.06) (0.335) (0.065) (0.061) City is more than 5km from the coast -0.65* 0.08 -0.24** -1.22*** 0.06 -0.29** (0.26) (0.18) (0.12) (0.312) (0.180) (0.122) Population (million people) -3.67* 0.83*** -0.69*** -4.80*** 0.96*** -0.97*** (1.77) (0.21) (0.25) (1.637) (0.234) (0.264) Population squared 0.41 -0.73*** 0.71*** 1.84 -0.81*** 0.94*** (1.32) (0.16) (0.19) (1.255) (0.178) (0.225) Gini inequality index of land ownership 1.59 -0.09 -0.45** 1.70* -0.18 -0.33* (1.02) (0.16) (0.18) (0.917) (0.152) (0.184) Gini income inequality index 17.82** 3.02*** -4.06*** 11.96*** 2.93*** -3.92*** (5.08) (0.74) (0.99) (4.419) (0.812) (1.061) At cross with roman roads 0.68** -0.03 0.08

(0.322) (0.05) (0.05) City belongs to a marquis 1.17*** 0.09* 0.03 (0.301) (0.05) (0.06) City size in 1300: medium 0.40 0.16 -0.15** (0.450) (0.103) (0.06) City size in 1300: large 0.18 0.02 -0.08** (0.358) (0.05) (0.04) Observations 401 403 379 401 403 379 R-squared 0.27 0.25 0.21 0.37 0.26 0.22
B. OLS non-weighted regressions
I Non-profit
organizations
II Organ donation
organization
III Cheating in math
Commune 2.91** 0.31*** 0.01 (0.44) (0.07) (0.20)
Elevation 8.96** -0.02*** 0.83 (2.30) (0.01) (0.99) Max difference in elevation within city territory 0.79 0.00 0.52 (0.50) (0.00) (0.38) City is on the coast 2.65** -0.01 0.18 (0.84) (0.02) (0.41) City is more than 5km from the coast 4.20* 0.03 -0.33 (1.70) (0.02) (0.39) Population (million people) -18.15* 6.34*** -17.77*** (8.28) (0.77) (4.06) Population squared 14.81* -5.21*** 15.68*** (7.05) (0.85) (3.89) Gini inequality index of land ownership -5.76* -0.01 0.72 (2.82) (0.01) (1.18) Gini income inequality index -0.14 0.17*** -9.95* (4.71) (0.04) (5.75) Observations 5,360 5,538 1,912 R-squared 0.04 0.30 0.01

Panel C: Alternative definition of commune (combined definition)
I Non-profit
organizations
II Organ donation
organization
III Cheating in
math Commune: combined definition 2.18*** 0.45*** -0.31***
(0.27) (0.06) (0.08) Elevation 2.00*** -0.28*** 0.96** (0.46) (0.07) (0.45) Max difference in elevation within city territory 1.38*** 0.03 0.22 (0.22) (0.03) (0.15) City is on the coast 0.18 0.02 -0.09 (0.27) (0.05) (0.13) City is more than 5km from the coast 1.13* 0.06 -0.17 (0.63) (0.07) (0.22) Population (million people) -5.63*** 1.40*** -2.39*** (2.08) (0.41) (0.67) Population squared 2.44 -1.09*** 2.28*** (1.56) (0.30) (0.59) Gini inequality index of Land ownership 0.53 0.17* -0.14 (0.51) (0.10) (0.45) Gini income inequality index 9.40*** 2.40*** -9.61*** (2.08) (0.40) (2.48) Observations 5,360 5,372 1,890 R-squared 0.09 0.55 0.02

Panel D: Adding finer regional controls
I II III Non profit
organizations Organ donation Cheating in
math Commune 1.96*** 0.38*** -0.29*** (0.311) (0.063) (0.108) Elevation 2.76*** -0.31*** 1.50** (0.441) (0.078) (0.611) Max difference in elevation
0.56*** 0.06* 0.22
(0.169) (0.030) (0.182) City is on the coast -0.25 0.09 -0.15 (0.425) (0.057) (0.184) City more than 5km from the coast
0.35 0.07 -0.26
(0.601) (0.072) (0.240) Current Population -6.04** 1.64*** -2.54*** (2.708) (0.427) (0.638) Current Population squared
3.21 -1.25*** 2.52***
(1.996) (0.317) (0.537) Gini inequality index of land own.
0.07 0.16* -0.19
(0.521) (0.086) (0.525) Gini income inequality index
10.86*** 2.62*** -9.53***
(1.932) (0.387) (2.806) Observations 5,360 5,372 1,890 R-squared 0.142 0.561 0.023

Panel E: Only cities in the top 90 percentile of population distribution
I
Non profit organizations
II Organ donation
III Cheating in math
Commune 1.64*** 0.33*** -0.19*** (0.331) (0.065) (0.045) Elevation -1.01 -0.37* 0.07 (0.914) (0.203) (0.189) Max difference in elevation 1.21*** 0.08 -0.02 (0.331) (0.054) (0.050) City is on the coast -0.24 -0.01 -0.10* (0.342) (0.069) (0.059) City more than 5km from the coast
0.14 0.16 -0.20
(0.272) (0.168) (0.136) Current Population -3.45 1.01*** -0.89*** (2.173) (0.333) (0.302) Current Population squared 0.27 -0.87*** 0.76*** (1.592) (0.248) (0.217) Gini inequality index of land own.
2.17** 0.24 -0.15
(0.926) (0.174) (0.207) Gini income inequality index 20.49*** 3.64*** -2.68*** (4.065) (0.778) (0.827) Observations 469 469 459 R-squared 0.372 0.403 0.186

Panel F: Only cities in the top 90 percent of population distribution and dropping cities with > 300 thousand people
I Non profit
organizations
II Organ donation
III Cheating in math
Commune 1.39*** 0.21*** -0.03 (0.350) (0.067) (0.044) Elevation -0.29 -0.27 -0.03 (0.860) (0.193) (0.180) Max difference in elevation 1.48*** 0.11** -0.06 (0.283) (0.048) (0.047) City is on the coast -0.06 -0.04 -0.08 (0.302) (0.067) (0.054) City more than 5km from the coast
0.35 0.19 -0.24*
(0.312) (0.183) (0.124) Current Population 7.09 7.01*** -9.14*** (7.729) (1.568) (1.126) Current Population squared -12.26 -17.63*** 26.66*** (33.259) (6.202) (4.414) Gini inequality index of land own.
1.24* 0.06 0.08
(0.736) (0.175) (0.211) Gini income inequality index 13.34*** 2.25*** -1.08 (3.574) (0.761) (0.823) Observations 464 464 454 R-squared 0.407 0.372 0.223

Panel G: Referenda turnout
I Referenda
turnout Commune 1.21***
(0.529) Altitude -7.959*** (1.67) Excursion -2.820*** (0.434) City in on the coast -3.234** (0.678) City is 5 km from the sea -.119 (0.725) Population -9.801*** (3.385) Population^2 2.256 (2.518) Gini land concentration 3.241*** (1.525) Gini income concentration -9.437 (6.830) Observations 400 R-squared 0.38

Table A3: Digging deeper into history
Panel A shows the second stage results of a two-step Heckman estimates of the effect of the length of independence of
free cities on civic capital today. The first stage uses an indicator for whether the city was the seat of a Bishop. The Mill’s
ratio is obtained from the first-step probit regression. In Panel B we insert an indicator variable for whether the city
evolved into an independent Signoria as an additional regressor. In Panel C we decompose the commune indicator
variable depending on whether the commune was “neutral,” “allied with the Emperor” or “in the Lombard League” in the
war for independence against Emperor Frederick I. Regressions are run on the sample of all cities located in the Center-
North. Robust standard errors are reported in parentheses. *** significant at less than 1%; ** significant at 5%; *
significant at 10%.
Panel A. Effect of the length of independence on civic capital
I Non-profit
organizations
II Organ donation
organization
III Cheating in math
Log of length of independence 0.23** 0.09*** -0.11*** (0.09) (0.02) (0.03) Elevation 3.52** -0.73** -0.64 (1.57) (0.35) (0.53) Max difference in elevation within city territory -0.11 0.18 -0.32* (0.53) (0.12) (0.18) City is on the coast 0.27 -0.08 -0.21 (0.62) (0.13) (0.21) City is more than 5km from the coast -4.53 -4.53 -4.57 (0.00) (0.00) (0.00) Population (million people) -6.35* 0.76 -0.72 (3.24) (0.68) (1.05) Population squared 3.13 -0.75 0.60 (2.77) (0.57) (0.88) Gini inequality index of Land ownership -1.02 0.60* 0.08 (1.65) (0.36) (0.58) Gini income inequality index -4.71 3.75** -0.76 (8.56) (1.89) (2.85) Mill’s ratio -0.89*** 0.01 0.12 (0.29) (0 .07) (0.10) F-test for the exclusion restrictions in the first stage selection equation
99.8 100.8 95.7
Observations 5,353 5,519 5,519

Panel B: The role of Signoria
I Non-profit
organizations
II Organ donation
organization
III Cheating in
math Commune 1.48*** 0.36*** -0.19**
(0.32) (0.07) (0.08) Signoria 1.21*** 0.14** 0.01 (0.31) (0.07) (0.11) Elevation 2.16*** -0.26*** 0.79 (0.59) (0.07) (0.49) Max difference in elevation within city territory 1.11*** 0.03 0.14 (0.24) (0.03) (0.17) City is on the coast 0.21 0.06 -0.07 (0.25) (0.06) (0.13) City is more than 5km from the coast 1.01 0.06 -0.12 (0.63) (0.07) (0.21) Population (million people) -6.25*** 1.53*** -2.97*** (2.25) (0.46) (0.70) Population squared 2.54 -1.23*** 2.72*** (1.65) (0.34) (0.61) Gini inequality index of land ownership -0.21 0.17* -0.18 (0.47) (0.09) (0.59) Gini income inequality index 10.31*** 2.37*** -9.92*** (1.96) (0.41) (2.87) Observations 5,344 5,538 1,911 R-squared 0.09 0.54 0.02

Panel C: The role of the Lombard League
I Non-profit
organizations
II Organ donation
organization
III Cheating in math
Neutral city 1.62*** 0.39*** -0.41** (0.41) (0.08) (0.18) Part of the Lombard League 2.48*** 0.50*** -0.10 (0.33) (0.06) (0.16) Allied to Emperor Fredrick I 1.11** 0.27** -0.09 (0.49) (0.12) (0.17) Elevation 2.04*** -0.26*** 0.99** (0.47) (0.07) (0.45) Max difference in elevation within city territory 1.47*** 0.04 0.21 (0.22) (0.03) (0.15) City is on the coast 0.29 0.04 -0.08 (0.24) (0.06) (0.13) City is more than 5 km from the coast 1.10* 0.05 -0.16 (0.63) (0.07) (0.21) Population (million people) -3.57* 1.76*** -2.95*** (1.93) (0.40) (0.92) Population squared 0.87 -1.37*** 2.61*** (1.42) (0.30) (0.73) Gini inequality index of land ownership 0.74 0.20** -0.05 (0.47) (0.09) (0.47) Gini income inequality index 7.81*** 2.09*** -9.78*** (1.91) (0.38) (2.73) Observations 5,360 5,538 1,912 R-squared 0.09 0.55 0.02

Table A4: First stage of IV regressions
The table shows the first stage of the IV estimates in Table 6, Panel C. The dependent variable in each of the three
columns is the indicator of free-city state. The instrument – ease of coordination – is a dummy equal to 1 if the city was a
bishop city at the time of the communes. Regressions are run on the sample of all cities located in the Center-North.
Robust standard errors are reported in parentheses. Since the sample for the three measures of civic capital is slightly
different, column I reports the first stage for the non-profit organization sample, column II for the organ donation
organization sample, and column III for the cheating in math sample. Robust standard errors are reported in parentheses.
*** significant at less than 1%; ** significant at 5%; * significant at 10%.
I
Free city state II
Free city state III
Free city state
Ease of coordination 0.38*** 0.39*** 0.39*** (0.047) (0.047) (0.046) Elevation -0.12* -0.13* -0.25** (0.073) (0.072) (0.105) Max difference in elevation
0.02 0.02 0.02
(0.034) (0.033) (0.043) City is on the coast -0.23*** -0.23*** -0.26*** (0.064) (0.064) (0.068) City more than 5km from the coast
-0.04** -0.04** -0.05**
(0.018) (0.018) (0.023) Current Population 1.91*** 1.92*** 1.90*** (0.272) (0.276) (0.265) Current Population squared
-1.22*** -1.23*** -1.24***
(0.200) (0.203) (0.193) Gini inequality index of land own.
-0.20** -0.18** -0.22**
(0.084) (0.083) (0.110) Gini income inequality index
0.96*** 0.97*** 1.38***
(0.288) (0.284) (0.407) Observations 5,357 5,535 1,911

Table A5. Distribution of self-efficacy scores in the individuals sample
The sample shows the distribution of the self-efficacy score in the sample of 275,186 students that answered
the attributional style questionnaire in the 2008-2009 survey, for the questions over domain of success and
failure respectively.
Success domain Frequency Percent Cumulative
0 12,157 4.42 4.42 1 38,487 13.99 18.40 2 73,156 26.58 44.99 3 70,382 25.58 70.56 4 50,662 18.41 88.97 5 30,342 11.03 100.00 Total 275,186 100.00
Failure domain Frequency Percent Cumulative 0 122,463 44.50 44.50 1 89,152 32.40 76.90 2 46,803 17.01 93.91 3 16,768 6.09 100.00 Total 275,186 100.00

References
Ancitel. “Le Misure dei Comuni.” 2003-04 edition. http://www.ancitel.it/miscom/misure.cfm, Web
19 May 2014.
Bairoch, Paul, Jean Batou, and Pierre Chevre. The Population of European Cities from 800 to 1850.
Geneva: Centre of International Economic History, Geneva University, 1988: 40-49.
De Agostini, Nuovo Atlante Storico. Novara: Istituto Geografico De Agostini, 2007: 61-62.
Diocesi italiane. Link non può attivo. Nuovo link: https://it.wikipedia.org/wiki/Diocesi_italiane (3 Settembre 2015) http://it.wikipedia.org/wiki/Elenco_delle_diocesi_italiane, Web 19 May 2014.
Guide Rosse d’Italia, Regioni Italiane. Milano: Touring Club Italiano, 2000.
INVALSI. “La Prova Nazionale al Termine del Primo Ciclo, A.S. 2008-09.”
http://www.invalsi.it/esamidistato0809/ , Web 19 May 2014.
ISTAT. “14° Censimento Generale della Popolazione delle Abitazioni (2001 National Census).”
http://dawinci.istat.it/MD/ , Web 21 May 2014.
Ministero del Lavoro. Registri delle Associazioni Provinciali. Roma, 2005.
Touring Club Italiano, Atlante Storico. Milano: Touring Club Italiano, 1994.

Treccani, Atlante Storico. Roma: Istituto della Enciclopedia italiana, 2007.
Treccani, Enciclopedie. Roma: Istituto della Enciclopedia italiana, 1949.