onion creek watershed large woody debris recruitment · onion creekla@e woody debris recruihnent...
TRANSCRIPT
126 TFW-MAGI-00-001
TFW Effectiveness Monitoring Report
ONION CREEK WATERSHEDLARGE WOODY DEBRIS RECRUITMENT
by:
Rick SchumakerStevens County Conservation District
Domoni GlassBoise Cascade Corporation
December 9, 1999
Prepared forthe TimberiE‘is~ldlife Monitoring Advisory Group and the Northwest Indian Fisheries Commission.
This project was partially fimded bythe Washington Department ofEcology through the Centennial Clean Water Fund
and Boise Cascade Corporation.
Onion Creek Watershed Large Woody Debris Recruihnent Effectiveness - Final Report
Abstract
A riparian survey was conducted in the Onion Creek Watershed, in Stevens County,Washington, to obtain baseline data and establish permanent plots that can be used totrack future rates of large woody debris recruitment during “normal” years and episodicevents.
A total of twelve permanent plots were established during summer of 1998 at three sitescorresponding to mixed conifer, western redcedar, and mature western redcedar stands.Plots were 30 meters long and 50 meters wide centered on the creek. All three streamswere small, (Type 3) with bankfull widths ranging from 2 to 3 meters. Average streamgradients ranged from 8% to 20%, and average site hillslopes ranged Tom 26% to 44%.
Standing wood, down wood, and instream wood were measured at each plot. Over 1250standing trees and instream wood were marked with aluminum tags for tirture reference.Various information such as tree height, dbh, species, condition, and lean azimuth wasrecorded for standing trees. The size of down wood (pieces and trees with rootwads) wasalso recorded, along with the location and fall direction of trees. Instream wood wascharacterized and counted as well.
Overall, trees were predominantly western redcedar (60%) Grand fir, and westernhemlock (fir and hemlock together making up 24%). Average stand densities rangedfrom 825 to 1055 stems/ha. The majority of the trees were small ((30cm dbh), with thegreatest number of large trees in the mature redcedar stand. On average, the tallest treeswere also located in the mature redcedar stand. Eight to 12% of the trees at a stand wereeither stressed or snags. Twelve to 20% of the trees in a stand were leaning, with 2%more leaning toward the creek than away. Trees were generally well distributedthroughout the plots. The western redcedar stand had the most trees close to the creek;the mature redcedar had the most trees farther up the hillslope.
The most common species of down wood was western redcedar. There were about twiceas many down pieces of wood than down trees with rootwads. The mixed conifer standhad the most down wood. Most ofthe down wood was small (<30 cm) in diameter andbetween 5 and 15 meters long. The down trees with rootwads were more decayed thanthe individual pieces. Most of the trees that fell originated away corn the creek, between10 and 20 meters slope distance. Of the down wood, 11% was recruited to bankfidl, 7%was spanning, and 20% was suspended over the stream channels (however, much of thissuspended wood was found in just two of the twelve plots).
Most instream wood was very small (<20 cm diameter). Accounting for all wood in thechannel (bankfirll, spanning, or suspended), recruitment was 1 piece/bankfull width.Most of these pieces were < 5 meters long. Almost all of the wood mnctioning to formpools was small or medium sized; most was small. The mixed conifer stand had the mostwood recruited to the bankfull channel (1.1 pieceslbanktidl width), and the redcedarstands had less than halfthat amount (0.30-0.45 piecesJbankfbl1 width). No debris jamswere found in the study plots.
ii

TABLE OF CONTENTS
I. INTRODUCTION.. ........................................................................................................... 1
LA. Problem Statement .................................................................................................. 1LB. Backgrwnd.. ........................................................................................................... 1I.C. Characterization of the Onion Creek Watershed ...................................................... .
II. PROJECT DESCRIPTION.. ........................................................................................... 5B.A. Goal and Objectives............................................................................................... 5ILB. Monitoring Questions ........................................................................................... .6
III. STUDY DESIGN,, ......................................................................................................... .7III. A. Introduction., ....................................................................................................... .7Ill.B. Site Location.. ..................................................................................................... .7IILC. Site Selection.. ...................................................................................................... .1II.D. Stream Information .............................................................................................. 8IKE. Plot Location.. ..................................................................................................... .8IlLF. Plot Establishment ................................................................................................ .1II.G. Methods.. ........................................................................................................... 10
llI.G.1. &w&g Trees .................................................................................... 10IlI.G.2. Down Wood ...................................................................................... 1 1III.G.3. Insfream Wood.. ................................................................................. . l lIII.G.4. Quality Assurance.. ............................................................................. 1 1
IV. SURVEY RESULTS.. .................................................................................................. .12N.A. Standing Trees ................................................................................................... 12
N.A.1. Density ............................................................................................... 12IV.A.2. Species Compostion.. .......................................................................... 14N.A.3. Tree Size ............................................................................................. 17N.A.4. Condition .......................................................................................... .19N.A.5. Tree Height.. ...................................................................................... 21N.A.6. Leaning Trees,, ................................................................................... 23N.A.7. Distance from Stream ......................................................................... 25
N.B. Down Wood...................................................................................................... .26N.B. 1. Den@. .............................................................................................. 26N.B.2. Species Composition ........................................................................... 26N.B.3. Tree Size.. ........................................................................................... 28N.B.4. Length ................................................................................................ 29N.B.5 Decay Class ....................................................................................... .29IV.B.6. Distance from Stream ........................................................................ .30IV.B.7 Direction of Tree Fall ......................................................................... 30N.B.8. Recruitment.. ...................................................................................... 3 1
N.C. Ins&am Wood .................................................................................................. 32N.C. 1. Diameier & Density.. .......................................................................... 3 2N.C.2. Length ................................................................................................ 32N.C.3. Functioning Wood .............................................................................. 33N.C.4. Volume of Wood Recruited to Bankfull Channel.. ................................ 34N.C.5. Debris Jams ........................................................................................ 34
m

V. CHANGES IN RIPARIAN STANDS AFTER ONE YEAR. ........................................3 5
V.A. Standing Trees.. ...................................................................................................35V.B. Recruited Wood.. .................................................................................................36
VI. DISCUSSION ...............................................................................................................37
VII. REFERENCES ..........................................................................................................,39
iv

Onion Creek La@e Woody Debris Recruihnent Effectiveness - Final Report
I. Introduction
I.A. Problem Statement
The capability to identify the density and size of trees needed in riparian areas to assuresufficient long-term recruitment of wood into stream channels is extremely important fordeveloping riparian management objectives that are adequate to protect fish habitat.Currently, knowledge about all the recruitment mechanisms is incomplete. There is somelimited information available on the loss of trees resulting from outbreaks of disease andpestilence. The Forest Service is currently gathering information on wood recruitmentassociated with the 1994 tires in Idaho. However, information on recruitment due tostorm events is virtually non-existent. This monitoring program provides an opportunityto refine the understanding of wood recruitment processes.
LB. Backaround
Wood is recruited to streams through a variety of mechanisms. One mechanism isthrough suppression, where smaller trees lose the battle with larger trees for nutrients andlight. These trees die and typically fall. If they are close enough to a stream, they mayrecruit to the stream. This mechanism however, is unlikely to recruit large diameterwood to streams but may recruit sufficient wood to channels where small pieces arefunctional. Larger trees that grow old and die typically remain standing and decay inplace, providing valuable wildlife habitat but little wood in streams. Recruitment oflarger wood to streams is more likely to occur as a result of catastrophic events such astire, wind storm, flood, ice storms, and outbreaks of pestilence or disease. Hence,recruitment of larger wood is expected to be an episodic process, much like masswasting, occurring primarily during extreme or unusual events.
The ability to evaluate the adequacy of various riparian management strategies would begreatly enhanced if the rate at which these various recruitment mechanisms occurred wasknown. Many have proposed to evaluate the effectiveness of management strategies bymonitoring before and after treatment situations or paired situations to comparerecruitment rates. Due to the great deal of variability that the episodic nature ofrecruitment imparts to wood recruitment, before and after treatment situations arevirtually impossible to control and require many years of before and after treatment datato adequately account for that variability. Paired studies have a greater probability ofsuccess since sites can be selected to assure identical weather conditions, Nevertheless, itwill take decades of monitoring to characterize long term differences between treatments,during which time stand conditions will change dramatically, adding anothercomplicating factor to the study which is difftcult to control.
An alternate approach is to try to capture the recruitment rates out of various stand typesand densities during “normal” years and episodic events. This information could then beused in conjunction with growth and yield models and probability of direction of fallapproaches to estimate or model the total recruitment of wood over time to streams under
1

Onion Creek Large Woody Debris Recruitment Effectiveness-Final Report
various management approaches. Such an approach has the potential to help us arrive atanswers regarding the adequacy of riparian management strategies much more quicklythan a long-term monitoring program. Of course, a decade of uneventhd years willhinder attempts to attain needed information in a timely fashion. Smaller magnitudeevents may, however, provide some insight regarding recruitment in huger events,
I.C. Characterization of the Onion Creek Watershed
In 1997, a Watershed Analysis was conducted in the Onion Creek WAU which providedan assessment of watershed conditions and established prescriptions for forest practiceson state and private land (Raines et al., 1997).
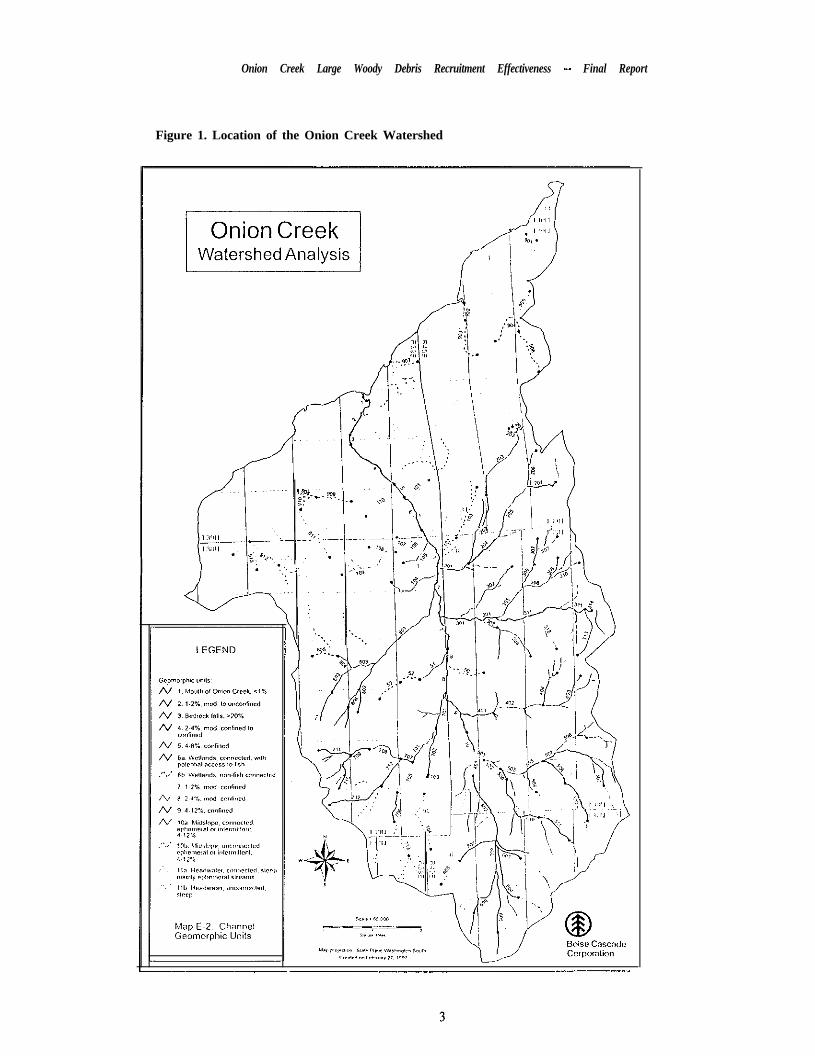
The Onion Creek watershed is in many ways typical of northeast Washington. The basinlies within the range of the continental glaciers and drains into Lake Roosevelt on theColumbia River (Figure 1). Average annual precipitation is approximately 25 inches,most of which falls as snow. Peak runoff occurs during the spring snowmelt period. Thetopography of the basin is gently rolling with few steep slopes, however a 90 footwaterfall is present near the mouth of the creek, separating most of the basin’s fishpopulations from Lake Roosevelt.
The dominant fish species in the basin is brook trout. Cutthroat are also present inportions of the basin. Bull trout, which reside in Lake Roosevelt, make limited use ofthe lower portion of the creek for spawning. That portion of the stream, however, hasbeen highly modified; little good quality habitat is available.
The basin geology is dominated by highly weathered glaciated granitics. There areexposures of slate and other sedimentary rock formations intermingled with the graniticsas a result of folding and erosion which surfaced the layers of rock laid down when thearea was still oceanic. The area is near the southern terminus of the continental glaciers,hence, pockets of unconsolidated glacial deposits are scattered across the basin.
The area near the mouth of the stream was covered for a time by the old glacial LakeColumbia. In this area, there are extremely deep deposits of unconsolidated material,Water in this portion of the basin tends to go subsurface and several streams disappearaltogether in this material. The water in these streams is presumed to enter LakeRoosevelt below the water line. Although Onion Creek drains approximately 37,000acres, the summer low flow at the mouth is only 4 cubic feet per second. The stream ispresumed to lose some amount of flow as it passes through the lake deposits althoughmeasurements taken in the basin during the Watershed Analysis did not identify anysignificant flow reduction in this area.
Many of the headwater streams in the basin also are dry most of the year. Theseheadwater areas flow primarily during snowmelt and are dry once the snow is gone. Inwinter they are dry or frozen,
2
Onion Creek Large Woody Debris Recruitment Effectiveness - Final Report
Figure 1. Location of the Onion Creek Watershed

Onion Creek Large Woody Debris Recruitment Effectiveness - FinalReporl
Landslides are rare in the basin, occurring primarily in the glacial lake deposits onoversteep slopes. There have been no debris slides identified in the period of photorecord, therefore, debris slides are not a significant recruitment mechanism. There havebeen at least two blowouts of mine tailings since 1960 that had significant effects onchannel condition.
As the previous discussion might suggest, stream power in the basin is relatively low.Very small wood (< 20 cm dbh) functions well in many of the tributaries and branch sizepieces function in the headwaters.
The dominant vegetation type in the basin is ponderosa pine. Stands of fir and Douglasfir are also present in some areas and mature cedar is found along portions of the lowermainstem. The upper portion of the basin is managed as commercial forest. The lowerportion of the basin is in primarily large lot rural residential development. There is asmall area of agricultural use near the mouth of the stream. Such multi-use basins arecommon in this portion of the state.
Most of the riparian areas in the Onion Creek basin can be characterized as part of theWestern Hemlock/Cedar vegetation zone (Henderson et al 1989, 1992). Westernredceda.r/queen cup beadlily (THPLKLUN) and cedarfladyfem (THPL/ATFI) ascharacterized in Williams et al. (1995) are typical of the moist riparian sites along themainstem Onion Creek. In addition to redcedar, these areas also contain western larchand Douglas fir with pockets of grand fir and Engelmann spruce. Paper birch, quakingaspen, and black cottonwood are also peppered throughout the mixed redcedar standsalong the mainstem.
Western redcedar is also common along the major tributary drainages where soils arewet. Hemlock plant associations mostly occur on slopes adjacent to confined channelswhere drainage is good. In the upper Onion Creek sub-basin and the Van Stone Minesub-basin, western larch and lodgepole pine are common in the riparian area.
The width of the riparian area from which trees can be recruited to the channel is widerthan the true riparian vegetation zone; hence much of the potential recruitment is fromstands best characterized as upland forest, Along the smaller tributaries, the width of thetrue riparian vegetation zone is very narrow and upland species are the primary speciesavailable for recruitment.
4

Onion Creek Large Woody Debris Recruitment Efftiveness - Final Report
II. Project Description
In 1998, a monitoring project was initiated in the Onion Creek Watershed to helpdetermine LWD recruitment rates during normal periods and episodic events. In the firstphase of the project, which is described in this report, an inventory of existing riparianstands and instream wood was conducted to provide baseline data for tracking tbturechanges. Funds provided by the TFW Monitoring Advisory Group, Northwest IndianFisheries Commission (NWIFC), and Boise Cascade Corporation were utilized forestablishing the plots and conducting the initial survey.
Boise Cascade Corporation will strive to find additional tinding sources to continue themonitoring annually and following major disturbance events for a period of at least fiveyears. At a minimum, the permanent plots will be revisited at least once during the fiveyear review of the watershed analysis. The ability to capture episodic information will becontingent on the occurrence of such events. If no such events occur during the period ofmonitoring, there will be an opportunity to get improved information on recruitmentduring “normal” years as a function of stand type, slope, and density.
ILA. Goal and Objectives
The Onion Creek effectiveness monitoring project is designed to address the followinggeneral goal and objectives (Smith and Schuett-Hames, 1998) as well as project specificobjectives.
General Goal
To support adaptive management by evaluating the eflectiveness of individualriparian forest practices and restoration measures in providing adequate levelsof LWD and associatedfunctions on a site scale.
General Objectives
To improve interpretation of monitoring results by collecting regional data ontree growth, tree mortaliq, and L WD recruitment processes in riparian stanak,and on the persistence, routing, andfunction of LWD in stream channels.
Spec$c Project Objectives
l To establish permanent plots and collect baseline data that can be used to track futurechanges in LWD recruitment in order to:
1 . refine our understanding of wood recruitment for use in growth and yield modelsand probability of fall approaches used to estimate the recruitment over time,
2. capture recruitment rates during normal years and episodic events as a function ofstand type, slope, and density, and
5

Onion Creek Large Woody Debris Recruihent Effectiveness - Final Report
3. address persistence of recruited wood in streams and the portion of woodrecruitment that functions to form pools.
ILB. Monitoring Ouestions
1. Characterizur~o~: What are the current characteristics of riparian stands and levels ofLWD?
2. Tree fuZ1 rates: What is the rate of tree fall during “normal” periods as a function ofslope, stand type, and density? What is the rate of tree fall during various types ofstorm events (assuming they occur)?
3. Fall direction: What is the distribution of tree fall direction? Is the distributiondifferent for trees rooted in the bank than for trees t%ther from the stream? Howdoes slope affect the distribution? How does the lean of a tree factor into thedirection of fall?
4 . Functionality of recruited wood: How do wood and stream size affect t%mtionality?
This report summarizes the work completed in 1998 to establish riparian monitoring plotsin the Onion Creek Watershed. The results of this work and the contents of this reportcharacterize current stand conditions. Follow-up monitoring is needed before otherquestions can be answered.

Onion Creek Watershed Large Woo@ Debris Recruihnent Effectiveness -Final Report
III. Study Design
IILA. Introduction
The study design was based on riparian stand survey methods developed to monitor theeffectiveness of riparian forest practices on a site scale as part of the TFW EffectivenessMonitoring and Evaluation Program (Smith, 1998). These methods were used tocharacterize timber stands and the current Ievel of LWD recruitment.
IILB. Site Location
The Onion Creek Watershed is located in Stevens County in northeastern Washington,near the town ofNorthport (Figure 1). The Onion Creek Watershed (WAU 610105) is inWater Resource Inventory Area (WRIA) 61.
Study sites were located along stream segments that were assigned segment numbersduring the Onion Creek Watershed Analysis (Raines, et al. 1997). The study sites,identified by stream segment numbers, can be located using the information providedbelow.
Table 1. Location of study sites in the Onion Cm& Watershed
6 1 0 1 0 5 m i x e d c o n i f e r6101OS western redcedar610105 mature western
redcedar
602 Gillette Mtn. T. 37 N., R 40 E. S.5,NE%ofSW%512 Onion Creek T. 38 N., R 40 E. s. 34, SW % of SW %511 Giiette Mtn. T. 37 N., R. 40 E. S. 4, SE % of NE %
IILC. Site Selection
All study sites were located on Boise Cascade property to ensure adequate plot protectionand long-term accessibility for monitoring purposes. Sites were selected on Type 3streams in areas containing mixed conifer, western redcedar, and mature westernredcedar stands. The mature redcedar stand was known to contain older and larger treesthan the redcedar stand. A western larch/Douglas-fir stand was also selected, it butcould not be surveyed because of safety concerns.
A Boise Cascade forester utilized existing information about stand types, hillslopes,channel confinement, stand density, tree size, and local knowledge about access to selectstudy sites. Limiting site selection to Type 3 streams on Boise Cascade property greatlyreduced the pool of potential sites. Sites were selected to contain a range of hillslopegradients and stand densities to the extent possible; however, most of Boise’s property isin the upper portion of the watershed, and streams there are generally small, steep, andconfined.
7

Onion Creek Watershed Large Woody Debris Recruitment EIfttveness -Final Report
IIID. Stream Information
Stream Segment 602 was in the upper reach of Onion Creek, and Segments 5 12 and 5 11were tributaries to Onion Creek. These creeks were relatively small. Stream Segment602 was the largest with an average bankfull width of almost 3 meters. The average flowin this segment was 4 cubic feet per second (cfs) in 1998, ranging from a high of 14 cfsand a low of 0.4 cfs. Segments 512 and 511 were smaller than segment 602; the averagebankfill width was 2 meters at each. Plow measurements are not available for these twosegments.
As characterized in the Onion Creek Watershed Analysis (Raines et al., 1997), theredcedar sites were located in stream segments characterized by relatively steep slopes(8-20%) and the mixed conifer stand had moderately steep slopes (4-S%). All threestream segments had confined channels. The average stream gradient was least inSegment 602 (8%) and greatest in Segment 5 11 (20%).
Table 2. Stream gradient and bankfull width at riparian plots in the Onion Creek Watersbed
P l o t stream Bankfull P l o t s t r e a m Bankfull P l o t S t r e a m BankhA# Gradient Width # Gradient Width # Gradient Width
(W No 6) Cm) (W Cm)
2 10 3.2 2 21 2.1 0 12 1.66 5 2.8 6 10 1.5 1 16 1.910 9 2.7 10 12 2.2 5 21 2.413 8 2.8 13 1 3 2.1 9 24 2.0
Avg. 8 2.9 AVR 14 2.0 AVR 20 2.0
IIIE. Plot Location
Thirty meter horizontal transects were marked following the direction of thestream in each stream segment. One ofthe first four upstream transects wasselected randomly for survey, with subsequent transects selected every fourthtransect after that. Plots were established at the mixed conifer site first,followed by the western redcedar and mature redcedar sites, respectively.
According to the original study design, four sites (or segments) were to besurveyed; however, the fourth site could not be surveyed for safety reasons.One plot was added to each of the existing segments after three plots had alreadybeen surveyed. Plots were not all equidistant within a segment for acombination of reasons, including the modification from four sites to three.
8

Onion Creek Watershed Large Woody Debris Recruitment EffecIiveness -Final Report
Particular information about plot locations within each segment is provided below:
Segment 602 - An existing forest road was located in the upper portion of the site. A30 meter unnumbered buffer was placed on each side of the road.
Segmenf 512 -The distance available for plot establishment was limited by a forestroad upstream of the first plot (a 60 meter buffer was used to avoid the road) and aproperty line at the downstream end of the site.
Segment 511- Plot establishment was complicated by the presence of a forest roadand harvested area upstream and flagging for road construction near the middle ofthe site. A 160 meter buffer was created to allow for future road constructionwithout interference with plots.
1II.F. Plot Establishment
Plot boundary lines were established 25 meters perpendicular to transect lines onboth sides of the stream. Resulting plots were 30 meters long and approximately50 meters wide. Facing downstream, 30 x 25 meter right bank (RB) and leftbank &B) subplots were also delineated within each plot. The length of plotboundary lines varied slightly due to variations in hillslope, so the plot areas alsodiffer somewhat. Hillslopes were calculated using a weighted average of slopesfor each slope-break, with the floodplain excluded from calculations if thegradient of the first slope-break was <lo%.
Table 3. Descriptive information for ripatian plots in the Onion Creek Watershed
602 2 30 R BL B
602 6 240 RBL B
602 1 0 360 RBL B
602 1 3 450 R BL B
512 2 30 R BL B
512 6 150 R BL B
512 1 0 270 R B
36 W-NW 75854 E-SE 72027 W 73834 E 75231 W 74655 E 74427 W 75647 E 75331 W 72342 E 744
9 W-SW 75229 E-NE 75233 S W 734
L B 30 NE 782*Distance from the upstream segment boundaq to the up.slmm plot boundaries
9

Onion Creek Watershed Large Woody Debris Recruihnent Efectiveness - Final Report
Table 3. Continued
512 13 360 RB 11LB 2 3
511 0 0 Pa 4 1LB 4 6
511 1 3 0 RB 4 6LB 5 2
511 5 3 1 0 RB 2 9LB 4 3
511 9 4 3 0 RB 41
W-SW 7 4 9E-NE 7 4 9S W 7 3 4NE 752S W 741NE 749S W 761NE 756
S-SW 729LB 5 3 N-NE 755
*Distance from the upstream segment boundq to the upstream plot boundaries
The outside corners of each plot were permanently marked with rebar, and witness treeswere marked at each plot. Witness tree information is provided in the database providedto NWIFC.
IILG. Methods
The following sections provide a brief description of monitoring methods used in thisstudy. Detailed study methods can be found in the project monitoring plan (Schumakeret al., 1998).
In each plot, survey information was collected for all standing trees 210 cm dbhand snags (210 cm dbh, X! m tall, and standing 245” from the ground). Surveyinformation included tree height, dbh, tree species, distance from the creek,condition, lean angle, and lean azimuth.
Over 1250 standing trees were tagged during the survey using aluminum tagsnailed below chainsaw height on the side of the tree facing the stream. Usingthe hundredths place on the tag number, even numbered tags were used on theright bank subplots, and odd numbered tags were used on the left bank subplots;for example, #459 and #1473 are on a right bank; #329 and #1328 are on a IeRbank.
10

Onion Creek Watershed Large Woody Debris Recruitment Effecttveness -Final Report
III.G.2. Down Wood
Two categories of down wood (<45’ from the ground) were surveyed: trees withattached rootwads and individual broken pieces. Down trees with attachedrootwads were included if more than 50% of the rootwad was in the plot, thelength from the base of the tree to the top was at least 2 m, and its dbh was atleast 10 cm. Individual broken pieces of trees were included if the midpoint ofthe piece was in the plot, the length of the piece was at least 2 m, and thediameter at the midpoint was at least 10 cm. When down trees or pieces reachedor spanned the stream channel, Large Woody Debris (LWD) information wasalso collected and cross referenced by tree number. Survey informationincluded decay class, diameter at the midpoint of pieces and base of trees, treespecies, and recruitment to the bar&M channel.
III.G.3. Znstreum Wood
All pieces ofwood in the stream greater than 2 m long and 10 cm diameter, measured atthe middle of the piece, were inventoried (Schuett-Hames et al., 1994). Those pieces thatextend up onto the bank of the stream were noted in the downed wood survey and also inthe instream wood counts.
III.G.4. Qua&v Assurance
To ensure collection of consistently high quality field measurements, field crews weresubject to unannounced inspections. An inspector was provided by Boise CascadeCorporation. The inspector periodically checked measurements taken by field crews andcompared them to his/hers as a measure of accuracy. Field crews also periodically tookduplicate measurements to document their precision. Data were within the followingtolerances for average accuracy and precision:
Table 4. Quality of data collected during the survey in the Onion Creek Watershed
Tree height 5% of heightAzimuth 20d b h 2cmLt?ngur 0.3 InTree species <5% errorSlOpt?S 5 %
The target guideline values are based on tolerances used in DNR’s Forest ResourceInventory System (Washington State DNR, 1996) and recommendations from NWIFCand Boise Cascade Corporation. These values are believed to be adequate to meet theobjectives of this study.
1 1
Onion Creek Watershed Large Woo& Debris Recruitment Effectiveness - Final Report
IV. Survey Results
This portion of the report summarizes site characterization information for standing,down, and instream wood. Results from the survey of standing wood are presented bystream segment/stand type, and characterization information is provided for each subplot.Subplots are not characterized individually for down wood and instream wood; instead,histograms are used to characterize results from all plots combined.
1V.A. Standine Trees
The following section summarizes the density, species composition, size,condition, height, lean, and distance from the stream information for standingtrees in the Onion Creek riparian plots.
1V.A. 1, Den&v
The density of standing trees (live trees and snags) ranged t?om 300 stems/ha toalmost 1400 stems/ha within a subplot. Densities of 600 to 1000 stems/ha weremost common. The western redcedar stand had the greatest density, and themature redcedar stand had the lowest density.
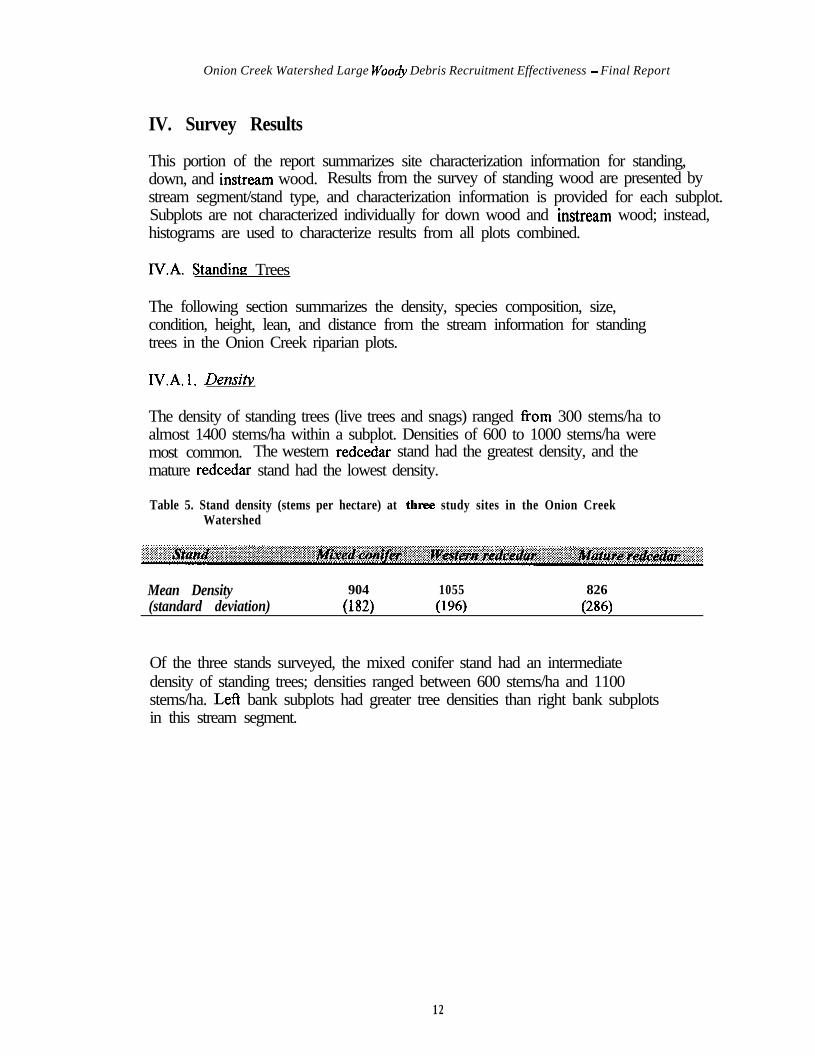
Table 5. Stand density (stems per hectare) at three study sites in the Onion CreekWatershed
Mean Density 904 1055 826(standard deviation) (182) (196) (286)
Of the three stands surveyed, the mixed conifer stand had an intermediatedensity of standing trees; densities ranged between 600 stems/ha and 1100stems/ha. Left bank subplots had greater tree densities than right bank subplotsin this stream segment.
1 2

Onion Creek Watershed Large Woody Debris Recruitment Effectiveness - Final Report
Figure 2. Density of standing treea (live trees & snags) in mired conifer subplots
16001400
z 1200a loo0: 800: 600i 400
200/
The density of standing trees in the western redcedar stand ranged fiom 700sterns/ha to over 1300 stems/ha, with all but one subplot over 800 stems/ha.
Figure 3. Density of standing trees (live trees & snags) in western redcedar subplots
The mature redcedar stand had the lowest tree density. Subplot densities ranged&om 300 stems/ha to over 1200 stems/ha, with half of the subplots near or less
13
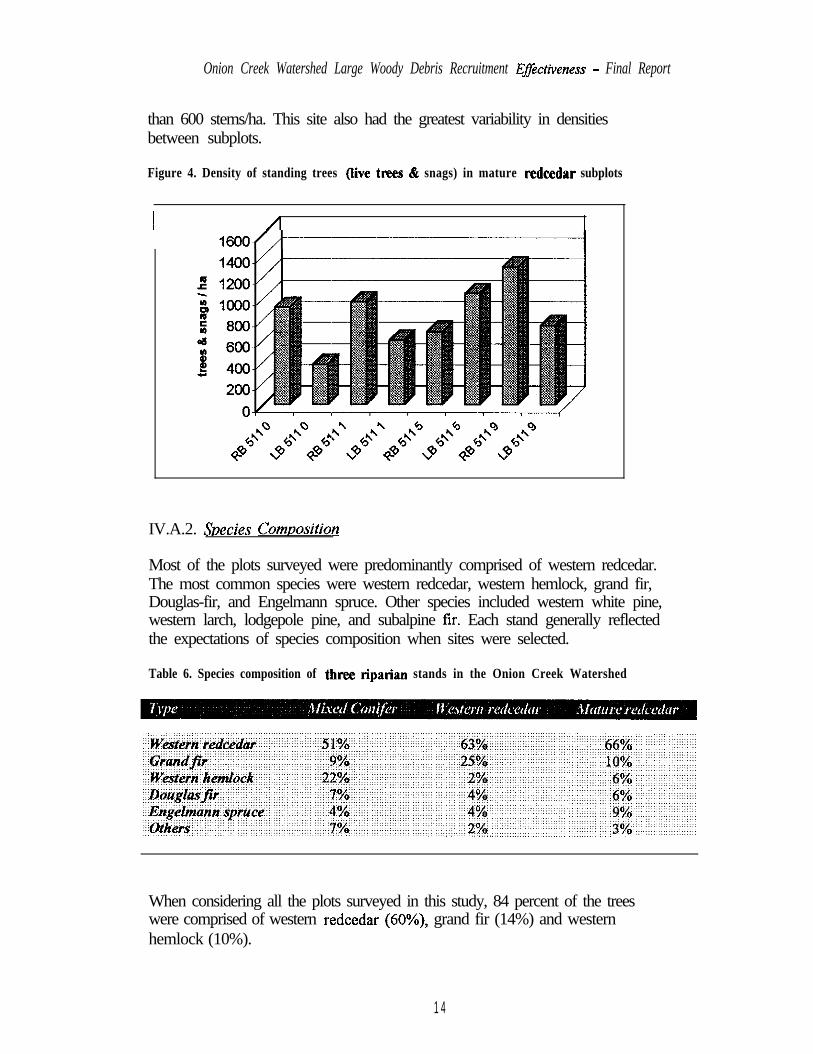
Onion Creek Watershed Large Woody Debris Recruitment E&ttveness - Final Report
than 600 stems/ha. This site also had the greatest variability in densitiesbetween subplots.
Figure 4. Density of standing trees (live trves & snags) in mature redcedar subplots
II
A I1600/~-1
IV.A.2. Svecies ComvositioB
Most of the plots surveyed were predominantly comprised of western redcedar.The most common species were western redcedar, western hemlock, grand fir,Douglas-fir, and Engelmann spruce. Other species included western white pine,western larch, lodgepole pine, and subalpine fir. Each stand generally reflectedthe expectations of species composition when sites were selected.
Table 6. Species composition of three riparian stands in the Onion Creek Watershed
When considering all the plots surveyed in this study, 84 percent of the treeswere comprised of western redcedar (60%), grand fir (14%) and westernhemlock (10%).
1 4

Figure 5. Speciea composition of all trees surveyed in the Onion Creek Watershed
OUlWW&m h e m l o c k 4 %
Plots in the mixed conifer stand, stream Segment 602, were predominantlycomprised of western redcedar and western hemlock. Over 60% of the trees inplot 2 were western redcedar. Plots 6, 10, and 13 had subplots generally having20% to 50% hemlock. The mixed conifer stand had the greatest proportion ofspecies other than redcedar compared to the western redcedar stands.
Figure 6. Species composition of mired conifer stand subplots
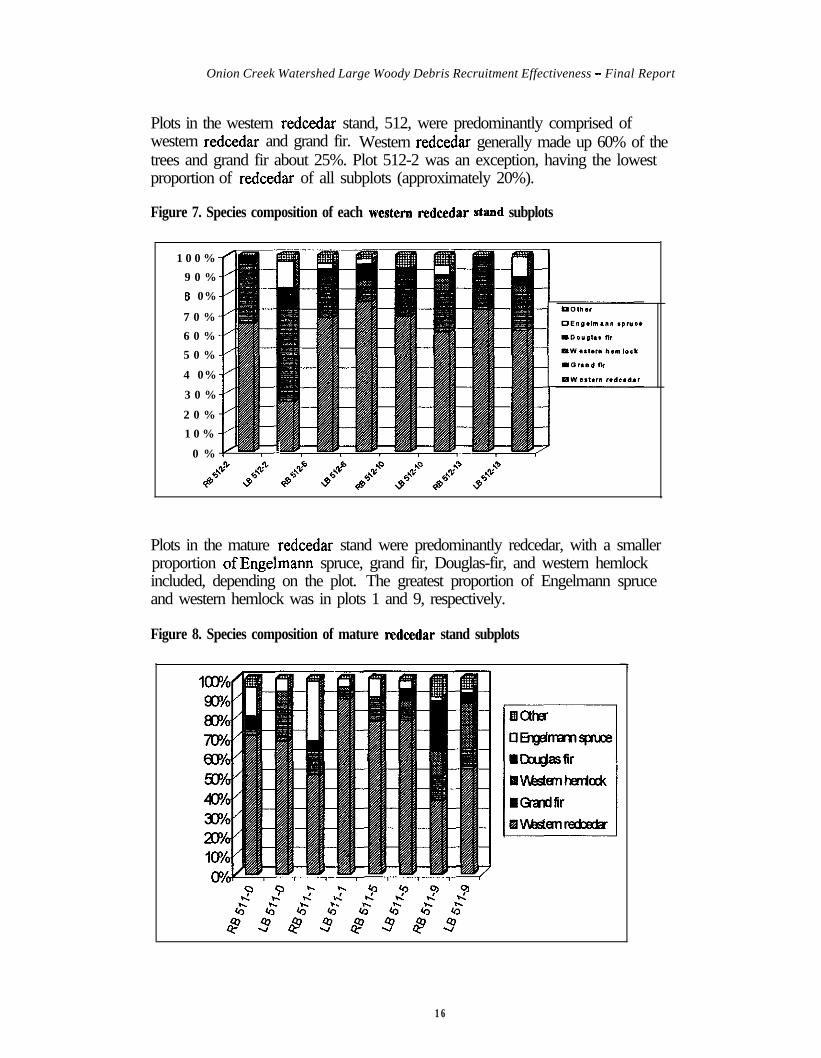
Plots in the western redcedar stand, 512, were predominantly comprised ofwestern redcedar and grand fir. Western redcedar generally made up 60% of thetrees and grand fir about 25%. Plot 5 12-2 was an exception, having the lowestproportion of redcedar of all subplots (approximately 20%).
1 5
Onion Creek Watershed Large Woody Debris Recruitment Effectiveness - Final Report
Plots in the western redcedar stand, 512, were predominantly comprised ofwestern redcedar and grand fir. Western redcedar generally made up 60% of thetrees and grand fir about 25%. Plot 512-2 was an exception, having the lowestproportion of redcedar of all subplots (approximately 20%).
Figure 7. Species composition of each western redcedar stand subplots
100%
9 0 %
6 0%
7 0 %
6 0 %
5 0 %
4 0%
3 0 %
2 0 %
10%
0 % i_
Plots in the mature redcedar stand were predominantly redcedar, with a smallerproportion ofEngelmann spruce, grand fir, Douglas-fir, and western hemlockincluded, depending on the plot. The greatest proportion of Engelmann spruceand western hemlock was in plots 1 and 9, respectively.
Figure 8. Species composition of mature redcedar stand subplots
16
Onion Creek Watershed Large Woody Debris Recruitment Effectiveness - Final Report
l.V.A.3. Tree Size fdbh)
Tree sizes are characterized below using tables and histograms to describe thesize distribution. Tree size is characterized by the following classes based ondbh: small (<30cm), medium (30-50 cm), and large 050 cm).
The greatest number of trees were small (70%) with a successively decreasingabundance as size class increases. Most trees had a dbh between 10 and 20 cmAs expected, the mature redcedar stand had the most large trees.
Table 7. Tree size, by diameter class, for each staad type The number of trees ia eachclass is given in parcatbcsca
Mixed 4 1 % 2 1 % 2 0 % 11% 4% 1 % 1 % 1 %
(221) (116) (107) (59) (24) (6) (5) (4)
5 4 % 2 5 % 1 1 % 1 %(340) (1561 (6’3) g) (8) t; ;; fiT)
4 5 % 2 2 % 1 1 %w-0) W’6) (55) $) $) $) g) fg)
70% 21% 9 %
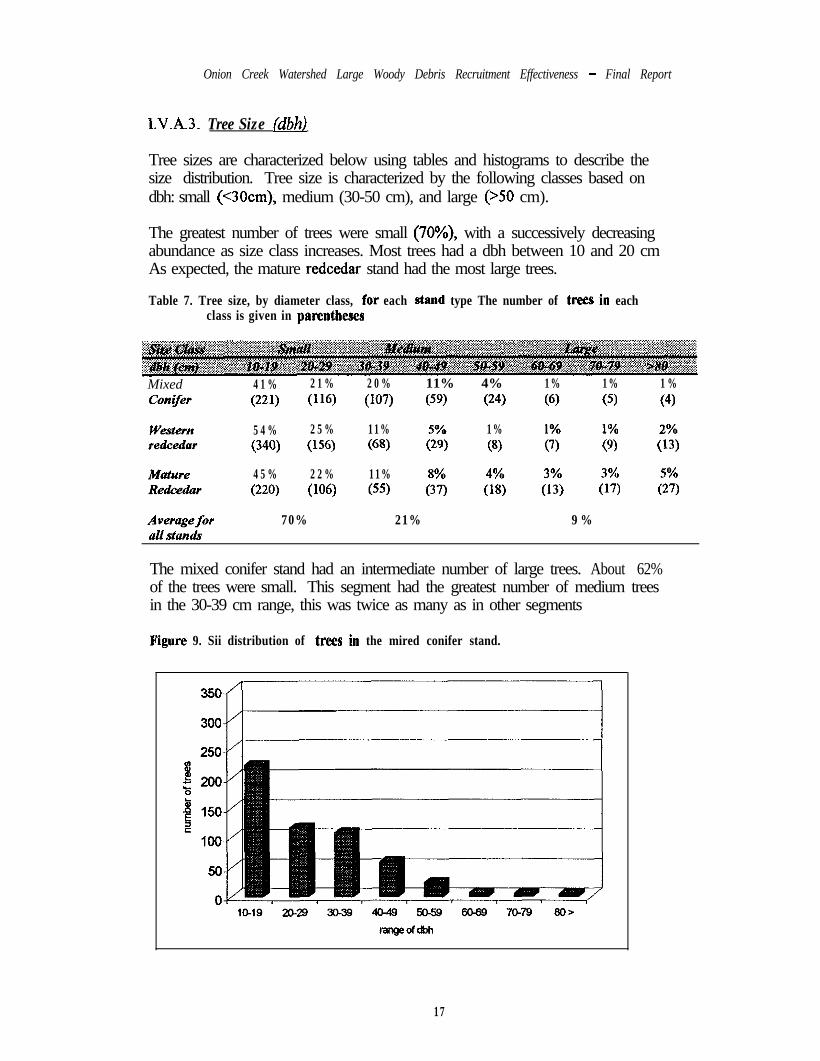
The mixed conifer stand had an intermediate number of large trees. About 62%of the trees were small. This segment had the greatest number of medium treesin the 30-39 cm range, this was twice as many as in other segments
Figure 9. Sii distribution of trees ia the mired conifer stand.
1 7

Onion Creek Watershed Large Woody DebrisRecruitment Effectiveness-Final Report
The western redcedar stand had the fewest large trees compared to othersegments. This stand had the greatest proportion of small trees (79%) and themost small trees.
Figure 10. Size distribution of trees in the western redcedar stand
The mature redcedar stand had the greatest number and proportion of large trees.The proportion of small trees at this site (67%) was similar to that of the mixedconifer stand.
Figure 11. Sii distribution of trees in the mature redcedar stand
50
0Ifs19 2029 30.39 a49 !z&% 60.69 x-79 so>
range of dth
1 8
Onion Creek Watershed Large Woody Debris Recndhmnt Effectiveness - Final Report
l.V.A.4. Condition
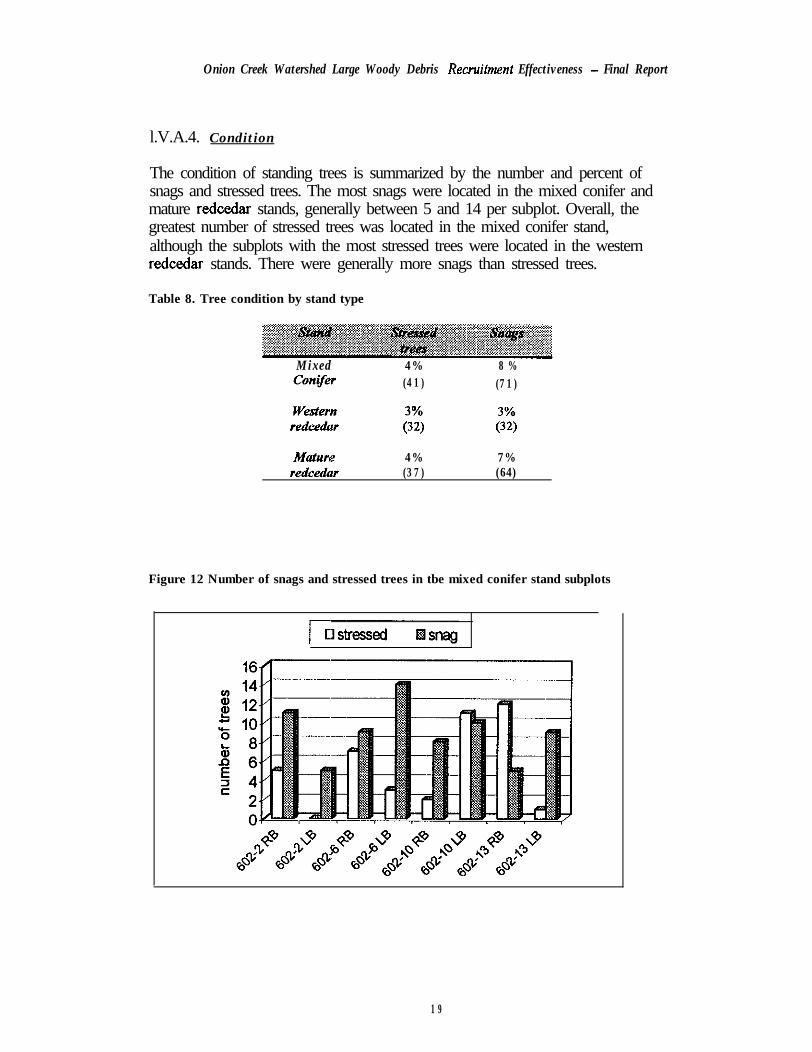
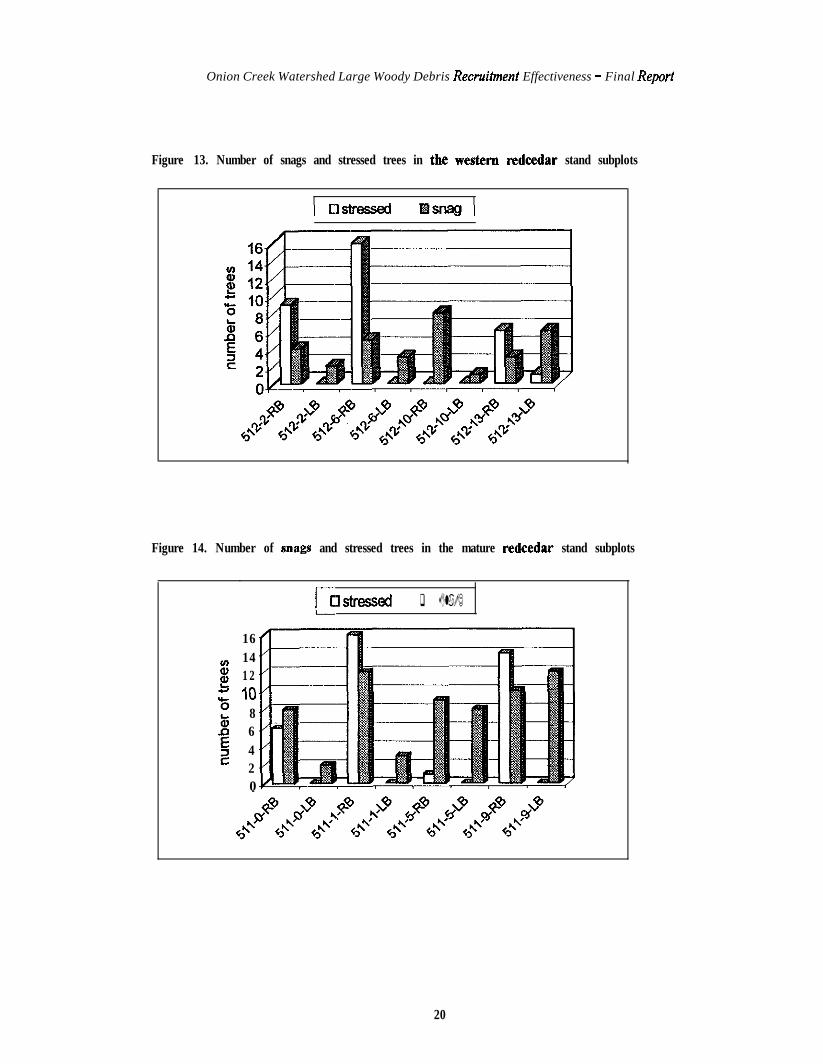
The condition of standing trees is summarized by the number and percent ofsnags and stressed trees. The most snags were located in the mixed conifer andmature redcedar stands, generally between 5 and 14 per subplot. Overall, thegreatest number of stressed trees was located in the mixed conifer stand,although the subplots with the most stressed trees were located in the westernredcedar stands. There were generally more snags than stressed trees.
Table 8. Tree condition by stand type
Mixed 4% 8 %(41) (71)
$) g)
4% 7%(37) (64)
Figure 12 Number of snags and stressed trees in tbe mixed conifer stand subplots
1 9
Onion Creek Watershed Large Woody Debris Recruihnent Effectiveness - Final Report
Figure 13. Number of snags and stressed trees in the western redcedar stand subplots
Figure 14. Number of snags and stressed trees in the mature nxkedar stand subplots
cu.shssed q sIla!☺
1614121086420
20
Onion Creek Watershed Large Woody Debris Recruitment Effectiveness - Final Report
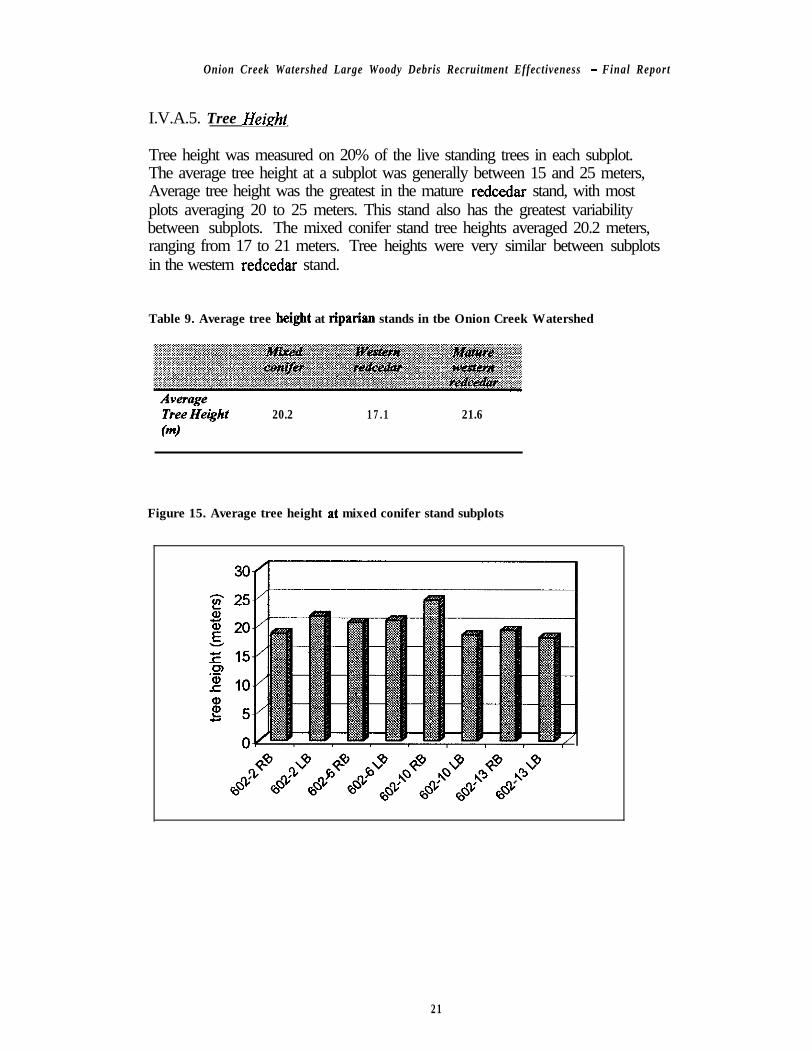
I.V.A.5. Tree Height
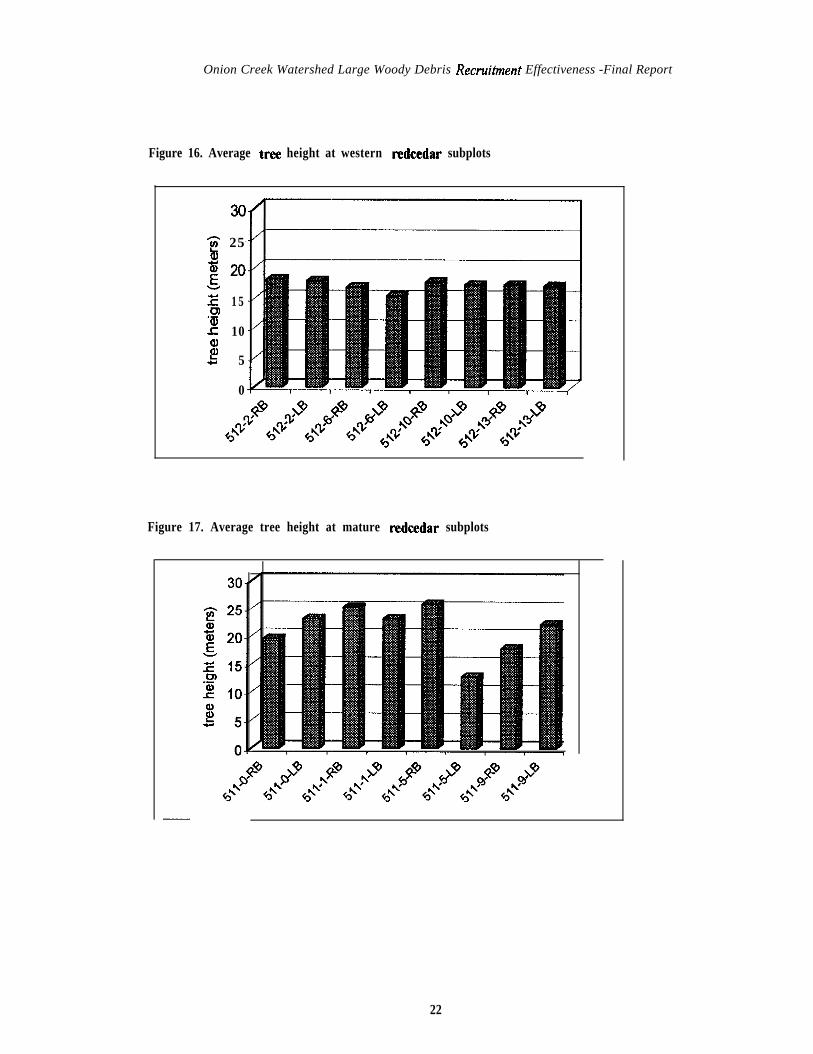
Tree height was measured on 20% of the live standing trees in each subplot.The average tree height at a subplot was generally between 15 and 25 meters,Average tree height was the greatest in the mature redcedar stand, with mostplots averaging 20 to 25 meters. This stand also has the greatest variabilitybetween subplots. The mixed conifer stand tree heights averaged 20.2 meters,ranging from 17 to 21 meters. Tree heights were very similar between subplotsin the western redcedar stand.
Table 9. Average tree height at riparipn stands in tbe Onion Creek Watershed
20.2 17.1 21.6
Figure 15. Average tree height at mixed conifer stand subplots
21
Onion Creek Watershed Large Woody Debris Recruihnent Effectiveness -Final Report
Figure 16. Average tree height at western redcedar subplots
3 252g 2oI 15.o,2 10iib 5
0
Figure 17. Average tree height at mature tedcedar subplots
22

Onion Creek Watershed Large Woody Debris Recruitment Eflectiveness -Final Report
IV.A.6. Leanina Trees
Lean angle was determined by the angle formed between the top of the tree andits base. Trees in the mixed conifer plots had the greatest average lean angle,ranging Corn 10% to 22%. Average lean angles were similar in the westernredcedar and mature redcedti plots, ranging from 7% to 13%.
Table 10. Pemeot of trees leaning away from and toward the creek at each ripariao stand
CreekAwy fromcreek
8% 7 % 1 1 %
6 % 5% 9%
Not leaning 86% 88% 80%
Between 12% and 20% of the standing trees were leaning at each stand.Slightly more trees were leaning toward the creek than away in each stand.Almost every plot had at least three trees leaning toward the creek and generallyless than eight. The greatest number of leaning trees was located in the matureredcedar stand.
Figore 18. Number of trees leaning toward and away from the creek in the mixed coniferstand
2 3

Onion Creek Watershed Large Woody Debris Recruitment Effectiveness - Final Report
Figure 19. Number of trees leaning toward and away from the cnwk in the westernredcedar stand
I”
14
12IO06420
Figure 20. Number of trees leaning toward and away from the creek in the mature redcedar stand
24

IV.A.1. Distance from Stream
Each standing tree was recorded at a certain distance horn the creek. Trees weredistributed relatively evenly over the plots; the greatest difference between distanceclasses was only 9%. The western redcedar stand had the greatest proportion within 5meters of the creek. The mixed conifer stand had the greatest proportion of trees between10 and 20 meters. The mature redcedar had the greatest proportion of trees in the 20 to25 meter range.
Table 11. Distribution of shading trees at variws distances frum tbe creek ia each stand
O - 5 15% 24% 18%5-10 18% 19% 18%IO-15 23% 20% 18%f5-20 24% 18% 24%20-25 19% 18% 25%2s+ 1% 1% Cl%
Figure 21. Tbe number of trees located at various distances from the CR& in each stand
IWmixed Hredcedar q matureredcedarj
180140120
m 100
5 ;;
4020
0
O-5 5-10 IO-15 15-20 20-25 >25
distance from creek (m)
25
Onion Creek Watershed Large Woody Debris Recruitment Effectiveness - Final Report
1V.B. Down Wood
IV.B. 1. Density
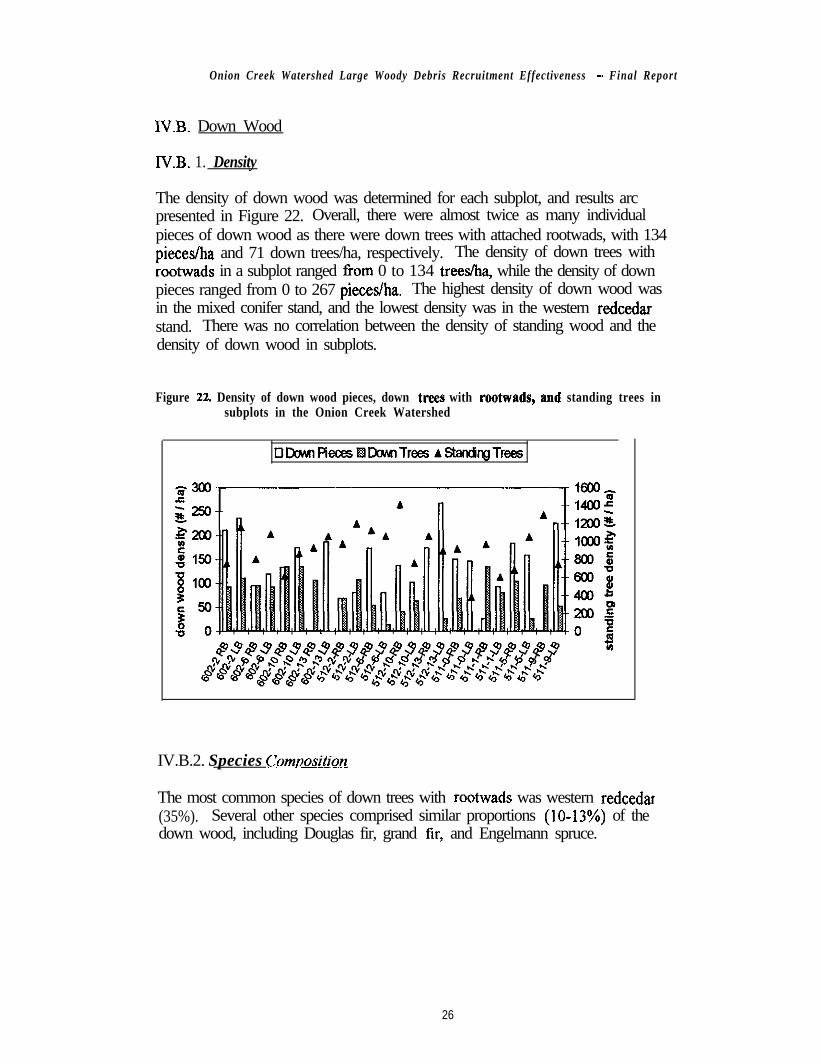
The density of down wood was determined for each subplot, and results arcpresented in Figure 22. Overall, there were almost twice as many individualpieces of down wood as there were down trees with attached rootwads, with 134piecesAra and 71 down trees/ha, respectively. The density of down trees withrootwads in a subplot ranged Corn 0 to 134 trees&, while the density of downpieces ranged from 0 to 267 pieces/ha. The highest density of down wood wasin the mixed conifer stand, and the lowest density was in the western redcedarstand. There was no correlation between the density of standing wood and thedensity of down wood in subplots.
Figure 22. Density of down wood pieces, down trees with rootwads, and standing trees insubplots in the Onion Creek Watershed
IV.B.2. Species Composition
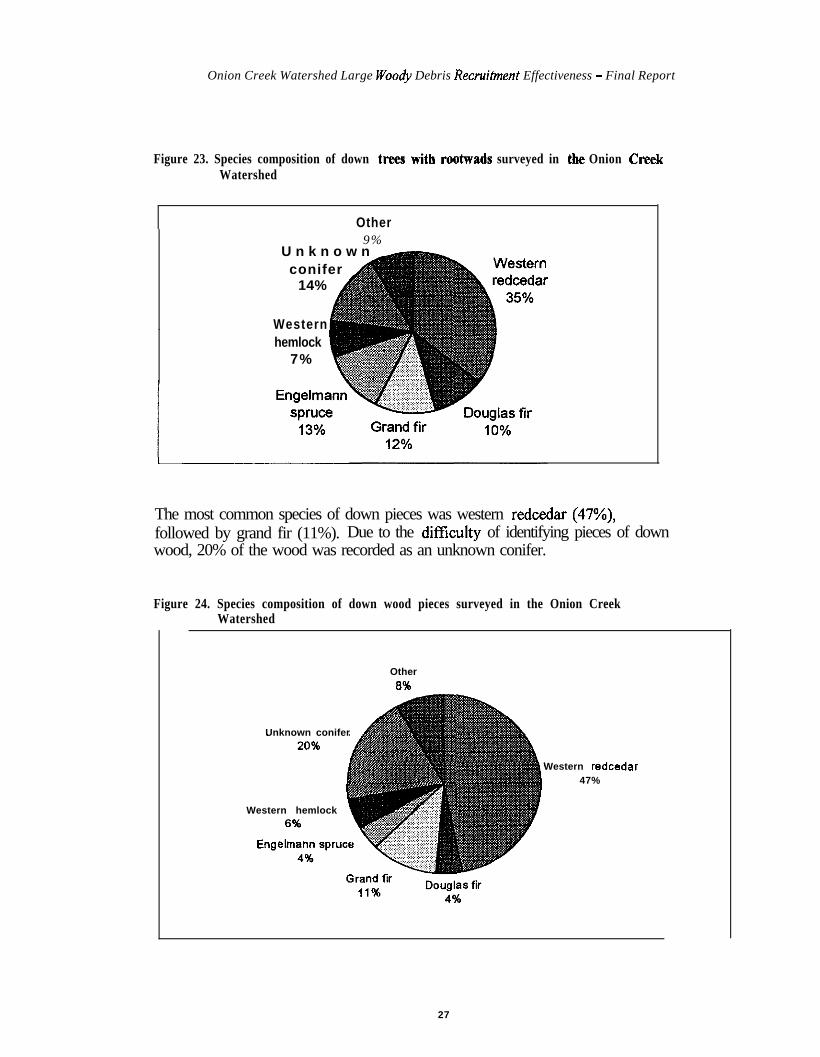
The most common species of down trees with rootwads was western redcedar(35%). Several other species comprised similar proportions (lo-13%) of thedown wood, including Douglas fir, grand fir, and Engelmann spruce.
26
Onion Creek Watershed Large Woody Debris Recruimtent Effectiveness - Final Report
Figure 23. Species composition of down trees with rootwads surveyed in the Onion CreekWatershed
Other9%
U n k n o w n -conifer A
14%
Westernhemlock
7%
The most common species of down pieces was western redcedar (47%),followed by grand fir (11%). Due to the diffkulty of identifying pieces of downwood, 20% of the wood was recorded as an unknown conifer.
Figure 24. Species composition of down wood pieces surveyed in the Onion CreekWatershed
Unknown conifer
Other8%
Western redcedar47%
Western hemlock
27

Onion Creek WatershedLarge Woody Debris Recruihwnt Eflecttvmess - Final Report
IV.B.3. Tree Size
Most of the down wood was small in diameter. Ranging from lo-29 cm dbh,(two-thirds of these trees were in the lo-19 cm dbh range). The relatively largenumber of small down trees was consistent with the larger proportion of smallstanding trees. Only 10 down trees with rootwads, or 8%, were >50 cm dbh,and only 14 down pieces, or 6%, were >50 cm dbh.
Figure 25. Number of down woad pieces aad dawn tress with rootwads in various sizeclasses surveyed ia the Onion Cmek Watershed
adown wood ndown trees w/rootwads
dbh (cm)
The average size of down pieces and trees was less than 30 cm in all threestands.
Table 12. Average size of down trees and down pieces surveyed in the Onion CreekWatershed
Down bvxs 27 24 24Down jnkces 25 29 28
28

Onion Creek Watershed Large Woody Debris Recruitment Ej%ctiveness - Final Report
IV.B.4. L&
Most of the down pieces of wood or trees with rootwads were between 5 and 15meters long. Pieces of down wood were generally shorter than trees withrootwads.
Figure 26. Number of down wood pieces and trees with rootwads in various length classes
ildown wood q down wood wlrootwads 1
1 2 0
1 0 0
6 0
6 0
4 0
2 0
0
length (meters)I--IV.B.5. Decav Class
A decay class ranging between 1 and 5 (5 being the most decayed) was assignedto down wood. The distribution of trees in these classes was different for treeswith rootwads than for individual pieces of down wood. Trees with rootwadswere more decayed (often class 4) compared to down wood pieces which weremore often in classes 1 and 2.
Figure 27. Percent of down trees with rootwads and down pieces of P given decay claws
n down pieces Odown trees
4 0 %
f3 5 %3 0 %
4 w 2 5 %‘i; 8 20%E5 1 5 %8B
10%a 5 %
0 %1 2 3 4 5
Decay Class
19
Onion Creek Watershed Large Woody Debris Recruitment Effectiveness - Final Report
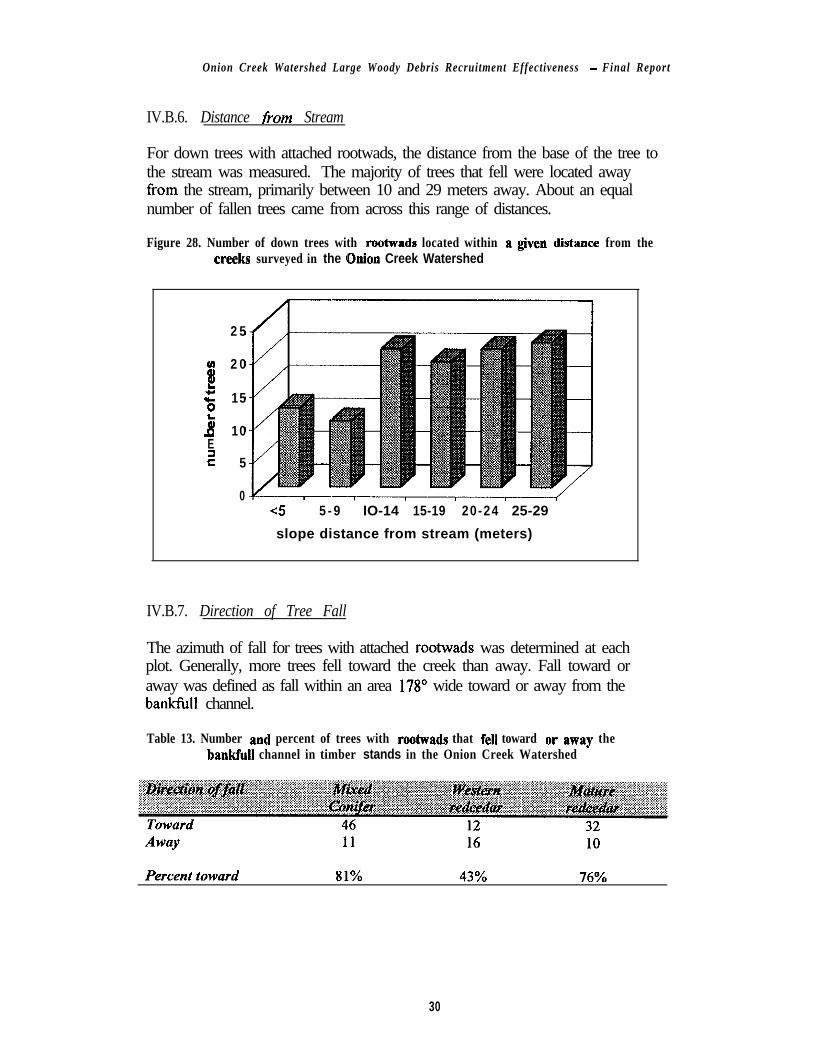
IV.B.6. Distance from Stream
For down trees with attached rootwads, the distance from the base of the tree tothe stream was measured. The majority of trees that fell were located awayfrom the stream, primarily between 10 and 29 meters away. About an equalnumber of fallen trees came from across this range of distances.
Figure 28. Number of down trees with rootwads located within a given distance from thecreeks surveyed in the 0sion Creek Watershed
2 5
8 2 0
l?!‘ii 15
ka 10E2 5
0<5 5 - 9 IO-14 15-19 20-24 25-29
slope distance from stream (meters)
IV.B.7. Direction of Tree Fall
The azimuth of fall for trees with attached rootwads was determined at eachplot. Generally, more trees fell toward the creek than away. Fall toward oraway was defined as fall within an area 17S” wide toward or away from thebankfull channel.
Table 13. Number and percent of trees with rootwads that fell toward or away thebankfull channel in timber stands in the Onion Creek Watershed
30

Onion Creek Watershed Large Woo& Debris Recruihnent Effectiveness - Final Report
IV.B.8. Recruitment
Table 14 gives the percent of down wood that was recruited to the bankfullchannel, suspended over the channel, or spanning the channel. The number ofdown trees that were recruited was small; most of the individual pieces and treeswith rootwads were not recruited.
Table 14. Recruitment of down wood surveyed in the Onion Creek Watersbed
Recruited to bankfill 4% 7%Suspended 3% 4%Spanning 1 6 % 4%
The larger proportion of down trees spanning the channel is due, in part, toseveral spanning logs in subplots 602-6 and 5 11-S.
The wood recruited to the bankfull channel averaged between 33 and 35 cmdiameter at the midpoint or dbh for pieces and trees, respectively. Most of therecruited pieces were either unknown species or redcedar. Most down trees withrootwads were not identified due to their level of decay.
3 1
Onion Creek Watershed Large Woody Debris Recruihnent Eflectiveness -Final Report
IV.C. Instream Wood
Qualifying pieces of instream wood were associated with the location of the piece in thechannel. The system used to describe the location consists of four zones. Our methodsaccount for three zones: 1,2, and 3+4. Zone 1 encompasses the wetted channel. Zone 2is the area above the wetted channel but within the bankfull channel. Zone 3 is the areaextending above the bankfUll channei but within the horizontal perimeter of the banktidlchannel. Zone 4 is the upland area to the leg or right of (i.e. outside ot) the bankfullchannel; including the riparian area and hillslopes.
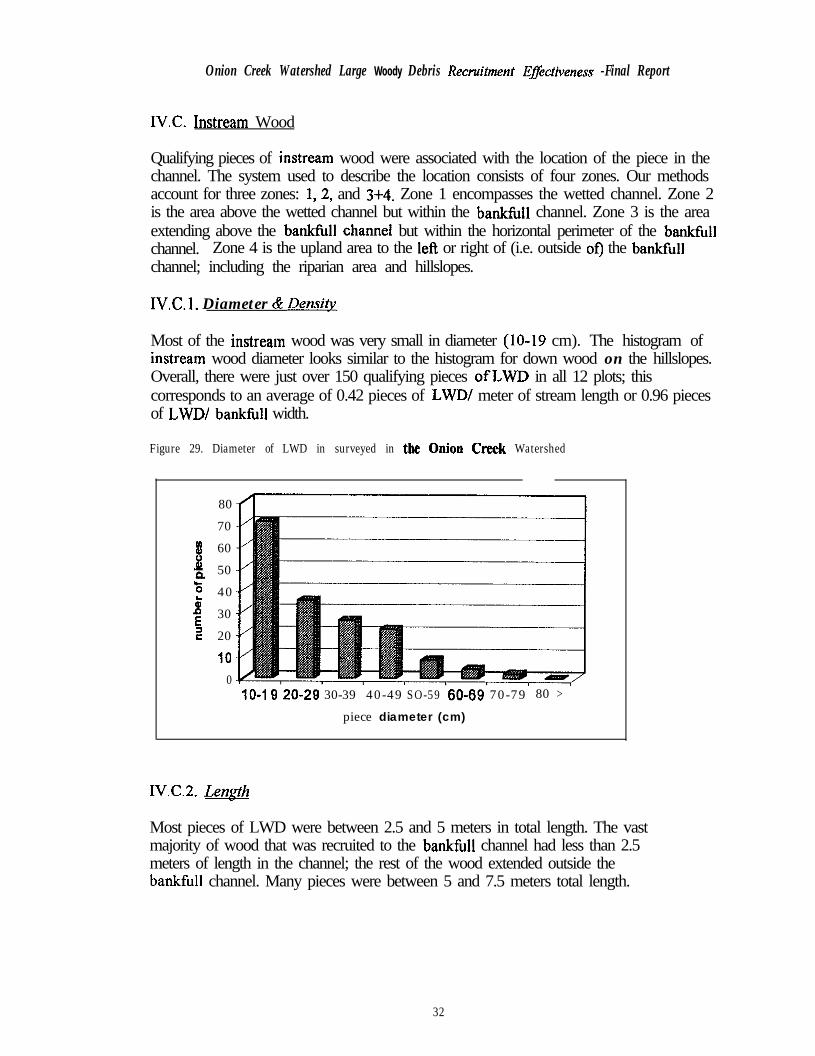
IV.C.1. Diameter & Den.@v
Most of the instream wood was very small in diameter (lo-19 cm). The histogram ofinstream wood diameter looks similar to the histogram for down wood on the hillslopes.Overall, there were just over 150 qualifying pieces ofLWD in all 12 plots; thiscorresponds to an average of 0.42 pieces of LWD/ meter of stream length or 0.96 piecesof LWD/ bankfull width.
Figure 29. Diameter of LWD in surveyed in tke Onion Creek Watershed
80
70
o8
60
z 50
p 40
f 30
z 20
IO
010-I 9 20-29 30-39 40-49 SO-59 60-69 70-79 80 >
piece diameter (cm)
IV.C.2. Lenpth
Most pieces of LWD were between 2.5 and 5 meters in total length. The vastmajority of wood that was recruited to the bankfidl channel had less than 2.5meters of length in the channel; the rest of the wood extended outside thebat&U channel. Many pieces were between 5 and 7.5 meters total length.
32

Onion Creek Watershed Large Woody Debris Recruihnent Effectiveness -Final Report
Figure 30. Total length of LWD and length of pieces within each channel zone surveyed in the OnionCreek Watershed
l.Zone 1 q Zone 2 EIZones 3 & 4 q Total Length
IV.C.3, Functionina Wood
Small diameter wood was found functioning at Onion Creek sites. Of all piecesrecruited, 18% were fimctioning to form pools. Of the wood that washnctioning to form pools, about twice as many of those pieces were small ratherthan large, ranging from lo-29 cm diameter. About half of the pieces wereoriented perpendicular to the direction of flow.
PigweN. Diameter of LWD functioning to form pools in stream segments surveyed in the
-'1019'2029'3IS39'4049'5LM9'60&7079~ 80~
piece diameter (cm)
3 3
Onion Creek Watershed Large Woody Debris Recruitment Effectiveness -Final Report
IV.C.4 Volume of Wood Recruited to Bankfull Channel.
The volume of wood recruited to the bankfull channel varied significantlybetween the mixed conifer stand and the redcedar stands. Almost twice as muchwood was in the channel at the mixed stand.
Table 15. Volume of wood and number of pieces witbin the bankfull channel at timberstands surveyed in the Onion Creek Watersbed
Western whcedar II 27 0.45Afature redcedar 60 18 0.30
The number of pieces in the bankfidl channel per bankfull width variedsignificantly between plots. The greatest number of pieces in the bankfullchannel were in the mixed conifer stand and the least in the mature redcedarstand.
IV.C.5. Debris Jams
Debris jams are defined as 10 or more qualifying pieces in contact with eachother. Each must be totally or partially in Zones 1,2, or 3.
No qualifying debris jams were found in study plots surveyed in the OnionCreek Watershed.
34

Onion Creek Watershed Large Woody Debris Recruitment Effectiveness -Final Report
V. Changes in Riparian Stands After One Year
Stevens County Conservation District technicians revisited each riparian stand todocument any changes that occurred following the initial survey completed in September1998. The follow up survey was conducted in October/November 1999. There were nomajor disturbance events during this time.
V.A. Standing Trees
Natural conditions resulted in very few changes in riparian plots in the Onion CreekWatershed (Table 15). Only four trees in the mixed conifer stand and five trees in themature western redcedar stand changed. At the mixed conifer stand, two snags and onestressed tree were leaning more than before, and the top broke out of one tree, creating anew snag. The three leaning trees lean almost directly toward the creek, although, two ofthe three are located more than 15 meters horizontal distance from the creek. At themature redcedar site, three fir trees died and two trees were leaning approximately 30°more than before. Four of the five trees with a change are located more than 15 metershorizontal distance from the creek.
Table 16. Number of standing treea in Onion Creek Watershed riparian plots thatchanged between September 1998 and November 1999.
New Lean angle 3 1 2Tree died 0 0 3Tag/tree missing 0 55 0Tree harvested 0 83 0Other 1” 0 0
Total 4 116 5#broken top crcared new snag.
Several categories of change were noted during the follow-up survey:
l Harvested: tree cut, stump remained, tag found, and log gone.l Missing: tag could not be located; tree cut below tag level and harvested, taken to
slash pile, or pushed over with tag buried.l Down wood: tree on the ground; pushed over with equipment, fell over with no sign
of pushing, or cut and left.l Other: leaning more than before, broken top, or tree died.
One standing tree was found without a tag number in the mixed conifer stand, and twotrees in the mature redcedar stand had tag numbers but no data recorded in the 1998survey.
35

Onion Creek WatershedLarge Woody Debris Recruihnent Effectiveness -Final Report
Many changes were found at the western redcedar stand; all of the changes were thedirect or indirect result of harvesting activities during winter of 1998/99 (Table 17). Thisunplanned encroachment into the riparian plots impacted over 175 trees in the stand(between 34 to 52 trees at each plot). Between 50% and 53% of the trees impacted inPlots 2, 6, and 13 and almost 80% of the trees impacted in Plot 10 were located 15 metersor more from the creek.
Table 17. Number of standing treea impacted by harvesting activities at the westernredcedar stand in the Onion Creek Watershed
V.B. Recruited Wood
Two small pieces of wood were recruited as LWD to the bankfull channelduring the year following the Onion Creek survey. The total volume of newlyrecruited wood was approximately 0.12 m3. Both pieces were in the mixedconifer stand, which had the most instream wood during the 1998 survey. Bothpieces came from suspended wood, and they were significantly decayed (Class 4and 5). Neither piece fUnctioned to form pools upon recruitment,
Table 18. Wood recruited to the bankfull chamtel between September 1998 andNovember 1999 at timber stands surveyed in the Onion Creek Watershed
Spaking wood 0 0 0StandinE trees 0 0 0
36

Onion Creek Watershed Large Woody Debris Recruitment Effectiveness -Final Report
VI. Discussion
The riparian survey conducted in the Onion Creek Watershed providedpermanent plots and baseline data that can be used to track future rates of largewoody debris recruitment during “normal” years and episodic events. The datapresented in this report represent the riparian conditions from which futurechanges can be observed.
These sites were located on small streams having bankfidl widths of less than 3 meters,Hillslopes were generally steep, but a range of stand densities and stream gradients wasrepresented. The three sites selected for survey were initially identified as mixed conifer,western redcedar, and mature western redcedar stand. Stand characterization followingthe survey showed that each site was predominantly western redcedar while the mixedconifer stand had the greatest proportion of other species. Most of the trees surveyedwere small (<30 cm dbh).
As expected, the mature redcedar stand was different from the redcedar stand. It had thelargest and tallest trees. It had the lowest density of stems per hectare and the greatestproportion of trees located away from the stream. The mature redcedar stand had thesteepest hillslope and the most leaning trees, but it had the fewest pieces of instreamwood per bankfull width.
Overall, the species composition of down wood was generally reflective of the standingwood. Most of the down wood was western redcedar; however, there was a greaterproportion of Douglas fir and Engelmann spruce down than standing. Twelve to 20% ofthe trees were leaning; slightly more leaned toward the creek than away.
Most of the trees that fell originated more than 10 meters from the creeks. Of the downwood, 11% was recruited to the bankfidl channel. As with standing trees, most instreamwood was small in diameter and less than 5 meters long. This small wood functionedwell to form pools in the Type 3 streams surveyed. The mixed conifer stand had the mostwood recruited to the bankfidl channel (1.1 pieces/ banktU width); the redcedar standshad less than half that amount (.30-.45 pieces/banktU width).
Follow-up survey of each plot one year after the initial survey resulted in fewchanges caused by natural conditions. At two stands, a few trees died andseveral had greater lean angles. Changes at the other stand resulted from timberharvesting activities. Over 175 standing trees were impacted; about 20%became down wood, and 80% were harvested or presumed harvested (missing).
If funding is available, plots will be revisited following disturbance events in the future.Disturbance events are generally defined as any event (wind, rain, snow storm, tire,heavy snow load, etc.) that is believed to have a high probability of causing tree fall.
3 7

Onion Creek Watershed Large Woody Debris Recruitment Effectiveness -Final Report
Events that may cause mass mortality of trees include fire, disease, and insect damage.When a tree dies and the cause of death is apparent, that cause will be recorded. Localforesters can help with determining cause of death. Mass mortality situations cause treesto fall sooner in time than if they were healthy, but this time could be 10 years after thetree dies. These trees will be identified and tracked over time in the same manner healthytrees are tracked.
Several measurements will be taken when plots are revisited. Any tagged trees that havefallen will be identified by tag number and location. The angle of fall relative to thestream will be measured. If the tree fell into the stream, the mean diameter and length ofthe portion of the tree that is in the stream will be measured following the LWD surveymethods used in this study (Schuett-Hames et al., 1994). Wood that falls into the channelfrom outside the plot will also be measured and noted if it qualifies under the methodsprovided above.
3 8
Onion Creek Watershed Large Woody Debris Recruitment Effectiveness -Final Report
VII. References
Henderson, J.A., R.D. Lesher, D.H. Peter, and D.C. Shaw. 1992. Field guide tothe forested plant associations ofthe Mt. Baker-Snoqualmie National Forest.USDA Forest Service, R6-ECOL-TP-028-91. Pacific Northwest Retion,Portland, OR. 196 p.
Henderson, J.A., D.H. Peter, RD. Lesher, and D.C. Shaw. 1989. Forested plantassociations of the Olympic National Forest. USDA Forest Service, R6-ECOL-TP-001-88. Pacific Northwest Region, Portland, OR. 502 p.
Raines, M., C. Cooper, K. Doughty, K. Vanderwal Dube, C. Fairbanks, D.Glass, J. Greenberg, G. Konkel, K. Kuzis. 1997. Onion Creek WatershedAnalysis. Boise Cascade Corp. Kettle Falls, WA.
Schumaker, R., C. Kessler, and D. Glass. 1998. Onion Creek Watershed LargeWoody Debris Recruitment Effectiveness Monitoring Plan. Stevens CountyConservation District. Colville, WA.
Smith, D. April 1998. TFW Effectiveness Monitoring and Evaluation Program:Riparian Stand Survey Review Draft. Northwest Indian Fisheries Commission.
Smith, D. and D. Schuett-Hames. April 1998. TFW Effectiveness Monitoringand Evaluation Program: Site-Scale Large Woody Debris (LWD) RecruitmentStudy Design Guidelines Review Draft. Northwest Indian FisheriesCommission.
Schuett-Hames, D., J. Ward, M. Fox, A. Pleus, and J. Leight. 1994. TFWAmbient Monitoring Manual: Large Woody Debris Survey Module. NorthwestIndian Fisheries Commission.
Washington State Department of Natural Resources. 1996. Field Procedures:Forest Resource Inventory System. Forest Resources Division. Olympia, WA
Williams, C., B. Kelley, B. Smith, T. Lillybridge. 1995. Forested plantassociations of the Colville National Forest. Gen. Tech. Rep. PNW-GTR-3600.Portland, OR: US Department of Agriculture, Forest Service, Pacific NorthwestResearch Station. 375 p. In cooperation with: Pacific Northwest Region,Colville National Forest.
3 9

Onion Creek Watershed Large Woody Debris Recruihnent Efftiveness - Final Report
Appendix
4 0

4 5

I MILE-
ROAD CLASSIFICATION
Primary highway, all weather. Light.duty road,‘all weather.haid surfam e improved surface..
Unimproved road, fair or dryweather..~~~.~~.~~...~.~~~~~ .,.,i==i=== s =
d-----T 0 State Route
ONION CREEK, WASH.N4845-W1174517.5

WASHINGTON-S’FEVENS COG7~5 MINUTE SEiilES (TOPOGRAPHIC)