o*net interest profiler: reliability, validity, and self ...net interest profiler: reliability,...
TRANSCRIPT

O*NET Interest Profiler: Reliability,Validity, and Self-Scoring
James Rounds, Cindy M. Walker, Susan X. Day, and Lawrence HubertUniversity of Illinois at Urbana-Champaign
Phil Lewis and David RivkinNational Center for O*NET Development
National Center for O*NET DevelopmentEmployment Security Commission
Post Office Box 27625Raleigh, North Carolina 27611
e-mail: [email protected]
1999
Table of Contents
List of Tables ........................................................................................................ ii
List of Figures ...................................................................................................... iv
Acknowledgments……...………………………………………………………………..v
Executive Summary ............................................................................................ vi
Introduction ......................................................................................................... 1
Methods ........................................................................................................... …2
Measures ................................................................................................... 2
Design........................................................................................................ 3
Participants ................................................................................................ 3
Analysis...................................................................................................... 4
Results................................................................................................................. 5
Reliability.................................................................................................... 5
Validity....................................................................................................….6
The E Scale............................................................................................….8
Scoring and User Feedback....................................................................... 9
Discussion......................................................................................................... 11
References ......................................................................................................... 14
Tables ................................................................................................................. 15
Figures................................................................................................................ 47
i
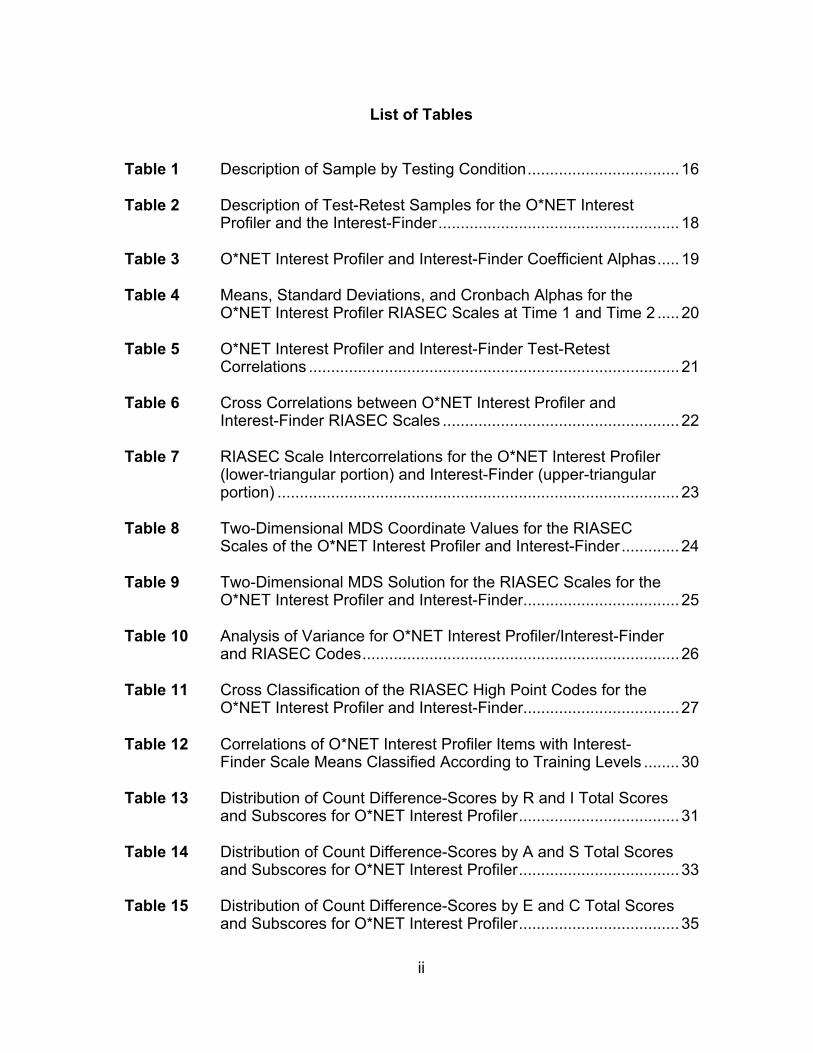
List of Tables
Table 1 Description of Sample by Testing Condition.................................. 16 Table 2 Description of Test-Retest Samples for the O*NET Interest Profiler and the Interest-Finder...................................................... 18 Table 3 O*NET Interest Profiler and Interest-Finder Coefficient Alphas..... 19 Table 4 Means, Standard Deviations, and Cronbach Alphas for the O*NET Interest Profiler RIASEC Scales at Time 1 and Time 2 ..... 20 Table 5 O*NET Interest Profiler and Interest-Finder Test-Retest Correlations ................................................................................... 21 Table 6 Cross Correlations between O*NET Interest Profiler and Interest-Finder RIASEC Scales ..................................................... 22 Table 7 RIASEC Scale Intercorrelations for the O*NET Interest Profiler (lower-triangular portion) and Interest-Finder (upper-triangular portion) .......................................................................................... 23 Table 8 Two-Dimensional MDS Coordinate Values for the RIASEC Scales of the O*NET Interest Profiler and Interest-Finder............. 24 Table 9 Two-Dimensional MDS Solution for the RIASEC Scales for the O*NET Interest Profiler and Interest-Finder................................... 25 Table 10 Analysis of Variance for O*NET Interest Profiler/Interest-Finder and RIASEC Codes.......................................................................26 Table 11 Cross Classification of the RIASEC High Point Codes for the O*NET Interest Profiler and Interest-Finder................................... 27 Table 12 Correlations of O*NET Interest Profiler Items with Interest- Finder Scale Means Classified According to Training Levels ........ 30 Table 13 Distribution of Count Difference-Scores by R and I Total Scores and Subscores for O*NET Interest Profiler.................................... 31 Table 14 Distribution of Count Difference-Scores by A and S Total Scores and Subscores for O*NET Interest Profiler.................................... 33 Table 15 Distribution of Count Difference-Scores by E and C Total Scores and Subscores for O*NET Interest Profiler.................................... 35
ii
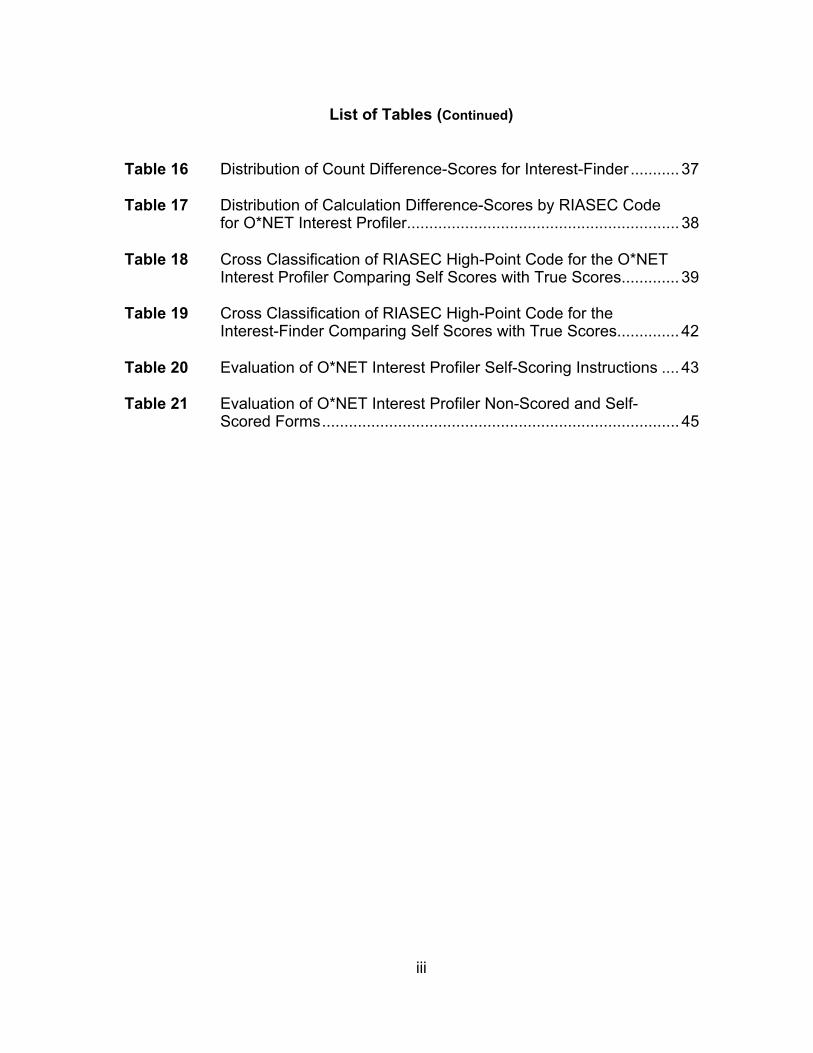
List of Tables (Continued)
Table 16 Distribution of Count Difference-Scores for Interest-Finder ........... 37 Table 17 Distribution of Calculation Difference-Scores by RIASEC Code for O*NET Interest Profiler............................................................. 38 Table 18 Cross Classification of RIASEC High-Point Code for the O*NET Interest Profiler Comparing Self Scores with True Scores............. 39 Table 19 Cross Classification of RIASEC High-Point Code for the Interest-Finder Comparing Self Scores with True Scores.............. 42 Table 20 Evaluation of O*NET Interest Profiler Self-Scoring Instructions .... 43 Table 21 Evaluation of O*NET Interest Profiler Non-Scored and Self- Scored Forms................................................................................ 45
iii
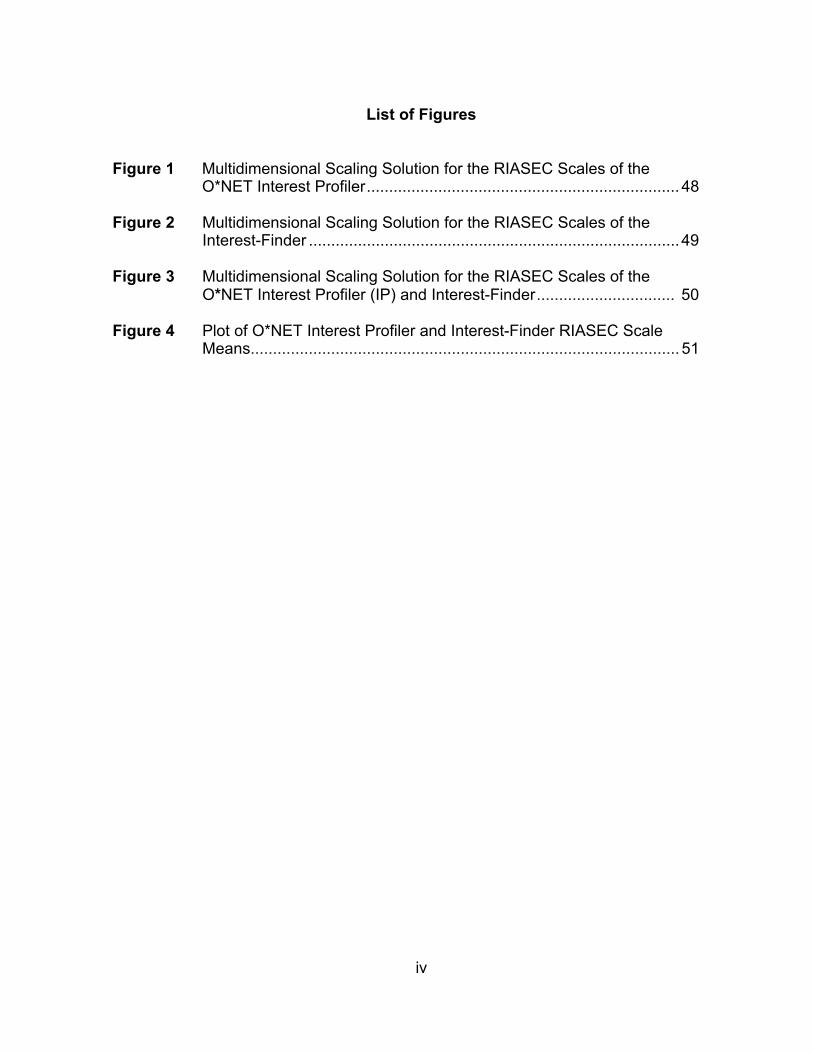
List of Figures
Figure 1 Multidimensional Scaling Solution for the RIASEC Scales of the O*NET Interest Profiler...................................................................... 48
Figure 2 Multidimensional Scaling Solution for the RIASEC Scales of the
Interest-Finder ...................................................................................49
Figure 3 Multidimensional Scaling Solution for the RIASEC Scales of the O*NET Interest Profiler (IP) and Interest-Finder............................... 50
Figure 4 Plot of O*NET Interest Profiler and Interest-Finder RIASEC Scale Means................................................................................................ 51
iv
Acknowledgments
The O*NET™ Interest Profiler was produced and funded by the O*NET project of the U.S. Department of Labor, Employment and Training Administration, Office of Policy and Research (OPR) under the direction of Gerard F. Fila, Administrator. The O*NET project is directed by Jim Woods, Office of Policy and Research, and Donna Dye, Office of Workforce Security. The instrument was created through Department of Labor grants with the National O*NET Consortium, National Center for O*NET Development; the North Carolina Employment Security Commission, Southern Assessment Research and Development Center; the Utah Department of Employment Security, Western Assessment Research and Development Center; the New York Department of Labor, Eastern Assessment Research and Development Center; and the Michigan Employment Security Commission, Northern Assessment Research and Development Center. The development of the O*NET Interest Profiler was directed by Phil Lewis and David Rivkin. Eight research phases were conducted in support of the development of the instrument, each of which required multiple steps and the participation of a wide variety of staff, contractors, and pilot sites. Grateful acknowledgment for their prominent roles in this process is made to Jeannie Stroupe, Dr. James Rounds, Ann Kump, Diana Williams, Ronald Boese, Dr. Brian Young, Helen Tannenbaum, Maureen Mendick, Brenda Dunn, and Jerry Pickett. A special thanks is given to Dr. René V. Dawis for his technical contribution and the guidance he provided at the conception of the project.
v
Executive Summary This report summarizes a study designed to further the development of the O*NET™ Interest Profiler, an interest inventory that aids individuals in identifying their work-related interests. The study was conducted by researchers at the University of Illinois at Urbana-Champaign, the U.S. Department of Labor’s Office of Policy and Research, and the National Center for O*NET Development. The study’s purpose was twofold: first, to examine the psychometric properties—reliability and validity—of the final form of the O*NET Interest Profiler, and second, to evaluate the self-scoring aspect of the instrument. For comparison purposes, all analyses were also carried out on the Interest-Finder (Defense Manpower Data Center, 1995), another self-scoring assessment instrument designed to help individuals discover their work-related interests. The innovative self-administering, self-scoring format of the O*NET Interest Profiler was supported. The O*NET Interest Profiler presents the items of each RIASEC construct to clients in a mixed fashion, rather than grouped together by RIASEC construct (cf. Interest-Finder, Self-Directed Search [Holland, 1994]). Results from a principal components analysis indicate that this item format reduced the presence of a general response bias (i.e., endorsement of the items of an interest area in a particular fashion based on an initial impression or tendency) found in interest assessment inventories. In addition, examination of clients’ ability to self-score the O*NET Interest Profiler revealed a low percentage of scoring errors and, more importantly, a minimal presence of misclassifications. The results from the internal consistency reliability analyses are comparable to other Holland-type interest inventories. The results from the stability analysis show that the O*NET Interest Profiler is very consistent over time and generally more consistent than the Interest-Finder. A principal components analysis indicated that the factor structures of the Interest-Finder and the O*NET Interest Profiler are similar to what has been found for other RIASEC inventories. These findings suggest that the O*NET Interest Profiler fits well into the constellation of other established vocational interest measures. Equivalent scales from both measures were highly correlated, supporting the convergence validity of these measures. According to the Holland model, however, the correlations for the O*NET Interest Profiler suggested a problematic Enterprising scale because this scale had the lowest cross correlation and correlated too highly with the Artistic scale and not highly enough with the Social scale. A problem with the Enterprising scale is apparent also in the profile analysis results, in which a statistically significant interaction was observed between the type of measure taken and RIASEC scale. This interaction was partially due to a large disparity between the means of the Enterprising scales on each measure. We speculate that the lack of support for a coherent scale stems from the nature of its items. Although Interest-Finder items focus on high-level business and law activities, O*NET Interest Profiler items include many low-level sales jobs in an
vi
attempt to cover all prestige and educational levels. Speculations concerning the effects of training level on responses to Enterprising scale items were followed up by analyses that suggest that low training level items are not consistently perceived as Enterprising activities by test-takers. The O*NET Interest Profiler introduces more variability into the Enterprising category and perhaps, in the process, loses conceptual unity. Nevertheless, it is important to keep in mind that these results are based on comparisons with the Interest-Finder. Comparisons to another RIASEC inventory likely may lead to different conclusions. A less striking discrepancy was found between the means of the Realistic and Conventional scales of the O*NET Interest Profiler and the Interest-Finder, which we speculate also may be a result of the inclusion of a variety of activities designed to cover all prestige and educational levels. Both measures exhibited a gap between the Realistic and Conventional types, seen in both the multidimensional scaling and in intercorrelation matrices. The presence of this gap also has been found in data from other Holland-type measures. Whether the Realistic-Conventional gap reflects the nature of vocational interest structure or the choice of items within the scales is still unknown. Participants viewed the O*NET Interest Profiler as interesting, easy to score, and beneficial, which suggests that people will be apt to use the instrument and will be satisfied with its results. All in all, the O*NET Interest Profiler adds an updated interest inventory that should prove helpful to those trying to decide upon a career choice or career move.
vii

Introduction This report summarizes a study designed to further the development process of the O*NET™ Interest Profiler, an interest inventory that aids individuals in identifying their work-related interests. The study was conducted by researchers at the University of Illinois at Urbana-Champaign, the U.S. Department of Labor’s Office of Policy and Research, and the National Center for O*NET Development. The study’s purpose was to examine the psychometric properties, specifically, reliability and validity, of the final form of the O*NET Interest Profiler, as well as to evaluate the self-scoring aspects of the instrument. For comparison purposes, all analyses were also carried out on the Interest-Finder, another self-scoring assessment instrument designed to help individuals discover their work-related interests. To examine the reliability of the O*NET Interest Profiler, an internal consistency analysis was carried out, as well as a stability analysis. The internal consistency analysis provides information on the amount of measurement error that exists in each of the six internal scales, for the given sample. The scales are Realistic, Investigative, Artistic, Social, Enterprising, and Conventional (R-I-A-S-E-C), following Holland's (1997) basic typology of work environments and personality. The stability analysis, sometimes called a test-retest analysis, provides information on how stable or consistent an examinee's score is over time. To examine the validity of the O*NET Interest Profiler, convergent and discriminant validity, as well as structural validity, were examined. These analyses investigate how well the inventories measure the relevant constructs. The convergent and discriminant validity analysis provides information on the amount of consistency that exists between the O*NET Interest Profiler and the Interest-Finder. Specifically, this analysis provides information on the comparability and expected relationships between the scores on each of the instruments. The structural validity analysis provides information on how well a given model or theory fits the data. In this case, the structural validity analysis was conducted to evaluate how well Holland's RIASEC theory models the relationships among the six scales of the O*NET Interest Profiler designed to measure each of the RIASEC constructs. To evaluate the ability of participants to self-score the instrument, a cross-classification analysis was carried out, as well as an examination of the error rate occurring throughout several stages of scoring the O*NET Interest Profiler. In this case, the cross-classification analysis compared the actual primary interest area that the participants identified based on their self-scoring versus the expected primary interest area based on computerized scoring of the instrument. This report is divided into several sections. The first section describes testing conditions, sample characteristics in each testing condition, the treatment of missing data, and the specific analyses carried out. The next section presents the results of the analyses. In both cases, the reliability results are presented first, the validity results are presented next, and the evaluation results are presented last. Finally, the last section presents a substantive interpretation of the results.
1
Methods Measures
The O*NET Interest Profiler (IP) and the Interest-Finder (IF) are measures that assist people in making occupational choices. Both paper-and-pencil measures are interest inventories. The O*NET Interest Profiler (National Center for O*NET Development, 1999) includes 30 items per RIASEC type, for a total of 180 items, in a format that mixes the RIASEC types so that no string of similar items occurs in a column of items. Items are presented in sets of two in the RIASEC order, beginning with R and ending with C. The O*NET Interest Profiler provides no general descriptions of types, as the Interest-Finder does, and all items are work activities (e.g., “Diagnose and treat sick animals,” “Act in a movie,” “Sell houses”). Respondents are asked for “like,” “dislike,” and “not sure” responses to the items. The Interest-Finder (Defense Manpower Data Center, 1995) arranges the items in six lists corresponding to the six RIASEC types with each list containing items representing one interest type. In each list there are three kinds of items: 14 activities (e.g., “Apply wood stains and varnishes to furniture”), 12 training (e.g., “Restoration of antique furniture”), and 14 occupations (e.g., “House painter”). The relevant RIASEC type is described at the top of each page of items. The respondent is asked to indicate a “like” or “dislike” for each item. If the respondent is “unsure”, he or she is instructed to mark the “dislike” option. For the Interest-Finder, there are 40 items per type for a total of 240. In the self-scoring of both measures, “like” responses are counted and tallied. For the O*NET Interest Profiler, the test-taker counts the number of “likes” for both rows that have the same color across four pages (e.g., green is Realistic, pink is Investigative, and so forth) and enters the number on the inside flap. Then, the two tallies of “likes” that are entered on the inside flap for each RIASEC type are added, yielding six type scores. These scores are copied to the “O*NET Interest Profiler Score Report.” The RIASEC letters for the highest and second highest score are written in boxes for “primary” and “secondary” interest areas, respectively. For the Interest-Finder, the total number of “like” responses on each page is counted and entered at the bottom of the page. Each of six pages represents one of the RIASEC types. The test-taker is then asked to transfer these “like” counts from page 1 through page 6 to a separate page where the “like” responses are entered in six boxes. Across from the box are the numbers from 40 to 1 that correspond to percentile scores for females (above) and males (below). Test-takers are asked to circle their score and then look either above or below the score, depending on their sex, to find their percentile score. These six percentile scores are transferred to six circles corresponding to the six types. Finally, test-takers find the three letters (R-I-A-S-E-C) next to their three highest percentile scores and record these letters in triangles representing “primary,” “secondary,” and “tertiary”. 2
For both interest inventories, the test-taker receives a summary code of his or her top two or three Holland types in order of preference, such as IR, SEC, or AIS. In career reference materials, these RIASEC codes are linked to occupational areas and job titles so that the user can consider a range of pursuits that are likely to provide a good personality/work environment match. For the IP, there is an associated score report that links the IP summary codes to the O*NET Occupational Units.
Design With the exception of the stability (test-retest) analysis, each analysis was performed on the aggregate of two groups obtained using a randomized block factorial design. Specifically, two forms of both the O*NET Interest Profiler and the Interest-Finder were administered: a self-scoring version and a non-scoring version. Each group took both of these measurement instruments, with one group first completing the Interest-Finder and the second group first completing the O*NET Interest Profiler. In both cases, the non-scoring version of the measure was administered first, followed by the self-scoring version. The non-scoring version was administered first so that the actual scoring and interpretation would not bias the responses to the second measure. Therefore, the order of non-scoring to self-scoring controlled for possible influences that knowledge of the interest scores would have on participants’ responses. These two groups are labeled as IPNS-IFS and IFNS-IPS, representing the O*NET Interest Profiler Non-Scoring/ Interest-Finder Scoring group and the Interest-Finder Non-Scoring/O*NET Interest Profiler Scoring group. The order of the instruments in the labels conveys the order in which the tests were taken. Although both assessments were scored, the NS abbreviation represents the fact that the participants did not score the instruments themselves. Participants Prior to the analyses, participants were eliminated if more than two responses were missing on either the O*NET Interest Profiler or the Interest-Finder. This eliminated 37 participants from the IPNS-IFS group and 26 from the IFNS-IPS group, leaving a total of 1,061 participants. With the exception of the stability analysis and the evaluation of the self-scoring, all analyses were conducted on a total of 1,061 individuals, an aggregate of the two groups, from four regions across the United States: Michigan, New York, North Carolina, and Utah. Data collection sites included employment service offices, junior colleges, trade schools, and other government agencies. These participants were paid $15 each to reimburse them for travel expenses. Table 1 depicts the characteristics of the two groups used for most of the analyses in terms of sex, age group, education, ethnicity, employment status, student status, and geographical region. As the table illustrates, the sample is quite representative in terms of gender, age, ethnicity, and geographical location, both within and across groups. Most participants were unemployed and did not hold a bachelor's degree. 3
The stability analysis (in the form of a test-retest reliability estimate) was conducted on a different group of participants, approximately split between junior college/vocational school students and college students. This group of participants took the same interest inventory on two separate occasions, with approximately one month elapsing between the two administrations. The O*NET Interest Profiler was administered twice to 132 participants, and the Interest-Finder was administered twice to 120 participants. Table 2 depicts the characteristics of this group of participants. As the table illustrates, the majority of the participants in this sample were unemployed or employed part-time. This sample had more females than males, and the eastern part of the nation was not represented. Once again, participants were eliminated from the analysis if more than two responses were missing on either the O*NET Interest Profiler or the Interest-Finder. The self-scoring analysis of the O*NET Interest Profiler was conducted on a subset (n = 512) of the total sample (n = 1061), similarly distributed among the four geographical regions. As shown in Table 1, approximately two thirds were female, most were distributed between 19 and 50 years of age, over two thirds had a high school degree or beyond, the majority were unemployed, and more than half were white and over a quarter African American. One third were students. Among the employed, over half of the participants worked only part-time.
Analysis To examine the internal consistency of the O*NET Interest Profiler and the Interest-Finder, coefficient alphas were calculated for each of the RIASEC scales on both of the samples. The stability of each of the measures was evaluated by calculating the correlation between item responses on each of the two testing occasions for each of the RIASEC scales. In addition, Cronbach alphas, mean scores, and standard deviations for each of the scales were calculated for the group of subjects who participated in the stability analysis. A principal components analysis examined the factor structure for the two measures. Convergent and discriminant validity were investigated by observing the patterns of the cross-correlations and intercorrelations between the items on each of the RIASEC scales. The cross-correlations consist of the correlations between the O*NET Interest Profiler and the Interest-Finder on each of the scales, while the intercorrelations consist of the correlations between scales within each of these instruments. These analyses provide information on the expected relations between the scores on the two measures. To assess the comparability of the scores obtained on each of the measures, the cross-classifications of RIASEC scores on each of the instruments were examined, and a profile analysis was carried out. A major use of the O*NET Interest Profiler and Interest-Finder is to provide participants with a summary code indicating their primary and secondary interest areas; the cross-classification analysis explores how often the two instruments classify examinees into the same primary interest area. The profile analysis was conducted to observe the degree of parallelism between the two measures. A participant's score on each scale of the instrument was the dependent variable, and the measurement instrument (O*NET Interest Profiler or Interest-Finder) 4

and RIASEC scale category were the independent variables. An absence of an interaction between measurement instrument and RIASEC scale would indicate that the measures are comparable. A randomization test of hypothesized order (Rounds, Tracey, & Hubert, 1992) was used to examine the structural validity of the O*NET Interest Profiler, assuming Holland's circular model (Holland, 1997). In addition, a multidimensional scaling was conducted to assess whether a circular structure fit the data. For comparison purposes, these analyses also were carried out on the Interest-Finder. To evaluate the self-scoring aspects of the O*NET Interest Profiler, several analyses were performed. At least four different types of errors could be made by a participant when self-scoring the O*NET Interest Profiler: 1) miscounting the number of likes when obtaining the two subscores, 2) miscalculating the total number of likes when adding the two subscores, 3) transferring the calculated scores to the score sheet incorrectly, and 4) misidentifying either one's primary or secondary interest area. In the present analysis, we examined for the O*NET Interest Profiler two types of errors: miscounting and miscalculating. For comparison purposes, the miscounting analysis was done also for the Interest-Finder. Even when miscounting of like responses occurred, these miscounts may not ultimately affect the determination of the participant’s primary RIASEC code. For example, a participant’s self-scores are R = 28, I = 22, A = 10, S = 4, E = 6, and C = 16. In such a case, the participant would have to make large counting or calculation errors to change his or her primary code of R. Therefore, a cross-classification analysis was conducted to examine how often a self-scoring participant obtained the same primary interest area as a computerized count of like responses indicated. Finally, the results of a questionnaire answered by participants were examined. The questionnaire was designed to elicit feedback from participants regarding their understanding of the O*NET Interest Profiler, their perception of the measure, and the process followed to score the instrument.
Results
Reliability Table 3 presents the coefficient alphas obtained for both the O*NET Interest Profiler and the Interest-Finder. The O*NET Interest Profiler and Interest-Finder had very high internal consistency estimates across all the RIASEC scales. The reliability estimates, ranging from .93 to .96, are very similar across RIASEC scales and interest measures. Two different samples provided data for the stability (test-retest) analysis. Internal consistency analyses also were performed on the IP test-retest sample at Time 1 and Time 2. Table 4 depicts the coefficient alphas obtained for these two occasions, as well as the means and standard deviations. These reliability estimates are very similar to the estimate obtained from the main sample, ranging from 0.93 to 0.97 on the first occasion of testing and from 0.91 to 0.97 on the second occasion. 5
Table 5 shows the test-retest results for both the O*NET Interest Profiler and Interest-Finder. Entries in the table depict the correlation between item responses on the two different testing occasions. The test-retest correlations for the O*NET Interest Profiler ranged from 0.81 to 0.92. For the Interest-Finder the test-retest correlations ranged from 0.79 to 0.88. Higher correlations between the two testing occasions exist for the Interest-Profiler when compared to the correlations for the Interest-Finder, except for slightly higher correlations between items on the Realistic and Investigative scales for the Interest-Finder. These results indicate that, at least for this sample, the O*NET Interest Profiler is generally more stable over time than the Interest-Finder. Validity In a factor approach to representing Holland's RIASEC model, the first factor extracted is usually a general factor, followed by two substantive factors that define the circular order of the RIASEC types. A general factor is indicated when all RIASEC scales load highly and positively. Jackson (1977), Prediger (1982), and Rounds and Tracey (1993) consider the general factor to be a response bias factor confounding the observed relations among the interest scales and inflating (or deflating) the size of the RIASEC scale scores. In other words, there is an endorsement of the items of an interest area in a particular fashion based on an initial impression or tendency. We examined the presence of the general factor in the relations among the RIASEC types for the O*NET Interest Profiler and the Interest-Finder. Because the O*NET Interest Profiler was designed to minimize a yeah-saying and nay-saying response style, it is expected that the general factor from the O*NET Interest Profiler will be smaller than the general factor extracted from the Interest-Finder. A principal components analysis was used to extract the factors separately from the O*NET Interest Profiler and Interest-Finder correlation matrices (n = 1061). Research has demonstrated that a large general factor is indicative of response bias. For the O*NET Interest Profiler, the first three eigenvalues and percent of total variance accounted for (in parentheses) are 2.62 (43.60%), 1.03 (17.10%), and .87 (14.49%). For the Interest-Finder, the first three eigenvalues and percent of total variance accounted for (in parentheses) are 2.97 (49.47%), .96 (16.05%), and .78 (13.01%). As expected, these results show that Interest-Finder has a larger general factor than the O*NET Interest Profiler. Prediger (1982; also, see Rounds & Tracey, 1993) has established a benchmark for the size of the general factor and the substantive factors. Prediger found that across 24 RIASEC data sets (including all established RIASEC inventories), the general factor accounted for, on average, 41 percent of the variance, and the substantive factors accounted for, on average, 36 percent of the variance. Comparing these benchmarks to results from the O*NET Interest Profiler and Interest-Finder, analysis indicates that the size of the O*NET Interest Profiler general factor and substantive factors are similar to what has been found for other RIASEC inventories.
6

Table 6 illustrates the results of the cross-correlations between the O*NET Interest Profiler and the Interest-Finder on each of the six RIASEC scales. One would expect the highest correlations to be on the main diagonal of the table; that is, the highest correlations should be found between O*NET Interest Profiler and Interest-Finder scales measuring the same type. As shown in Table 6, the highest correlations are in the main diagonal, compared to the off-diagonal correlations, supporting the convergent validity of the two measures. The lowest cross-correlation was between the Enterprising scales (r = .73), a preliminary indication that the Enterprising scale may be assessing slightly different domains for the two measures. Because of the circular nature of Holland’s RIASEC model, it is expected that the correlations decrease as the scales move further away from each other. In other words, one would expect the correlation between the Realistic scale and the Investigative scale to be larger than the correlation between the Realistic scale and the Artistic scale, which would be larger than the correlation between the Realistic scale and the Social scale. Similarly, since the scales theoretically compose a circular structure, one would expect that the correlation between the Realistic scale and the Conventional scale would be approximately as large as the correlation between the Realistic and Investigative scale. The intercorrelations of scales within each measure are presented in Table 7 along with results of the randomization test of hypothesized order. The results of the randomization test are indicated in the footnote and labeled as CI, to denote the Correspondence Index. This number ranges from -1.00 to +1.00 reflecting how well predictions derived from the circular model are met by the data. A +1.00 indicates a perfect model-data fit. The fact that for the O*NET Interest Profiler the CI is only 0.40, but for the Interest-Finder the CI is 0.60, indicates that the hypothesized circular structure does not fit the O*NET Interest Profiler as well as it fits the Interest-Finder. The circular-order correlation pattern holds with a few exceptions for most of the O*NET Interest Profiler and Interest-Finder scales. The intercorrelations obtained for the O*NET Interest Profiler suggest a problem with the Enterprising scale: the correlation between this scale and the Artistic scale (positioned alternately) is higher than the correlation between this scale and the Social scale (positioned adjacently). An anomaly is also suggested by the low intercorrelation between the Realistic and Conventional scales and the high correlation between the Realistic and Enterprising scales for both the O*NET Interest Profiler and Interest-Finder. Table 8 displays the coordinates in two dimensions of the multidimensional scaling conducted separately on the O*NET Interest Profiler intercorrelation matrix and the Interest-Finder intercorrelation matrix. A two-dimensional solution fits the data well, explaining 94% of the variation in the O*NET Interest Profiler and all of the variation in the Interest-Finder. Figure 1 and Figure 2 graphically display the scale values for the O*NET Interest Profiler and the Interest-Finder, respectively. A circular RIASEC structure is evident for both measures. For the O*NET Interest Profiler, the Enterprising scale is found toward the center of the plot, reflecting its stronger than expected relation with the Realistic and Artistic scales. For the Interest-Finder, the Social and Enterprising scales are found almost on top of each other, indicating that these scales do not show the differentiation expected from Holland’s model. In addition, for both measures, the distance between the Realistic scale and the Conventional scale is greater than would be expected given a circular structure. Table 9 shows the results of 7
the multidimensional scaling (RSQ = .95) conducted on the O*NET Interest Profiler and the Interest-Finder RIASEC intercorrelations. Figure 3 graphically displays these results. Inspection of Figure 3 shows that the corresponding RIASEC scales of the Profiler and Finder cluster together in a circular fashion. The results of the profile analysis are given in Table 10 along with the means and standard deviations for each of the scales on both the Interest-Finder and the O*NET Interest Profiler. A significant interaction term is present, indicating that the two measures are not as comparable as one would like. Figure 4 graphs the mean scores for each of the scales on the two interest measures. Although means for the Investigative, Artistic, and Social scales for the two measures are very similar, there is a discrepancy in the means for the other three scales, with the largest difference observed in the Enterprising scales and the next largest between the Realistic scales. Table 11 illustrates the results of the cross-classification analysis on primary code agreement from the two measures. The O*NET Interest Profiler and Interest-Finder simultaneously classified only 39 participants as primarily Enterprising individuals. Furthermore, although the O*NET Interest Profiler classified only 63 subjects as primarily Enterprising, the Interest-Finder classified 175 individuals as primarily Enterprising. Individuals classified as primarily Enterprising by the Interest-Finder, but not the O*NET Interest Profiler, were classified into all other primary codes by the O*NET Interest Profiler, with the distribution among Investigative, Artistic, Social, and Conventional being fairly even. One also finds a large number of individuals, classified as primarily Social by the O*NET Interest Profiler, who are classified as either primarily Conventional, Enterprising, or Investigative by the Interest-Finder. Table 11 also presents the classification patterns in terms of agreement and disagreement between the two measures on high code classifications. The E Scale Based on the results of the Interest-Finder and the final distribution among the RIASEC interest types in the IP, it appeared that participants who should be classified as primarily Enterprising according to the IF may be classified into some other category, particularly S. The mean endorsement level of E items was also significantly lower on the IP than on the IF. We tested two speculations about the source of the problem. The first idea, called the low-prestige problem, suggests that the E scale’s failure to congeal might come from the IP scale development efforts to include items from all educational levels in each scale. Thus, the O*NET Interest Profiler includes many low-level sales jobs as items, while the Interest-Finder focuses on business management, ownership, and law. Training level is highly related to prestige, and test-takers often respond to the prestige level of an occupation. The O*NET Interest Profiler introduces more variations of prestige into the Enterprising category, and perhaps, in the process loses conceptual uniformity. Thus, low endorsement of the low prestige E items might be the heart of the problem. 8
The second and related suspicion was that the low-level E items embraced not only E-type activities, such as sales, but also activities strongly associated with other types. For example, a person endorsing a liking for the job of salesperson at a music store (item 57) probably responds to the Enterprising, Artistic, and Social nature of the work. Requiring more of a jack-of-all-trades orientation, E jobs at the lower levels of prestige and education are often less pure exemplars of one type or another than jobs at higher levels. If this is true of O*NET Interest Profiler items, one should expect to see endorsement patterns spread across the six types rather than concentrated in E. This was the muddy-item hypothesis. To test these speculations, the mean training level requirement ratings of the IP (please see Lewis, P., & Rivkin, D. [1999]. Development of the O*Net Interest Profiler for detailed description of the ratings) were identified. These range from 1 (low training level) to 5 (high training level). Next, each of the 30 O*NET Interest Profiler E-scale items was correlated with the Interest-Finder RIASEC scale means for the total sample (n = 1061). We then asked the question, "Does the training level predict the correlation between the IP item and the Interest-Finder E scale?" The answer was a resounding yes, represented by a correlation of .78 (p < .001). The training level accounted for 61 percent of the variation in strength of association between the IP E items and the IF E scale. This indicates that items at the higher levels of training are much more highly correlated with the IF E scale than items at the lower levels of training. This analysis supports our low-prestige-problem hypothesis. Inspection of the correlation matrix between IP E items and IF scale means across the six types, Table 12, also supports the muddy-item hypothesis. At the low training level, each item is correlated about equally with three or more different types, while at high training levels, the correlations with the E scale are strongest. For example, for item number 34 at the lowest training level, “Run a stand that sells newspapers and magazines,” correlations for the five IF mean scales, Realistic, Artistic, Social, Enterprising, and Conventional, are all between .17 and .19, making the item undifferentiating. For item 129, at the highest level of training, “Represent a client in a lawsuit,” the correlation with the Enterprising IF scale is .60, followed in magnitude by a .38 with the adjacent Social scale and much lower correlations with the rest of the scales. Scoring and User Feedback The O*NET Interest Profiler and Interest-Finder have two different formats for self-scoring. With the O*NET Interest Profiler, a participant counts the number of likes across rows. There are two rows for each RIASEC code across four pages. The rows are color-coded corresponding to the six types: for example, green rows are Realistic and blue rows are Conventional. For self-scoring, the participant is first instructed to count the number of likes for both color-coded rows on the first two pages, a total of 14 items, and to write that number in the first color-coded box on the scoring flap. Second, the participant is told to count the number of likes for both color-coded rows on the next two pages, a total of 16 items, and to write that number in the second color-coded box on the inside scoring flap. Finally, the participant is instructed to add the two numbers 9
in same color-coded boxes: for example, the two numbers in the green boxes are added for a total score for the Realistic scale. With the Interest-Finder, a participant counts the number of likes down one of six columns. There are six columns, each having 40 items, each on a separate page. Each column or page corresponds to a RIASEC type. Once the participant has recorded the number of likes for each of the six types, he or she is asked to transfer the number of likes to a separate page, and then the participant is asked to determine a gender-specific percentile score for each of the six types. A difference score was calculated to determine whether a participant counted the number of likes correctly. The difference score equals the “true” score minus the participant’s self-score. A true score was calculated by a computerized count of the number of like responses. When the difference score is positive or negative, a miscount by the participant occurred. A positive difference score showed that the participant over counted; that is, the participant recorded more than the actual count of like responses. A negative difference score showed that the participant under counted; that is, the participant recorded too few like responses. Table 13 through Table 15 show the O*NET Interest Profiler distribution of difference scores by RIASEC total score and subscores. Table 16 shows the Interest-Finder distribution of difference scores by RIASEC total score. For the 512 participants who self-scored the O*NET Interest Profiler, only 3 failed to record total scores. As shown in Table 13 through Table 15, the difference subscores show that 14 to 17 participants, depending on the RIASEC scale, failed to record subscores. The disparity between the number of missing total score and subscores indicated that a few participants counted across all four pages and then recorded their total self-score. In comparison, many more participants failed to record total self-scores on the Interest-Finder. As shown in Table 16, 44 to 51 participants, depending on the RIASEC scale, did not record their total score. Overall, the total difference scores for the O*NET Interest Profiler (see Table 13 through Table 15) show 78% to 82% of the participants, depending on the RIASEC category, correctly counted and added their like responses. Ninety percent of the participants had an accurate count within +1 or –1. When participants miscounted, they tended to under count the number of like responses. Examining the difference subscores shows that the two scores within RIASEC category had a similar distribution. Neither the first nor second subscore shows more or fewer counting errors. The subscores also indicate a similar pattern of under counting the number of like responses. The Interest-Finder distribution of difference scores in Table 16 shows that 89% to 92% of the participants, depending on the RIASEC scale, correctly counted the number of like responses. If the number of times participants failed to record the total score is taken into consideration, the percentages of correct counts decreases to 81% to 84%, a self-scoring accuracy similar to the O*NET Interest Profiler. The second possible self-scoring error concerned how accurate the participants were in adding the O*NET Interest Profiler subscores. Table 17 displays the results of the miscalculation analysis. The difference score equals the “true” score minus the 10
participant’s total self-score. A true score was calculated by a computerized addition of the participant’s subscores. Almost all participants accurately calculated their total RIASEC scores. Miscalculation led to few errors. Table 18 depicts the results of the cross classification analysis conducted on the self-scored version of the O*NET Interest Profiler. The high-point Holland code from the self-scored version was compared to the high-point Holland code from a computerized count (called the true score) of the participant’s like responses. The two scores were compared to evaluate the overall effects of the self-scoring on the participant’s primary RIASEC code. These results show little disagreement between the primary codes obtained from self-scored reports and computerized counts. Likewise, there is little disagreement between the primary codes obtained from self-scored reports and the computerized counts for the Interest-Finder. These results are displayed in Table 19 and suggest that self-scoring was an accurate method. Table 20 summarizes the results of the survey questions designed to elicit feedback from participants regarding instructions for scoring the O*NET Interest Profiler. The majority of participants felt the instructions were clear and the picture example was helpful. Moreover, most of the participants stated that they completed the O*NET Interest Profiler as directed and that they double-checked their counting and arithmetic when scoring their inventory. Table 21 summarizes the results of the survey questions designed to elicit feedback from participants regarding their perception of the O*NET Interest Profiler. Approximately 65% of participants stated they had not taken an interest survey similar to the O*NET Interest Profiler before. Approximately 75% of participants stated they would be interested in taking the final form of the O*NET Interest Profiler. Overall, 82% of the participants stated that they would recommend taking the O*NET Interest Profiler to friends. The majority of participants felt the items were interesting, up-to-date, and included a variety of work activities. Results were similar for participants who took the self-scoring version of the O*NET Interest Profiler and those who took the non-scoring version.
Discussion The psychometric properties of the O*NET Interest Profiler were evaluated and compared to the psychometric properties of the Interest-Finder. The reliabilities of both measures were found to be adequate for individual assessment and career counseling. The construct validity of the O*NET Interest Profiler scales was supported, indicating that O*NET Interest Profiler scales measured Holland’s RIASEC constructs. Finally, the innovative self-administering, self-scoring format of the O*NET Interest Profiler yielded accurate interest scores. The internal reliability of both measures was acceptable. The internal consistency reliability estimates varied little among RIASEC scale and between interest measure, indicating that scales and measures are equally reliable. The other reliability statistic, 11
stability of results over two testing occasions, showed the O*NET Interest Profiler to be more stable than the Interest-Finder on four scales and almost equally stable on the other two scales. The Interest-Finder had a general factor that was larger than the general factor of the O*NET Interest Profiler. The Interest-Finder general factor was also larger than what is usually identified in RIASEC measures (cf. Rounds & Tracey, 1993). Jackson (1977) considers the general factor to be a response bias factor that confounds the observed relations among RIASEC scales and lowers the validity of the scales. The tendency to respond “like” in an undifferentiated manner is most likely due to the format of the Interest-Finder. The Interest-Finder requires individuals to respond to a list of items belonging to each scale at one time, after reading a brief description of what the scale means. With this type of format, it is easy for examinees to read first the description of the scale and decide whether or not that describes them before proceeding, with a resultant tendency to mark all the items in the list similarly. The O*NET Interest Profiler format, in contrast to the Interest-Finder, mixes items from the six scales and does not provide scale descriptions. Test-takers are more likely to consider each item separately, reducing response bias. The data did not support a coherent IP Enterprising scale. This suggests that the Enterprising scale can be improved. Based on the results of the Interest-Finder and the final distribution among the RIASEC interest types, it appears that participants who should be classified as primarily Enterprising may be classified into some other category. Furthermore, what other category they are classified into seems to be random. This lack of coherence may come from the efforts of O*NET Interest Profiler designers to include items from all prestige and educational levels in each scale. Thus, the O*NET Interest Profiler includes many low-level sales jobs as items, while the Interest-Finder focuses on business management, ownership, and law. Items with low training levels showed nontrivial relationships to scales other than E, indicating that they were not serving as good measures of Enterprising types. The O*NET Interest Profiler introduces more variability into the Enterprising category and perhaps in the process loses conceptual unity. A similar process may lie behind the difference in Realistic means for the Profiler and the Finder, though Profiler efforts to develop high-status items for the Realistic code were less successful than efforts in the opposite direction for the Enterprising scale. Future research may want to concentrate on the enhancement of the Enterprising scale, perhaps modifying the Realistic scale as well. A caveat is necessary. Using another RIASEC inventory as a benchmark, as was done with the Interest-Finder, would likely lead to different results and conclusions. RIASEC inventories yield different score distributions of high-point codes. For example, the Self-Directed Search (Holland, Fritzsche, & Powell, 1994) norm tables show that Social is the high point code for approximately 50% of the female normative sample and only 18% of the male normative sample. Also, the analysis—profile and cross-classification—is a rigorous analysis that few test authors would attempt. We examined the manuals of major RIASEC inventories, finding no profile or cross-classification comparisons between RIASEC inventories.
12
Another potentially meaningful contrast between the two measures studied here concerns item types. The Interest-Finder, under each of the six scale labels, asks test-takers to respond to three types: activities, training courses or classes, and titles of occupations. These last two types of items bring to the foreground matters of academic comfort and occupational prestige, matters likely to affect many test-takers’ “like” or “dislike” responses. Though level of education and prestige are sometimes unavoidable components, they are less prominent in lists of work activities only, which compose the O*NET Interest Profiler. O*NET Interest Profiler responses, then, may be freer of factors the inventory does not seek to measure. The gap between the Realistic and Conventional types for both the O*NET Interest Profiler and Interest-Finder, seen in both the multidimensional scaling and in intercorrelation matrices, has also been found in data from other Holland-type measures (Day, Rounds, & Swaney, 1998; Rounds & Tracey, 1993, 1996). Whether this gap reflects the nature of vocational interest structure or the choice of items within the scales is still unknown. Participants viewed the O*NET Interest Profiler as interesting, easy to score, and beneficial, which suggests people will be apt to use the instrument and satisfied with its results. Self-scoring proves to be accurate. All in all, the O*NET Interest Profiler is an interest inventory that should prove helpful to those trying to decide upon a career choice or career move. Future research will investigate the feasibility of reducing the length of the O*NET Interest Profiler while maintaining reliability and validity. Such a reduction would shorten administration time and ease the scoring process, while the Enterprising scale could be consolidated.
13
References
Day, S. X., Rounds, J., & Swaney, K. (1998). The structure of vocational interests for diverse racial-ethnic groups. Psychological Science, 9, 40-44.
Defense Manpower Data Center (1995). ASVAB 18/19 counselor manual.
Monterey, CA: Author. Holland, J. L. (1997). Making vocational choices: A theory of vocational
personalities and work environments (3rd ed.). Odessa, FL: Psychological Assessment Resources, Inc.
Holland, J. L., Fritzsche, B. A., & Powell, A. B. (1994). Self-Directed Search
technical manual. Odessa, FL: Psychological Assessment Resources, Inc. Jackson, D. N. (1977). Manual for the Jackson Vocational Interest Survey. Port
Huron, MI: Research Psychologists Press. Lewis, P., & Rivkin, D. (1999). Development of the O*NET Interest Profiler.
Raleigh, NC: National Center for O*NET Development. National Center for O*NET Development. (1999). O*NET Interest Profiler.
Raleigh, NC: Author. Prediger, D. J. (1982). Dimensions underlying Holland's hexagon: Missing link
between interests and occupations? Journal of Vocational Behavior, 21, 259-287. Rounds, J., & Tracey, T. J. (1993). Prediger's dimensional representation of
Holland's RIASEC circumplex. Journal of Applied Psychology, 78, 875-890. Rounds, J., & Tracey, T. J. (1996). Cross-cultural structural equivalence of
RIASEC models and measures. Journal of Counseling Psychology, 43, 310-329. Rounds, J., Tracey, T. J., & Hubert, L. (1992). Methods for evaluating vocational
interest structural hypotheses. Journal of Vocational Behavior, 40, 239-259.
14

Tables
15
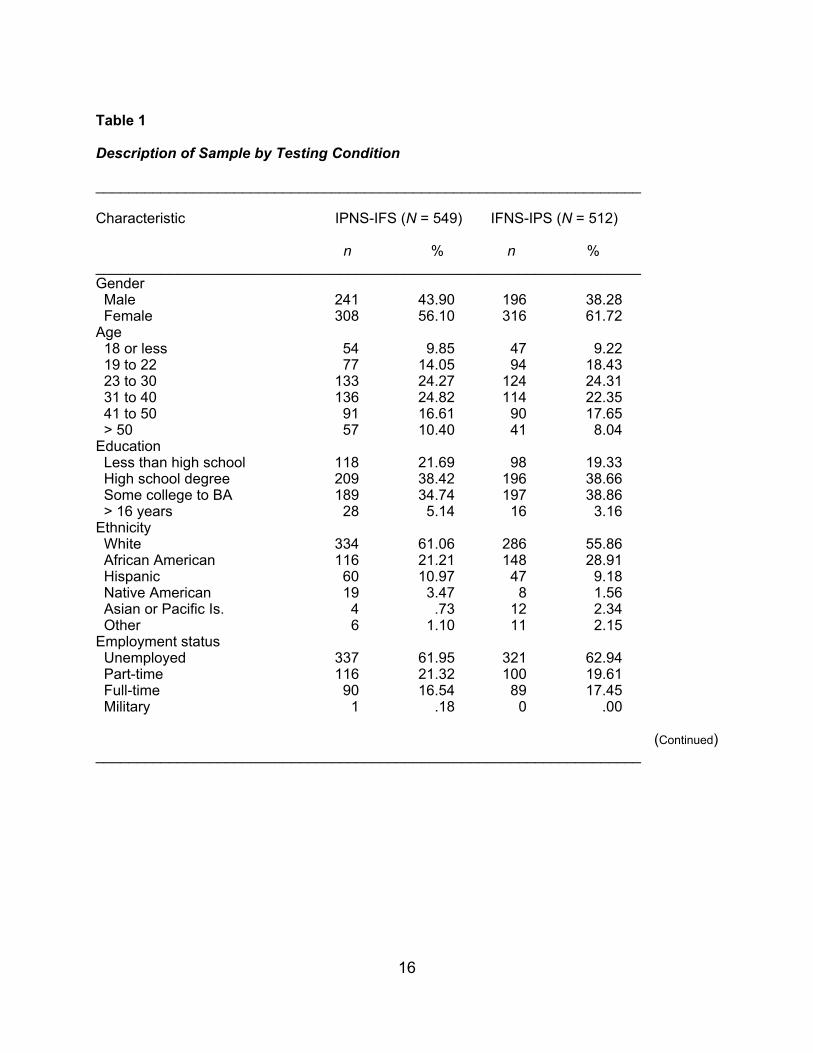
Table 1 Description of Sample by Testing Condition ___________________________________________________________________ Characteristic IPNS-IFS (N = 549) IFNS-IPS (N = 512) n % n % ___________________________________________________________________ Gender Male 241 43.90 196 38.28 Female 308 56.10 316 61.72 Age 18 or less 54 9.85 47 9.22 19 to 22 77 14.05 94 18.43 23 to 30 133 24.27 124 24.31 31 to 40 136 24.82 114 22.35 41 to 50 91 16.61 90 17.65 > 50 57 10.40 41 8.04 Education Less than high school 118 21.69 98 19.33 High school degree 209 38.42 196 38.66 Some college to BA 189 34.74 197 38.86 > 16 years 28 5.14 16 3.16 Ethnicity White 334 61.06 286 55.86 African American 116 21.21 148 28.91 Hispanic 60 10.97 47 9.18 Native American 19 3.47 8 1.56 Asian or Pacific Is. 4 .73 12 2.34 Other 6 1.10 11 2.15 Employment status Unemployed 337 61.95 321 62.94 Part-time 116 21.32 100 19.61 Full-time 90 16.54 89 17.45 Military 1 .18 0 .00
(Continued) ___________________________________________________________________
16
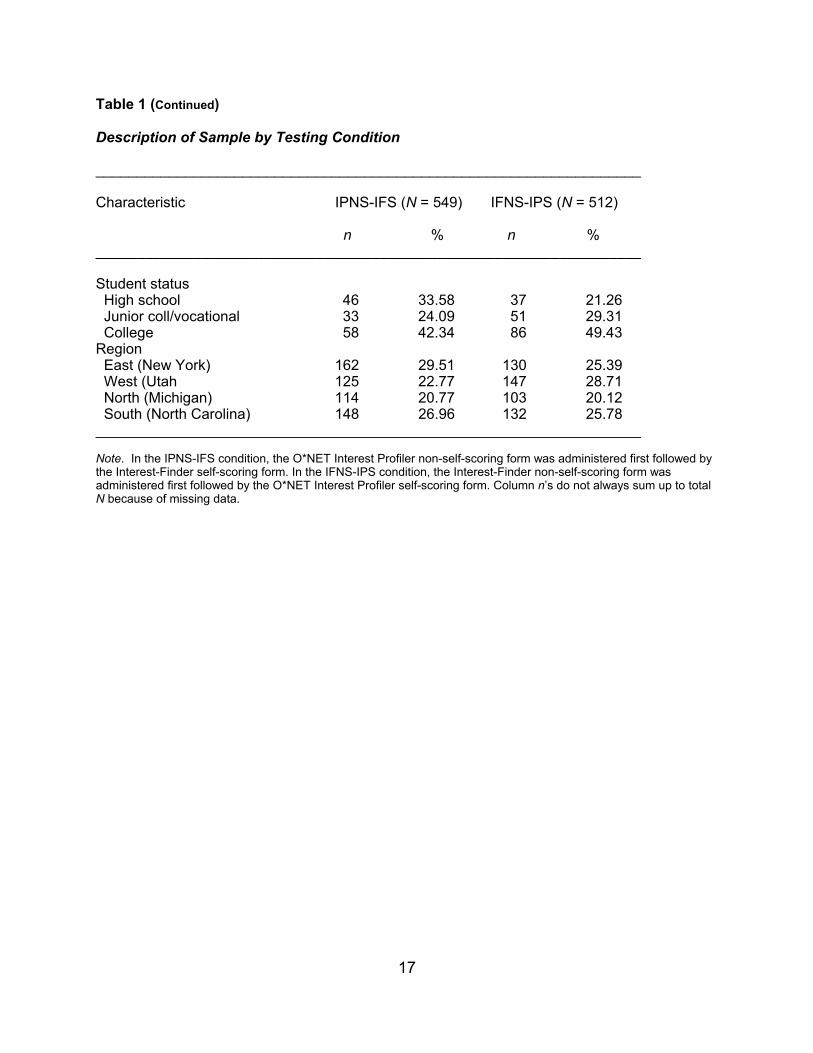
Table 1 (Continued) Description of Sample by Testing Condition
___________________________________________________________________ Characteristic IPNS-IFS (N = 549) IFNS-IPS (N = 512) n % n % ___________________________________________________________________ Student status High school 46 33.58 37 21.26 Junior coll/vocational 33 24.09 51 29.31 College 58 42.34 86 49.43 Region East (New York) 162 29.51 130 25.39 West (Utah 125 22.77 147 28.71 North (Michigan) 114 20.77 103 20.12 South (North Carolina) 148 26.96 132 25.78 ___________________________________________________________________ Note. In the IPNS-IFS condition, the O*NET Interest Profiler non-self-scoring form was administered first followed by the Interest-Finder self-scoring form. In the IFNS-IPS condition, the Interest-Finder non-self-scoring form was administered first followed by the O*NET Interest Profiler self-scoring form. Column n’s do not always sum up to total N because of missing data.
17
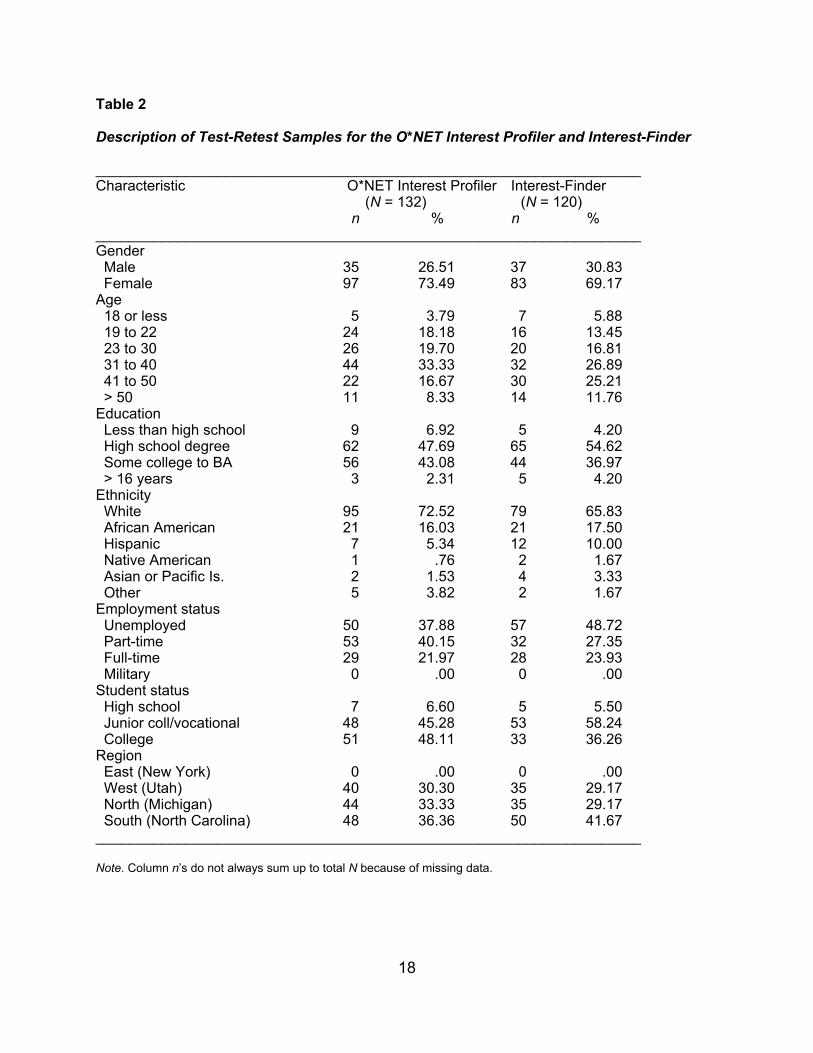
Table 2 Description of Test-Retest Samples for the O*NET Interest Profiler and Interest-Finder ___________________________________________________________________ Characteristic O*NET Interest Profiler Interest-Finder (N = 132) (N = 120) n % n % ___________________________________________________________________ Gender Male 35 26.51 37 30.83 Female 97 73.49 83 69.17 Age 18 or less 5 3.79 7 5.88 19 to 22 24 18.18 16 13.45 23 to 30 26 19.70 20 16.81 31 to 40 44 33.33 32 26.89 41 to 50 22 16.67 30 25.21 > 50 11 8.33 14 11.76 Education Less than high school 9 6.92 5 4.20 High school degree 62 47.69 65 54.62 Some college to BA 56 43.08 44 36.97 > 16 years 3 2.31 5 4.20 Ethnicity White 95 72.52 79 65.83 African American 21 16.03 21 17.50 Hispanic 7 5.34 12 10.00 Native American 1 .76 2 1.67 Asian or Pacific Is. 2 1.53 4 3.33 Other 5 3.82 2 1.67 Employment status Unemployed 50 37.88 57 48.72 Part-time 53 40.15 32 27.35 Full-time 29 21.97 28 23.93 Military 0 .00 0 .00 Student status High school 7 6.60 5 5.50 Junior coll/vocational 48 45.28 53 58.24 College 51 48.11 33 36.26 Region East (New York) 0 .00 0 .00 West (Utah) 40 30.30 35 29.17 North (Michigan) 44 33.33 35 29.17 South (North Carolina) 48 36.36 50 41.67 ___________________________________________________________________ Note. Column n’s do not always sum up to total N because of missing data.
18
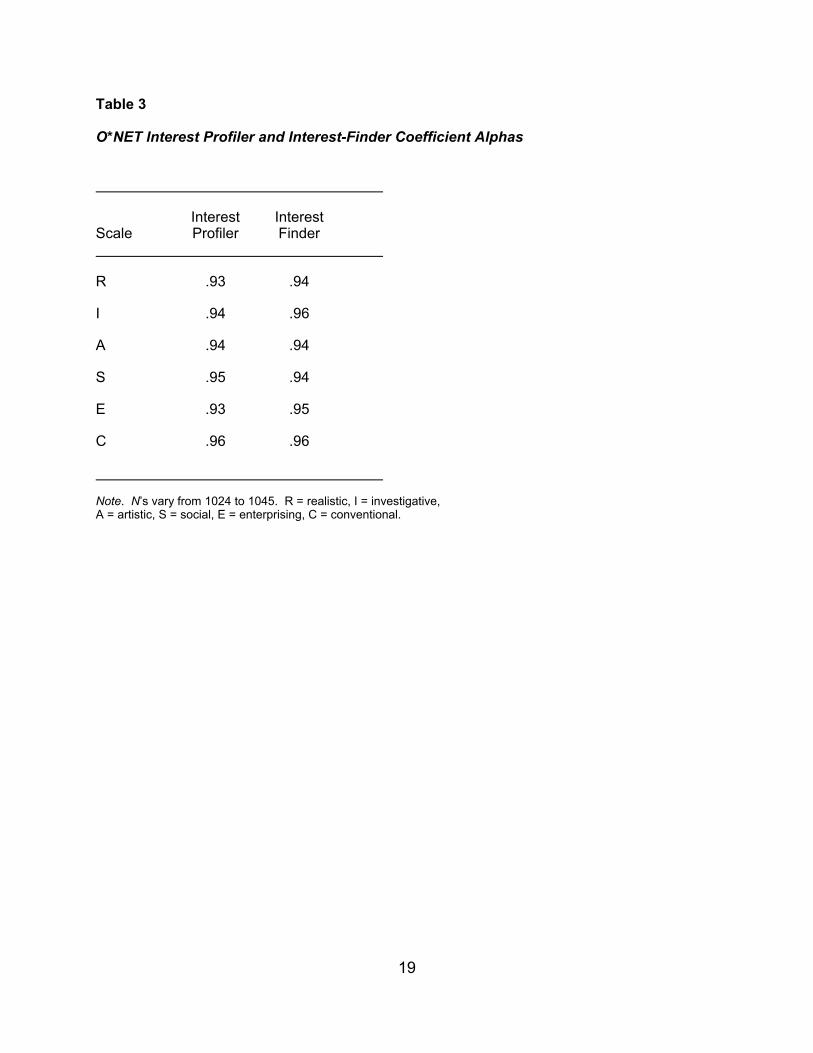
Table 3
O*NET Interest Profiler and Interest-Finder Coefficient Alphas
Interest Interest Scale Profiler Finder
R .93 .94
I .94 .96
A .94 .94
S .95 .94
E .93 .95
C .96 .96
Note. N’s vary from 1024 to 1045. R = realistic, I = investigative, A = artistic, S = social, E = enterprising, C = conventional.
19
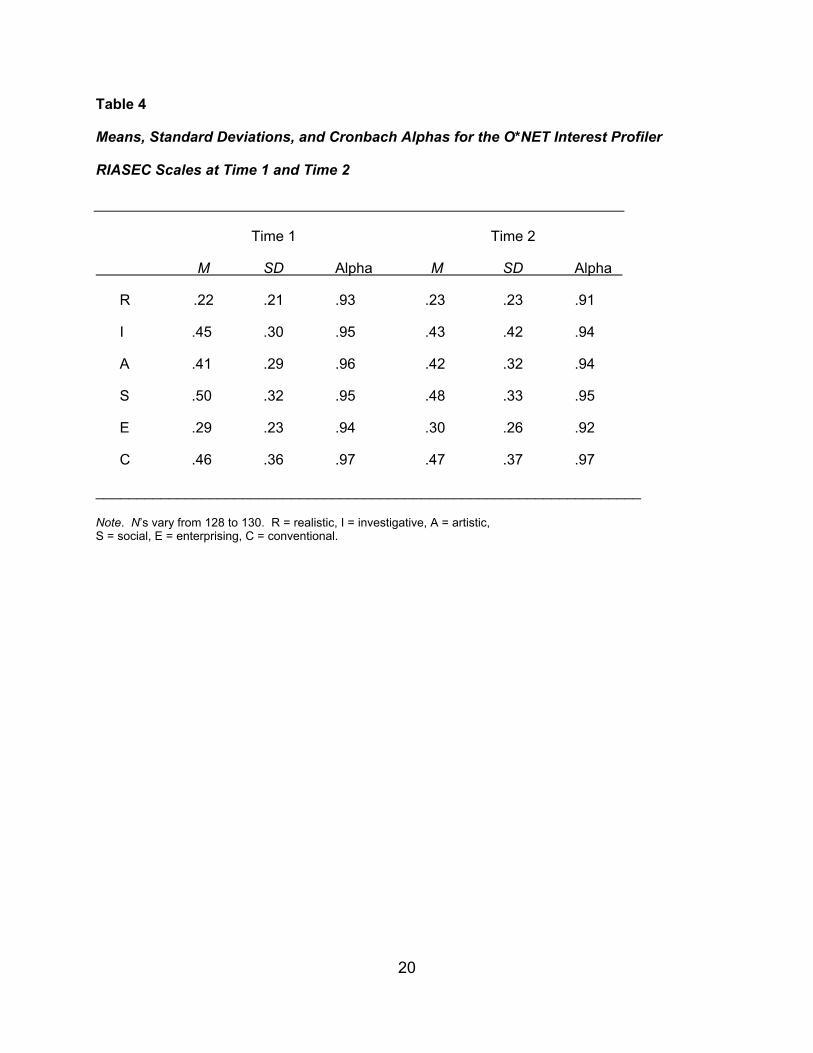
Table 4 Means, Standard Deviations, and Cronbach Alphas for the O*NET Interest Profiler
RIASEC Scales at Time 1 and Time 2
Time 1 Time 2
M SD Alpha M SD Alpha
R .22 .21 .93 .23 .23 .91
I .45 .30 .95 .43 .42 .94
A .41 .29 .96 .42 .32 .94
S .50 .32 .95 .48 .33 .95
E .29 .23 .94 .30 .26 .92
C .46 .36 .97 .47 .37 .97
___________________________________________________________________ Note. N’s vary from 128 to 130. R = realistic, I = investigative, A = artistic, S = social, E = enterprising, C = conventional.
20
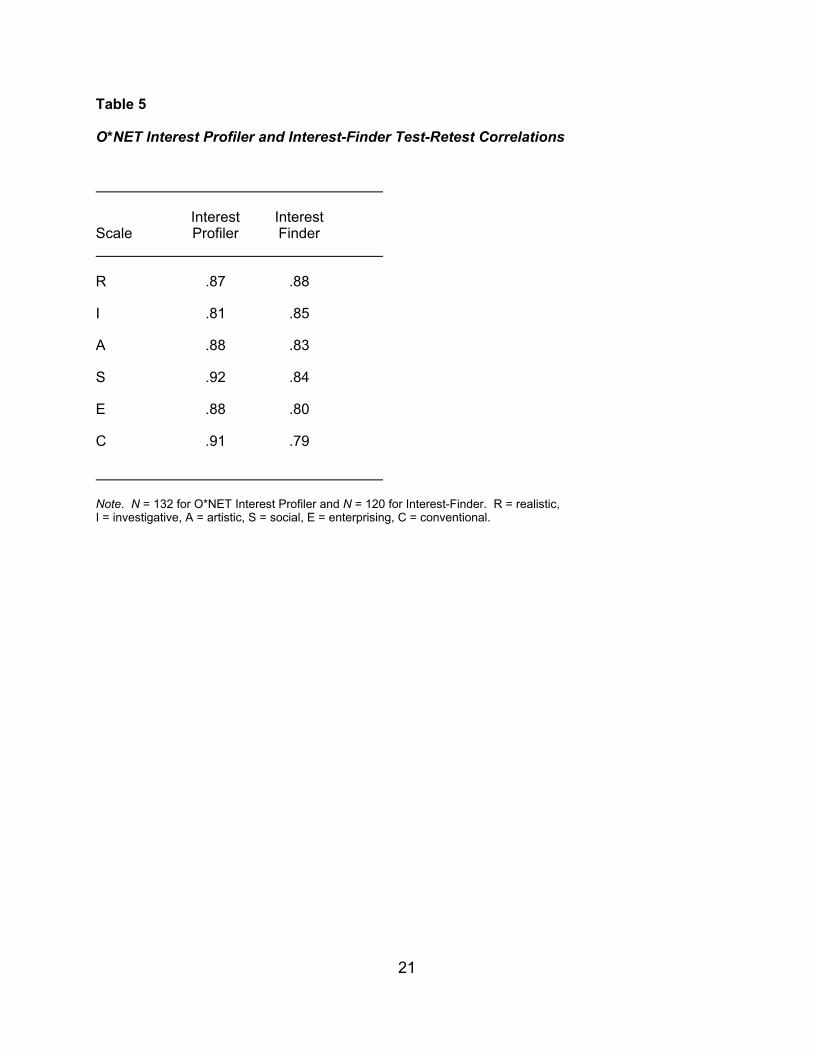
Table 5
O*NET Interest Profiler and Interest-Finder Test-Retest Correlations
Interest Interest Scale Profiler Finder
R .87 .88
I .81 .85
A .88 .83
S .92 .84
E .88 .80
C .91 .79
Note. N = 132 for O*NET Interest Profiler and N = 120 for Interest-Finder. R = realistic, I = investigative, A = artistic, S = social, E = enterprising, C = conventional.
21
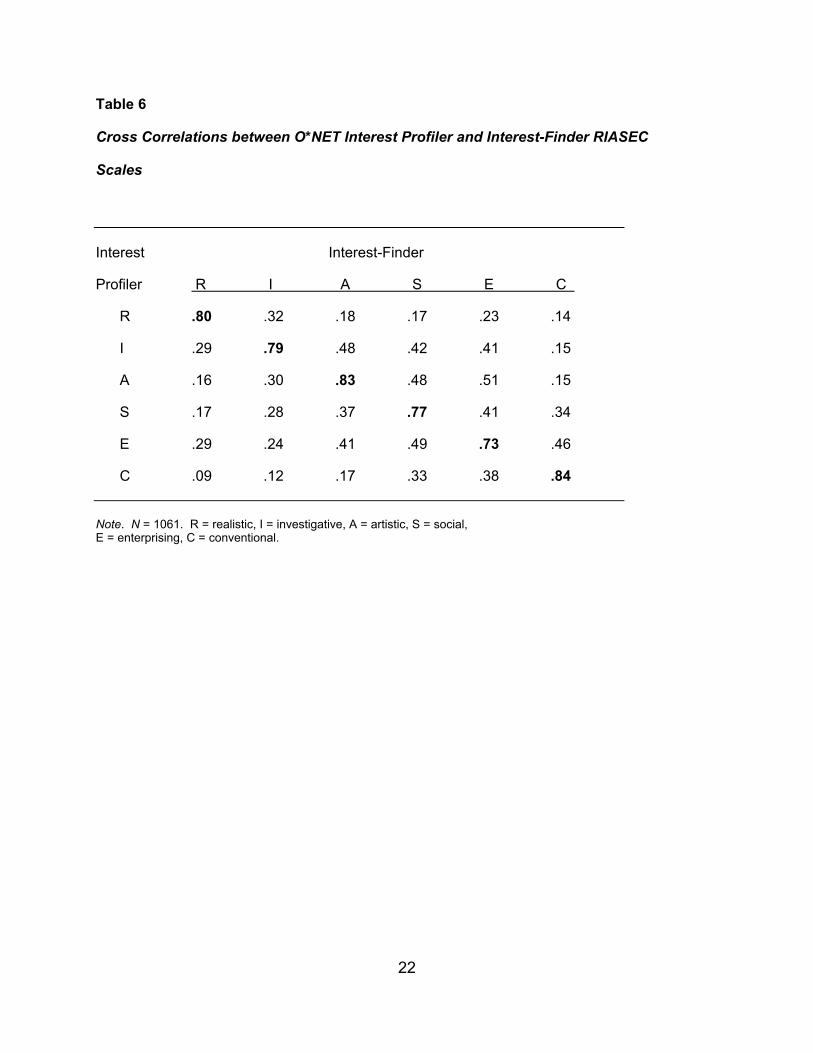
Table 6
Cross Correlations between O*NET Interest Profiler and Interest-Finder RIASEC
Scales
Interest Interest-Finder
Profiler R I A S E C
R .80 .32 .18 .17 .23 .14
I .29 .79 .48 .42 .41 .15
A .16 .30 .83 .48 .51 .15
S .17 .28 .37 .77 .41 .34
E .29 .24 .41 .49 .73 .46
C .09 .12 .17 .33 .38 .84
Note. N = 1061. R = realistic, I = investigative, A = artistic, S = social, E = enterprising, C = conventional.
22
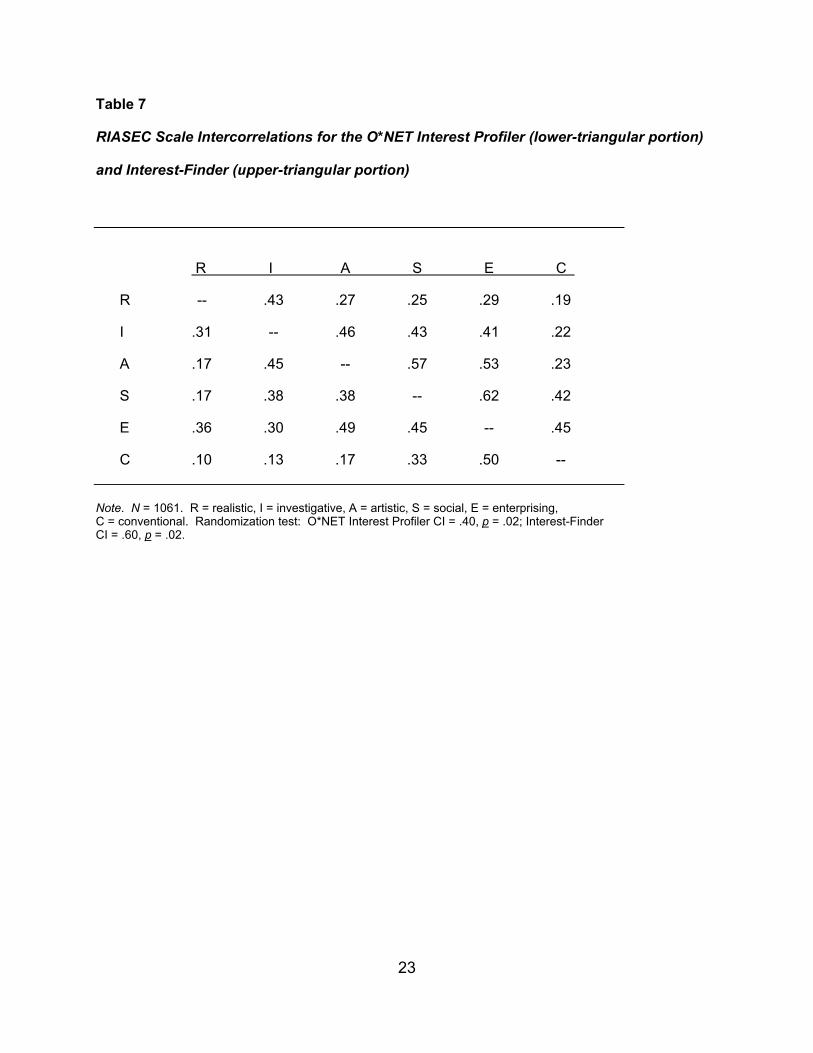
Table 7
RIASEC Scale Intercorrelations for the O*NET Interest Profiler (lower-triangular portion)
and Interest-Finder (upper-triangular portion)
R I A S E C
R -- .43 .27 .25 .29 .19
I .31 -- .46 .43 .41 .22
A .17 .45 -- .57 .53 .23
S .17 .38 .38 -- .62 .42
E .36 .30 .49 .45 -- .45
C .10 .13 .17 .33 .50 --
Note. N = 1061. R = realistic, I = investigative, A = artistic, S = social, E = enterprising, C = conventional. Randomization test: O*NET Interest Profiler CI = .40, p = .02; Interest-Finder CI = .60, p = .02.
23
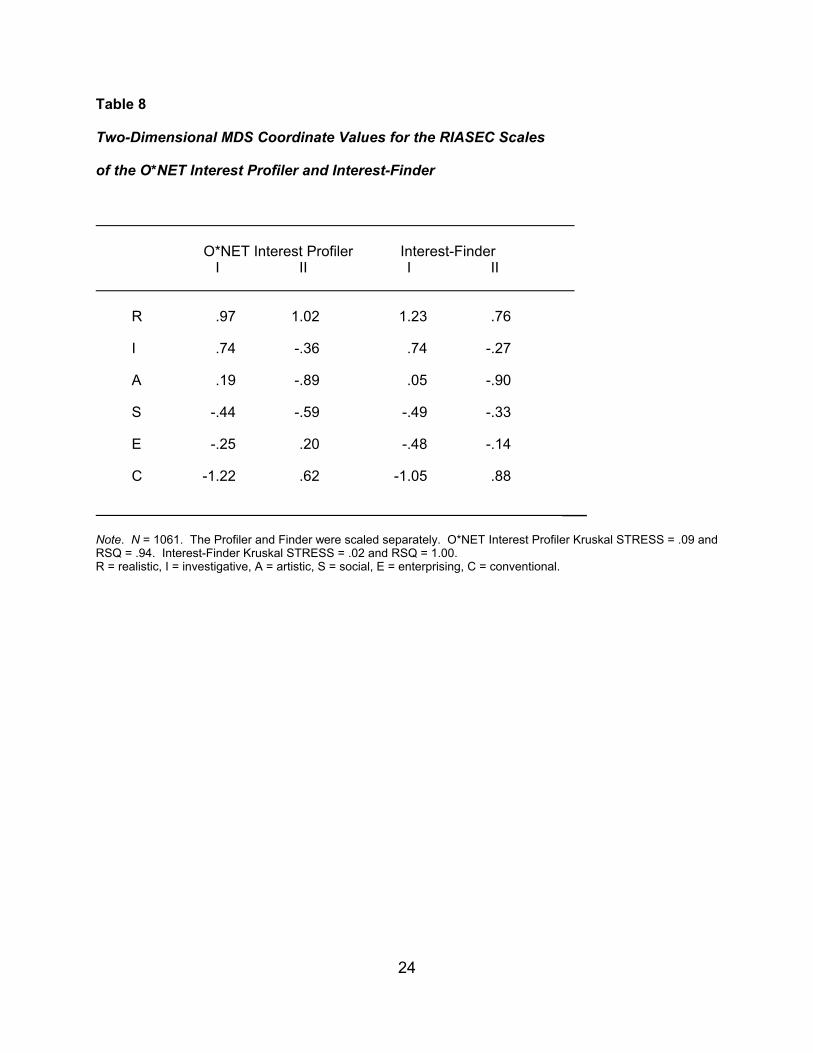
Table 8
Two-Dimensional MDS Coordinate Values for the RIASEC Scales
of the O*NET Interest Profiler and Interest-Finder
O*NET Interest Profiler Interest-Finder I II I II R .97 1.02 1.23 .76
I .74 -.36 .74 -.27
A .19 -.89 .05 -.90
S -.44 -.59 -.49 -.33
E -.25 .20 -.48 -.14
C -1.22 .62 -1.05 .88 ___ Note. N = 1061. The Profiler and Finder were scaled separately. O*NET Interest Profiler Kruskal STRESS = .09 and RSQ = .94. Interest-Finder Kruskal STRESS = .02 and RSQ = 1.00. R = realistic, I = investigative, A = artistic, S = social, E = enterprising, C = conventional.
24
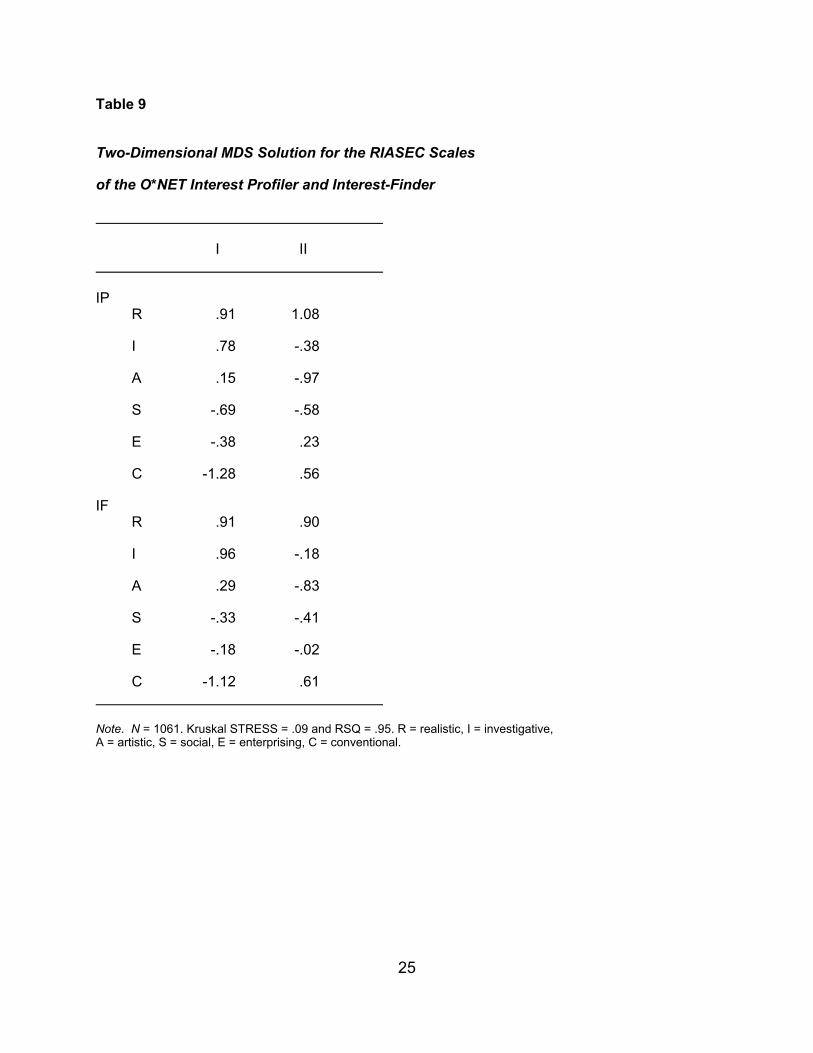
Table 9
Two-Dimensional MDS Solution for the RIASEC Scales
of the O*NET Interest Profiler and Interest-Finder
I II IP R .91 1.08
I .78 -.38
A .15 -.97
S -.69 -.58
E -.38 .23
C -1.28 .56
IF R .91 .90
I .96 -.18
A .29 -.83
S -.33 -.41
E -.18 -.02
C -1.12 .61 Note. N = 1061. Kruskal STRESS = .09 and RSQ = .95. R = realistic, I = investigative, A = artistic, S = social, E = enterprising, C = conventional.
25
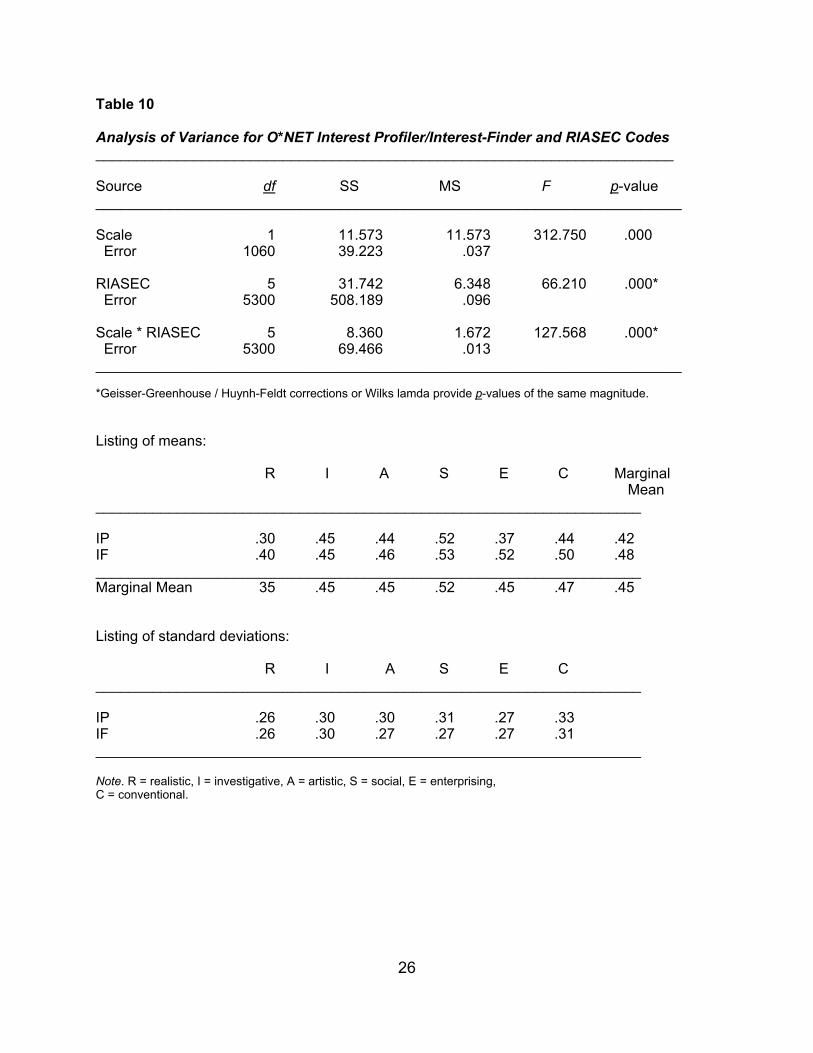
Table 10 Analysis of Variance for O*NET Interest Profiler/Interest-Finder and RIASEC Codes _______________________________________________________________________ Source df SS MS F p-value ________________________________________________________________________ Scale 1 11.573 11.573 312.750 .000 Error 1060 39.223 .037 RIASEC 5 31.742 6.348 66.210 .000* Error 5300 508.189 .096 Scale * RIASEC 5 8.360 1.672 127.568 .000* Error 5300 69.466 .013 ________________________________________________________________________ *Geisser-Greenhouse / Huynh-Feldt corrections or Wilks lamda provide p-values of the same magnitude. Listing of means: R I A S E C Marginal Mean ___________________________________________________________________ IP .30 .45 .44 .52 .37 .44 .42 IF .40 .45 .46 .53 .52 .50 .48 ___________________________________________________________________ Marginal Mean 35 .45 .45 .52 .45 .47 .45 Listing of standard deviations: R I A S E C ___________________________________________________________________ IP .26 .30 .30 .31 .27 .33 IF .26 .30 .27 .27 .27 .31 ___________________________________________________________________ Note. R = realistic, I = investigative, A = artistic, S = social, E = enterprising, C = conventional.
26
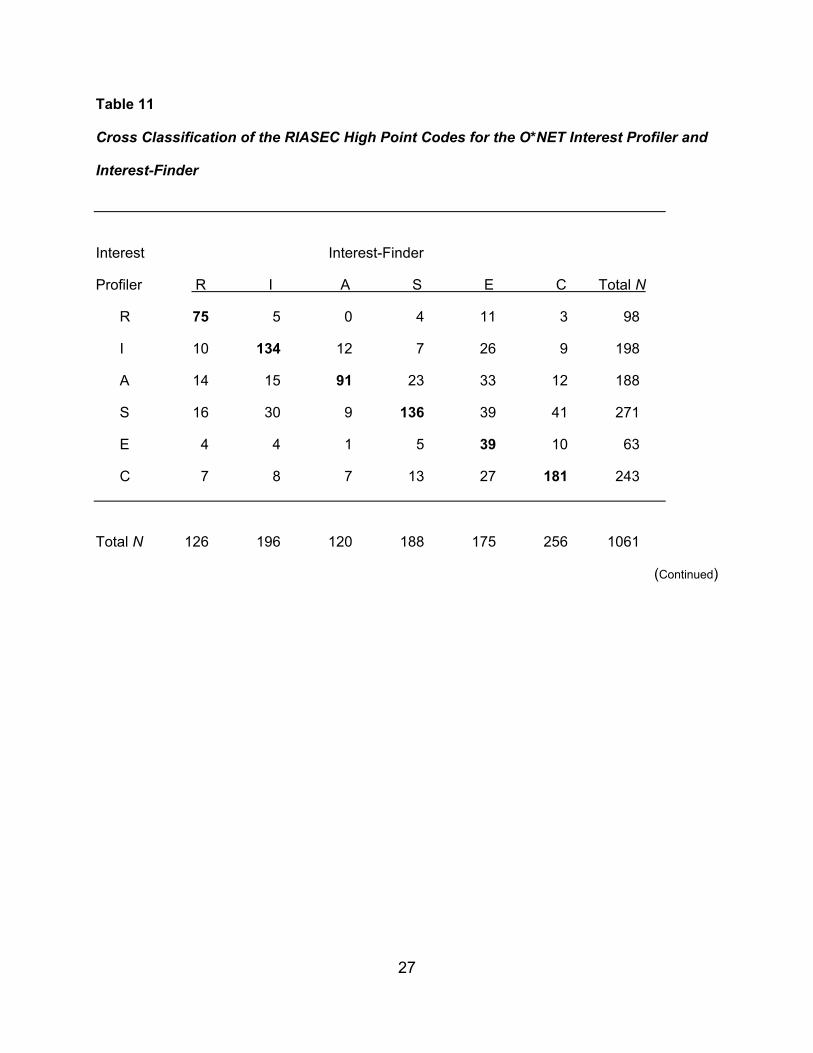
Table 11
Cross Classification of the RIASEC High Point Codes for the O*NET Interest Profiler and
Interest-Finder
Interest Interest-Finder
Profiler R I A S E C Total N
R 75 5 0 4 11 3 98
I 10 134 12 7 26 9 198
A 14 15 91 23 33 12 188
S 16 30 9 136 39 41 271
E 4 4 1 5 39 10 63
C 7 8 7 13 27 181 243
Total N 126 196 120 188 175 256 1061
(Continued)
27
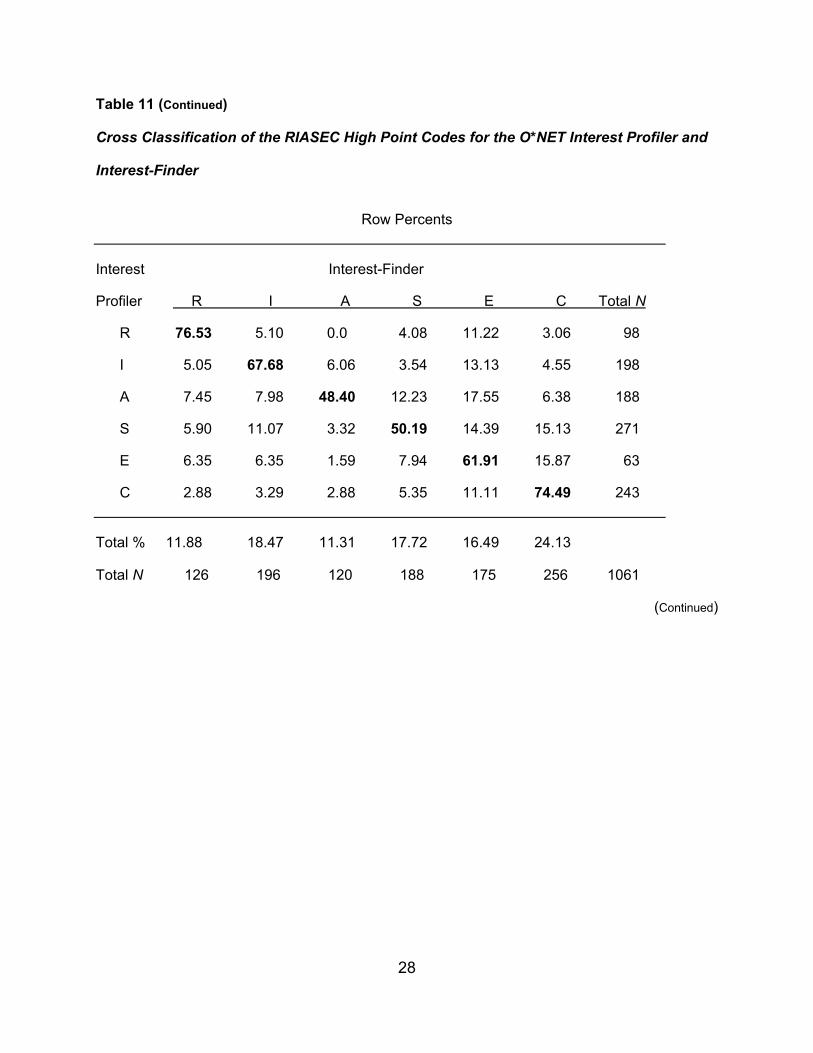
Table 11 (Continued) Cross Classification of the RIASEC High Point Codes for the O*NET Interest Profiler and
Interest-Finder
Row Percents
Interest Interest-Finder
Profiler R I A S E C Total N
R 76.53 5.10 0.0 4.08 11.22 3.06 98
I 5.05 67.68 6.06 3.54 13.13 4.55 198
A 7.45 7.98 48.40 12.23 17.55 6.38 188
S 5.90 11.07 3.32 50.19 14.39 15.13 271
E 6.35 6.35 1.59 7.94 61.91 15.87 63
C 2.88 3.29 2.88 5.35 11.11 74.49 243
Total % 11.88 18.47 11.31 17.72 16.49 24.13 Total N 126 196 120 188 175 256 1061
(Continued)
28
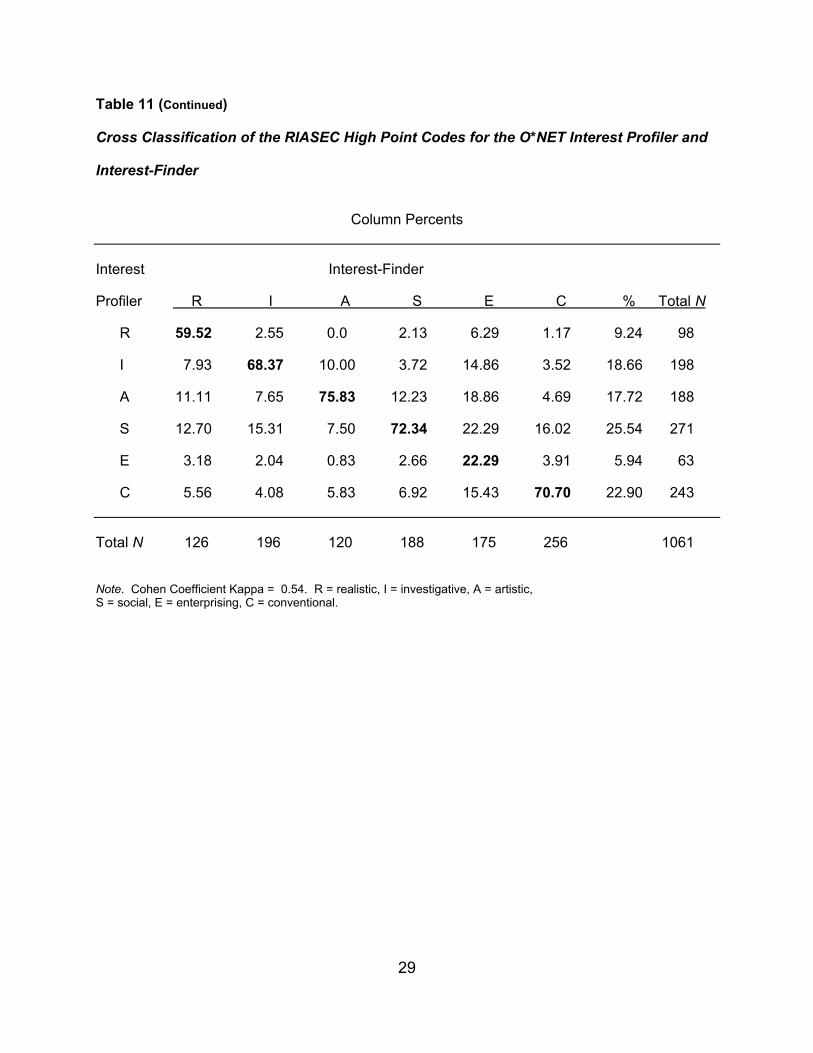
Table 11 (Continued) Cross Classification of the RIASEC High Point Codes for the O*NET Interest Profiler and
Interest-Finder
Column Percents
Interest Interest-Finder
Profiler R I A S E C % Total N
R 59.52 2.55 0.0 2.13 6.29 1.17 9.24 98
I 7.93 68.37 10.00 3.72 14.86 3.52 18.66 198
A 11.11 7.65 75.83 12.23 18.86 4.69 17.72 188
S 12.70 15.31 7.50 72.34 22.29 16.02 25.54 271
E 3.18 2.04 0.83 2.66 22.29 3.91 5.94 63
C 5.56 4.08 5.83 6.92 15.43 70.70 22.90 243
Total N 126 196 120 188 175 256 1061
Note. Cohen Coefficient Kappa = 0.54. R = realistic, I = investigative, A = artistic, S = social, E = enterprising, C = conventional.
29
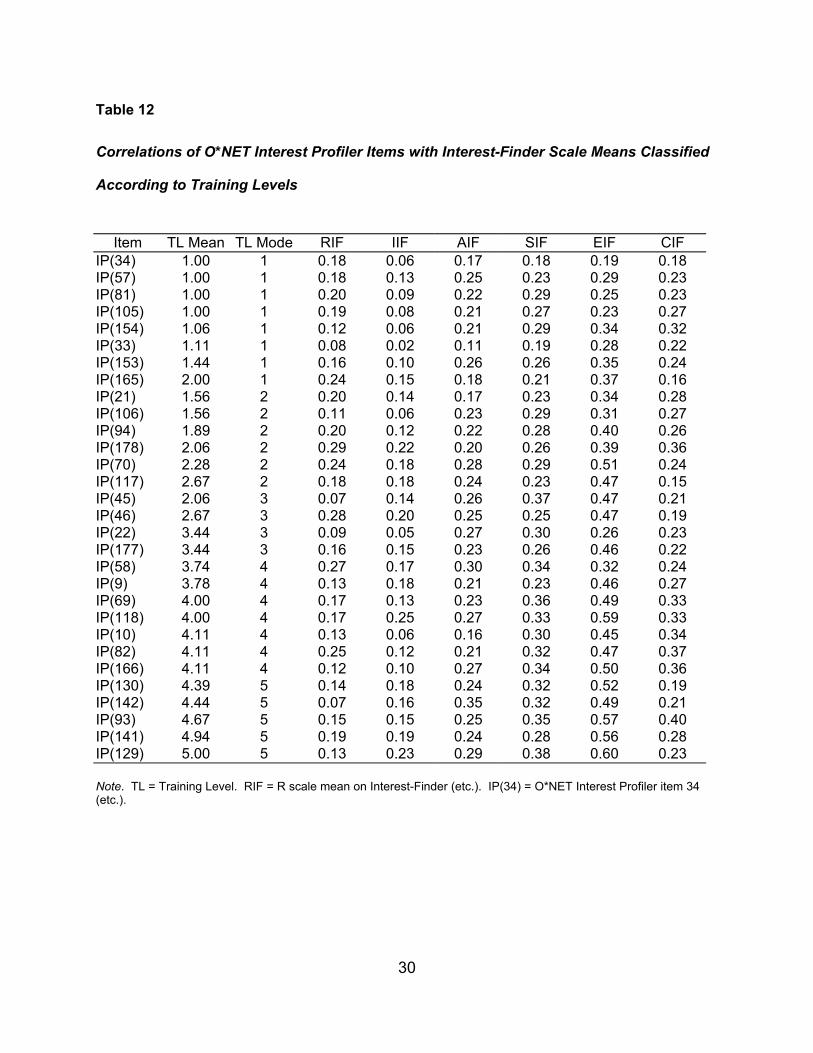
Table 12 Correlations of O*NET Interest Profiler Items with Interest-Finder Scale Means Classified
According to Training Levels
Item TL Mean TL Mode RIF IIF AIF SIF EIF CIF
IP(34) 1.00 1 0.18 0.06 0.17 0.18 0.19 0.18 IP(57) 1.00 1 0.18 0.13 0.25 0.23 0.29 0.23 IP(81) 1.00 1 0.20 0.09 0.22 0.29 0.25 0.23 IP(105) 1.00 1 0.19 0.08 0.21 0.27 0.23 0.27 IP(154) 1.06 1 0.12 0.06 0.21 0.29 0.34 0.32 IP(33) 1.11 1 0.08 0.02 0.11 0.19 0.28 0.22 IP(153) 1.44 1 0.16 0.10 0.26 0.26 0.35 0.24 IP(165) 2.00 1 0.24 0.15 0.18 0.21 0.37 0.16 IP(21) 1.56 2 0.20 0.14 0.17 0.23 0.34 0.28 IP(106) 1.56 2 0.11 0.06 0.23 0.29 0.31 0.27 IP(94) 1.89 2 0.20 0.12 0.22 0.28 0.40 0.26 IP(178) 2.06 2 0.29 0.22 0.20 0.26 0.39 0.36 IP(70) 2.28 2 0.24 0.18 0.28 0.29 0.51 0.24 IP(117) 2.67 2 0.18 0.18 0.24 0.23 0.47 0.15 IP(45) 2.06 3 0.07 0.14 0.26 0.37 0.47 0.21 IP(46) 2.67 3 0.28 0.20 0.25 0.25 0.47 0.19 IP(22) 3.44 3 0.09 0.05 0.27 0.30 0.26 0.23 IP(177) 3.44 3 0.16 0.15 0.23 0.26 0.46 0.22 IP(58) 3.74 4 0.27 0.17 0.30 0.34 0.32 0.24 IP(9) 3.78 4 0.13 0.18 0.21 0.23 0.46 0.27 IP(69) 4.00 4 0.17 0.13 0.23 0.36 0.49 0.33 IP(118) 4.00 4 0.17 0.25 0.27 0.33 0.59 0.33 IP(10) 4.11 4 0.13 0.06 0.16 0.30 0.45 0.34 IP(82) 4.11 4 0.25 0.12 0.21 0.32 0.47 0.37 IP(166) 4.11 4 0.12 0.10 0.27 0.34 0.50 0.36 IP(130) 4.39 5 0.14 0.18 0.24 0.32 0.52 0.19 IP(142) 4.44 5 0.07 0.16 0.35 0.32 0.49 0.21 IP(93) 4.67 5 0.15 0.15 0.25 0.35 0.57 0.40 IP(141) 4.94 5 0.19 0.19 0.24 0.28 0.56 0.28 IP(129) 5.00 5 0.13 0.23 0.29 0.38 0.60 0.23 Note. TL = Training Level. RIF = R scale mean on Interest-Finder (etc.). IP(34) = O*NET Interest Profiler item 34 (etc.).
30
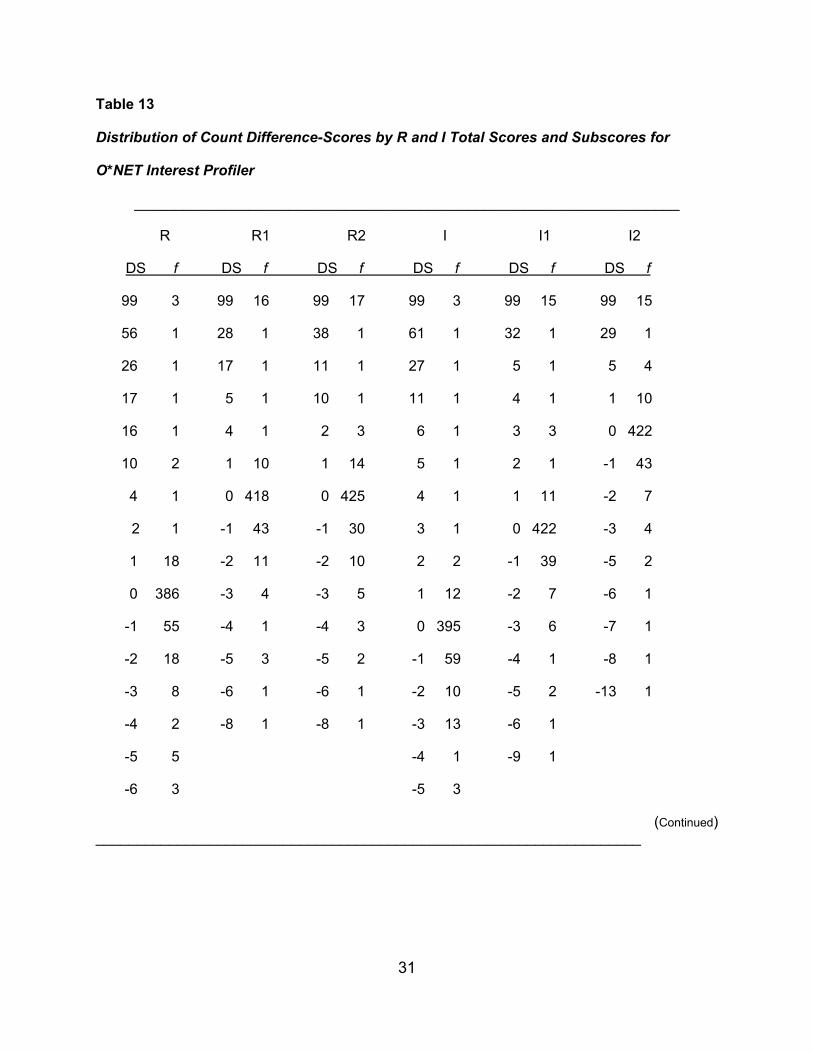
Table 13
Distribution of Count Difference-Scores by R and I Total Scores and Subscores for
O*NET Interest Profiler
___________________________________________________________________
R R1 R2 I I1 I2
DS f DS f DS f DS f DS f DS f
99 3 99 16 99 17 99 3 99 15 99 15
56 1 28 1 38 1 61 1 32 1 29 1
26 1 17 1 11 1 27 1 5 1 5 4
17 1 5 1 10 1 11 1 4 1 1 10
16 1 4 1 2 3 6 1 3 3 0 422
10 2 1 10 1 14 5 1 2 1 -1 43
4 1 0 418 0 425 4 1 1 11 -2 7
2 1 -1 43 -1 30 3 1 0 422 -3 4
1 18 -2 11 -2 10 2 2 -1 39 -5 2
0 386 -3 4 -3 5 1 12 -2 7 -6 1
-1 55 -4 1 -4 3 0 395 -3 6 -7 1
-2 18 -5 3 -5 2 -1 59 -4 1 -8 1
-3 8 -6 1 -6 1 -2 10 -5 2 -13 1
-4 2 -8 1 -8 1 -3 13 -6 1
-5 5 -4 1 -9 1
-6 3 -5 3
(Continued) ___________________________________________________________________
31
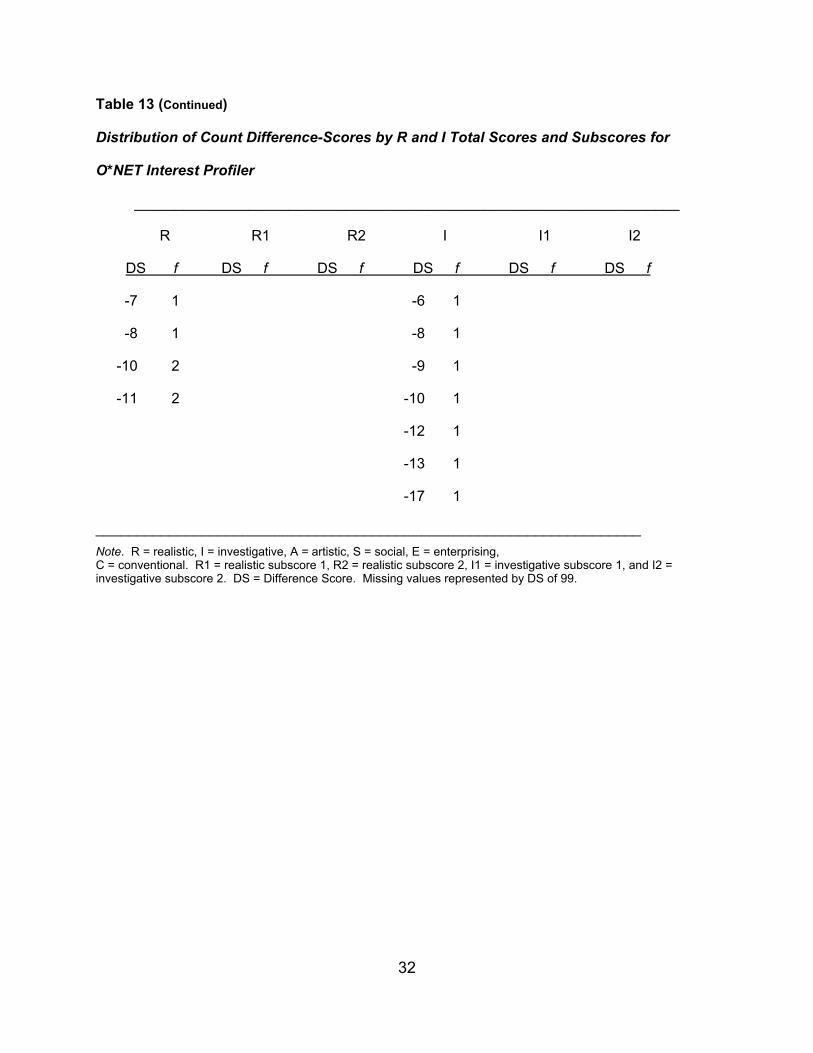
Table 13 (Continued)
Distribution of Count Difference-Scores by R and I Total Scores and Subscores for
O*NET Interest Profiler
___________________________________________________________________
R R1 R2 I I1 I2
DS f DS f DS f DS f DS f DS f
-7 1 -6 1
-8 1 -8 1
-10 2 -9 1
-11 2 -10 1
-12 1
-13 1
-17 1 ___________________________________________________________________ Note. R = realistic, I = investigative, A = artistic, S = social, E = enterprising, C = conventional. R1 = realistic subscore 1, R2 = realistic subscore 2, I1 = investigative subscore 1, and I2 = investigative subscore 2. DS = Difference Score. Missing values represented by DS of 99.
32
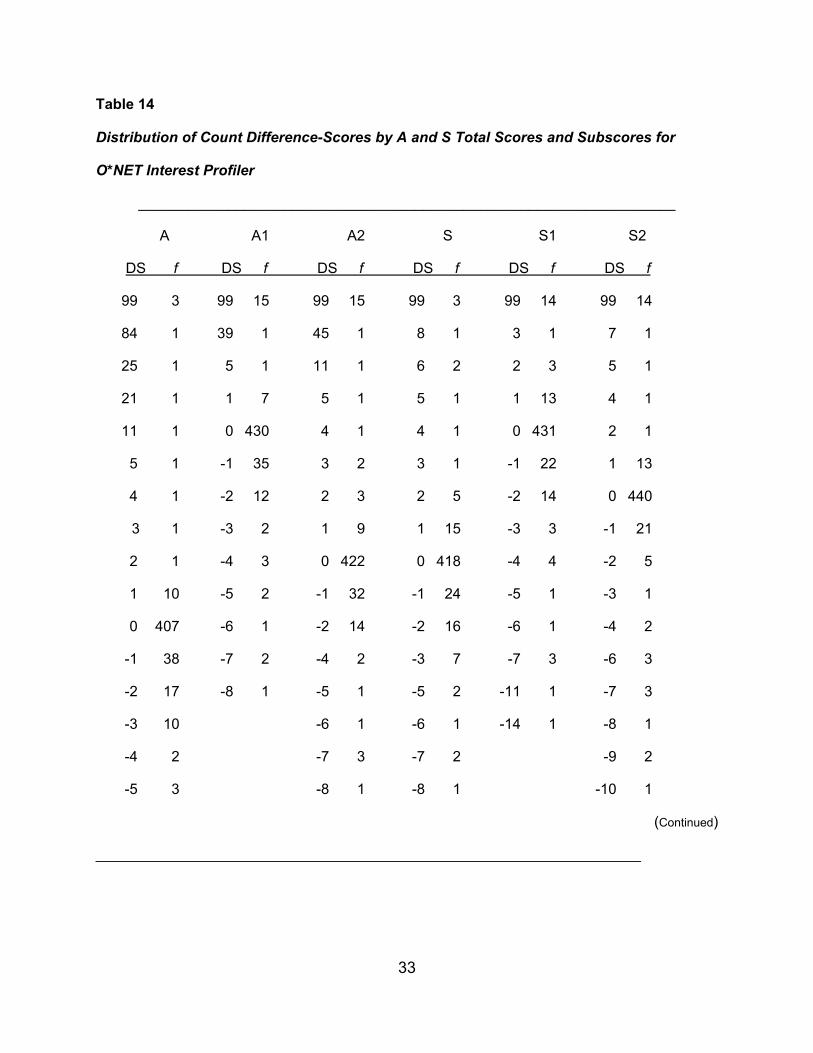
Table 14
Distribution of Count Difference-Scores by A and S Total Scores and Subscores for
O*NET Interest Profiler
__________________________________________________________________
A A1 A2 S S1 S2
DS f DS f DS f DS f DS f DS f
99 3 99 15 99 15 99 3 99 14 99 14
84 1 39 1 45 1 8 1 3 1 7 1
25 1 5 1 11 1 6 2 2 3 5 1
21 1 1 7 5 1 5 1 1 13 4 1
11 1 0 430 4 1 4 1 0 431 2 1
5 1 -1 35 3 2 3 1 -1 22 1 13
4 1 -2 12 2 3 2 5 -2 14 0 440
3 1 -3 2 1 9 1 15 -3 3 -1 21
2 1 -4 3 0 422 0 418 -4 4 -2 5
1 10 -5 2 -1 32 -1 24 -5 1 -3 1
0 407 -6 1 -2 14 -2 16 -6 1 -4 2
-1 38 -7 2 -4 2 -3 7 -7 3 -6 3
-2 17 -8 1 -5 1 -5 2 -11 1 -7 3
-3 10 -6 1 -6 1 -14 1 -8 1
-4 2 -7 3 -7 2 -9 2
-5 3 -8 1 -8 1 -10 1
(Continued)
___________________________________________________________________
33
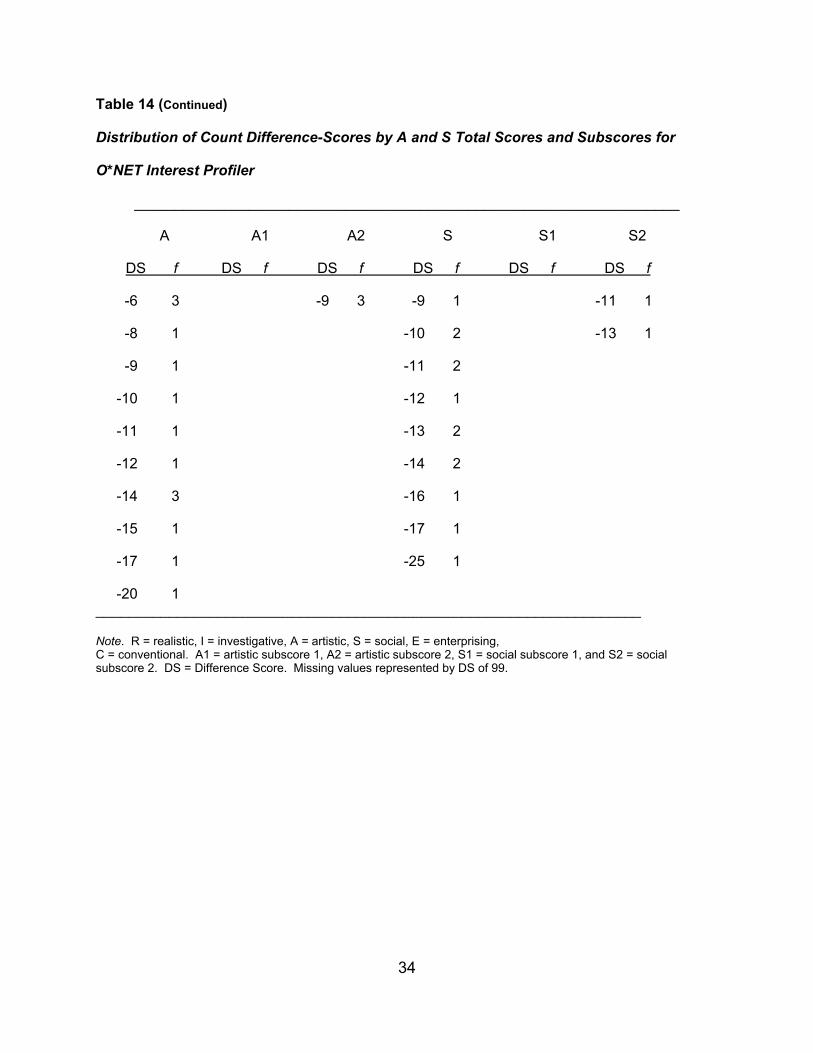
Table 14 (Continued)
Distribution of Count Difference-Scores by A and S Total Scores and Subscores for
O*NET Interest Profiler
___________________________________________________________________
A A1 A2 S S1 S2
DS f DS f DS f DS f DS f DS f
-6 3 -9 3 -9 1 -11 1
-8 1 -10 2 -13 1
-9 1 -11 2
-10 1 -12 1
-11 1 -13 2
-12 1 -14 2
-14 3 -16 1
-15 1 -17 1
-17 1 -25 1
-20 1 ___________________________________________________________________ Note. R = realistic, I = investigative, A = artistic, S = social, E = enterprising, C = conventional. A1 = artistic subscore 1, A2 = artistic subscore 2, S1 = social subscore 1, and S2 = social subscore 2. DS = Difference Score. Missing values represented by DS of 99.
34
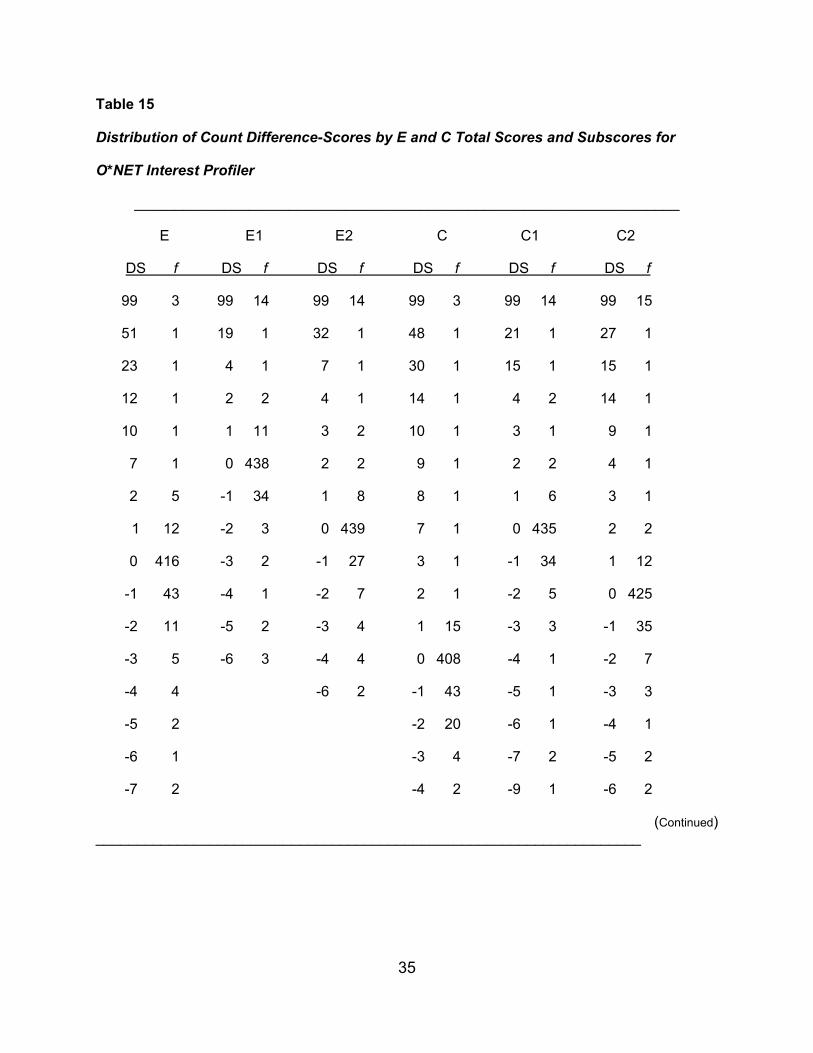
Table 15
Distribution of Count Difference-Scores by E and C Total Scores and Subscores for
O*NET Interest Profiler
___________________________________________________________________
E E1 E2 C C1 C2
DS f DS f DS f DS f DS f DS f
99 3 99 14 99 14 99 3 99 14 99 15
51 1 19 1 32 1 48 1 21 1 27 1
23 1 4 1 7 1 30 1 15 1 15 1
12 1 2 2 4 1 14 1 4 2 14 1
10 1 1 11 3 2 10 1 3 1 9 1
7 1 0 438 2 2 9 1 2 2 4 1
2 5 -1 34 1 8 8 1 1 6 3 1
1 12 -2 3 0 439 7 1 0 435 2 2
0 416 -3 2 -1 27 3 1 -1 34 1 12
-1 43 -4 1 -2 7 2 1 -2 5 0 425
-2 11 -5 2 -3 4 1 15 -3 3 -1 35
-3 5 -6 3 -4 4 0 408 -4 1 -2 7
-4 4 -6 2 -1 43 -5 1 -3 3
-5 2 -2 20 -6 1 -4 1
-6 1 -3 4 -7 2 -5 2
-7 2 -4 2 -9 1 -6 2
(Continued) ___________________________________________________________________
35
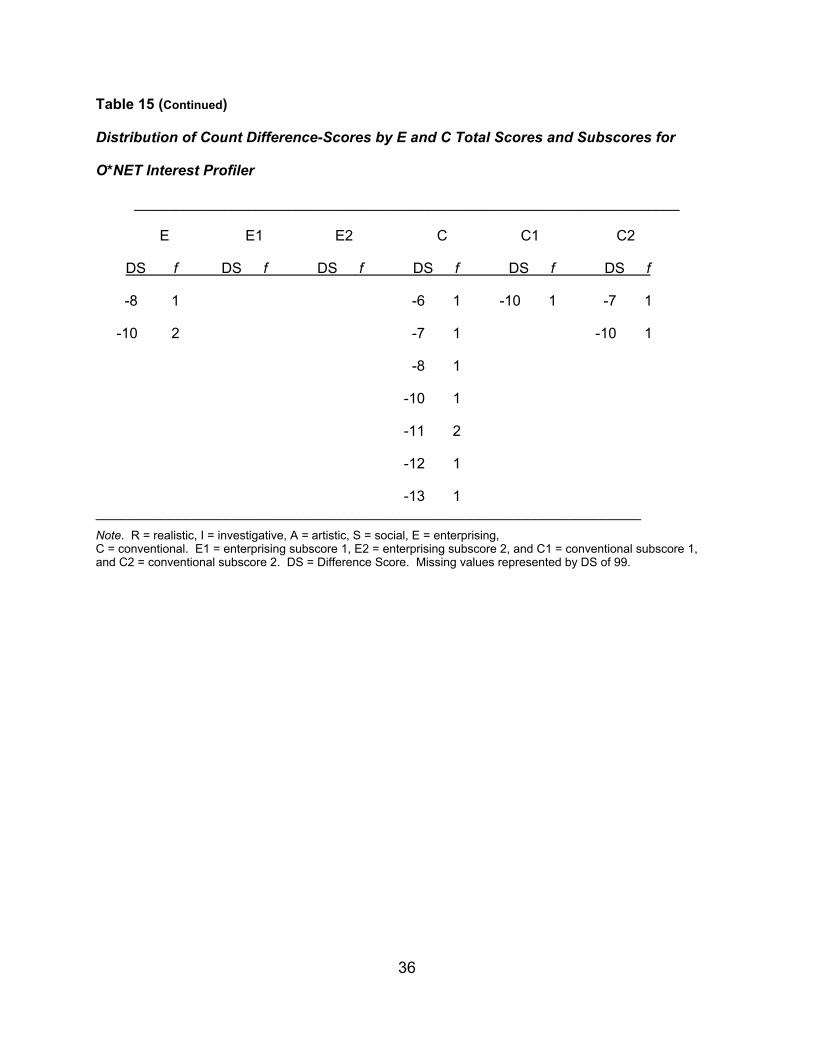
Table 15 (Continued)
Distribution of Count Difference-Scores by E and C Total Scores and Subscores for
O*NET Interest Profiler
___________________________________________________________________
E E1 E2 C C1 C2
DS f DS f DS f DS f DS f DS f
-8 1 -6 1 -10 1 -7 1
-10 2 -7 1 -10 1
-8 1
-10 1
-11 2
-12 1
-13 1 ___________________________________________________________________ Note. R = realistic, I = investigative, A = artistic, S = social, E = enterprising, C = conventional. E1 = enterprising subscore 1, E2 = enterprising subscore 2, and C1 = conventional subscore 1, and C2 = conventional subscore 2. DS = Difference Score. Missing values represented by DS of 99.
36
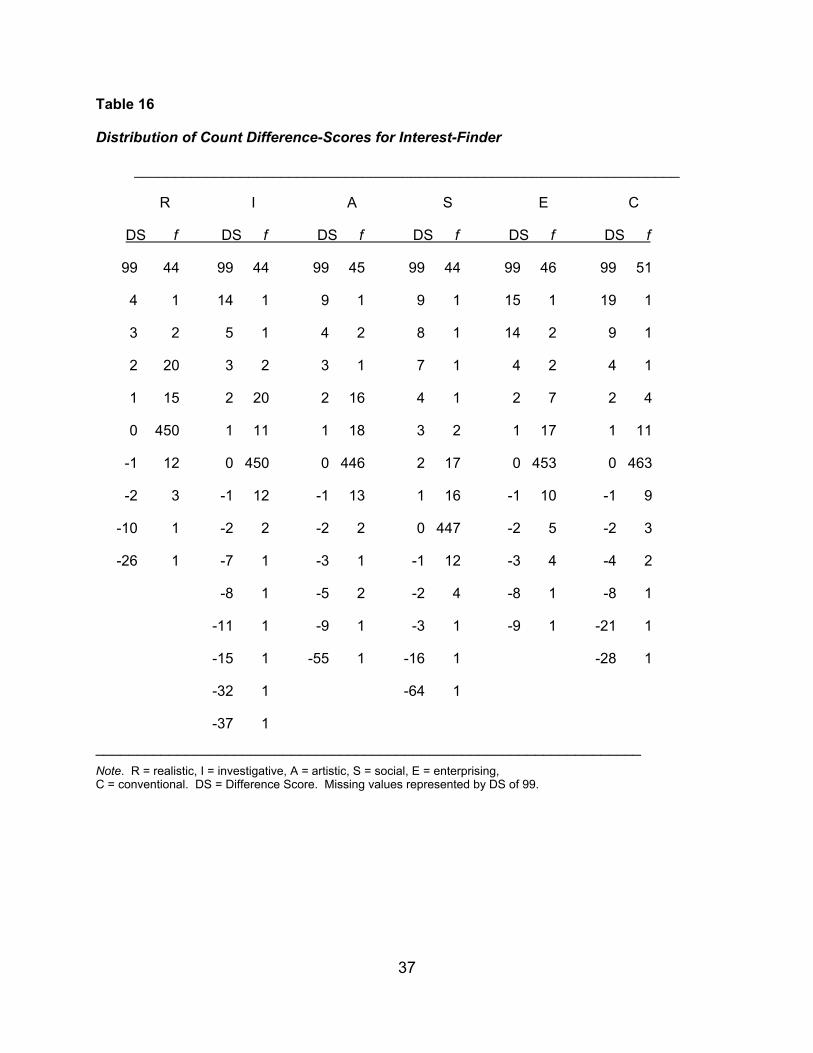
Table 16
Distribution of Count Difference-Scores for Interest-Finder
___________________________________________________________________
R I A S E C
DS f DS f DS f DS f DS f DS f
99 44 99 44 99 45 99 44 99 46 99 51
4 1 14 1 9 1 9 1 15 1 19 1
3 2 5 1 4 2 8 1 14 2 9 1
2 20 3 2 3 1 7 1 4 2 4 1
1 15 2 20 2 16 4 1 2 7 2 4
0 450 1 11 1 18 3 2 1 17 1 11
-1 12 0 450 0 446 2 17 0 453 0 463
-2 3 -1 12 -1 13 1 16 -1 10 -1 9
-10 1 -2 2 -2 2 0 447 -2 5 -2 3
-26 1 -7 1 -3 1 -1 12 -3 4 -4 2
-8 1 -5 2 -2 4 -8 1 -8 1
-11 1 -9 1 -3 1 -9 1 -21 1
-15 1 -55 1 -16 1 -28 1
-32 1 -64 1
-37 1 ___________________________________________________________________ Note. R = realistic, I = investigative, A = artistic, S = social, E = enterprising, C = conventional. DS = Difference Score. Missing values represented by DS of 99.
37
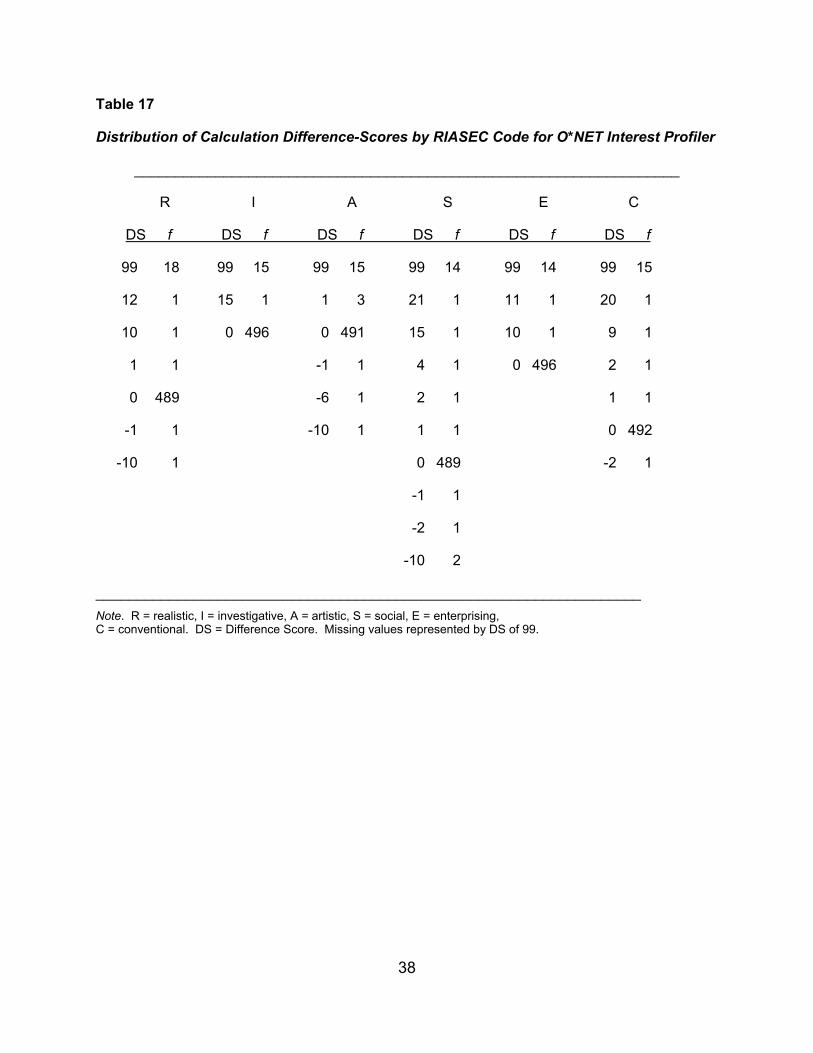
Table 17 Distribution of Calculation Difference-Scores by RIASEC Code for O*NET Interest Profiler
___________________________________________________________________
R I A S E C
DS f DS f DS f DS f DS f DS f
99 18 99 15 99 15 99 14 99 14 99 15
12 1 15 1 1 3 21 1 11 1 20 1
10 1 0 496 0 491 15 1 10 1 9 1
1 1 -1 1 4 1 0 496 2 1
0 489 -6 1 2 1 1 1
-1 1 -10 1 1 1 0 492
-10 1 0 489 -2 1
-1 1
-2 1
-10 2
___________________________________________________________________ Note. R = realistic, I = investigative, A = artistic, S = social, E = enterprising, C = conventional. DS = Difference Score. Missing values represented by DS of 99.
38
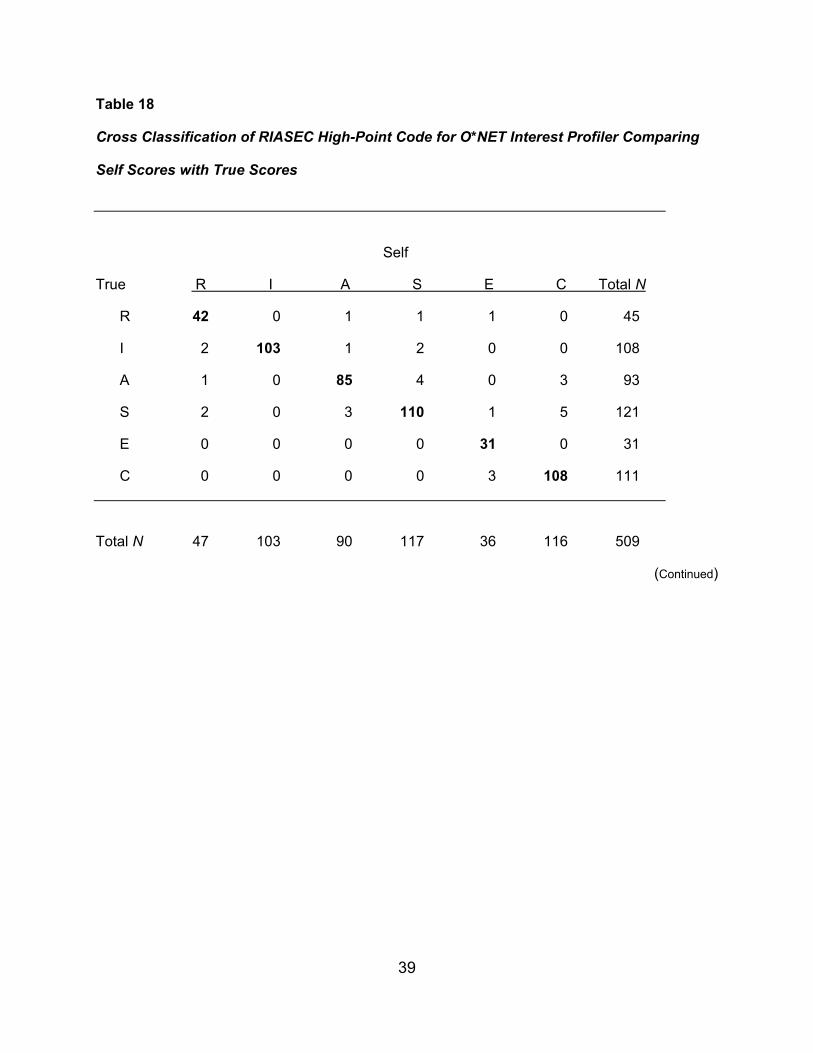
Table 18
Cross Classification of RIASEC High-Point Code for O*NET Interest Profiler Comparing
Self Scores with True Scores
Self
True R I A S E C Total N
R 42 0 1 1 1 0 45
I 2 103 1 2 0 0 108
A 1 0 85 4 0 3 93
S 2 0 3 110 1 5 121
E 0 0 0 0 31 0 31
C 0 0 0 0 3 108 111
Total N 47 103 90 117 36 116 509
(Continued)
39
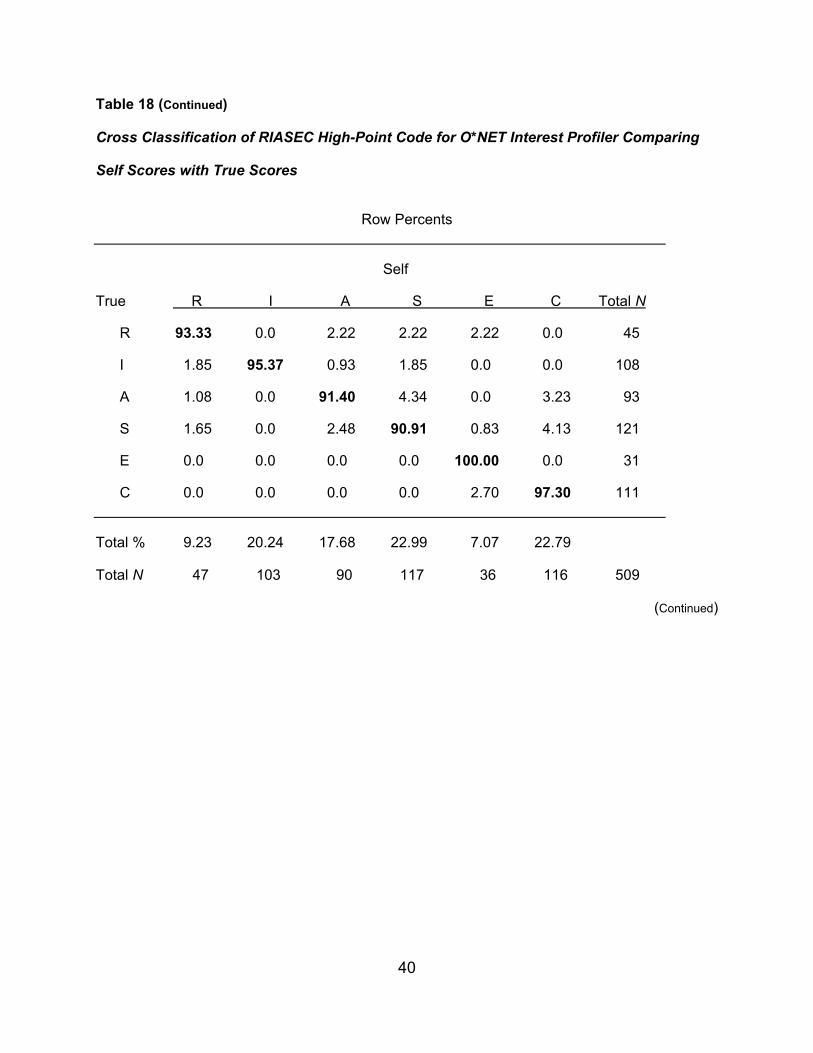
Table 18 (Continued) Cross Classification of RIASEC High-Point Code for O*NET Interest Profiler Comparing
Self Scores with True Scores
Row Percents
Self
True R I A S E C Total N
R 93.33 0.0 2.22 2.22 2.22 0.0 45
I 1.85 95.37 0.93 1.85 0.0 0.0 108
A 1.08 0.0 91.40 4.34 0.0 3.23 93
S 1.65 0.0 2.48 90.91 0.83 4.13 121
E 0.0 0.0 0.0 0.0 100.00 0.0 31
C 0.0 0.0 0.0 0.0 2.70 97.30 111
Total % 9.23 20.24 17.68 22.99 7.07 22.79 Total N 47 103 90 117 36 116 509
(Continued)
40
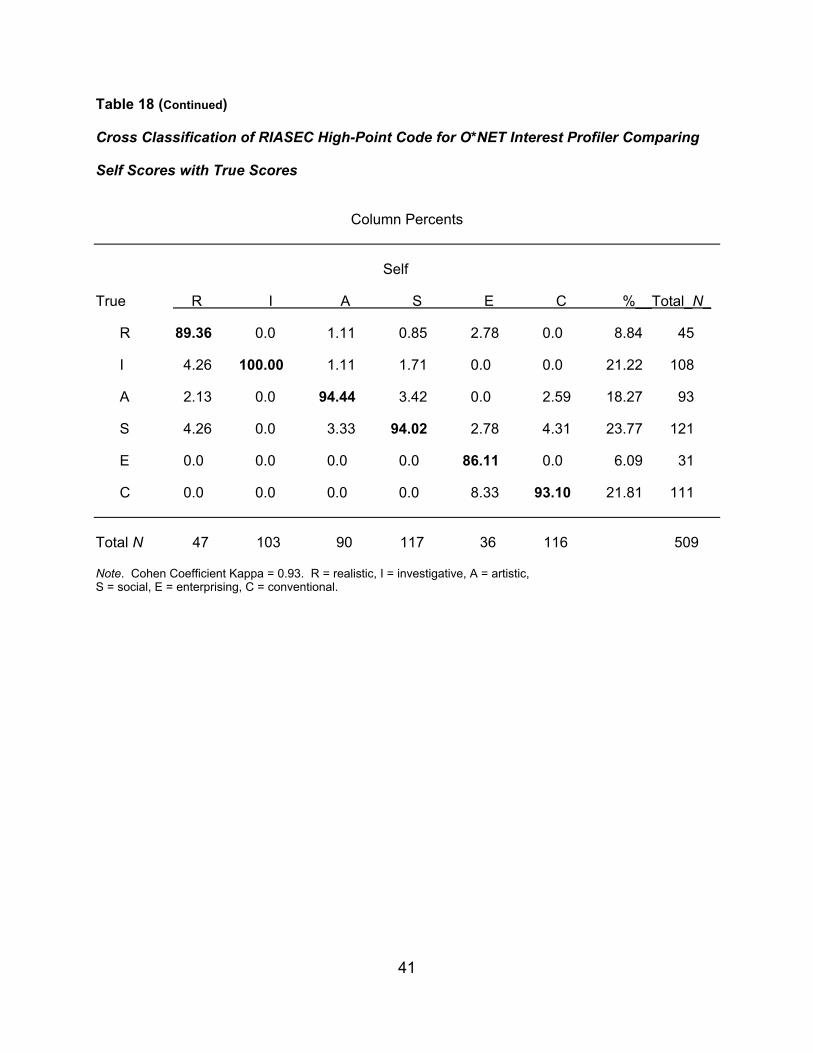
Table 18 (Continued) Cross Classification of RIASEC High-Point Code for O*NET Interest Profiler Comparing
Self Scores with True Scores
Column Percents
Self
True R I A S E C %__Total_N_
R 89.36 0.0 1.11 0.85 2.78 0.0 8.84 45
I 4.26 100.00 1.11 1.71 0.0 0.0 21.22 108
A 2.13 0.0 94.44 3.42 0.0 2.59 18.27 93
S 4.26 0.0 3.33 94.02 2.78 4.31 23.77 121
E 0.0 0.0 0.0 0.0 86.11 0.0 6.09 31
C 0.0 0.0 0.0 0.0 8.33 93.10 21.81 111
Total N 47 103 90 117 36 116 509 Note. Cohen Coefficient Kappa = 0.93. R = realistic, I = investigative, A = artistic, S = social, E = enterprising, C = conventional.
41
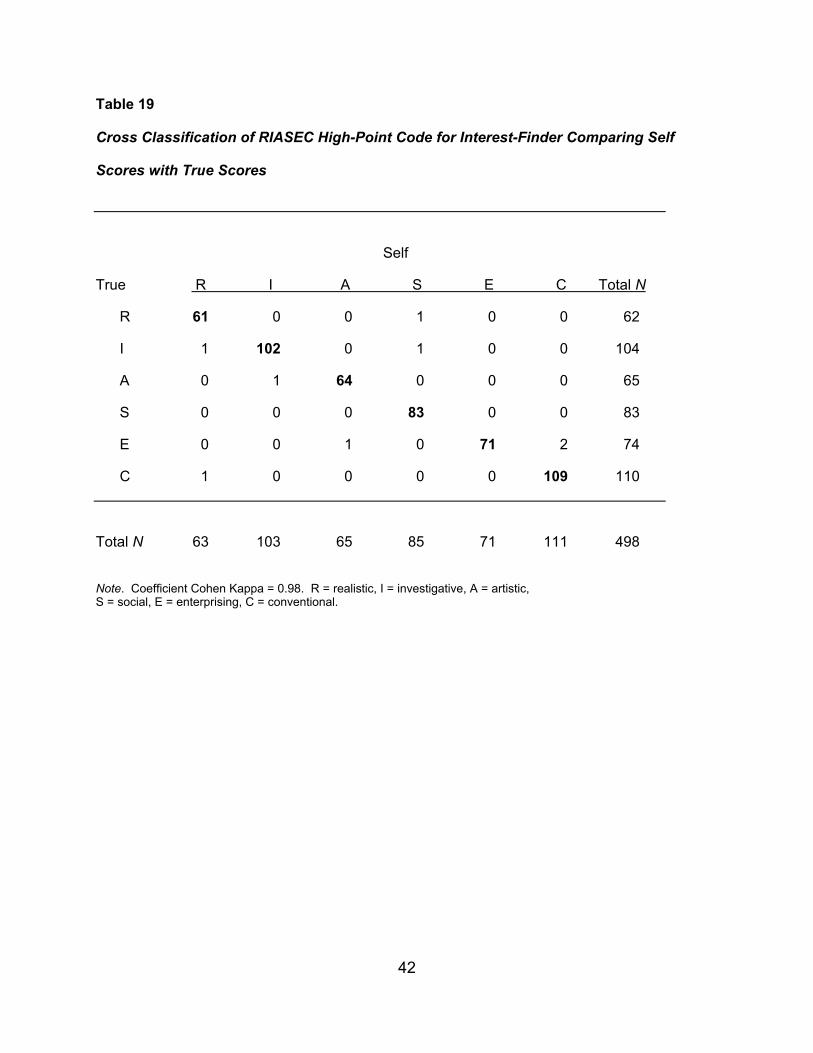
Table 19
Cross Classification of RIASEC High-Point Code for Interest-Finder Comparing Self
Scores with True Scores
Self
True R I A S E C Total N
R 61 0 0 1 0 0 62
I 1 102 0 1 0 0 104
A 0 1 64 0 0 0 65
S 0 0 0 83 0 0 83
E 0 0 1 0 71 2 74
C 1 0 0 0 0 109 110
Total N 63 103 65 85 71 111 498
Note. Coefficient Cohen Kappa = 0.98. R = realistic, I = investigative, A = artistic, S = social, E = enterprising, C = conventional.
42
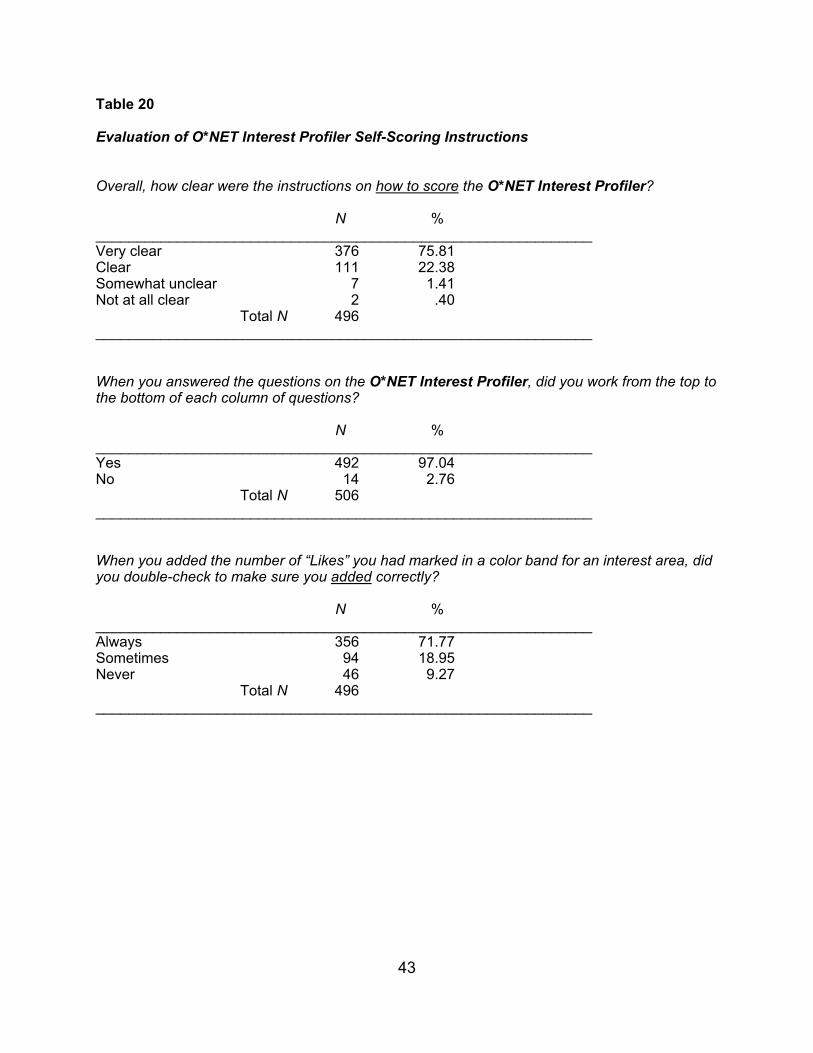
Table 20 Evaluation of O*NET Interest Profiler Self-Scoring Instructions
Overall, how clear were the instructions on how to score the O*NET Interest Profiler? N % _____________________________________________________________ Very clear 376 75.81 Clear 111 22.38 Somewhat unclear 7 1.41 Not at all clear 2 .40 Total N 496 _____________________________________________________________ When you answered the questions on the O*NET Interest Profiler, did you work from the top to the bottom of each column of questions? N % _____________________________________________________________ Yes 492 97.04 No 14 2.76 Total N 506 _____________________________________________________________ When you added the number of “Likes” you had marked in a color band for an interest area, did you double-check to make sure you added correctly? N % _____________________________________________________________ Always 356 71.77 Sometimes 94 18.95 Never 46 9.27 Total N 496 _____________________________________________________________
43
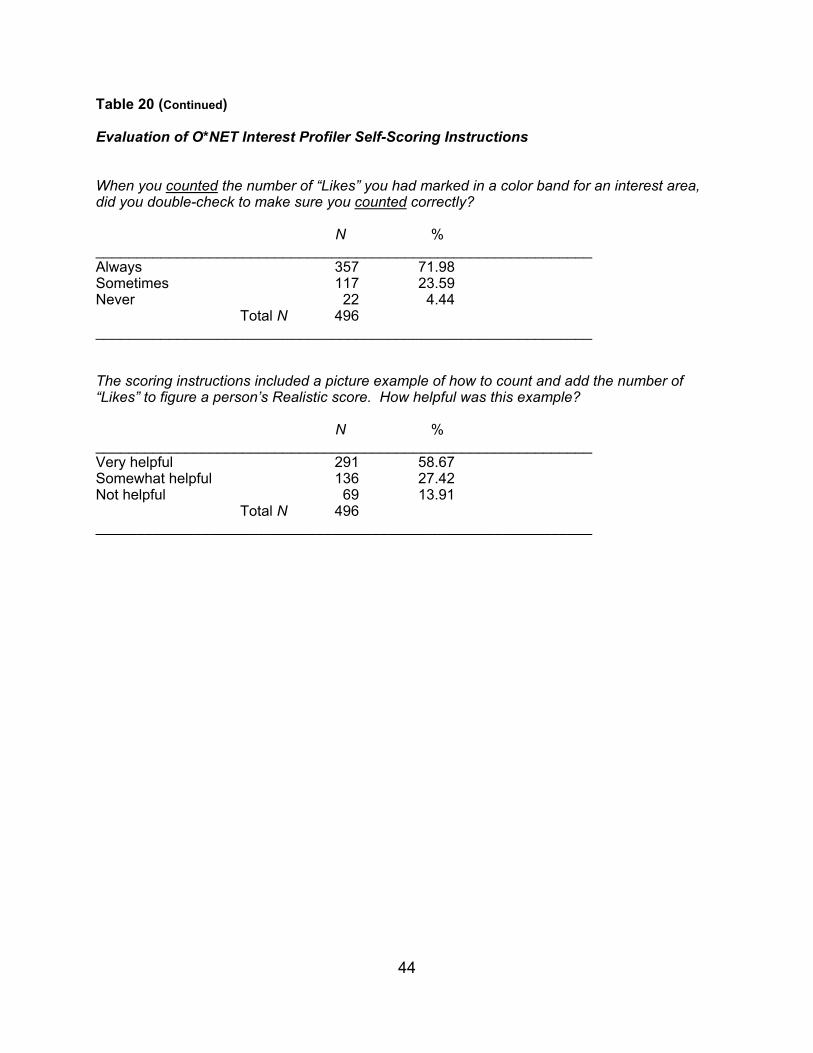
Table 20 (Continued) Evaluation of O*NET Interest Profiler Self-Scoring Instructions When you counted the number of “Likes” you had marked in a color band for an interest area, did you double-check to make sure you counted correctly? N % _____________________________________________________________ Always 357 71.98 Sometimes 117 23.59 Never 22 4.44 Total N 496 _____________________________________________________________ The scoring instructions included a picture example of how to count and add the number of “Likes” to figure a person’s Realistic score. How helpful was this example? N % _____________________________________________________________ Very helpful 291 58.67 Somewhat helpful 136 27.42 Not helpful 69 13.91 Total N 496 _____________________________________________________________
44
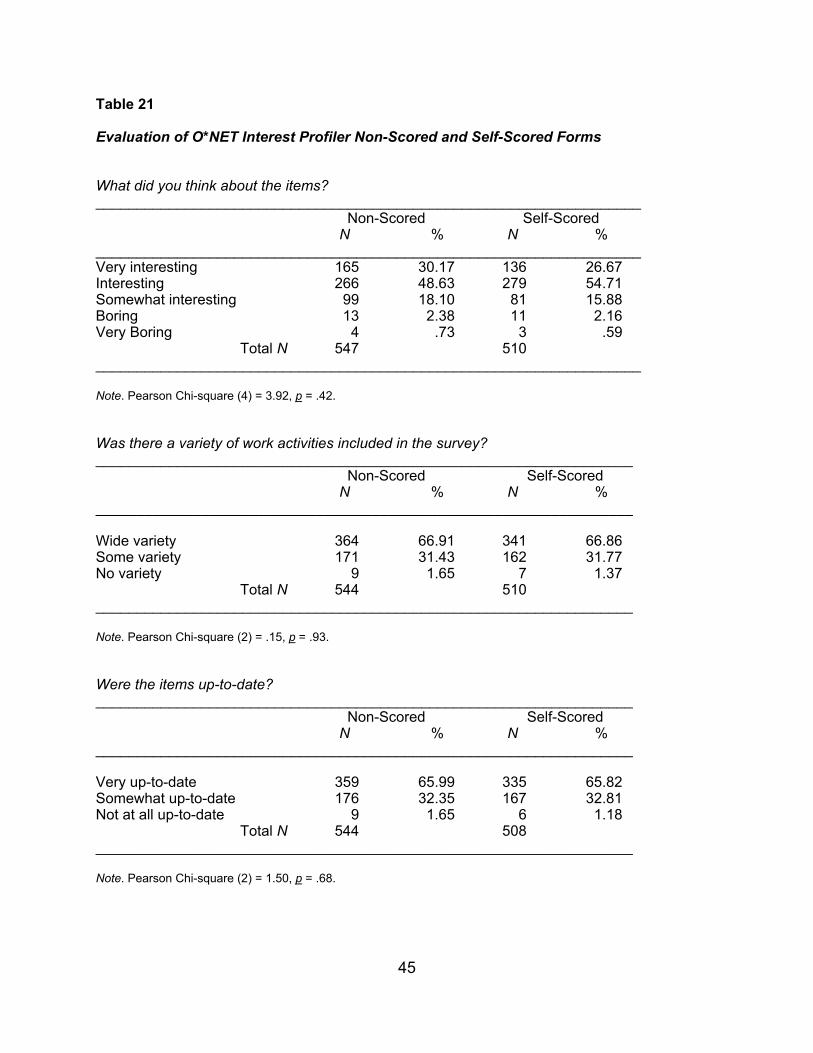
Table 21 Evaluation of O*NET Interest Profiler Non-Scored and Self-Scored Forms
What did you think about the items? ___________________________________________________________________ Non-Scored Self-Scored N % N % ___________________________________________________________________ Very interesting 165 30.17 136 26.67 Interesting 266 48.63 279 54.71 Somewhat interesting 99 18.10 81 15.88 Boring 13 2.38 11 2.16 Very Boring 4 .73 3 .59 Total N 547 510 ___________________________________________________________________ Note. Pearson Chi-square (4) = 3.92, p = .42. Was there a variety of work activities included in the survey? __________________________________________________________________ Non-Scored Self-Scored N % N % __________________________________________________________________ Wide variety 364 66.91 341 66.86 Some variety 171 31.43 162 31.77 No variety 9 1.65 7 1.37 Total N 544 510 __________________________________________________________________ Note. Pearson Chi-square (2) = .15, p = .93. Were the items up-to-date? __________________________________________________________________ Non-Scored Self-Scored N % N % __________________________________________________________________ Very up-to-date 359 65.99 335 65.82 Somewhat up-to-date 176 32.35 167 32.81 Not at all up-to-date 9 1.65 6 1.18 Total N 544 508 __________________________________________________________________ Note. Pearson Chi-square (2) = 1.50, p = .68.
45
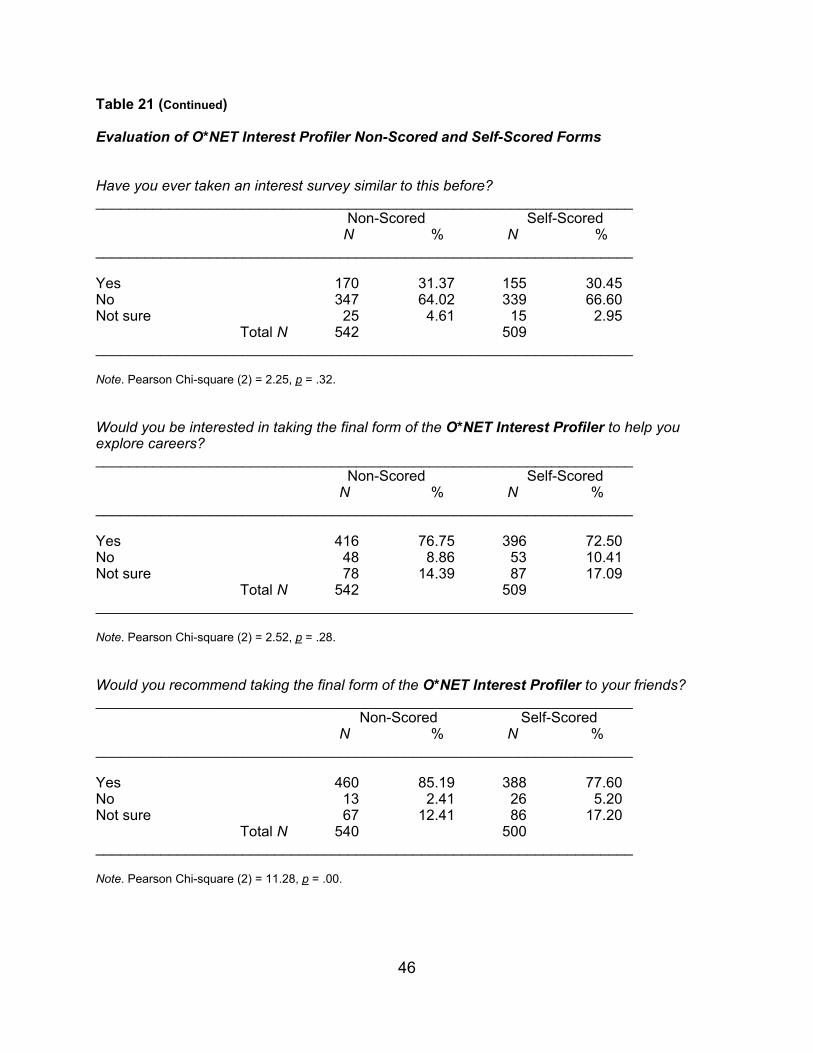
Table 21 (Continued) Evaluation of O*NET Interest Profiler Non-Scored and Self-Scored Forms Have you ever taken an interest survey similar to this before? __________________________________________________________________ Non-Scored Self-Scored N % N % __________________________________________________________________ Yes 170 31.37 155 30.45 No 347 64.02 339 66.60 Not sure 25 4.61 15 2.95 Total N 542 509 __________________________________________________________________ Note. Pearson Chi-square (2) = 2.25, p = .32. Would you be interested in taking the final form of the O*NET Interest Profiler to help you explore careers? __________________________________________________________________ Non-Scored Self-Scored N % N % __________________________________________________________________ Yes 416 76.75 396 72.50 No 48 8.86 53 10.41 Not sure 78 14.39 87 17.09 Total N 542 509 __________________________________________________________________ Note. Pearson Chi-square (2) = 2.52, p = .28. Would you recommend taking the final form of the O*NET Interest Profiler to your friends? __________________________________________________________________ Non-Scored Self-Scored N % N % __________________________________________________________________ Yes 460 85.19 388 77.60 No 13 2.41 26 5.20 Not sure 67 12.41 86 17.20 Total N 540 500 __________________________________________________________________ Note. Pearson Chi-square (2) = 11.28, p = .00.
46

Figures
47
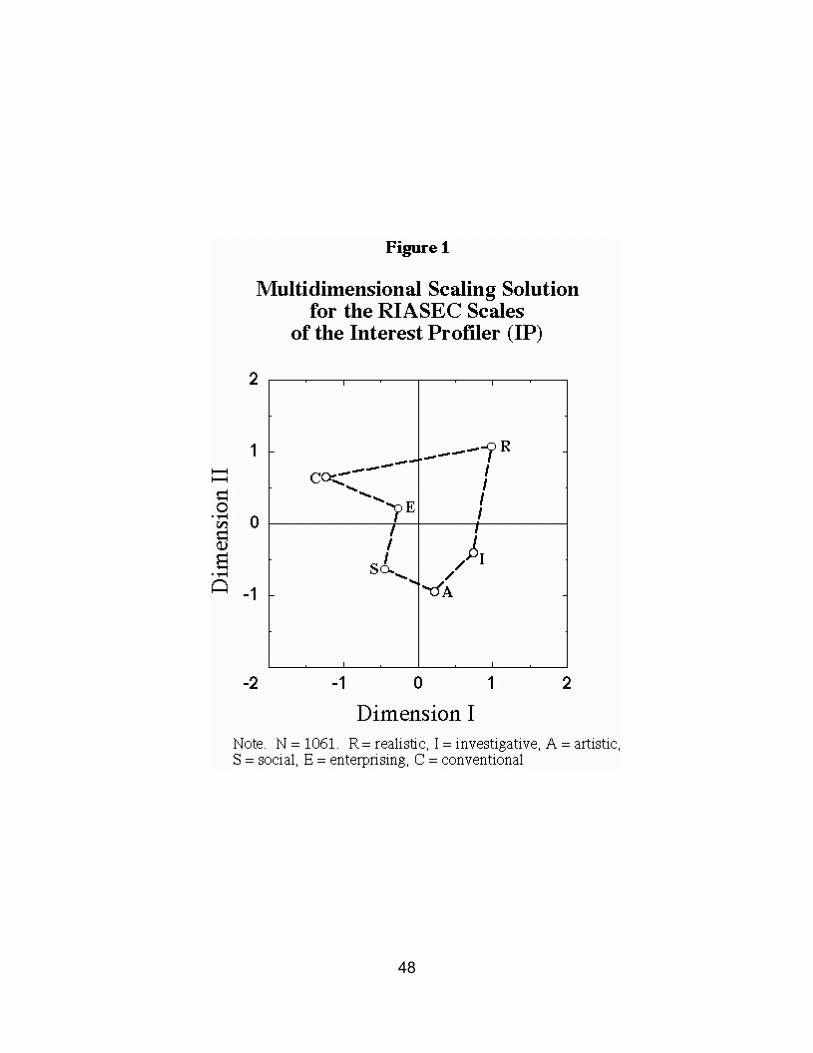
48
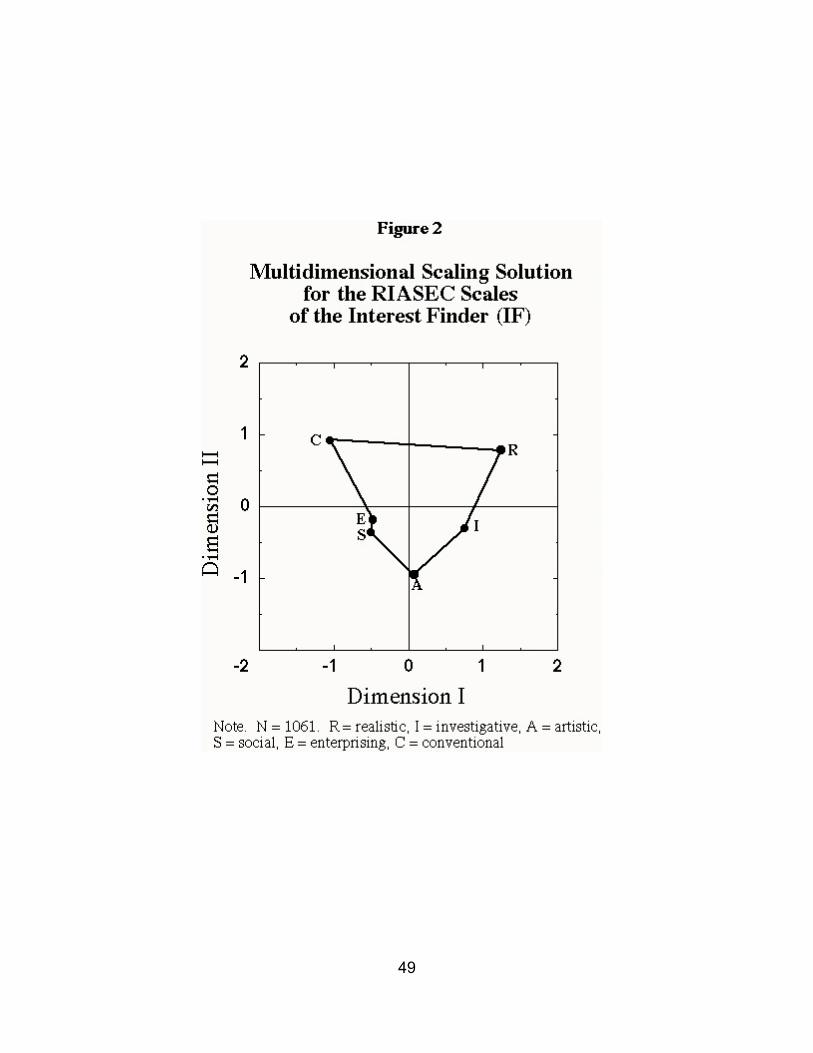
49
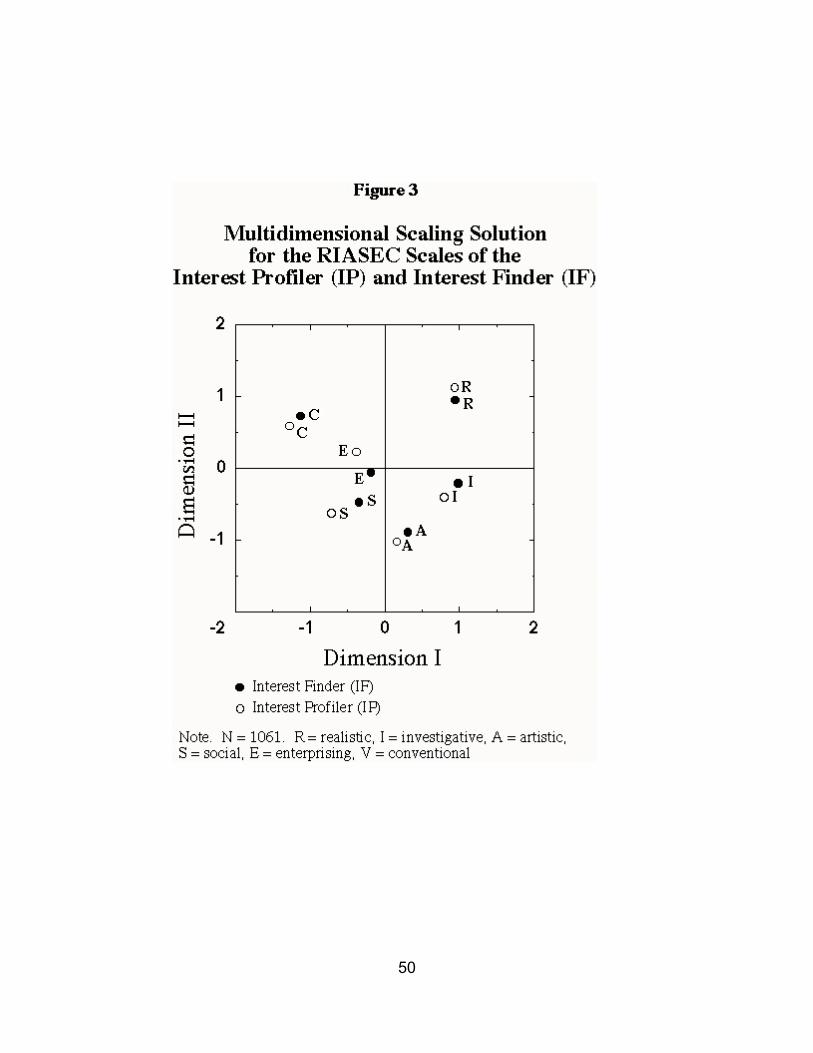
50
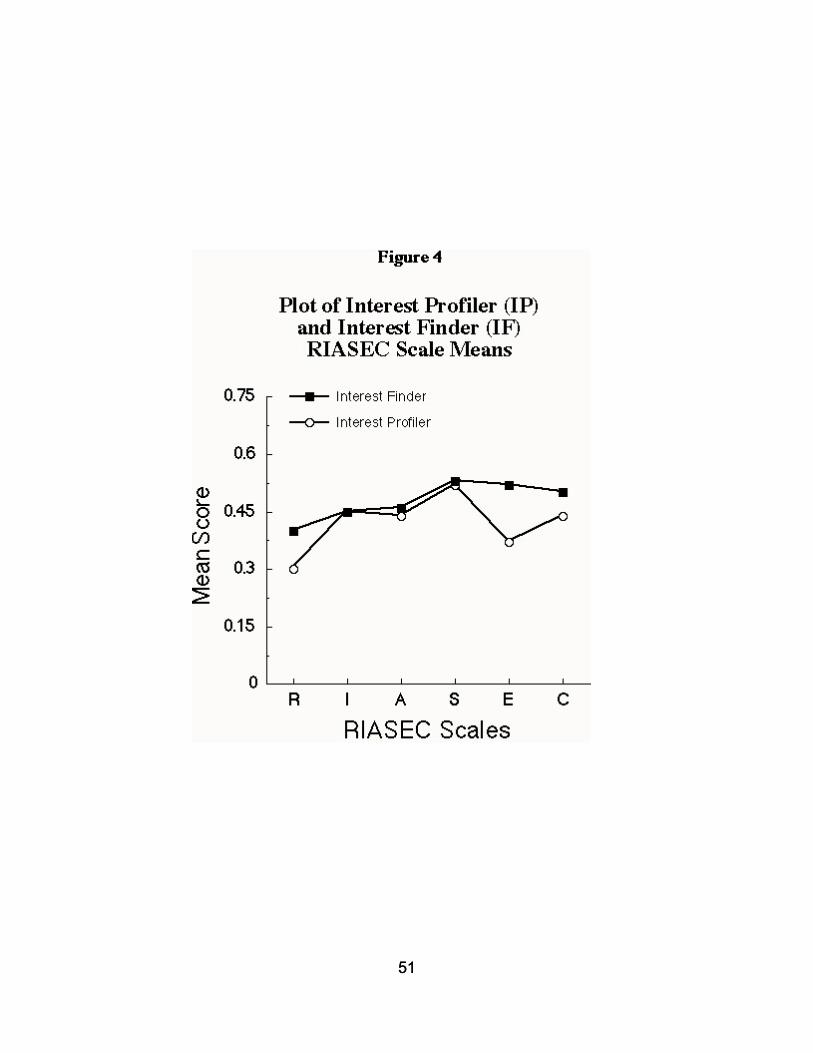
51
51