one step preparation of quantum dot-embedded lipid
TRANSCRIPT
One step preparation of quantum dot-embedded lipid
nanovesicles by a microfluidic device
Journal: RSC Advances
Manuscript ID RA-ART-09-2015-018862.R1
Article Type: Paper
Date Submitted by the Author: 05-Nov-2015
Complete List of Authors: Zacheo, Antonella; Istituto di Nanotecnologia, CNR NANOTEC; Università del Salento, Dipartimento di Mat e Fisica Ennio De Giorgi Quarta, Alessandra; Istituto di Nanotecnologia, CNR NANOTEC zizzari, alessandra; Università del Salento, Dipartimento di Mat e Fisica Ennio De Giorgi Monteduro, Anna; Istituto di Nanotecnologia, CNR NANOTEC; Università del Salento, Dipartimento di Mat e Fisica Ennio De Giorgi Maruccio, Giuseppe; Istituto di Nanotecnologia, CNR NANOTEC; Università del Salento, Dipartimento di Mat e Fisica Ennio De Giorgi Arima, Valentina; Istituto di Nanotecnologia, CNR NANOTEC Gigli, Giuseppe; Istituto di Nanotecnologia, CNR NANOTEC; Università del Salento, Dipartimento di Mat e Fisica Ennio De Giorgi
Subject area & keyword: Nanotechnology < Chemical biology & medicinal
RSC Advances
Journal Name RSCPublishing
ARTICLE
This journal is © The Royal Society of Chemistry 2013 J. Name., 2013, 00, 1-3 | 1
Cite this: DOI: 10.1039/x0xx00000x
Received 00th January 2012, Accepted 00th January 2012
DOI: 10.1039/x0xx00000x
www.rsc.org/
One step preparation of quantum dot-embedded lipid
nanovesicles by a microfluidic device
A. Zacheo a,b *, A. Quarta b, A. Zizzari a, A. G. Monteduro a,b, G. Maruccio a,b
, V. Arima b, and G. Gigli a,b
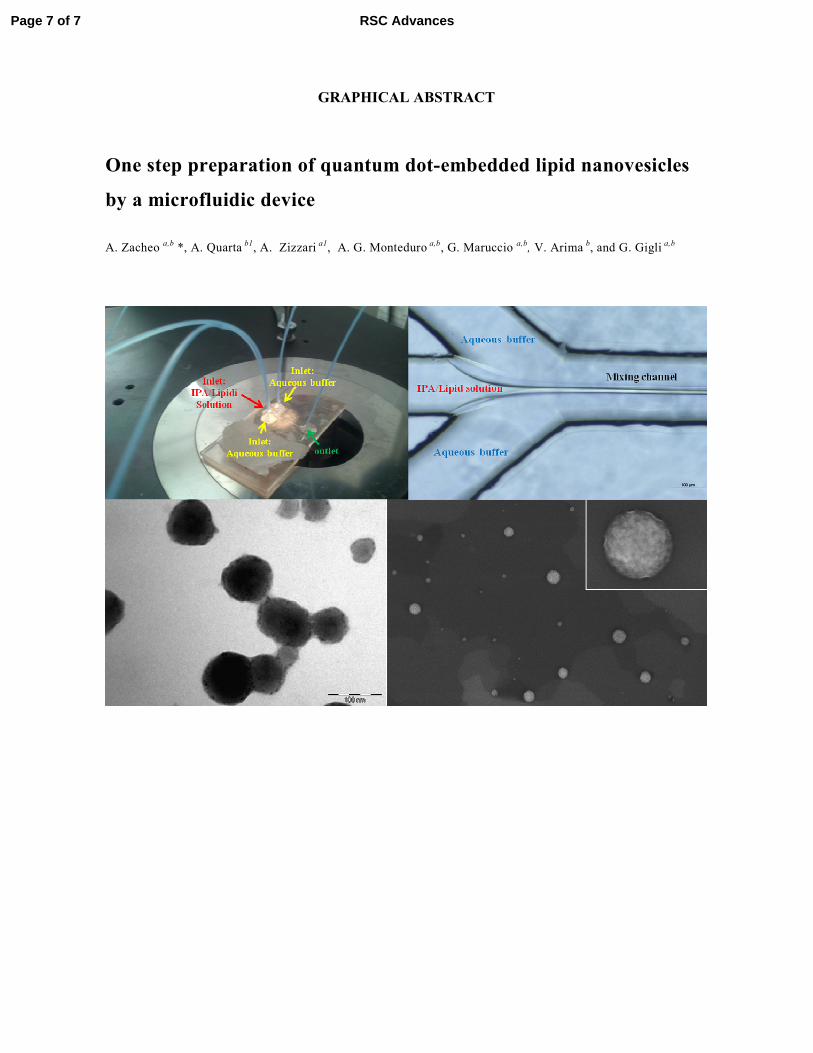
Synthetic carriers that mimic “natural lipid-based vesicles” (micro/nanovesicles, exosomes) have found broad application in biomedicine for the delivery of biomolecules and drugs. Remarkable advantages of using synthetic carriers include the control over the lipid composition, the structure and the size, together with the possibility to add tracer molecules to monitor their in situ distribution via fluorescence microscopy. Over the past years, new methods of vesicles production have been developed and optimized, such as those based on microfluidic techniques. These innovative approaches allow to overcome the limitations faced in conventional methods of liposome preparation, such as size distribution and polydispersity. Herein, a Microfluidic Hydrodynamic Focusing (MHF) device has been used for the production of lipid-based vesicles with different lipids combination that resembles natural exosome, such as phosphatidylcholines (PC), cholesterol (Chol), dicetyl phosphate (DCP) and ceramide (Cer). Thanks to a fine control on fluid manipulation, MHF device allows preparation of vesicles with controlled size, a relevant feature in the emerging field of carrier-assisted cell-delivery. Interestingly, PC/Chol/Cer vesicles exhibit low polydispersity and high stability up to 45 days. Later on, quantum dots (QDs) were successfully embedded in these vesicles through the same preparation process. The development of QDs-embedded lipid nanovesicles by MHF device has never been described previously.
1 Introduction
Local delivery of therapeutic biomolecules (such as peptides, proteins, antibodies, enzyme, drug) to specific cell populations by means of “carriers” has attracted considerable attention during the past decades for several applications in biology and medicine, ranging from basic biophysical studies to treatment of diseases. 1, 2 In this field, significant results have been obtained through the design of synthetic lipid-based systems, called “liposomes”, that mimic “natural vesicles” thanks to their capability of providing drug protection against metabolism, controlled release, prolonged circulation time, reduced toxicity and cell/tissue targeting for the treatment of a variety of diseases. 3 Among natural vesicles, exosomes are of great appeal as carriers: they display small size (with a diameter from 50 to 150 nm) and high level of stability due to the peculiar composition of the lipid bilayer. Indeed, they are enriched in cholesterol, saturated fatty acid (as phosphatidylcholines) 4 and unique and distinct lipids, such as ceramide. 5 In the light of above, synthetic vesicles may be designed to mimic natural ones through a fine control of their structure and composition in order to make them properly tailored for the desired target, with the possibility to add tracer molecules to monitor their in situ
distribution via fluorescence microscopy. 6 In the last decade, thanks to their unique optical properties (i.e. great photostability, broad excitation wavelengths and narrow emission spectra), QDs have been broadly employed as tracers for labeling cellular populations or subcellular compartments, for tracking processes/interactions at the nanoscale, and for imaging of either fixed or living specimens. 7-10
Bio-imaging studies with QDs-containing liposomes have been also reported to track their localization at the tumor site after in vivo injection 11 or to target biomolecules in normal or pathological tissue specimens.12, 13 It is worth to note that controlling liposome size and size polydispersity is very crucial for efficient cellular uptake and extended circulation time.14 Indeed, several studies have described how the specific applications of liposomes are governed by their size and structure, and how these factors can be influenced by several parameters (such as pH, temperature, buffer solution and lipid types) and by the preparation procedures.15-19 So far, several preparation methods have been developed. Conventional techniques (such as detergent dialysis 12, 20, sonication 13, 21, film hydration method 22, solvent injection technique23) remain popular as they are simple to implement and do not require sophisticated equipment. However, they are often limited by several drawbacks, including heterogeneous size distribution, high temperature exposure and incomplete removal of the organic phases that could alter the phospholipid stability and the cargo molecules. Over the years, new methods of liposome production have been explored and optimized to overcome these limitations. Among them, microfluidic technologies like micro hydrodynamic focusing (MHF) 24-26 single hydrodynamic focusing (SHF) and double hydrodynamic focusing (DHF) 27 offer a precise control over the liposome size and polydispersity. Other techniques are available and an exhaustive description of them can be found in two recent reviews. 28, 29 Herein, a MHF device (Fig. 1) has been used for the production of lipid-based vesicles that resemble natural exosome in terms of lipid
Page 1 of 7 RSC Advances
ARTICLE Journal Name
2 | J. Name., 2012, 00, 1-3 This journal is © The Royal Society of Chemistry 2012
composition and dimension. Moreover, the novelty of this approach lies in the possibility to incorporate nanocrystals within the vesicles in one single step. Different combinations of lipids that are generally present in natural exosomes, such as phosphatidylcholines (PC), cholesterol (Chol), dicetyl phosphate (DCP) and ceramide (Cer), were considered (see Table S1 in ESI). The effects of different flow rate ratios (FRRs) (9:1; 18:1) and total volumetric flow rate (Qt) on vesicle size and polydispersity index (pdi) were investigated, as well as their stability over time. Additionally, fluorescent nanocrystals (QDs) displaying different emitting colors and sizes were incorporated into the vesicles, thus showing the versatility of the approach here presented. Notably, the incorporation of QDs enables fluorescent tracking of the vesicles with regard to future applications as imaging and delivery tools.
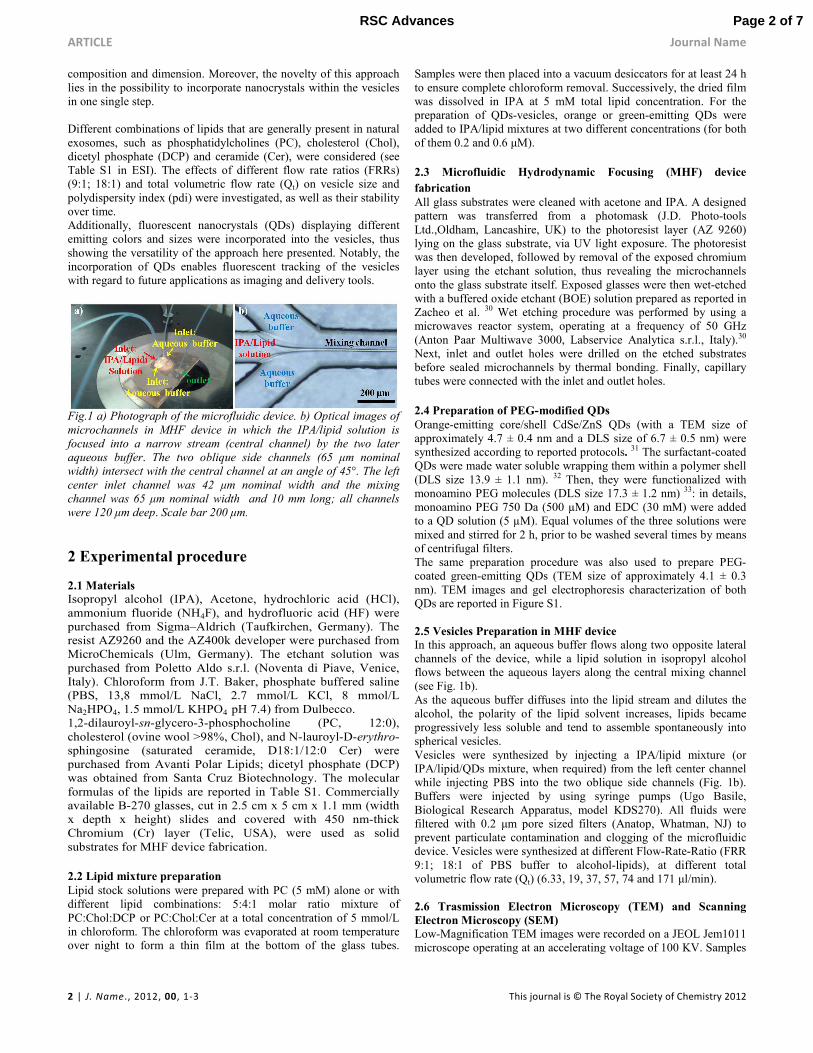
Fig.1 a) Photograph of the microfluidic device. b) Optical images of
microchannels in MHF device in which the IPA/lipid solution is
focused into a narrow stream (central channel) by the two later
aqueous buffer. The two oblique side channels (65 µm nominal
width) intersect with the central channel at an angle of 45°. The left
center inlet channel was 42 µm nominal width and the mixing
channel was 65 µm nominal width and 10 mm long; all channels
were 120 µm deep. Scale bar 200 µm.
2 Experimental procedure
2.1 Materials
Isopropyl alcohol (IPA), Acetone, hydrochloric acid (HCl), ammonium fluoride (NH4F), and hydrofluoric acid (HF) were purchased from Sigma–Aldrich (Taufkirchen, Germany). The resist AZ9260 and the AZ400k developer were purchased from MicroChemicals (Ulm, Germany). The etchant solution was purchased from Poletto Aldo s.r.l. (Noventa di Piave, Venice, Italy). Chloroform from J.T. Baker, phosphate buffered saline (PBS, 13,8 mmol/L NaCl, 2.7 mmol/L KCl, 8 mmol/L Na2HPO4, 1.5 mmol/L KHPO4 pH 7.4) from Dulbecco. 1,2-dilauroyl-sn-glycero-3-phosphocholine (PC, 12:0), cholesterol (ovine wool >98%, Chol), and N-lauroyl-D-erythro-sphingosine (saturated ceramide, D18:1/12:0 Cer) were purchased from Avanti Polar Lipids; dicetyl phosphate (DCP) was obtained from Santa Cruz Biotechnology. The molecular formulas of the lipids are reported in Table S1. Commercially available B-270 glasses, cut in 2.5 cm x 5 cm x 1.1 mm (width x depth x height) slides and covered with 450 nm-thick Chromium (Cr) layer (Telic, USA), were used as solid substrates for MHF device fabrication. 2.2 Lipid mixture preparation
Lipid stock solutions were prepared with PC (5 mM) alone or with different lipid combinations: 5:4:1 molar ratio mixture of PC:Chol:DCP or PC:Chol:Cer at a total concentration of 5 mmol/L in chloroform. The chloroform was evaporated at room temperature over night to form a thin film at the bottom of the glass tubes.
Samples were then placed into a vacuum desiccators for at least 24 h to ensure complete chloroform removal. Successively, the dried film was dissolved in IPA at 5 mM total lipid concentration. For the preparation of QDs-vesicles, orange or green-emitting QDs were added to IPA/lipid mixtures at two different concentrations (for both of them 0.2 and 0.6 µM). 2.3 Microfluidic Hydrodynamic Focusing (MHF) device
fabrication
All glass substrates were cleaned with acetone and IPA. A designed pattern was transferred from a photomask (J.D. Photo-tools Ltd.,Oldham, Lancashire, UK) to the photoresist layer (AZ 9260) lying on the glass substrate, via UV light exposure. The photoresist was then developed, followed by removal of the exposed chromium layer using the etchant solution, thus revealing the microchannels onto the glass substrate itself. Exposed glasses were then wet-etched with a buffered oxide etchant (BOE) solution prepared as reported in Zacheo et al. 30 Wet etching procedure was performed by using a microwaves reactor system, operating at a frequency of 50 GHz (Anton Paar Multiwave 3000, Labservice Analytica s.r.l., Italy).30 Next, inlet and outlet holes were drilled on the etched substrates before sealed microchannels by thermal bonding. Finally, capillary tubes were connected with the inlet and outlet holes. 2.4 Preparation of PEG-modified QDs
Orange-emitting core/shell CdSe/ZnS QDs (with a TEM size of approximately 4.7 ± 0.4 nm and a DLS size of 6.7 ± 0.5 nm) were synthesized according to reported protocols. 31 The surfactant-coated QDs were made water soluble wrapping them within a polymer shell (DLS size 13.9 ± 1.1 nm). 32 Then, they were functionalized with monoamino PEG molecules (DLS size 17.3 ± 1.2 nm) 33: in details, monoamino PEG 750 Da (500 µM) and EDC (30 mM) were added to a QD solution (5 µM). Equal volumes of the three solutions were mixed and stirred for 2 h, prior to be washed several times by means of centrifugal filters. The same preparation procedure was also used to prepare PEG-coated green-emitting QDs (TEM size of approximately 4.1 ± 0.3 nm). TEM images and gel electrophoresis characterization of both QDs are reported in Figure S1. 2.5 Vesicles Preparation in MHF device
In this approach, an aqueous buffer flows along two opposite lateral channels of the device, while a lipid solution in isopropyl alcohol flows between the aqueous layers along the central mixing channel (see Fig. 1b). As the aqueous buffer diffuses into the lipid stream and dilutes the alcohol, the polarity of the lipid solvent increases, lipids became progressively less soluble and tend to assemble spontaneously into spherical vesicles. Vesicles were synthesized by injecting a IPA/lipid mixture (or IPA/lipid/QDs mixture, when required) from the left center channel while injecting PBS into the two oblique side channels (Fig. 1b). Buffers were injected by using syringe pumps (Ugo Basile, Biological Research Apparatus, model KDS270). All fluids were filtered with 0.2 µm pore sized filters (Anatop, Whatman, NJ) to prevent particulate contamination and clogging of the microfluidic device. Vesicles were synthesized at different Flow-Rate-Ratio (FRR 9:1; 18:1 of PBS buffer to alcohol-lipids), at different total volumetric flow rate (Qt) (6.33, 19, 37, 57, 74 and 171 µl/min). 2.6 Trasmission Electron Microscopy (TEM) and Scanning
Electron Microscopy (SEM)
Low-Magnification TEM images were recorded on a JEOL Jem1011 microscope operating at an accelerating voltage of 100 KV. Samples
Page 2 of 7RSC Advances

Journal Name ARTICLE
This journal is © The Royal Society of Chemistry 2012 J. Name., 2012, 00, 1-3 | 3
were prepared by directly dropping few microliters eluted from the device onto carbon coated copper grids and allowing to dry under air prior to imaging. SEM images were recorded in high vacuum and high-resolution acquisition mode using a Carl Zeiss Merlin instrument, equipped with Gemini column and an integrated high efficiency In-lens SE (secondary electrons) detector. Samples were prepared by directly dropping few microliters eluted from the device onto silicon substrates and allowing to dry under air prior to imaging. 2.7 Optical characterization and elemental analysis
The incorporation of QDs in the vesicles was confirmed by Photoluminescence (PL) measurements. PL spectra were recorded using a Cary Eclipse spectrofluorimeter. All sample were excited at 450 nm. QDs concentration was assessed by means of inductively coupled plasma atomic emission spectrometry (ICP-AES, Varian 720-ES) through the preparation of a Cd calibration curve. 2.8 Dynamic Light Scattering (DLS)
The structural characterization of the vesicles (mean diameter, polydispersity index and surface charge) was evaluated by dynamic laser scattering (DLS) and Zeta potential measurements on a Zetasizer Nano ZS90 (Malvern, USA) equipped with a 4.0 mW He−Ne laser operating at 633 nm and with an avalanche photodiode detector. Measurements were made at 25 °C in water. Each sample was measured three times and the reported values are indicated as an average over the values obtained on these measurements and the error calculated as standard deviation. All experiments were repeated at least twice to ensure repeatability. 2.9 Differential Scanning Calorimetry (DSC)
The lipid melting temperature (Tm) was measured for pure PC, and for either empty- and QDs-embedded PC/Chol/Cer vesicles. For this purpose, DSC measurements were performed with a Q2000 DSC (TA instruments) on approximately 25 µL of vesicles suspensions in sodium phosphate buffer containing 15% (vol/vol) of ethylene glycol to prevent freezing. The measurements were performed in the temperature interval from -20 to 10 °C, with 0.5 °C min−1 scan rate.
3 Results and discussion
Lipid-based nanovesicles made of either pure PC (5 mM in IPA) or different lipid combinations (5:4:1 molar ratio mixture of PC/Chol/DCP or PC/Chol/Cer) were synthesized by a MHF device at room temperature. MHF device allows to control the vesicles size by modifying the ratio of the flow rate in the side inlet channels (PBS buffer) compared to the center inlet channel fed with lipids in IPA. All experiments were repeated at least two independent times to ensure reproducible results. The structural characterization of the vesicles (MHD, pdi and surface charge), and their stability over time (up to 45 days, in some cases) were assessed by Dynamic Light Scattering (DLS). Due to their higher stability and lipid composition, PC/Chol/Cer were successively synthesized with the addition of QDs. TEM and SEM images, and emission spectra were also acquired for QDs-embodying vesicles.
3.1 Preparation of exosome-like vesicles
With the aim to produce lipid vesicles that resemble natural exosome in terms of dimensions and lipid composition, initially saturated phospholipid-based vesicles, such as formed from pure PC, were synthesized and characterized. The smallest MHD was 44±1 nm (pdi
of 0.26) produced from a 5 mM PC solution at FRR 18:1 with a total volumetric flow rate (Qt) of 37 µl/min. Vesicles produced at higher Qt (74 µl/min) in the same conditions, resulted in the same MHD (44±1 nm with a pdi of 0.28) proving that vesicles size distribution remain nearly unaffected by the Qt.
24, 34 Size distribution of PC vesicles formed at different Qt 37 µl/min and 74 µl/min for a constant FRR (18:1) and their stability up to 7 days are reported in Table S2. DLS measurements of pure PC vesicles formed at Qt 74 µl/min and the evolution over time of the pdi are well illustrated in Fig. 2a. After 7 days from the preparation, the mean size of the vesicles remains constant (Table S3), but the intensity of the main peak at about 44 nm decreases from 93 % to 77 %. It also becomes larger and new peaks with a very broad shape are originated (at 396 nm after 7 days and at 531 nm after 5 days, indicated by the arrows). Considering the estimated dimensions of these new particles, they can be likely due to the interaction between multiple vesicles and consequent aggregation. Accordingly, the evolution of the pdi during the time can be explained with the formation of larger vesicles due to the coalescence of the smaller ones.
Fig. 2. Size distribution and pdi evolution on a) pure PC and b)
PC/Chol/Cer vesicles formed at Qt 74 µl/min, FRR 18:1, and
monitored for a week. Curves were shifted vertically for better
graphic representation.
Page 3 of 7 RSC Advances
ARTICLE Journal Name
4 | J. Name., 2012, 00, 1-3 This journal is © The Royal Society of Chemistry 2012
Moreover, larger vesicles were produced at FRR 9:1 for different Qt (206 ±14 , pdi of 0.4, and 215±22 nm, pdi of 0.3, for 19µl/min and 57µl/min respectively). The lipid composition also plays a significant role on vesicles size distribution, even working under the same experimental conditions (same channel size, lipid concentration of 5 mM and FRR). Larger liposomes were produced working at a molar ratio of 5:4:1 of PC/Chol/DCP or PC/Chol/Cer. This effect can be ascribed to the presence of cholesterol, a large molecule that strongly increases rigidity of the lipid bilayer at room temperature. This, in turn, affects the bending elasticity modulus, resulting in an overall growth of particle size, as already reported by Zook et al. 25 Indeed, DLS measurements on vesicle formed respectively with pure PC, PC/Chol/DCP and PC/Chol/Cer at Qt= 74 µl/min show that the MHD increases from 44.±1 nm in pure PC vesicles up to 146±5 nm for PC/Chol/DCP and 112±2 nm for PC/Chol/Cer. (Table S3 and Table 1). The introduction of more components in the vesicles resulted in a slightly larger standard deviation of the MHD since fluctuations in the incorporation of large molecules can easily create a higher variability. Moreover, the lipid composition can influence other features, such as the superficial charge (SC). DCP, as an example, confers a negative charge, thus providing electrostatic stability to the resulting liposome, minimizing aggregation. As expected, a negative surface charge (SC) of -34±3.6 mV has been recorded for PC/Chol/DCP vesicles due to the ionization of phosphate groups. However, the most interesting result was the amazing low polidispersity and stability of ceramide containing vesicles (Fig. 2b), as already reported in literature for liposome containing ceramide. 35 Moreover, saturated ceramide has been shown to promote the formation of highly ordered gel domains thus favoring the membrane stability. 36 As reported in Table 1 (and Fig. 2), a pdi of 0.08 was calculated soon after the preparation and it increased at 0.25 after 7 days from the preparation. Small fluctuations have been registered even later on, after 45 days: their MHD increases of 8%, and pdi was still below 0.3. (See Fig. S2 and Table S4 for measurements up to 45 days)
MHD (nm)
SC (mV) pdi0 pdi7
PC 44.±1 - 2.5±1.7 0.28±0.04 0.39±0.09 PC/Chol/DCP 146±5 -34.0±3.6 0.16±0.02 0.29±0.04 PC/Chol/Cer 112±2 - 3.1±0.7 0.08±0.01 0.25±0.03
Table 1. Mean hydrodynamic diameter (MHD), surface charge (SC)
and the polydispersity index soon after preparation (pdi0) and after
7 days (pdi7) of respectively PC, PC/Chol/DCP and PC/Chol/Cer
vesicle types (FRR=18:1, Qt = 74 µl/min).
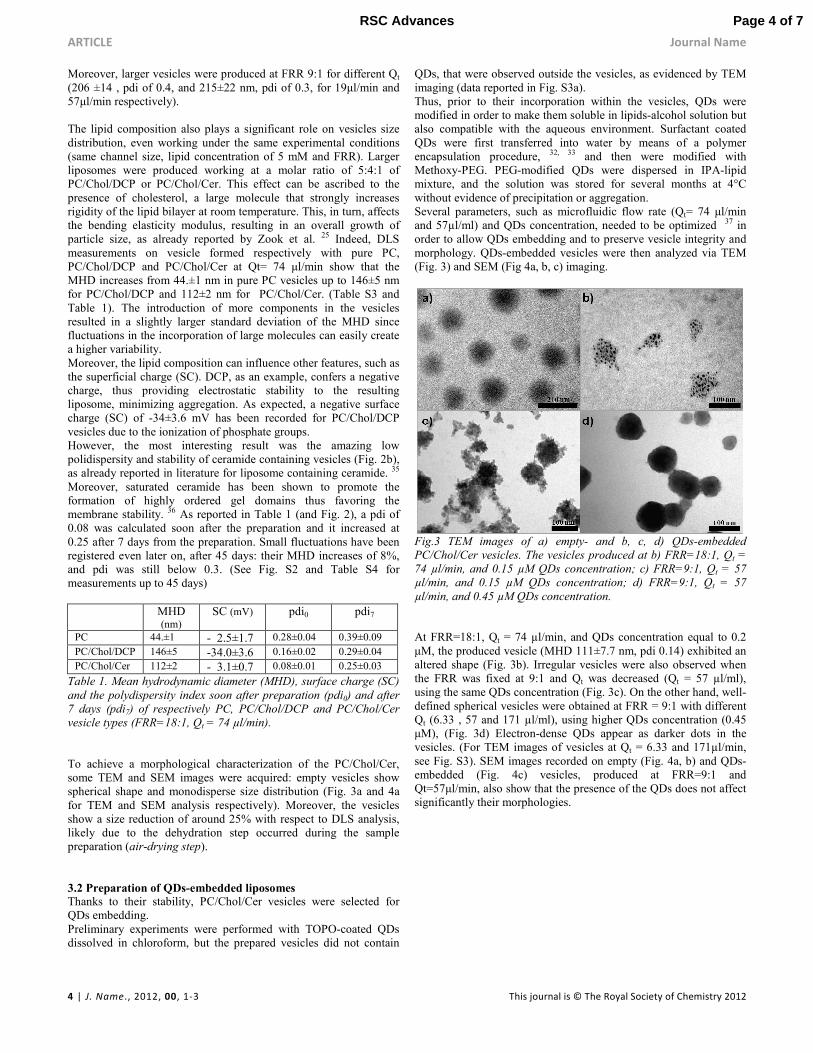
To achieve a morphological characterization of the PC/Chol/Cer, some TEM and SEM images were acquired: empty vesicles show spherical shape and monodisperse size distribution (Fig. 3a and 4a for TEM and SEM analysis respectively). Moreover, the vesicles show a size reduction of around 25% with respect to DLS analysis, likely due to the dehydration step occurred during the sample preparation (air-drying step). 3.2 Preparation of QDs-embedded liposomes
Thanks to their stability, PC/Chol/Cer vesicles were selected for QDs embedding. Preliminary experiments were performed with TOPO-coated QDs dissolved in chloroform, but the prepared vesicles did not contain
QDs, that were observed outside the vesicles, as evidenced by TEM imaging (data reported in Fig. S3a). Thus, prior to their incorporation within the vesicles, QDs were modified in order to make them soluble in lipids-alcohol solution but also compatible with the aqueous environment. Surfactant coated QDs were first transferred into water by means of a polymer encapsulation procedure, 32, 33 and then were modified with Methoxy-PEG. PEG-modified QDs were dispersed in IPA-lipid mixture, and the solution was stored for several months at 4°C without evidence of precipitation or aggregation. Several parameters, such as microfluidic flow rate (Qt= 74 µl/min and 57µl/ml) and QDs concentration, needed to be optimized 37 in order to allow QDs embedding and to preserve vesicle integrity and morphology. QDs-embedded vesicles were then analyzed via TEM (Fig. 3) and SEM (Fig 4a, b, c) imaging.
Fig.3 TEM images of a) empty- and b, c, d) QDs-embedded
PC/Chol/Cer vesicles. The vesicles produced at b) FRR=18:1, Qt =
74 µl/min, and 0.15 µM QDs concentration; c) FRR=9:1, Qt = 57
µl/min, and 0.15 µM QDs concentration; d) FRR=9:1, Qt = 57
µl/min, and 0.45 µM QDs concentration.
At FRR=18:1, Qt = 74 µl/min, and QDs concentration equal to 0.2 µM, the produced vesicle (MHD 111±7.7 nm, pdi 0.14) exhibited an altered shape (Fig. 3b). Irregular vesicles were also observed when the FRR was fixed at 9:1 and Qt was decreased (Qt = 57 µl/ml), using the same QDs concentration (Fig. 3c). On the other hand, well-defined spherical vesicles were obtained at FRR = 9:1 with different Qt (6.33 , 57 and 171 µl/ml), using higher QDs concentration (0.45 µM), (Fig. 3d) Electron-dense QDs appear as darker dots in the vesicles. (For TEM images of vesicles at Qt = 6.33 and 171µl/min, see Fig. S3). SEM images recorded on empty (Fig. 4a, b) and QDs-embedded (Fig. 4c) vesicles, produced at FRR=9:1 and Qt=57µl/min, also show that the presence of the QDs does not affect significantly their morphologies.
Page 4 of 7RSC Advances

Journal Name ARTICLE
This journal is © The Royal Society of Chemistry 2012 J. Name., 2012, 00, 1-3 | 5
Fig.4 SEM images of a) empty- and c) QDs-embedded PC/Chol/Cer
vesicles produced at FRR=9:1, Qt = 57 µl/min; b) higher-
magnification SEM images of the empty vesicle highlighted by the
square in a). d) representative size distribution of PC/Chol/Cer
(blue line) and PC/Chol/Cer/QDs (red line) vesicles.
Incorporation of QDs in the vesicles also resulted in a slight increase of the average size, from 225±12 nm (bare vesicles, pdi 0.23) to 295±4 nm (QDs embedded vesicles, pdi 0.19), as determined by DLS (Fig. 4d), both produced at FRR 9:1 and Qt 57 µl/ml. DLS measurements performed on these vesicles confirmed their stability and low polydispersity up to one week (Table S5). All these findings would suggest that QDs likely accumulate in the aqueous core of the vesicles. Photoluminescence (PL) measurements of the QDs were performed prior to and after their encapsulation within the vesicles. Fig. 5 shows the PL curves of surfactant-coated QDs (dark-red curve), PEG-modified QD dissolved in lipid mixture (orange curve), and PEG-modified QD embedded into the vesicles (yellow curve). The curve of the empty vesicles is also reported (green curve). Modification of the QD with PEG determined a consistent blue-shift of the emission peak from 580 to 565 nm. The QD signal is clearly detectable, even when they are embedded inside the vesicles, although the curve is rather noisy due to scattering signals of the lipid matrix, as shown by the curve of the empty vesicles. Additionally, the QDs encapsulation efficiency was determined by elemental analysis: almost 68% of QDs injected were successfully embedded. In order to prove the versatility of the preparation approach here presented, green-emitting QDs were also successfully embedded within the vesicles. As shown in TEM image of Fig. S1ethe resulting nanovesicles were almost uniform with a regular shape, and a mean size of around 237 ± 5 nm (pdi 0.17), as determined by DLS.
Differential Scanning Calorimetry (DSC) DSC measurements were performed on empty and QD-embedded vesicles as well as on pure PC, which is the lipid component at higher concentration ratio in the lipid mixture. As shown in Figure 5b, the main bilayer transition between the more ordered rigid ripple gel phase Pβ' and the liquid-crystalline phase Lα is observed for the vesicles to shift at lower temperatures than for pure PC (precisely from -2.8 to -1.2 °C respectively). Moreover, the endothermic peak is also broaden as compared to pure PC. This behavior may be ascribed to the presence of cholesterol and ceramide within the vesicle, that contributes to increase the fluidity of the bilayer. Notably, the curve of the QD-embedded vesicles is very similar to that of the empty vesicles: only a slight shift at higher temperatures
(less than 0.5 °C, see the inset in Fig 5b) is reported. This may be considered a further indication that QDs are hosted into the core of the vesicles: indeed, it should be expected that their localization into the bilayer would lead to a substantial variation of the lipids arrangement and thus a consequent change in the system stability and its transition temperature.
Fig.5 a) Photoluminescence spectra of QD before and after
embedding into the vesicles. The curve of the empty vesicles was
recorded, as well. The samples were excited at 488 nm. b) DSC
measurements performed on PC (black curve), empty vesicles (blue
curve) and QD-embedded vesicles (red curve).
4 Conclusions
In the present work, we have shown the preparation of QDs-embedded nanovesicles prepared with different lipid combinations, typically present in natural exosomes. The original contribution of our approach lies in the incorporation of hydrophilic QDs in vesicles in one step process by microfluidic hydrodynamic focusing (MHF) device. The experimental results showed that different FRR and lipid mixtures influenced the particle mean size. Using DLS analysis, we verified the low polidispersity and stability of the PC/Chol/Cer vesicles up to 45 days. Thanks to their stability, these vesicles were selected for QDs embedding. For this aim, FRR and QDs concentration were optimized, resulting in fluorescent vesicles with a slight increase of
Page 5 of 7 RSC Advances

ARTICLE Journal Name
6 | J. Name., 2012, 00, 1-3 This journal is © The Royal Society of Chemistry 2012
the average size when compared to the empty ones. Moreover, TEM and SEM analysis showed well-defined spherical vesicles. The ability to entrap QDs in the lipid nanovesicles will drive future works for specific biomolecule/drug incorporation with regard to clinical applications for both in vitro and in vivo tracking of therapeutic agents.
Acknowledgements The authors are grateful to the projects PON R&C 2007-2013 (Avviso n. 713/Ric. del 29 ottobre 2010) MAAT-Molecular NAnotechnology for HeAlth and Environment (Project Number: PON02_00563_3316357). Notes and references a Department of Mathematics and Physics “Ennio De Giorgi'' Università del Salento, Via Arnesano, 73100 Lecce (Italy); b CNR–Istituto di Nanotecnologia (NANOTEC), Via per Arnesano, 73100 Lecce, Italy
*Corresponding author. E-mail: [email protected] Electronic Supplementary Information (ESI) are available.
1. E. Blanco, H. Shen and M. Ferrari, Nature Biotechnology, 2015,
33, 941-951. 2. T. M. Allen and P. R. Cullis, Advanced Drug Delivery Reviews,
2013, 65, 36-48. 3. R. van der Meel, M. H. Fens, P. Vader, W. W. van Solinge, O.
Eniola-Adefeso and R. M. Schiffelers, J. Controlled Release, 2014, 195, 72-85.
4. S. Fais, M. Logozzi, L. Lugini, C. Federici, T. Azzarito, N. Zarovni and A. Chiesi, Biological Chemistry, 2013, 394, 1-15.
5. A. V. Vlassov, S. Magdaleno, R. Setterquist and R. Conrad, Biochimica Et Biophysica Acta-General Subjects, 2012, 1820, 940-948.
6. S. Bibi, R. Kaur, M. Henriksen-Lacey, S. E. McNeil, J. Wilkhu, E. Lattmann, D. Christensen, A. R. Mohammed and Y. Perrie, International Journal of Pharmaceutics, 2011, 417, 138-150.
7. A. Zacheo, A. Quarta, A. Mangoni, P. P. Pompa, R. Mastria, M. C. Capogrossi, R. Rinaldi and T. Pellegrino, Ieee Transactions on Nanobioscience, 2011, 10, 209-215.
8. X. H. Gao, L. L. Yang, J. A. Petros, F. F. Marshal, J. W. Simons and S. M. Nie, Current Opinion in Biotechnology, 2005, 16, 63-72.
9. H. Koo, M. S. Huh, J. H. Ryu, D. E. Lee, I. C. Sun, K. Choi, K. Kim and I. C. Kwon, Nano Today, 2011, 6, 204-220.
10. J. B. Delehanty, H. Mattoussi and I. L. Medintz, Analytical and
Bioanalytical Chemistry, 2009, 393, 1091-1105. 11. K. C. Weng, C. O. Noble, B. Papahadjopoulos-Sternberg, F. F.
Chen, D. C. Drummond, D. B. Kirpotin, D. H. Wang, Y. K. Hom, B. Hann and J. W. Park, Nano Letters, 2008, 8, 2851-2857.
12. V. Sigot, D. J. Arndt-Jovin and T. M. Jovin, Bioconjugate Chemistry, 2010, 21, 1465-1472.
13. W. T. Al-Jamal, K. T. Al-Jamal, B. Tian, L. Lacerda, P. H. Bornans, P. M. Frederik and K. Kostarelos, ACS Nano, 2008, 2, 408-418.
14. V. P. Torchilin, Nat. Rev. Drug Discovery, 2014, 13, 813. 15. R. Genç, M. Ortiz and C. K. O′Sullivan, Langmuir, 2009, 25,
12604-12613. 16. M. P. Nieh, T. A. Harroun, V. A. Raghunathan, C. J. Glinka and J.
Katsaras, Biophys. J., 2004, 86, 2615. 17. M. P. Nieh, V. A. Raghunathan, S. R. Kline, T. A. Harroun, C. Y.
Huang, J. Pencer and J. Katsaras, Langmuir, 2005, 21, 6656. 18. S. Šegota and D. Težak, Adv. Colloid Interface Sci., 2006, 121,
51.
19. S. Garcia-Manyes, G. Oncins and F. Sanz, J. Biophys., 2005, 89, 4261.
20. H. Alpes, K. Allmann, H. Plattner, J. Reichert, R. Rick and S. Schulz, Biochim. Biophys. Acta, 1986, 862, 294.
21. S. Biswas, N. S. Dodwadkar, P. P. Deshpande and V. P. Torchilin, J. Controlled Release, 2012, 159, 393.
22. A. D. Bangham, J. De Gier and G. D. Greville, Chemistry and
Physics of Lipids, 1967, 1, 225-246. 23. P. Stano, S. Bufali, C. Pisano, F. Bucci, M. Barbarino, M.
Santaniello, P. Carminati and P. L. Luisi, J. Liposome Res., 2004, 14, 87.
24. A. Jahn, W. N. Vreeland, M. Gaitan and L. E. Locascio, Journal of the American Chemical Society, 2004, 126, 2674-2675.
25. J. M. Zook and W. N. Vreeland, Soft Matter, 2010, 6, 1352-1360. 26. A. U. Andar, R. R. Hood, W. N. Vreeland, D. L. Devoe and P. W.
Swaan, Pharmaceutical Research, 2014, 31, 401-413. 27. T. A. Balbino, N. T. Aoki, A. A. Gasperini, C. L. Oliveira, A. R.
Azzoni, L. P. Cavalcanti and L. G. de la Torre, Chem. Eng. J., 2013, 226, 423.
28. Y. P. Patil and S. Jadhav, Chemistry and Physics of Lipids, 2014, 177, 8-18.
29. B. S. Pattni, V. V. Chupin and V. P. Torchilin, Chemical Reviews, 2015, 115, 10938-10966.
30. A. Zacheo, A. Zizzari, E. Perrone, L. Carbone, G. Giancane, L. Valli, R. Rinaldi and V. Arima, Lab on a Chip, 2015, 15, 2395-2399.
31. B. O. Dabbousi, J. RodriguezViejo, F. V. Mikulec, J. R. Heine, H. Mattoussi, R. Ober, K. F. Jensen and M. G. Bawendi, Journal of
Physical Chemistry B, 1997, 101, 9463-9475. 32. T. Pellegrino, L. Manna, S. Kudera, T. Liedl, D. Koktysh, A. L.
Rogach, S. Keller, J. Radler, G. Natile and W. J. Parak, Nano
Letters, 2004, 4, 703-707. 33. A. Quarta, A. Curcio, H. Kakwere and T. Pellegrino, Nanoscale,
2012, 4, 3319-3334. 34. A. Jahn, W. N. Vreeland, D. L. DeVoe, L. E. Locascio and M.
Gaitan, Langmuir, 2007, 23, 6289-6293. 35. B. Boulgaropoulos, Z. Arsov, P. Laggner and G. Pabst,
Biophysical Journal, 2011, 100, 2160-2168. 36. S. N. Pinto, L. C. Silva, A. H. Futerman and M. Prieto,
Biochimica Et Biophysica Acta-Biomembranes, 2011, 1808, 2753-2760.
37. V. R. Kethineedi, G. Crivat, M. A. Tarr and Z. Rosenzweig, Analytical and Bioanalytical Chemistry, 2013, 405, 9729-9737.
Page 6 of 7RSC Advances
GRAPHICAL ABSTRACT
One step preparation of quantum dot-embedded lipid nanovesicles
by a microfluidic device
A. Zacheo a,b *, A. Quarta b1, A. Zizzari a1, A. G. Monteduro a,b, G. Maruccio a,b, V. Arima b, and G. Gigli a,b
Page 7 of 7 RSC Advances