one lepton mode background mt and new mt method (including systematic errors)
DESCRIPTION
One Lepton Mode Background MT and new MT method (including systematic errors). SUSY Background meeting (CSC1&2) 27. Nov 2007 Ginga Akimoto , S.Asai, Y.Kataoka, N.Kanaya The University of Tokyo, ICEPP. Table of Contents. Update Digest of BG estimation Systematic Error Study - PowerPoint PPT PresentationTRANSCRIPT
1
The Univ. of TokyoDept. of Physics
One Lepton Mode BackgroundMT and new MT method
(including systematic errors)
SUSY Background meeting (CSC1&2) 27. Nov 2007
Ginga Akimoto , S.Asai, Y.Kataoka, N.KanayaThe University of Tokyo, ICEPP
Page 2
Dept of Physics
SUSY Background meeting (CSC 1&2) Ginga Akimoto
Table of Contents
1. Update2. Digest of BG estimation 3. Systematic Error Study4. BG estimation with K factor5. Conclusion & Outlook
I have already shown the detail of our method in the previous meeting, so I focus on the systematic errors today.

Page 3
Dept of Physics
SUSY Background meeting (CSC 1&2) Ginga Akimoto
I. Update
1. 2nd Lepton (PT>10GeV) veto
2. Effective Mass : add Lepton PT
3. Transverse Mass : add Lepton PT
4. Systematic Error Study of ( lepton efficiency , Enegy Scale, STACO muon selection , MC @ NLO)
5. BG estimation with K factor
Used samples are the CSC full-simulation samples (v12.0.6.5) and systematic error samples (including fast simulation) . [same to previous meeting]In Addition to these , we use ATLFAST alpgen samples to study lepton efficiency.

Page 4
Dept of Physics
SUSY Background meeting (CSC 1&2) Ginga Akimoto
II. Bakground Estimation : MT and new MT MethodThis figure shows MT distribution of SUSY(SU3) and background processes, which is calculated with missing ET and Lepton PT. The main background processes are top and W.
1. MT<100GeV : Background ( top &W) enhanced Sample [Control Sample]
2. MT>100GeV : SUSY signal enhanced Sample [Signal Region]
Signal RegionMT>100GeV
ControlSampleMT<100GeV
[MT-Method]
The background distributions of One Lepton Channel are estimated with Control Sample.
(detail has already shown in the previous many meetings.)

Page 5
Dept of Physics
SUSY Background meeting (CSC 1&2) Ginga Akimoto
II. Background Estimation (w/o SUSY)
Magenta with error :
estimated BG with C.S.
Black line : (truth) all BG process
(ttbbll dominant)
1. Following figure shows missing ET distribution of background processes (and estimation with original MT method). Magenta line shows estimated background processes with MT method and black line is truth background .
2. # of mET>100GeV and mET>300GeV is also reproduced well.
Truth BG Estimated BG
mET>100GeV 135+/-11 127+/-4 (94+/-7%)
mET>300GeV 9.8+/-3 7.0+/-1 (71+/-24%)
Events number is also well reproduced.

Page 6
Dept of Physics
SUSY Background meeting (CSC 1&2) Ginga Akimoto
II Background Estimation ( with SUSY)
Background distributions are overestimated with original MT method as following reasons if SUSY exists. (But SUSY signals are detectable with this method).
1. SUSY contamination in Control Sample distorts the distribution of Control Sample . It makes main discrepancy from truth BG.
2. In addition to the distribution, normalization factors are affected by SUSY contamination, which cannot be negligible even in lower mET region and makes the background overestimated.
To remove these contamination effects.l The distribution of the contamination is estimated with Signal Region.l The amount of the contamination is about 0.7 (times scaled Signal Region).l Normalization factor is obtained in the region of mET=[100-150GeV] in stead o
f mET=[100-200GeV].
1. With these corrections we can estimate the background correctly. (detail has already shown in the previous meetings.)

Page 7
Dept of Physics
SUSY Background meeting (CSC 1&2) Ginga Akimoto
III Systematic error study : original CSC sample
This figure shows Missing ET and Effective Mass distribution (truth (black line)& estimated BG with new MT method (red line ) ). With MT and new method we can estimate the background correctly. Statistic Errors and ratio
BG(estimated) over BG( truth ) is following table.
mET Truth BG estimated BG R=Estimated BG /BG
>100GeV 135+/-11 140+/-5 1.04+/-0.08
>300GeV 9.8+/-3 9.91+/-2.34 0.92+/-0.35

Page 8
Dept of Physics
SUSY Background meeting (CSC 1&2) Ginga Akimoto
III Systematic Error Study
List of Systematic Error Study1. Energy scale (change mET and Jet PT by +/-5% )
2. Top : LO-> NLO3. STACO muon collection4. Lepton efficiency 2%
We chacked these systematic errors

Page 9
Dept of Physics
SUSY Background meeting (CSC 1&2) Ginga Akimoto
III systematic error : Enegy scale x1.05
mET >100GeV mET>300GeV
MT w/o SUSY New MT method MT w/o SUSY New MT method
BG 143+/-12 12.2+/-3.5
BG est. 137+/-3.8 153+/-5 9.4+/-1.1 8.7+/-2.3
R = BG est. / BG 0.96+/-0.08 1.07+/-0.09 0.77+/-0.23 0.71+/-0.27
BG(syst.) / BG (original) 1.06+/-0.13 1.24+/-0.45
R(syst.) / R(original) 1.01+/-0.12 1.13+/-0.14 1.08+/-0.36 1.01+/-0.39
[BG] means real BG.
[BG est] is estimated BG(MT w/o SUSY and new MT with SUSY).
[BG(syst.)/BG(original)] is [BG] difference from original sample.

Page 10
Dept of Physics
SUSY Background meeting (CSC 1&2) Ginga Akimoto
III Systematic error : Top (T1) MC @ LO->NLO
mET >100GeV mET>300GeV
MT w/o SUSY New MT method MT w/o SUSY New MT method
BG 277+/-17 26.7+/-5.2
BG est. 238+/-6 244+/-416 10.7+/-1.5 9.15+/-1.9
R = BG est. / BG 0.85+/-0.05 0.88+/-0.05 0.40+/-0.09 0.34+/-0.09
BG(syst.) / BG (original) 2.05+/-0.38 2.71+/-1.43
R(syst.) / R(original) 0.90+/-0.08 0.93+/-0.09 0.56+/-0.14 0.48+/-0.14

Page 11
Dept of Physics
SUSY Background meeting (CSC 1&2) Ginga Akimoto
III Systematic error: STACO Muon Collection
mET >100GeV mET>300GeV
MT w/o SUSY New MT method MT w/o SUSY New MT method
BG 140+/-11 9.2+/-3.0
BG est. 133+/-4 136+/-5 7.12+/-0.93 6.72+/-1.9
R = BG est. / BG 0.95+/-0.09 1.10+/-0.13 0.76+/-0.26 0.72+/-0.31
BG(syst.) / BG (original) 1.03+/-0.12 1.03+/-0.12
R(syst.) / R(original) 1.01+/-0.12 1.10+/-0.13 1.07+/-0.39 1.01+/-0.42

Page 12
Dept of Physics
SUSY Background meeting (CSC 1&2) Ginga Akimoto
III Systematic error: Lepton Efficiency (2%)
mET >100GeV mET>300GeV
MT w/o SUSY New MT method MT w/o SUSY New MT method
BG 151+/-12 10.6+/-3.2
BG est. 154+/-3 177+/-4 11.9+/-0.8 13.6+/-1.4
R = BG est. / BG 1.02+/-0.08 1.16+/-0.09 1.12+/-0.35 1.28+/-0.41
These figures show mET and Meff distribution of ATLFAST. We assumed 2% lepton efficiency (Results are next page). Lepton efficiency is negligible (1%).

Page 13
Dept of Physics
SUSY Background meeting (CSC 1&2) Ginga Akimoto
III Systematic error :Lepton Efficiency 2% (atlfast)
mET >100GeV mET>300GeV
MT w/o SUSY New MT method MT w/o SUSY New MT method
BG 150+/-12 10.8+/-3.2
BG est. 153+/-3 175+/-4 11.9+/-0.7 13.4+/-1.4
R = BG est. / BG 1.01+/-0.08 1.16+/-0.09 1.09+/-0.34 1.23+/-0.39
BG(syst.) / BG (original) 0.99+/-0.13 1.02+/-0.23
R(syst.) / R(original) 1.00+/-0.10 1.00+/-0.12 0.97+/-0.39 0.96+/-0.41

Page 14
Dept of Physics
SUSY Background meeting (CSC 1&2) Ginga Akimoto
IV. BG estimation with K factor
mET >100GeV mET>300GeV
MT w/o SUSY New MT method MT w/o SUSY New MT method
BG 261+/-16 17.0+/-4.1
BG est. 246+/-5 256+/-6 11.8+/-0.9 10.6+/-2.3
R = BG est. / BG 0.94+/-0.06 0.98+/-0.06 0.69+/-0.28 0.69+/-0.20
BG(syst.) / BG (original) 1.93+/-0.28 1.73+/-0.73
R(syst.) / R(original) 0.99+/-0.10 1.04+/-0.10 0.97+/-0.29 0.87+/-0.30
These K factors are applied .
1. SUSY 1.52. Top 2.023. W/Z 1.244. QCD 2.6
Page 15
Dept of Physics
SUSY Background meeting (CSC 1&2) Ginga Akimoto
V. Conclusion
Conclusion & Outlook1. We applied MT / new MT methods to various systematic e
rror sample and study other systematic errors.2. BG estimation with K factor3. In any case SUSY is detectable and estimated background
s are comparatively consistent with statistic errors. These methods are stable against systematic errors.

Page 16
Dept of Physics
SUSY Background meeting (CSC 1&2) Ginga Akimoto
Backup

Page 17
Dept of Physics
SUSY Background meeting (CSC 1&2) Ginga Akimoto
III Systematic : MT cut 100GeV-->110GeV

Page 18
Dept of Physics
SUSY Background meeting (CSC 1&2) Ginga Akimoto
III Systematic : Top ME/PS PT 40GeV->15GeV
mET >100GeV mET>300GeV
MT w/o SUSY New MT method MT w/o SUSY New MT method
BG 196+/-14 10.4+/-3.2BG est. 200+/-4 230+/-6 11.4+/-1.0 12.9+/-2.4
R = BG est. / BG 1.02+/-0.07 1.17+/-0.09 1.11+/-0.36 1.25+/-0.45
BG(syst.) over BG (original) 1.03+/-0.11 0.96+/-0.39
R(syst.) / R(original) 1.02+/-0.10 1.08+/-0.13 1.27+/-0.57 1.35+/-0.73
Page 19
Dept of Physics
SUSY Background meeting (CSC 1&2) Ginga Akimoto
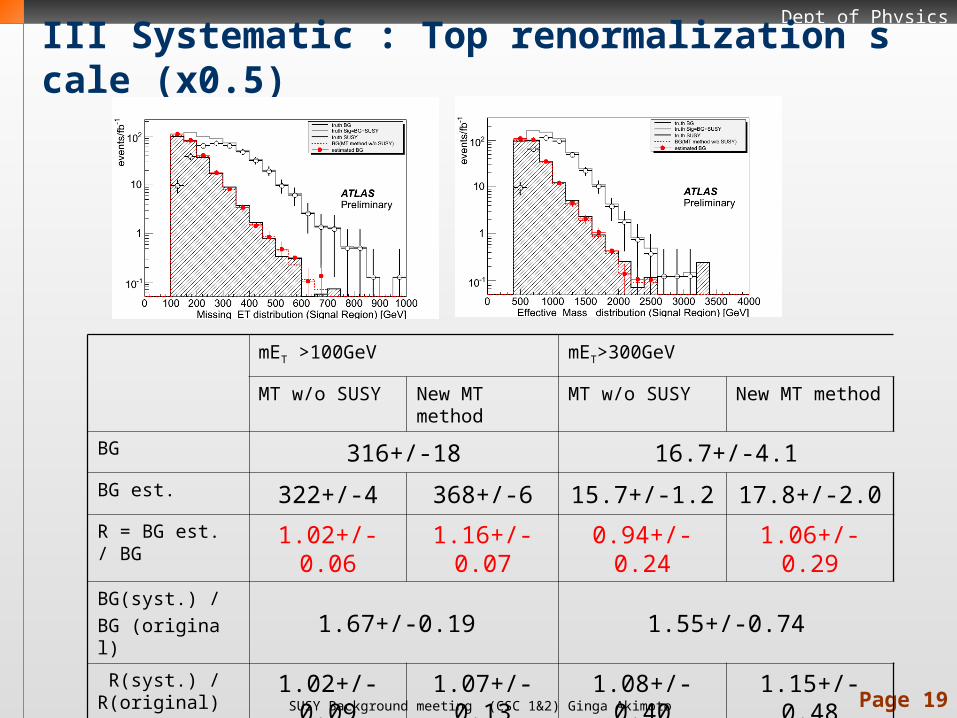
III Systematic : Top renormalization scale (x0.5)
mET >100GeV mET>300GeV
MT w/o SUSY New MT method MT w/o SUSY New MT method
BG 316+/-18 16.7+/-4.1
BG est. 322+/-4 368+/-6 15.7+/-1.2 17.8+/-2.0
R = BG est. / BG 1.02+/-0.06 1.16+/-0.07 0.94+/-0.24 1.06+/-0.29
BG(syst.) / BG (original) 1.67+/-0.19 1.55+/-0.74
R(syst.) / R(original) 1.02+/-0.09 1.07+/-0.13 1.08+/-0.40 1.15+/-0.48

Page 20
Dept of Physics
SUSY Background meeting (CSC 1&2) Ginga Akimoto
III Systematic : W renormalization scale (x0.5)
mET >100GeV mET>300GeV
MT w/o SUSY New MT method MT w/o SUSY New MT method
BG 194+/-14 9.9+/-3.1
BG est. 201+/-4 221+/-6 13.1+/-1.0 14.4+/-2.1
R = BG est. / BG 1.04+/-0.08 1.14+/-0.08 1.32+/-0.43 1.46+/-0.51
BG(syst.) / BG (original) 1.02+/-0.10 0.92+/-0.37
R(syst.) / R(original) 1.04+/-0.11 1.05+/-0.12 1.51+/-0.78 1.58+/-0.93

Page 21
Dept of Physics
SUSY Background meeting (CSC 1&2) Ginga Akimoto
III Systematic : W ME/PS PT40 - >15GeV
mET >100GeV mET>300GeV
MT w/o SUSY New MT method MT w/o SUSY New MT method
BG 180+/-13 9.7+/-3.1
BG est. 182+/-4 183+/-5 10.4+/-1.0 10.3+/-2.0
R = BG est. / BG 1.01+/-0.07 1.01+/-0.08 1.07+/-0.36 1.07+/-0.40
BG(syst.) / BG (original) 0.95+/-0.10 0.90+/-0.37
R(syst.) / R(original) 1.02+/-0.10 0.93+/-0.10 1.23+/-0.56 1.15+/-0.58
Page 22
Dept of Physics
SUSY Background meeting (CSC 1&2) Ginga Akimoto
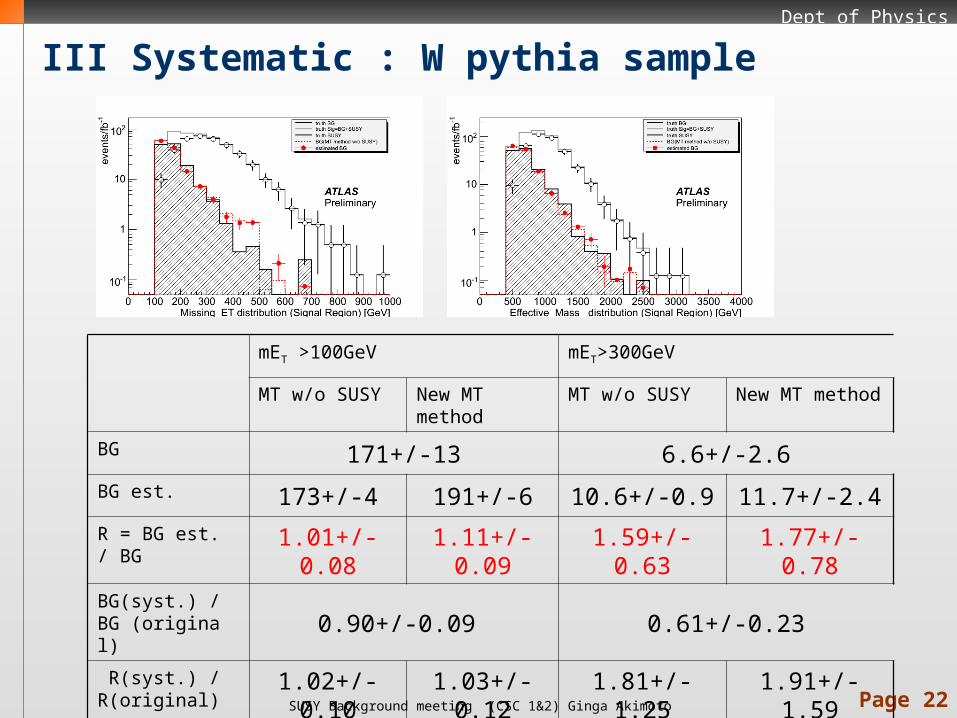
III Systematic : W pythia sample
mET >100GeV mET>300GeV
MT w/o SUSY New MT method MT w/o SUSY New MT method
BG 171+/-13 6.6+/-2.6BG est. 173+/-4 191+/-6 10.6+/-0.9 11.7+/-2.4
R = BG est. / BG 1.01+/-0.08 1.11+/-0.09 1.59+/-0.63 1.77+/-0.78
BG(syst.) / BG (original) 0.90+/-0.09 0.61+/-0.23
R(syst.) / R(original) 1.02+/-0.10 1.03+/-0.12 1.81+/-1.25 1.91+/-1.59

Page 23
Dept of Physics
SUSY Background meeting (CSC 1&2) Ginga Akimoto
The level of contamination (# of SUSY ratio : [Control Sample] over [Signal Region] ) is assumed to be 0.7 (by MC average from SU1 to SU3 CSC Full). These factors are deferent with each SUSY models by 0.1. So we changed it to 0.6 and 0.8 and applied new MT method.
III Systematic : contamination factor
mET BG truth Estimated BG (default) Estimated BG ( 0.6) Estimated BG (0.8)
>100 189+/-13.7 206+/-6
(1.08+/-0.08)
211+/-6
(1.11+/-0.08)
200+/-6 (1.06 +/- 0.08)
>300 10.7+/-3.2 9.9+/-2.3
(0.92+/-0.35)
12.4+/-2.3
(1.15+/-0.41 )
7.33+/-2.3 (0.68+/-0. 32)
0.6 : we underestimate contamination0.8 :we overestimate contamination
Page 24
Dept of Physics
SUSY Background meeting (CSC 1&2) Ginga Akimoto
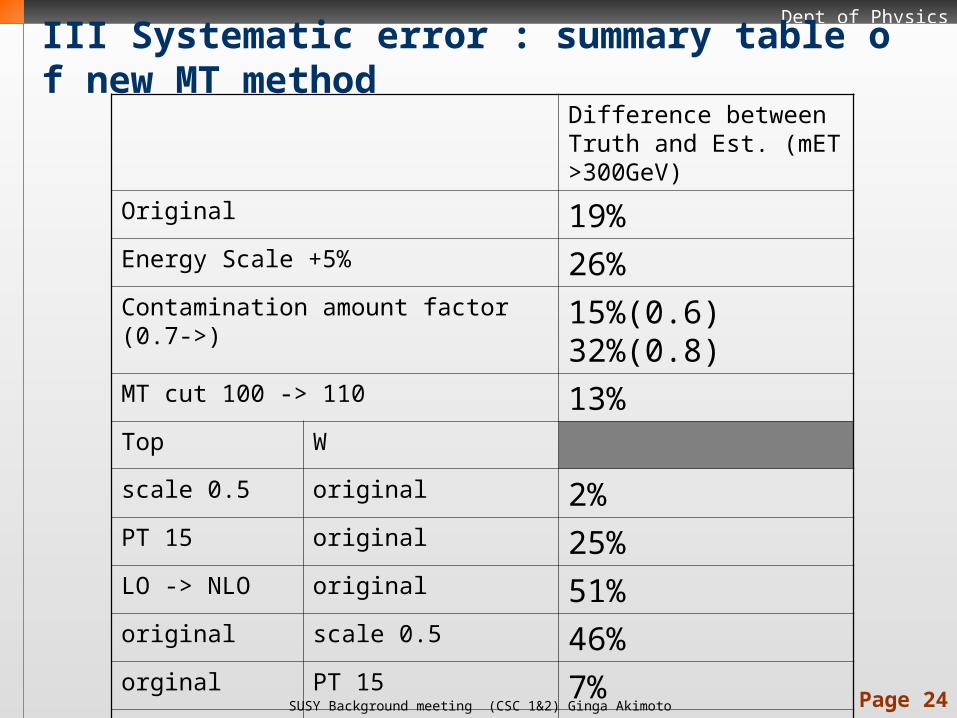
III Systematic error : summary table of new MT method
Difference between Truth and Est. (mET>300GeV)
Original 19%Energy Scale +5% 26%Contamination amount factor (0.7->) 15%(0.6) 32%(0.8) MT cut 100 -> 110 13%Top W
scale 0.5 original 2%PT 15 original 25%LO -> NLO original 51%original scale 0.5 46%orginal PT 15 7%original pythia 91%