one landowner is thinning while the adjoining landowner is not: … · 2019-12-09 · discounting...
TRANSCRIPT

One Landowner is Thinning While the Adjoining Landowner is not: Which One is Losing Money?
Greg Latta, Research Assistant Professor of Forest EconomicsPresented at: 3rd Annual Pacific Northwest Forest Vegetation Management Conference
December 4-5, 2019 Wilsonville, OR
Adapted from: Latta, G. and D. Adams. 2009. Economic Concepts: How and When Do We Make a Decision? Presented at the Density Management in Pacific Northwest Forests Conference. April 8. Portland, OR.

Financial Considerations Regarding Forest Management - Coastal Douglas-fir Example
Discounting Opportunity Cost Considerations for Thinning EvaluationGrowth and YieldProduct Differentiation Logging CostsValuing Future RotationsRotation Ages
Example Bringing it all Together

Discounting (Time Value Of Money)
The idea that money today is worth more than the same amount of money in the future.
Years from Now 0.02 0.04 0.06 0.08 0.100 453 208 97 46 225 500 253 130 68 36
10 552 308 174 99 5715 610 375 233 146 9220 673 456 312 215 14925 743 555 417 315 23930 820 676 558 463 38635 906 822 747 681 62140 1000 1000 1000 1000 1000
Discount Rate

Opportunity Cost
The value of the next highest alternative use
(or)
Value of Highest and Best Use-
Value of Alternative=
Cost of Choosing the Alternative

Considerations for Thinning EvaluationGrowth and Yield Information on how a stand will develop over time for a given
silvicultural regimeProduct Differentiation The volume and prices of products the harvest will provideLogging Costs The cost of extracting the products from the forest Rotation Ages How your decisions change the timings of either the final harvest or other
future thinnings

Example: 30 Year Old Stand
377 trees-per-acre all Douglas-fir 9.2 inches Quadratic Mean Diameter 50-year Site Index 115 331 Stand Density Index 4964 Cubic Feet per Acre 11.38 Thousand Board Feet per Acre

Growth and YieldAge TPA QMD SDI Cubic Feet MBF MAI PAI30 377 9.2 331 4,964 11 16535 363 10.3 381 6,685 20 191 34440 347 11.3 422 8,369 27 209 33745 328 12.2 453 9,937 36 221 31450 303 13.2 471 11,267 42 225 26655 275 14.1 478 12,324 49 224 21160 249 15.0 480 13,213 56 220 17865 228 15.9 480 14,016 62 216 16170 209 16.8 480 14,760 68 211 14975 194 17.6 480 15,455 72 206 13980 181 18.4 480 16,109 77 201 13185 170 19.1 480 16,726 83 197 12390 160 19.9 480 17,308 89 192 11695 151 20.6 480 17,860 91 188 110100 143 21.2 480 18,385 99 184 105105 136 21.9 480 18,885 102 180 100110 130 22.5 480 19,360 108 176 95115 125 23.2 480 19,814 112 172 91120 120 23.8 480 20,248 116 169 87125 115 24.3 480 20,662 123 165 83130 111 24.9 480 21,056 126 162 79

Product DifferentiationLog Products by Stand Age
0
10
20
30
40
50
60
70
30 35 40 45 50 55 60 65 70 75 80 85 90 95 100
105
110
115
120
125
130
Stand Age
MBF
/ Ac
re
0
200
400
600
800
1000
1200
1400
1600
Cubi
c Fe
et /
Acre
DF4s DF3sDF2s DF18+DFOS SWPULP
DF4s Douglas-fir Logs 5" - 7" TopDF3s Douglas-fir Logs 8" - 11" TopDF2s Douglas-fir Logs 12" - 17" TopDF18+ Douglas-fir Logs 18" Plus TopDFOS Oversized Douglas-fir Logs 32" Plus BottomSWPULP Non-merch Trees and Tops to 2"

Price Differentiation (Nominal)

Price Differentiation (PPI)
Producer Price Index
0
0.2
0.4
0.6
0.8
1
1.2
1.4
1.6
1.8
2
1977
1979
1981
1983
1985
1987
1989
1991
1993
1995
1997
1999
2001
2003
2005
2007
Prod
ucer
Pric
e In
dex
(198
2 =
1)
Year
The Producer Price Index (PPI) program measures the average change over time in the selling prices received by domestic producers for their output. From BLS http://www.bls.gov/pPI/
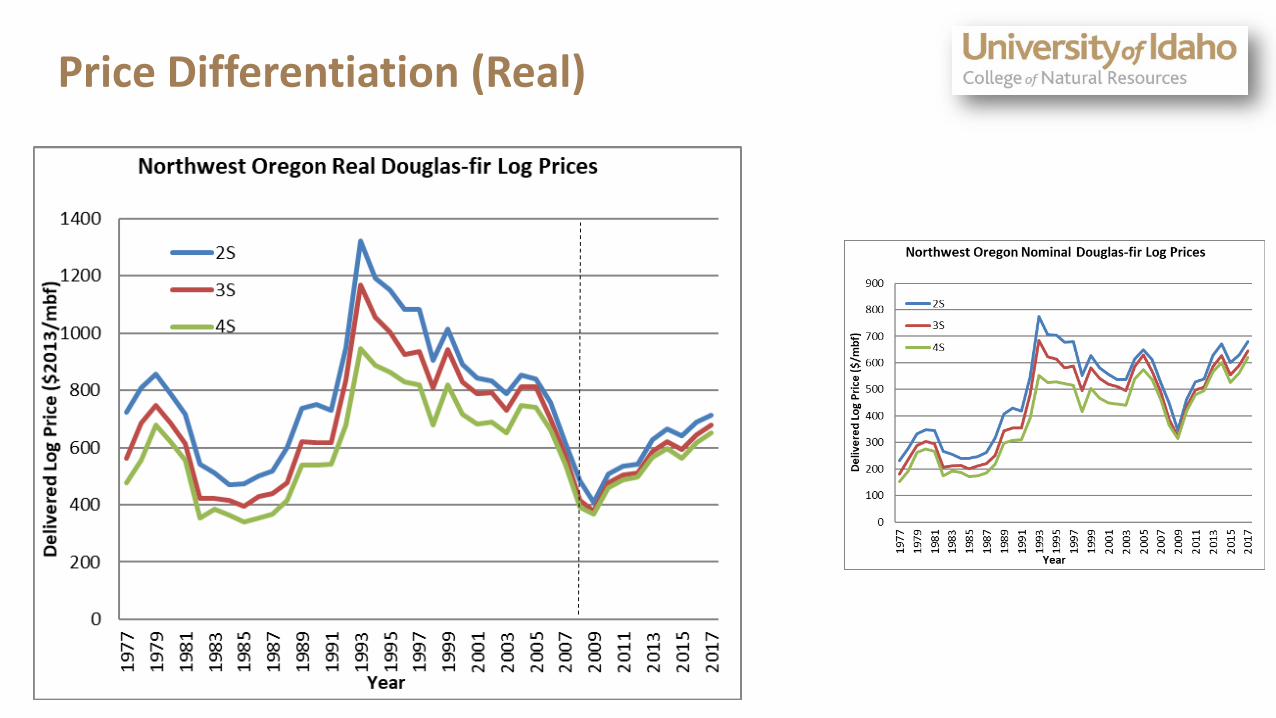
Price Differentiation (Real)

Price Differentiation
0
200
400
600
800
1000
1200
1400
1977
1979
1981
1983
1985
1987
1989
1991
1993
1995
1997
1999
2001
2003
2005
2007
2009
2011
2013
2015
Deliv
ered
Log
Price
($20
13/m
bf)
Year
Northwest Oregon Real Douglas-fir Log Prices
2S
3S
4S

Logging Costs
Logging Cost by Stand Age
0
0.1
0.2
0.3
0.4
0.5
0.630 35 40 45 50 55 60 65 70 75 80 85 90 95 10
0
105
110
115
120
125
130
Stand Age
Logg
ing
Cos
t ( $
/ ft3 )
0
50
100
150
200
250
300
Logg
ing
Cos
t ( $
/ m
bf)
$/ft3$/mbf

Future Rotations
( )( )
( ) 11
1*max 0
−+
+−=
∑=
−
Rotation
Rotation
age
ageRotationageage
teDiscountRa
teDiscountRaCostsyLogQuantitLogpriceSEV
Stand QMD Volume Pulp Logging Revenue Cost Net Rev. SEVAge TPA (inches) ft3/acre 4S 3S 2S ft3/acre Cost $/ft3 $ / acre $ / acre $ / acre $ / acre
5 436 0.01 0 0.0 0.0 0.0 0 1.00 0 0 0 -1,58310 436 2.6 81 0.0 0.0 0.0 31 1.00 9 50 -41 -95815 436 5 612 0.0 0.0 0.0 509 1.00 150 612 -462 -1,01720 436 7.1 1,849 0.0 0.0 0.0 1,585 1.00 468 1,849 -1,381 -1,20725 422 8.9 3,869 0.0 0.0 0.0 3,385 1.00 999 3,869 -2,870 -1,39330 398 10.3 6,236 20.2 0.0 0.0 601 0.41 8,653 3,574 5,078 58635 366 11.5 8,467 11.1 18.2 0.0 552 0.36 13,284 4,488 8,796 85640 324 12.7 10,266 7.3 30.0 0.0 492 0.32 17,150 5,138 12,013 85145 288 13.7 11,684 14.3 34.9 0.0 442 0.29 22,381 5,862 16,519 86350 261 14.6 12,900 15.2 38.1 0.0 405 0.27 24,204 6,146 18,058 61455 238 15.5 14,004 5.5 40.2 12.7 372 0.25 27,865 6,462 21,403 48860 218 16.3 15,009 4.7 31.4 28.9 342 0.27 32,050 7,271 24,778 36265 202 17.1 15,914 4.6 23.8 44.9 316 0.25 36,954 7,641 29,314 27070 189 17.9 16,717 7.1 25.6 42.9 295 0.24 37,830 7,728 30,102 11175 178 18.6 17,445 8.9 19.9 55.8 276 0.22 42,719 8,116 34,603 38
Volume (mbf / acre)For our stand, the Soil Expectation Value (bare land value) is $863/acre
Other Assumptions: $400/acre establishment cost in year 0, 6% discount rate, and $50/mbf transportation (road and hauling) cost.

Rotation Age LengthenersLog Products by Stand Age
0
10
20
30
40
50
60
70
30 35 40 45 50 55 60 65 70 75 80 85 90 95 100
105
110
115
120
125
130
Stand Age
MBF
/ Ac
re
0
200
400
600
800
1000
1200
1400
1600
Cubi
c Fe
et /
Acre
DF4s DF3sDF2s DF18+DFOS SWPULP
Logging Cost by Stand Age
0
0.1
0.2
0.3
0.4
0.5
0.6
30 35 40 45 50 55 60 65 70 75 80 85 90 95 100
105
110
115
120
125
130
Stand Age
Logg
ing
Cos
t ( $
/ cu
bic
foot
)
Rotation
The longer we wait to harvest… The more volume, concentrated in
higher value products, that can be removed at a lower per-unit cost.

Future RotationsValue of $1000 Received at Various
Points in the Future at Different Discout Rates
0
200
400
600
800
1000
1200
0 5 10 15 20 25 30 35 40Years in Future
Dol
lars
0.020.040.060.080.10
Rotation
The sooner the harvest…
We have our money in hand and can use it for
other things.
Consideration of Future Rotations rather than a single
rotation value. (SEV)

Example Bringing it all Together
Using the same 30 year old stand, log prices, harvest costs and 6% discount rate we will evaluate:
No ThinningThin 35% of Volume Now Thin 35% of Volume in 5 Years
( )( )
( ) agecurrentRotation
Rotation
age
ageRotationageage
teDiscountRa
SEVteDiscountRaCostsyLogQuantitLogpriceLTV _
0
1
1*max −
=
−
+
∑ ++−=
Now we are looking at a Land and Timber value Equation

Growth and Yield – Stand CharacteristicsStand Age TPA QMD SDI TPA QMD SDI TPA QMD SDI
30 377 9.2 331 245 9.2 215 377 9.2 33135 363 10.3 381 240 10.6 265 236 10.3 24840 347 11.3 422 234 11.8 304 231 11.6 29245 328 12.2 453 229 12.7 337 225 12.6 32650 303 13.2 471 222 13.6 365 219 13.5 35455 275 14.1 478 216 14.4 389 213 14.3 37860 249 15.0 480 209 15.2 410 206 15.1 399
No Thinning Thin Now Thin in 5 Years
Trees Per Acre
150
200
250
300
350
400
30 35 40 45 50 55 60Stand Age
No Thinning
Thin Now
Thin in 5 Years
Quadratic Mean Diameter
8.0
9.0
10.0
11.0
12.0
13.0
14.0
15.0
16.0
30 35 40 45 50 55 60Stand Age
No Thinning
Thin Now
Thin in 5 Years
Stand Density Index
200
250
300
350
400
450
500
30 35 40 45 50 55 60Stand Age
No Thinning
Thin Now
Thin in 5 Years

Growth and Yield - VolumeStand Age ft3/acre mbf/acre ft3 Pulp ft3/acre mbf/acre ft3 Pulp ft3/acre mbf/acre ft3 Pulp
30 4,964 11.4 1,448 4,840 7.4 941 4,964 11.4 1,448 35 6,685 20.2 1,083 4,482 13.6 748 6,518 13.1 704 40 8,369 27.3 1,073 5,820 20.0 727 5,592 18.7 688 45 9,937 35.5 1,102 7,148 26.2 726 6,893 24.9 686 50 11,267 42.3 957 8,442 33.6 514 8,155 31.1 731 55 12,324 48.6 845 9,684 40.2 518 9,368 38.1 497 60 13,213 55.5 651 10,859 46.1 512 10,521 45.1 492
No Thinning Thin Now Thin in 5 Years
Board Foot Volume
0.0
10.0
20.0
30.0
40.0
50.0
60.0
30 35 40 45 50 55 60Stand Age
No Thinning
Thin Now
Thin in 5 Years
Board Foot Volume Annual Growth Rate
0.00
0.02
0.04
0.06
0.08
0.10
0.12
0.14
30 35 40 45 50 55 60Stand Age
No Thinning
Thin Now
Thin in 5 Years
Cubic Foot Volume Annual Growth Rate
0.00
0.01
0.02
0.03
0.04
0.05
0.06
0.07
0.08
30 35 40 45 50 55 60Stand Age
No Thinning
Thin Now
Thin in 5 Years

Growth and Yield – Product DifferentiationStand Age 4S 3S 2S 4S 3S 2S 4S 3S 2S
30 7.1 4.3 0.0 4.6 2.8 0.0 7.1 4.3 0.035 8.7 11.5 0.0 5.7 7.9 0.0 5.7 7.4 0.040 9.2 16.5 1.7 5.9 13.0 1.1 5.4 12.2 1.145 10.8 19.0 5.8 6.8 15.4 4.0 7.0 14.2 3.850 11.6 21.8 8.8 7.6 15.9 10.1 6.8 17.0 7.455 8.6 21.8 18.2 7.5 17.8 14.8 7.4 15.9 14.860 7.4 22.8 25.3 7.6 17.9 20.6 7.3 17.4 20.4
No Thinning Thin Now Thin in 5 Years
Percentage of Merch. Volume in 4S
0%
10%
20%
30%
40%
50%
60%
70%
30 35 40 45 50 55 60Stand Age
No Thinning
Thin Now
Thin in 5 Years
Percentage of Merch. Volume in 3S
30%
35%
40%
45%
50%
55%
60%
65%
70%
30 35 40 45 50 55 60Stand Age
No Thinning
Thin Now
Thin in 5 Years
Percentage of Merch. Volume in 2S
30%
32%
34%
36%
38%
40%
42%
44%
46%
48%
30 35 40 45 50 55 60Stand Age
No Thinning
Thin Now
Thin in 5 Years

Price Differentiation
Here we look at current prices (Dots), past prices (Lines) and expectations of future prices to get the values we will use for the LTV equation.
Northwest Oregon Real Douglas-fir Log Prices(source http://www.oregon.gov/ODF/STATE_FORESTS/TIMBER_SALES/logpage.shtml)
0
200
400
600
800
1000
1200
1400
1975
1980
1985
1990
1995
2000
2005
2010
Year
Rea
l Pric
e ($
2008
/mbf
)
Log Price Assumptions
1. Grade price differential will remain at current levels
2. Future real log prices will be higher than current levels but below the recent past (we will use 133% as a multiplier
3. There will be no real price appreciation in future (flat real prices
Real Log Prices for our Analysis2 Saw $532 / mbf
3 Saw $466 / mbf
4 Saw $419 / mbf
Pulp $10 / ton stumpage

Logging Costs
Adapted from: FIGHT, R.D., C.B. LEDOUX, AND T.L. ORTMAN. 1984. Logging costs for management planning for young-growth coast Douglas-fir. USDA For. Serv. Gen. Tech. Rep. PNW-176. 10 p.
Stand Age Clearcut $/ft3 Thinning $/ft3 Clearcut $/ft3 Thinning $/ft3 Clearcut $/ft3 Thinning $/ft3
30 0.49 0.53 0.58 0.4935 0.41 0.42 0.44 0.4940 0.37 0.37 0.3745 0.34 0.33 0.3350 0.31 0.30 0.3155 0.28 0.28 0.2860 0.26 0.26 0.27
No Thinning Thin Now Thin in 5 Years
Final Harvest Logging Cost
0.25
0.30
0.35
0.40
0.45
0.50
0.55
30 35 40 45 50 55 60Stand Age
$/ft3
No Thinning
Thin Now
Thin in 5 Years
Board Feet per Cubic Foot
2.00
2.50
3.00
3.50
4.00
4.50
30 35 40 45 50 55 60Stand Age
No Thinning
Thin Now
Thin in 5 Years

Revenues and Costs
Stand Age Revenue Cost Net Rev. Revenue Cost Net Rev. Revenue Cost Net Rev.30 1,887 1,185 702 35 3,252 1,463 1,789
No Thinning Thin Now Thin in 5 Years
Stand Age Revenue Cost Net Rev. Revenue Cost Net Rev. Revenue Cost Net Rev.30 5,396 3,006 2,390 3,504 2,024 1,480 5,396 3,006 2,390 35 9,294 3,748 5,546 6,283 2,575 3,708 6,038 2,519 3,519 40 12,713 4,437 8,276 9,306 3,123 6,183 8,710 3,013 5,697 45 16,734 5,104 11,630 12,375 3,656 8,719 11,738 3,542 8,195 50 19,996 5,571 14,425 16,101 4,221 11,881 14,868 4,050 10,818 55 23,677 5,917 17,760 19,478 4,719 14,759 18,531 4,567 13,964 60 27,378 6,251 21,127 22,633 5,161 17,471 22,172 5,056 17,117
No Thinning Thin Now Thin in 5 Years
Revenue and Cost from Thinning Operations
Revenue and Cost from Final Harvest

Land and Timber Value
( )( )
( ) agecurrentRotation
Rotation
age
ageRotationageage
teDiscountRa
SEVteDiscountRaCostsyLogQuantitLogpriceLTV _
0
1
1*max −
=
−
+
∑ ++−=
Stand Age LTV Optimal LTV Optimal LTV Optimal30 3,252 3,045 3,25235 4,789 4,118 4,61140 5,103 4,637 5,00045 5,213 X 4,700 X 5,116 X50 4,767 4,676 4,97955 4,339 4,342 4,79160 3,829 3,894 4,467
No Thinning Thin Now Thin in 5 Years

Opportunity Cost
In our particular case the No Thinning option yields the highest and best value for this stand.
If you choose to thin the stand now the opportunity cost would be $513/acre
If you choose to thin the stand in five years the opportunity cost would be $97/acre

Effect of Discount Rate
Stand Age LTV Optimal LTV Optimal LTV Optimal30 2,599 2,391 2,59935 3,917 3,368 3,75540 3,930 X 3,663 X 3,953 X45 3,732 3,517 3,86750 3,140 3,296 3,58355 2,624 2,888 3,28760 2,120 2,459 2,939
No Thinning Thin Now Thin in 5 Years
Stand Age LTV Optimal LTV Optimal LTV Optimal30 3,252 3,045 3,25235 4,789 4,118 4,61140 5,103 4,637 5,00045 5,213 X 4,700 X 5,116 X50 4,767 4,676 4,97955 4,339 4,342 4,79160 3,829 3,894 4,467
No Thinning Thin Now Thin in 5 Years
Stand Age LTV Optimal LTV Optimal LTV Optimal30 5,319 5,112 5,31935 6,966 6,158 6,77140 7,570 6,859 7,29845 8,084 X 7,170 7,64750 7,920 7,462 X 7,74455 7,761 7,337 7,807 X60 7,417 6,992 7,651
No Thinning Thin Now Thin in 5 Years
8% D
isco
unt R
ate
6% D
isco
unt R
ate
4% D
isco
unt R
ate
8% Discount Rate
4% Discount Rate
6% Discount Rate

Conclusion
One Landowner is Thinning While the Adjoining Landowner is not: Which One is Losing Money?Can we tell?Or better yet what would we need to know?

Greg LattaResearch Assistant Professor of Forest EconomicsNatural Resources & SocietyUniversity of [email protected]
Research Webpage: http://www.uidaho.edu/cnr/pag