oncology early clinical trials’ designs and their challenges pamela n munster, md ticr 4-18-2012
TRANSCRIPT

Oncology Early Clinical Trials’
Designsand their Challenges
Pamela N Munster, MD
TICR4-18-2012.

Phase ISafety/Phase
II dose
Phase IIICompare new vs. standard
Phase IVlong term safety
FDA Approval
IND granted
Cell culture, signaling studies, combinations, xenografts and animal models
Animal Tox
Molecular Screens
2554 Phase I trials currently accruing
Historical Drug Development Snapshot
3908 NCI listed
1872 NCI listed
Phase 0
Phase IIEfficacy/Tox

Testing of a novel strategy/compound– New single agent
• First in Man, Proof of Concept • New formulations, schedules or doses
– Combinations of novel agents with existing agents• X combined with chemotherapy• X combined with hormonal therapies
– Novel agent as biological response modifier• Inhibition of Histone deacetylase, • Inhibition of DNA repair (e.g. PARP, Chk1, wee1) • Inhibition of chaperone proteins, (e.g. HSP90)
Types of Treatments in Phase I Clinical Trials (I)

Testing of a novel strategy/compound– Different Modalities
• Small molecules• Immune modifiers• electroporation of inhibitory genes• siRNA, • anti-sense
Types of Treatments in Phase I Clinical Trials (II)

Terms and Definitions
– Safety, Toxicity and Tolerability
– Dose limiting toxicities (DLT)
– Maximally Administered Dose (MAD)
– Maximally Tolerated Dose (MTD)
– Recommended Phase II dose (RPTD)
– Dose Escalation Rules
– Pharmacokinetics and Pharmacodynamics
Early Phase Clinical Trials’ Design

Terms and Definitions– Safety, Toxicity and Tolerability
Standard toxicity assessment by Common Terminology Criteria for Adverse Events (CTCAE) v. 4.0
1) Grading» 0-5
2) Causality determination: » treatment-emergent vs treatment-related
Early Phase Clinical Trials’ Design

Example: Toxicity Assessment
Presentation:A 47 year old Caucasian male starts an investigational agent on 4-1-11,Four days later he presents with a new rash over his entire right arm with itching. He continues to have mild fatigue, but now has an unquenchable thirst. He is able to do his daily chores. His fasting blood glucose is 271 mg/dL.
Baseline criteria included Grade I fatigue, but otherwise no symptoms.
Assessment: Grading and Relatedness (CTCAE IPhone App, or (ctep.cancer.gov/protocoldevelopment/electronic.../ctcaev3.pdf)Fatigue: Rash:Fasting Blood Glucose:

Example: Toxicity Assessment
Presentation:A 47 year old Caucasian male starts an investigational agent on 4-1-11,Four days later he presents with rash over the arms and chest, fatigue, and unquenchable thirst. He is able to do his daily chores and has otherwise no symptoms.His fasting blood glucose is 271.Baseline criteria included Grade I fatigue, but otherwise no symptoms.
Assessment:


Example: Toxicity Assessment
Presentation:A 47 year old Caucasian male starts an investigational agent on 4-1-11,Four days later he presents with rash over the arms and chest, fatigue, and unquenchable thirst. He is able to do his daily chores and has otherwise no symptoms.His fasting blood glucose is 271.Baseline criteria included Grade I fatigue, but otherwise no symptoms.
Assessment:Fatigue: Grade 1, not relatedRash: Grade 2, relatedFasting Blood Glucose: Grade 3, related

Terms and Definitions
Dose limiting toxicities (DLT) within window (usually 3-4 weeks)– Grade 3 non-hematological toxicities
– Grade 4 hematological
– Protocol-specific definitions• E.g. allow for grade 3
– Diarrhea despite optimal care, – Nausea despite optimal care– Hyperglycemia (with treatment for more than 14 days) (PI3k, mTOR) – Hypertension (VEGF inhibitors, VEGFR inhibitors)
Classical Phase I Clinical Trials’ Design

Terms and Definitions– Maximally Administered Dose (MAD)
• Highest administered dose (>2/6 pts with DLT)
– Maximally Tolerated Dose (MTD)• Highest tested dose where 0/6 or 1/6 patients
experienced DLT
– Recommended Phase II dose (RPTD)• The dose to be tested in phase II
Classical Phase I Clinical Trials’ Design

Dose escalation designs
Leonardo di Pisa (ca.1202)(Fibonacci)First mentioned in Pingala (200 BC)

Dose escalation designs
– Fibonacci (0, 1, 1, 2, 3, 5, 8, 13, 21, …)
– Modified Fibonacci
– Dose doubling Designs
– Adaptive Designs• real time pharmacokinetics, • statistical adaptations
– Combinations of designs
Early Phase Clinical Trials’ Design

Dose escalation
Cohorts Fib Modified
Fib
Percent increase
Example
(mg)
1 D D ------ 1
2 2 x D 2 x D 100% 2
3 3 x D 3.3 x D 66% 3.3
4 5 x D 5 x D 50% 5
5 8 x D 7 x D 40 % 7
6 13 x D 9 x D 29% 9
7 21 x D 12 x D 33 % 12
8 34 x D 16 x D 33 % 16
Fibonacci and modified Fibonacci Dose escalations

Dose escalation
Cohorts Dose Dose Increase
1 2 mg D
2 4 mg 2 x D 100%
3 8 mg 4 x D 100%
4 (1/6 DLT) 16 mg 8 x D 100%
5 24 mg 12 x D 40%-50%
6 36 mg 18 x D 40%-50%
Dose doubling

Dose escalation with fixed tablets: e.g. 100 mg tablets
Cohorts Dose % Increase Mod Fib
1 100 mg ------
2 200 mg 100% 100%
3 300 mg 50% 66%
4 400 mg 33% 50%
5 500 mg 25% 40 %
6 600 mg 20% 29%
7 700 mg 17% 33%
Other Dose Escalation schemes

Adaptive Dose escalation with fixed tablets: e.g. 100 mg tablets
Cohorts Dose Increase
1 100 mg qd
2 100 mg bid 100%
3 100 mg tid 50%
4 200 mg qd 25%
5 200 mg bid 100%
6 200 mg tid 50%
Adaptive Designs (Example)

Cohort Size
Patient Escalation 1+1 (occ. used for lowest doses) 3+3 (most common) 6+6
Cohorts and Sample Size

– Dose Escalation Rules
• PRE-DEFINED CONDITIONS FOR DOSE ESCALATION
– (standard and specific to the individual protocol)
Early Phase Clinical Trials’ DesignTerms and Definitions

Dose Escalation Rules (3+3 design)
# patients with DLT at a Given Dose Level
Escalation Decision Rule
0 out of 3 Dose escalate to next higher dose level
>2 out of 3 Dose escalation will be stopped. This dose level will be declared the maximally administered dose (highest dose administered). The next lower cohort will be expanded to 6 patients. If no DLTs are seen consider an intermediate dose level between this dose and the MAD dose.
1 out of 3 Enter at least 3 more patients at this dose level. If 0 of these 3 patients experience DLT, proceed to the
next dose level. If 1 or more of this group suffer DLT, then dose
escalation is stopped, and this dose is declared the maximally administered dose.
<1 out of 6 at highest dose level below the maximally administered dose
This is the recommended Phase II dose.
If 0 out of 3 at the highest dose
Consider protocol amendment to dose escalate further

Dose expansion
Purpose:• Estimation of toxicities in larger sample set• Estimation of PK and PD markers• Preliminary Efficacy
Sample size • Minimum 6• General 12-15

Dose expansion
Purpose:• Estimation of toxicities in larger sample set• Estimation of PK and PD markers• Preliminary Efficacy
Sample size • Minimum 6• General 12-15

Pharmacokinetics
and Pharmacodynamics

“Drug Behavior in the Subject”
Pharmacokinetics

Pharmacokinetics
Free Drug Plasma ↕ Metabolites
Bound Drug
TARGET SITE(Receptor)
Free Drug ↕ Bound Drug
TISSUE SITE
Free Drug ↕ Bound Drug
Metabolism
Absorption
Pharmacokinetics
Elimination Excretion
Polymorphism
P. Munster

MeasurablesRoutinely done: albeit often limited
•Half-life (t1/2) •Distribution volume•Peak concentrations (Cmax)•Time to peak concentration (Tmax)•Area under the curve•Food effects
Not routinely done•Polymorphisms •Drug-drug interactions•PK-PD interactions
Pharmacokinetics

Example of PK sampling in Phase I trial
Heparinized blood samples (10 mL) will be collected on Day1 at 0, 0.5, 1, 2, 4, 6, 8, 24, 48, and 72 hours after the first dose of LY335562 Day 15 at 0, 0.5, 1, 2, 4, 6, 8, and 24 hours after that day’s doseDay 57 at 0, 0.5, 1, 2, 4, 6, 8, and 24 hours after that day’s dose.
Single blood samples for pharmacokinetic studies for the desmethyl metabolite were also collected on days 8, 15, 22, 29, 43, 71, and 85.

Example: Plasma concentration: dose escalations
ASCO 2008, J Infante
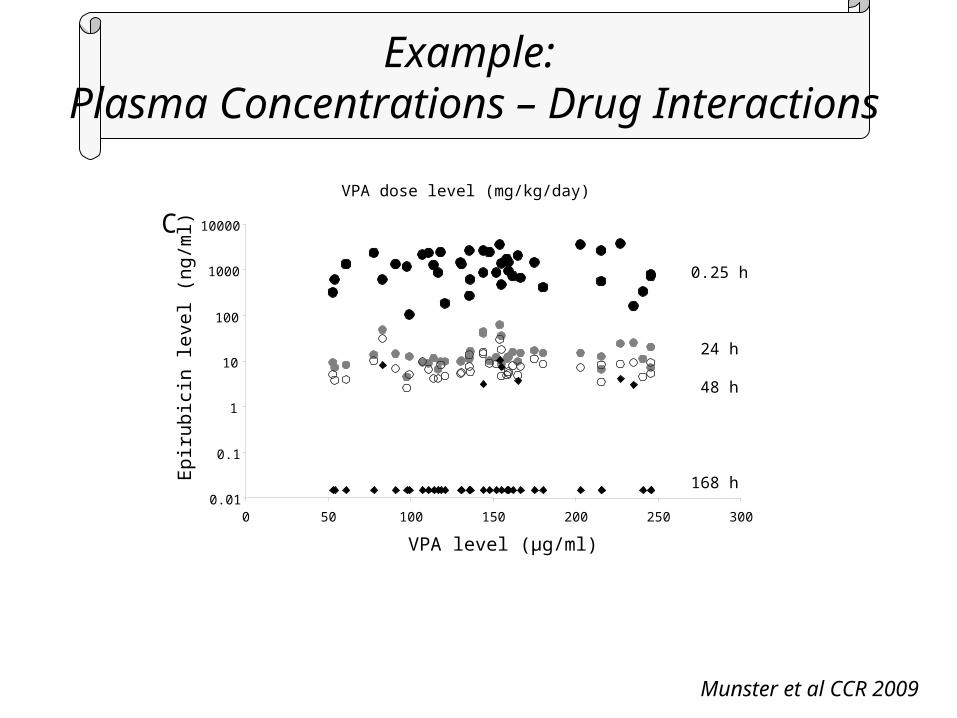
Munster et al CCR 2009
VPA dose level (mg/kg/day)
VPA level (μg/ml)
0.25 h
24 h
48 h
168 h
Epi
rubi
cin
leve
l (ng
/ml)
C
0.01
0.1
1
10
100
1000
10000
0 50 100 150 200 250 300
Example: Plasma Concentrations – Drug Interactions

Metabolism and Polymorphism

[Kirchheiner, 2003]
Polymorphisms in the CYP2D6 gene changes Metabolizers status
PM: Poor metabolizersIM: Intermediate metabolizerEM: Extensive metabolizerUM: Uebermetabolizer

Pharmacodynamics

Pharmacodynamics
“Drug Effects on the subjects and tumors”
• Symptoms• Signs• Changes in Lab values (e.g effects on glucose metabolism)• Molecular and Biological effects

Munster P et al. Clin Cancer Res 2009;15:2488-2496©2009 by American Association for Cancer Research
Pharmacodynamics: Effects on Lab ParametersDIRECT EFFECTS

Copyright © American Society of Clinical OncologyMunster, P. et al. J Clin Oncol; 25:1979-1985 2007
Fig 1. Valproic acid (VPA) effects on epirubicin-associated toxicities
Indirect effects
Pharmacodynamics: Effects on Lab ParametersINDIRECT EFFECTS

HORMONERECEPTORSTATUS
HER2STATUS
VISCERADISEASE
PRIOR AROMATASEINHIBITORS
PRIORTAMOXIFEN
ACET-H4
DOSEMOD
Patients with Partial Response: 8/43 (19%)Pt 1Pt 2Pt 3Pt 4Pt 5Pt 6 Pt 7Pt 8
ER+ / PR+ER+ / PR+ER+ / PR+ER+ / PR-ER+ / PR+ER+ / PR+ER+ / PR+ER+ / PR+
Not amplNot amplNot amplNot amplNot amplNot amplNot amplNot ampl
YesYesYesYesNoYesYesNo
LetrozoleAnastrozole, ExemestaneAnastrozole, ExemestaneLetrozole, Exemestane AnastrozoleLetrozole, ExemestaneAnastrozole, ExemestaneLetrozole
TamoxifenTamoxifen Tamoxifen
YesYesNoYesYesYes-Yes
300200300300
Patients with Stable Disease > 24 weeks: 9/43 (21%)Pt 1Pt 2Pt 3Pt 4Pt 5Pt 6Pt 7Pt 8Pt 9
ER+ / PR-ER+ / PR+ER+ / PR-ER+ / PR+ER+ / PR-ER+ / PR-ER+ / PR+ER+ / PR+ER+ / PR+
Not amplNot amplNot amplNot amplNot amplNot amplAmplNot amplNot ampl
NoYesYesNoYesYesNoYesNo
Letrozole, AnastrozoleLetrozole, Exemestane,Anastrozole, LetrozoleLetrozoleAnastrozoleAnastrozole, LetrozoleLetrozole, ExemestaneLetrozoleLetrozole
TamoxifenTamoxifen
Tamoxifen TamoxifenTamoxifen
YesYes-YesYesYesYesYesYes
200200300300
Pharmacodynamics: PD effects (histone acetylation) and Responses

H4 acetylation occurred only in 58% of treated patients%
cha
nge
in h
isto
ne a
cety
latio
n
Acetyl-H4
Day 1 Day 8

H3 and H4 acetylation more commonly seen in patients with clinical benefits
% c
hang
e in
his
tone
ace
tyla
tion
0
10
20
30
40
50
ALL R NR
% c
hang
e in
ace
tyl-H
4
*
P=0.022, n=36

Correlative studies: Histone acetylation
biomarker in responders vs non-responders
Ch
an
ge
in H
4 h
isto
ne
ace
tyla
tion
(%
)
Ch
an
ge
in H
4 h
isto
ne
ace
tyla
tion
(%
)
All R NR
-50
0
50
100
150
200Non-responders
Responders
% c
han
ge
in h
isto
ne a
cety
latio
n

• No clear relationship between dose and toxicity • No definite threshold toxicity (DLT)• No clear relationship between efficacy and dose• No clear target modulation• Unrecognized down-target effects
– Activating or inhibitory
• Efficacy not likely
Difficult to choose dose or schedule in these circumstances
Emerging Challenges

• Imaging– PET scanning
• Tissue Perfusion • Blood Volume• Glucose metabolism• Estrogen metabolism
– DCE-MRI• Pharmacodynamic Studies
– Target inhibition in end-organ• Tumor biopsies• Circulating tumor cells
– Target inhibition in surrogate tissue• Peripheral Blood Mononuclear Cells
• Pharmacokinetics– Targeted Drug Levels:
• Serum Markers
Alternative and/or Additional Endpoints

• Traditional Phase I designs are valid for novel chemotherapy drugs and for some novel agents but….
• Many targeted agents require careful assessment and incorporation of correlative endpoints or novel imaging modalities to decide the dose, schedule, and optimal therapeutic partners
• Availability of real-time PK and PD (biomarkers)
• Validation of endpoints in larger studies with enriched populations
Conclusion

Thank you