oncologia e patologia sperimentale - unibo.itamsdottorato.unibo.it/2317/1/tieri_paolo_tesi.pdf · 1...
TRANSCRIPT
1
A l m a M a t e r S t u d i o r u m – U n i v e r s i t à d i B o l o g n a
DOTTORATO DI RICERCA IN
ONCOLOGIA E PATOLOGIA SPERIMENTALE
Ciclo XXII
Settore scientifico-disciplinare di afferenza: MED/04
RECONSTRUCTION AND ANALYSIS OF THE NF-B PATHWAY
INTERACTOME: A SYSTEMS BIOLOGY APPROACH
Presentata da Dott. Paolo Tieri
Coordinatore Dottorato Relatore
Chiar.mo Prof. Sandro Grilli Chiar.mo Prof. Claudio Franceschi
Esame finale anno 2010

2

3
La Beauté n’est pas raisonnable.

4
5
Table of contents
Abstract ............................................................................................................................ 7
1. Introduction ................................................................................................................. 9
1.1. Aging as a complex trait ........................................................................................ 9
1.2. Aging as a mosaic ................................................................................................ 10
1.3. Methodological approaches to aging as a complex mosaic ................................. 16
1.3.1. Systems biology, aging and longevity .................................................................. 16
1.3.2. Inflammation, inflammaging and systems biology ............................................... 18
1.4. NF-B: a key player in inflammation .................................................................. 20
2. Materials and methods ............................................................................................. 25
2.1. Network biology: a functional approach to complex biological systems ............ 25
2.1.1 A workflow for integrative pathway and interactome reconstruction and analysis26
2.2. Materials: online databases and tools .................................................................. 27
2.2.1 Overview of databases and online data sources ..................................................... 27
2.3. Materials: computational analysis software ......................................................... 35
2.3.1. Main platforms and tools ...................................................................................... 35
2.3.2 Other specific analysis tools and plugins ............................................................... 37
2.4. Methods: general retrieval and reconstruction procedures .................................. 38
2.4.1. Data retrieval ......................................................................................................... 38
2.4.2. Data merging and combination ............................................................................. 39
2.4.3. Functional enrichment .......................................................................................... 41
2.5. Methods: network analysis .................................................................................. 42
2.5.1. Topological measures ........................................................................................... 42
2.5.2. Dynamical models ................................................................................................ 51
2.6. Methods: NF-B interactome data retrieval and reconstruction .......................... 53

6
2.6.1. Workflow .............................................................................................................. 53
2.6.2. Pitfalls and issues encountered ............................................................................. 55
3 Results and discussion ............................................................................................... 57
3.1. “Core” and “wider” NF-B pathway interactomes.............................................. 57
3.2. Analysis of the interactomes ................................................................................ 58
3.2.1. Core interactome, structure and network analysis ................................................ 58
3.2.2. Wider interactome, structure and network analysis .............................................. 75
3.3. Downstream genes and feedback cycles .............................................................. 85
3.3.1. Interactome feedback loops .................................................................................. 92
4. Conclusion ............................................................................................................... 101
4.1. Overview of obtained results ............................................................................. 101
4.2. Feedback controls .............................................................................................. 103
4.3. Further perspectives ........................................................................................... 104
5 Notes .......................................................................................................................... 107
5.1 Notes on existing information representation stardards ...................................... 107
5.2 List of cited online resources URLs .................................................................... 108
5.3 Bibliographic references for the compilation the core interactome protein list .. 110
Acknowledgements ..................................................................................................... 112
References .................................................................................................................... 113
7
RECONSTRUCTION AND ANALYSIS OF THE
NF-B PATHWAY INTERACTOME:
A SYSTEMS BIOLOGY APPROACH
Abstract
_______________________________________________________________________
Background. One of the phenomena observed in human aging is the progressive
increase of a systemic inflammatory state (Sansoni 2008), a condition referred to as
“inflammaging” (Franceschi 2000), negatively correlated with longevity (Franceschi
2007). A prominent mediator of inflammation is the transcription factor NF-B, that acts
as key transcriptional regulator of many genes coding for pro-inflammatory cytokines.
Many different signaling pathways activated by very diverse stimuli converge on NF-
B, resulting in a regulatory network characterized by high complexity (Perkins 2007).
NF-B signaling has been proposed to be responsible of inflammaging (Salminen 2008).
Scope of this analysis is to provide a wider, systemic picture of such intricate signaling
and interaction network: the NF-B pathway interactome.
Methods. The study has been carried out following a workflow for gathering
information from literature as well as from several pathway and protein interactions
databases, and for integrating and analyzing existing data and the relative reconstructed
representations by using the available computational tools (Tieri 2010). Strong manual
intervention has been necessarily used to integrate data from multiple sources into
mathematically analyzable networks. The reconstruction of the NF-B interactome
8
pursued with this approach provides a starting point for a general view of the
architecture and for a deeper analysis and understanding of this complex regulatory
system (Cevenini 2009).
Results. A “core” and a “wider” NF-B pathway interactome, consisting of 140 and
3146 proteins respectively, were reconstructed and analyzed through a mathematical,
graph-theoretical approach. Among other interesting features, the topological
characterization of the interactomes shows that a relevant number of interacting proteins
are in turn products of genes that are controlled and regulated in their expression exactly
by NF-B transcription factors. These “feedback loops”, not always well-known,
deserve deeper investigation since they may have a role in tuning the response and the
output consequent to NF-B pathway initiation, in regulating the intensity of the
response, or its homeostasis and balance in order to make the functioning of such critical
system more robust and reliable. This integrated view allows to shed light on the
functional structure and on some of the crucial nodes of thet NF-B transcription factors
interactome.
Conclusion. Framing structure and dynamics of the NF-B interactome into a wider,
systemic picture would be a significant step toward a better understanding of how NF-
B globally regulates diverse gene programs and phenotypes. This study represents a
step towards a more complete and integrated view of the NF-B signaling system.
9
1. Introduction
_______________________________________________________________________
1.1. Aging as a complex trait
The study on human aging and longevity has become a very hot topic in the last years
because of the so-called revolution in demography, which led to the remarkable increase
in the number of people over the age of 65 or 80 years living in Western countries but
also in some emerging countries such as China and India (Franceschi 2008). The data
collected during the last 20 years in different models suggest that the picture of the aging
phenotype is fragmented and above all qualitative and that we are far from an exhaustive
and quantitative scenario. This incomplete knowledge comes out from several bias: 1.
few studies evaluate many parameters at the same time in the same individual; 2. the
collected data are not of high-dimensionality; 3. longitudinal studies, which are the most
informative, are scanty. Another factor contributing to the complexity of the problem is
that human aging and longevity are complex and multi-factorial traits, generally
considered as the result of the combination of environmental factors, genetics,
epigenetics and stochasticity, each making variable contributions to the overall
phenotype (Salvioli 2006a, De Benedictis 2006, Fraga 2005). It seems that the
importance of each component changes with the passing of time: the age of 60 years
appears as a discriminatory point after which the role of environmental factors, genetics,
epigenetics and also stochasticity increases, contributing to reaching very old ages. The
rate of the age-related modification of the importance of each component is difficult to
be quantified at present. Moreover, these different components interact with each other,
in particular genetics and environment.
10
The studies on human aging and longevity are further complicated by the fact that
human populations are heterogeneous from the point of view of genetic pool, life style,
cultural habits, education, economic status and social network. All these components are
different from population to population, and each population is characterised by a
unique combination of them. This fact renders the studies difficult to compare and the
results very often discordant. Finally, all these considerations also apply to gender
difference, since gender appears to be a crucial player in the cross-talk between genes,
environment and health (Ordovas 2007). The development of effective and realistic
strategies for aging intervention, prevention and therapies may be facilitated by this
integrated and multi-faced view. Indeed, it has been proposed that the manipulation of
both genes and environment at the same time can open up novel possibilities of aging
intervention and prevention (Rattan 2007).
1.2. Aging as a mosaic
It is conceivable that longevity could be achieved by different strategies and by different
combinations of genetics, epigenetics, environment and stochasticity and the result, i.e.
the aging phenotype, is very heterogeneous. Moreover, it is emerging that the multi-
factorial process of aging does not occur only at organism level, but it also acts
differently in each organ system, organ, tissue and even in each single cell of the body,
determining a different aging rate for each of them. In mice it has been observed that
different tissues age in a coordinated fashion (Zahn 2007), while in humans this is still to
be ascertained. As a consequence of these different aging rates, the aged body could be
considered as a mosaic of tissues and organs displaying a different level of senescence, a
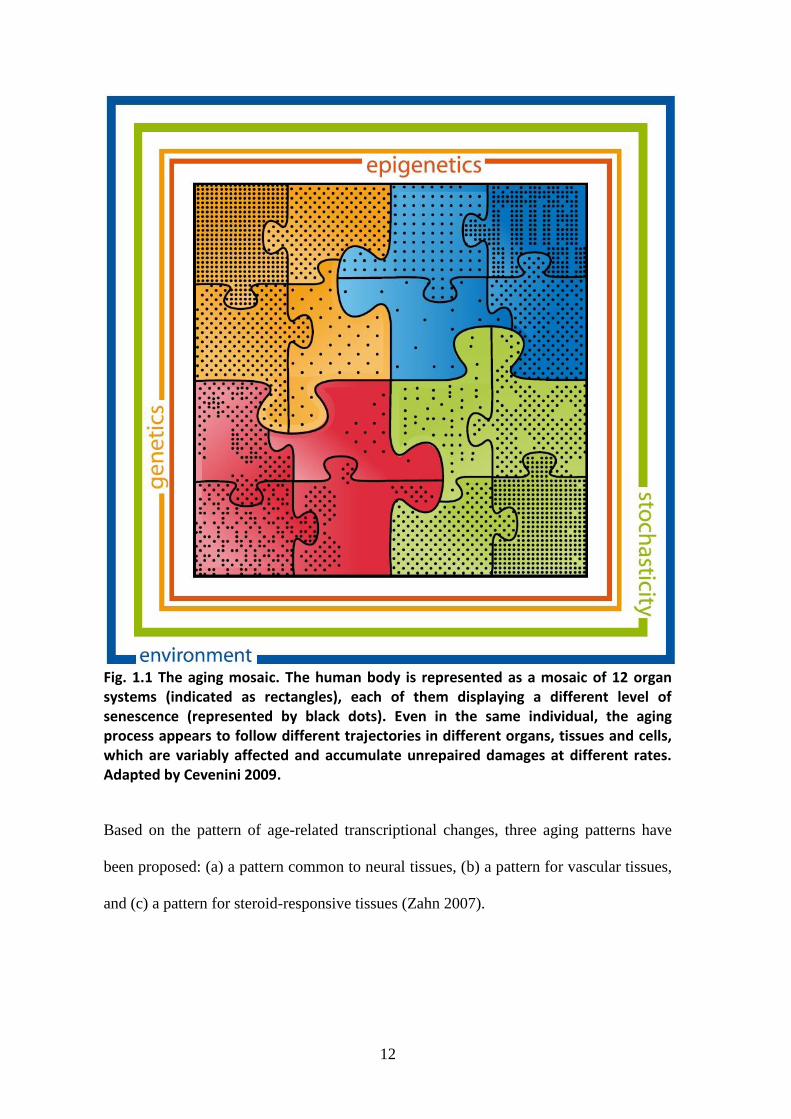
situation we proposed to indicate as “aging mosaic” (Cevenini 2008), as exemplified in
Fig. 1.1. In this figure, we represented the human body as a mosaic of 12 organ systems
11
(indicated as rectangles) according to Hunter and Borg (Hunter 2003), each of them
displaying a different level of senescence (represented by black dots). Thus, even in the
same individual, the aging process appears to follow different trajectories in different
organs, tissues and cells, which are variably affected and accumulate unrepaired
damages at different rates. An example, among many others, is the brain where different
regions, such as cortex, hippocampus and cerebellum, show different levels of
neurodegeneration and inflammation in the same subject (Mishto 2006, Mishto 2009). In
mice, a great heterogeneity in the amount of transcriptional changes with age in different
tissues was found (Zahn 2007).
12
Fig. 1.1 The aging mosaic. The human body is represented as a mosaic of 12 organ systems (indicated as rectangles), each of them displaying a different level of senescence (represented by black dots). Even in the same individual, the aging process appears to follow different trajectories in different organs, tissues and cells, which are variably affected and accumulate unrepaired damages at different rates. Adapted by Cevenini 2009.
Based on the pattern of age-related transcriptional changes, three aging patterns have
been proposed: (a) a pattern common to neural tissues, (b) a pattern for vascular tissues,
and (c) a pattern for steroid-responsive tissues (Zahn 2007).

13
Moreover, this mosaic is dynamic, meaning that it changes with time, owing to the
complex non linear interactions among the different components, resulting in a final
phenotype that is not easily predictable by the study of its single sub-components.
Changes in this mosaic derive from different forms of stressors to which the body is
exposed lifelong. The adaptive response to these perturbations can follow two
trajectories: 1. in case of exposure to a repeated low grade stimulus, the mosaic is able to
positively remodel the mechanisms of maintenance which are up-regulated and the
systemic result is the resistance to stress (hormesis); 2. conversely, in case of exposure
to a stronger stimulus (over a specific threshold) in terms of intensity and persistence,
the remodelling process still occurs, but the mechanisms of maintenance are less
efficient and the global result is negative and detrimental for health and survival (Gems
2008). Therefore, a strategy to increase healthy aging and longevity could be to favour
the hormetic response by transforming intense and persistent stressors into low-grade
ones. In this perspective it is also interesting to note that low-grade stressors can be
assimilated to what is referred to as functional or constructive noise. The role of noise in
biological systems is under investigation, and, for example, it is now evident that the
stochastic or inherently random nature of the biochemical reactions of gene expression
may contribute to the phenotypic variability in individuals (Paulsson 2004, Raser 2005).
Thus, noise, which was often considered “unimportant” by traditional statistical methods
and models, should be taken into account during data analysis, since it may hide un-
analyzed information (Kaput 2007). For example, in gene expression analysis, only
genes whose expression profile differs from an established threshold were evaluated and
the others were classified as “noise” and erroneously excluded (Paulsson 2004). It is also
important to note that noise-induced phenomena have been experimentally detected in
many levels of biological functionality, i.e. in plankton detection by paddle fish (Russell
14
1999), in the retrieval processes of the human memory (Usher 2000), and in human
brain waves (Mori 2002). How can noise potentially play a constructive role in the
system dynamics of main components and compartments of a biological organism? As
regards the immunoproteasome (Kloetzel 2001), it has been addressed whether the
protein translocation inside the proteasome chamber can be driven by fluctuation, and a
toy-model has been derived to show the probable mechanism of translocation (Zaikin
2005). Even if at the moment there is no experimental verification of the proposed
hypothesis, however, it can be expected that noise-induced behaviour could play a major
role in the immunoproteasome functioning, making this aspect worth of deeper
investigation.
Currently, most of the studies focused on human aging still refer to a single district of
the mosaic (generally the most easily available tissues, see for example the studies on
human diploid fibroblasts, Franceschi 1999, Chondrogianni 2004, among many others).
A more comprehensive approach to understand the complexity of this mosaic would be
the simultaneous study of several organs at once; at present, this strategy has been
applied only to animal models, as reported in mice by Schumacher and co-workers
(Schumacher 2008). However it should be taken into account that extrapolation of
results from experimental animals (mice) to humans is not always straightforward,
mainly due to the quantitative differences in maintenance and reproduction (Demetrius
2006).
Within the complex scenario of such an interaction of different tissues and organs, each
of them having intrinsic regulatory mechanisms as well as different aging rates, we
proposed to go beyond the simplistic assumption of longevity genes playing the same
role all along human life. The interpretation of antagonistic pleiotropy (Williams 1957,
Leroi 2005) paved the way for a wider interpretation of genes (and their polymorphisms)

15
functioning: the reality is even more complex than antagonistic pleiotropy is capable to
describe. Several experimental evidences suggest that the role of genes on physiology
and pathology can change at different phases of human life. In genetics, these evidences
are represented by complex trajectories in the frequencies of functional polymorphisms
in population cohorts of different ages (De Benedictis 1998, Invidia 2009). The presence
of such trajectories suggests that the same polymorphism can have different biological
effects in young, middle-aged and extreme long-living individuals, in a phenomenon
named Complex Allele Timing (De Benedictis 2006). It is noteworthy that this
conceptualization is supported by the use of demographic information, that, together
with data on genetic markers, allowed us to calculate hazard rates, relative risks, and
survival functions for candidate genes or genotypes, providing a powerful tool for
analyzing their influence on longevity and survival (Yashin 1999). This modelling
approach allowed us to predict trajectories in genetic variation frequencies that have
been subsequently confirmed by experimental data (Franceschi 2005).
Moreover, the role of epigenetics (DNA methylation, histone post-transcriptional
modifications, including methylation, acetylation, ubiquitination and phosphorylation) in
the aging process should also be considered within this scenario because it includes
regulatory mechanisms that could play a pivotal role in cellular homeostasis, age-related
diseases, such as human cancer, as well as lifespan. To this regard, "aging epigenetics"
became an emerging discipline (Fraga 2007, Lee 2008). However, no data are available
on the epigenetic of human (extreme) longevity and the global DNA methylation and the
methylation status of specific candidate loci for longevity is at present lacking, as well
as epigenetics applied to population genetics studies.
In this complex scenario, where a unique model for the study of human aging and
longevity does not exist, a systems biology approach that combines and quantify
16
genetics, genomics, proteomics and other –omics fields is necessary to handle the ever
increasing amount of experimental data made available by new high-throughput
technologies. The final aim we are pursuing is to use a systems biology perspective to
grasp the complexity of “aging” and “longevity”; in order to have a healthy old age, a
systems perspective of medicine could promote the arrangement of advanced
personalized therapies specifically aimed, for example, to target the individual patient's
genetic defects (Kirkwood 2008, Cevenini 2008, Salvioli 2008b).
1.3. Methodological approaches to aging as a complex mosaic
1.3.1. Systems biology, aging and longevity
Aging can be studied at several levels of increasing complexity: molecular, organelle,
cellular, organ, organ systems and organism level. For a long time the cellular level was
used as the most integrate level to study aging and longevity, generating a huge amount
of data, directly transferred to tissues, organs, organ systems and the whole organism.
Despite an enormous literature regarding physiological changes during aging in different
organs, only few studies have been performed at organ system and organism level and it
is emerging that many findings obtained from studies at cellular level often are not
informative about the scenario of higher levels of complexity. Only now scientists are
trying to integrate the findings obtained by studies performed at different levels into a
coherent framework. In this new perspective, systems biology represents a modern
science whose aim is to operate at a systemic level, by using the most integrated models
(organ and organism). Thus, it moves biology from a traditional microscopic/qualitative
perspective to a macroscopic/quantitative one, allowing researchers to integrate and
quantify the huge amount but fragmented data that nowadays can be obtained by high-
throughput technologies (Doyle 2006). In addition, it also offers tools to develop
17
predictive mathematical models and networks (West 2009), able to evaluate and
compare potential explanations for biological data (Cedersund 2009). Thus, systems
biology represents a strategy to integrate and quantify the existing knowledge and data
from different sources into models, to be later tested and then supported with
experimental data for validation and refinement, in a recursive process of “wet and dry”
experiments, that will be discussed in the last section of this review. The ultimate goal is
to “compact” the new acquired knowledge into a single picture, ideally able to
characterize the phenotype at systemic/organism level.
High-throughput technologies generate complex and high dimensionality data that need
appropriate statistical analysis, such as nonlinear methods (Kaput 2007), and above all a
sophisticated interpretative approach in order to get insight on their biological meaning.
Visualization techniques, interaction maps and pathway diagrams can be of great value
in order to understand how all molecular and cellular components and modules are
intertwined and work together to determine the basic structures and the functions of the
organism's complex machinery. Among many interesting examples (Jeong 2000, Pieroni
2008, Tieri 2005), this approach has been used by Raza and colleagues (Raza 2008) to
reconstruct a logically represented pathway map, integrating four pathways central to
macrophage activation (interferon signalling, NF-B, apoptosis, toll-like receptor
pathways), and representing them as one integrated pathway due to their strongly
overlapping interactions. These new methods represent a step further, but we are still far
from having powerful tools able to capture the complexity of the problem and to reach
the ultimate goal, that is combining and quantifying the bulk of available data in specific
fields, including multifactorial diseases, such as neurodegenerative disorders
(Noorbakhsh 2009, Villoslada 2009), aging and longevity (Salvioli 2008a), vaccinology,
preventive medicine, proteolytic systems (proteasome).

18
In spite of this complex scenario, immunological studies and studies on centenarians
revealed that common mechanisms occurred both in very different age-related diseases,
such as diabetes and neurodegeneration, and in healthy long-living subjects. One is the
persistent, low grade inflammatory process which develops with advancing age called
“inflammaging” (Franceschi 2000). Therefore, anti-inflammatory therapies could
efficiently contribute to slow down aging and age-associated pathologies, thus
increasing the possibility to reach longevity. In a general perspective, the prevention or
the postponement of the aging process could have much greater benefit than those
targeted at individual disease (Butler 2008). In addition, combining the already known
empirical methods of anti-aging medicine with unique genetic profile of each human
(gene-pass) may render new awarding opportunities for the further advancements of
human longevity programs (Baranov 2007).
1.3.2. Inflammation, inflammaging and systems biology
Inflammation is a systemic physiological process fundamental for survival, which
involves a variety of cells, organs and organ systems. Despite the well-recognized
systemic character of inflammation, our knowledge of this multi-factorial phenomenon
is highly fragmented and its comprehensive understanding is still in its infancy (Salvioli
2006b).
In the aging field, this consideration is particularly important for “inflammaging”,
(Franceschi 2000, Franceschi 2007b, Franceschi 2007a), which appears to be important
in the pathogenesis of cardiovascular diseases (CVD), type 2 diabetes (T2D), metabolic
syndrome (MS), neurodegeneration, sarcopenia and cancer, among others.
An age-related increase in the production of inflammatory compounds occurs in the
immune system (Vescovini 2007, Larbi 2008), brain (Licastro 2003), adipose tissue
(Hotamisligil 2007) and muscle (Barbieri 2003), but the possible contribution to
19
inflammaging of other organs or districts, such as gut microbiota and liver, is largely
unexplored.
At present a major unsolved problem in biology and medicine is the source(s) of the
inflammatory stimuli underpinning and sustaining inflammaging. Moreover, the
signaling circuitry and the cross-talk among the various tissues and organs involved in
inflammaging are far from being clear. Therefore, systems biology represents the most
powerful and comprehensive approach to characterize the systemic nature of
inflammaging, for example by developing predictive models of inflammaging, urgently
needed to set up strategies for the modulation of inflammation, by acting on strategic
targets with global, systemic effect on the whole process.
A key point in such a complex framework is the dynamics of signaling pathways crucial
to inflammation, such as those related to NF-B transcription factor activation. NF-B
regulates genes that in turn control cell proliferation, cell survival, as well as innate and
adaptive immune response. The sheer complexity of such crucial signalling system is
intuitively evident from the intricate network of interactions among input and output
signals, mediator proteins and regulated genes. Framing structure and dynamics of the
NF-B interactome in a wider, systemic picture will be a significant step toward a better
understanding of how it globally regulates diverse gene programs and phenotypes. This
fact gives rise to the necessity of a systemic, multiscale approach able to take into
consideration all the crucial levels of complexity into an unique framework, from
protein-protein interactions to gene expression, from cellular to tissue response and
finally to the dynamics of organs.
20
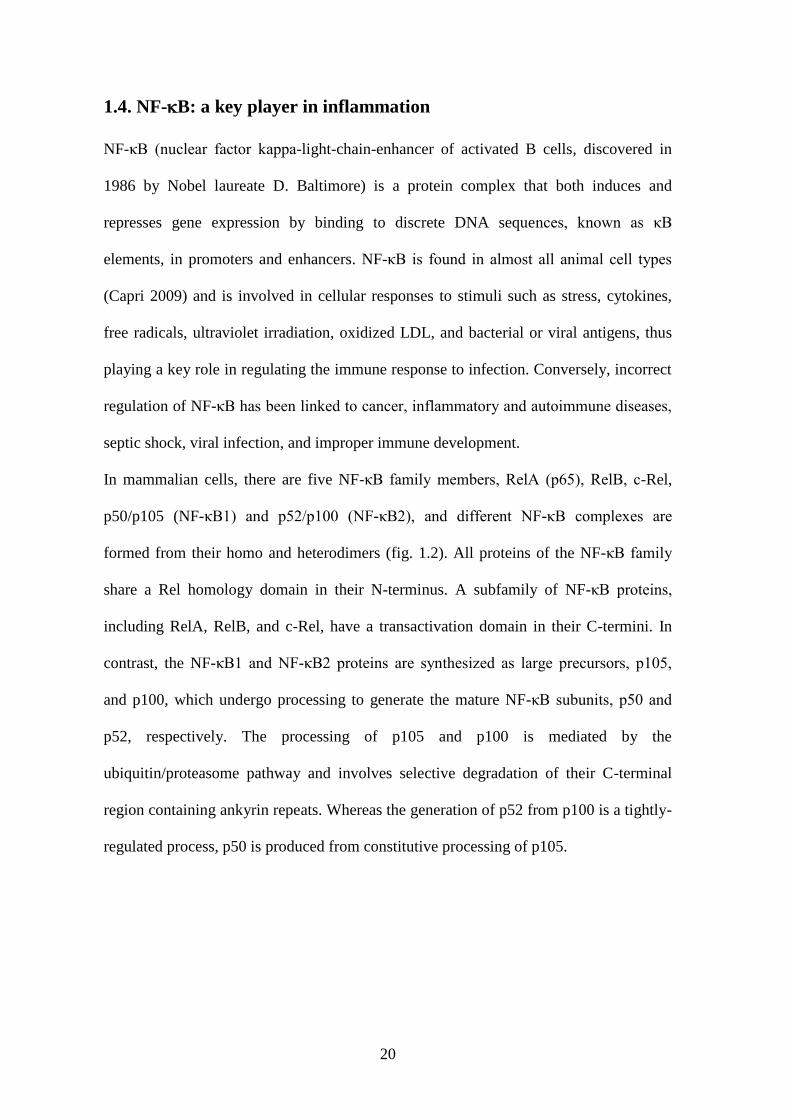
1.4. NF-B: a key player in inflammation
NF-κB (nuclear factor kappa-light-chain-enhancer of activated B cells, discovered in
1986 by Nobel laureate D. Baltimore) is a protein complex that both induces and
represses gene expression by binding to discrete DNA sequences, known as κB
elements, in promoters and enhancers. NF-κB is found in almost all animal cell types
(Capri 2009) and is involved in cellular responses to stimuli such as stress, cytokines,
free radicals, ultraviolet irradiation, oxidized LDL, and bacterial or viral antigens, thus
playing a key role in regulating the immune response to infection. Conversely, incorrect
regulation of NF-κB has been linked to cancer, inflammatory and autoimmune diseases,
septic shock, viral infection, and improper immune development.
In mammalian cells, there are five NF-κB family members, RelA (p65), RelB, c-Rel,
p50/p105 (NF-κB1) and p52/p100 (NF-κB2), and different NF-κB complexes are
formed from their homo and heterodimers (fig. 1.2). All proteins of the NF-κB family
share a Rel homology domain in their N-terminus. A subfamily of NF-κB proteins,
including RelA, RelB, and c-Rel, have a transactivation domain in their C-termini. In
contrast, the NF-κB1 and NF-κB2 proteins are synthesized as large precursors, p105,
and p100, which undergo processing to generate the mature NF-κB subunits, p50 and
p52, respectively. The processing of p105 and p100 is mediated by the
ubiquitin/proteasome pathway and involves selective degradation of their C-terminal
region containing ankyrin repeats. Whereas the generation of p52 from p100 is a tightly-
regulated process, p50 is produced from constitutive processing of p105.
21
Fig 1.2 The five nuclear factor (NF)-κB family members (a), the inhibitor of NF-κB (IκB) family consists of IκBα, IκBβ, IκBε and BCL-3 (b), and the three core subunits of the IκB kinase (IKK) (c). Adapted by Perkins 2007.
In most cell types, NF-κB complexes are retained in the cytoplasm by a family of
inhibitory proteins known as inhibitors of NF-κB (IκBs). Activation of NF-κB typically
involves the phosphorylation of IκB by the IκB kinase (IKK) complex, which results in
IκB degradation. This releases NF-κB and allows the free translocation in the nucleus.

22
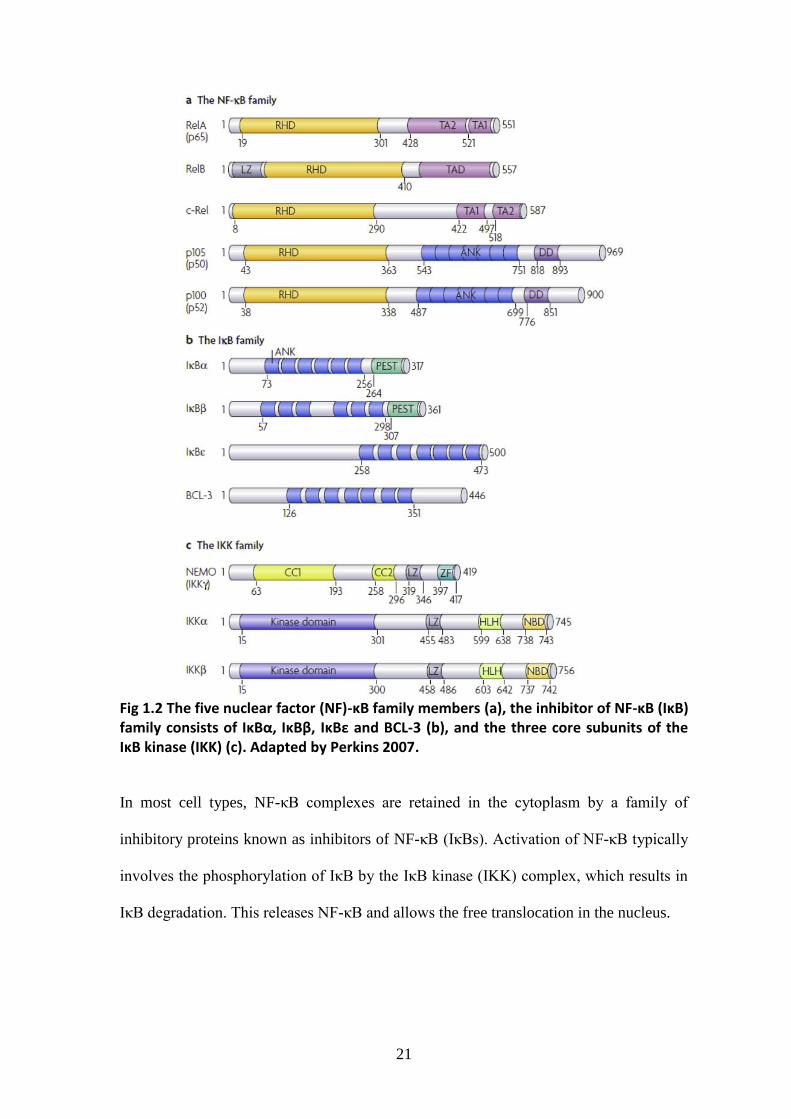
There are several distinct NF-B activation pathways (see fig. 1.3). Here there will be
briefly summarized. Readers should refer to (3) and cited references for an exhaustive
treatise.
The canonical pathway is induced by tumor necrosis factor-α (TNFα), interleukin-1 (IL-
1) and many other stimuli, and is dependent on activation of IKKβ. This activation
results in the phosphorylation of IκBα, leading to its ubiquitylation (Ub) and subsequent
degradation by the 26S proteasome. Release of the NF-κB complex allows it to relocate
to the nucleus.
IKK-dependent activation of NF-κB can occur following genotoxic stress. Here, NF-κB
essential modifier (NEMO) localizes to the nucleus, where it is sumoylated and then
ubiquitylated, in a process that is dependent on the ataxia telangiectasia mutated (ATM)
checkpoint kinase. NEMO relocates back to the cytoplasm together with ATM, where
activation of IKKβ occurs.
IKK-independent atypical pathways of NF-κB activation have also been observed and
described, which include casein kinase-II (CK2) and tyrosine-kinase-dependent
pathways.
The non-canonical pathway results in the activation of IKKα by the NF-κB-inducing
kinase (NIK), followed by phosphorylation of the p100 NF-κB subunit by IKKα. This
results in proteasome-dependent processing of p100 to p52, which can lead to the
activation of p52–RelB heterodimers that target distinct κB elements.
Phosphorylation of NF-κB subunits by nuclear kinases, and modification of these
subunits by acetylases and phosphatases, can result in transcriptional activation and
repression as well as promoter-specific effects. Moreover, cooperative interactions with
heterologous transcription factors can target NF-κB complexes to specific promoters,
23
resulting in the selective activation of gene expression following cellular exposure to
distinct stimuli.
Fig 1.3 Distinct NF-B activation pathways: canonical, atypical IKK dependent and IKK independent, and non canonical pathways. See text for a description. Legend: Ac, acetylation; bZIP, leucinezipper-containing transcription factor; HMG-I, high-mobility-group protein-I; IκB, inhibitor of κB; IKK, IκB kinase; LMP1, latent membrane protein-1; LPS, lipopolysaccharide; NF-κB, nuclear factor-κB; RHD, Rel-homology domain; TAD, transcriptnal activation domain; TF, transcription factor; UV, ultraviolet; Zn-finger TF, zinc-finger-containing transcription factor. Adapted by Perkins 2007.
24
In vertebrates, NF-κB is induced by over 150 different stimuli (Pahl 1999). In turn, there
is evidence that active NF-κB participates in the control of transcription of a number of
target genes (already 150 reported by Pahl 1999). These genes express cytokines,
chemokines and their modulators, immunoreceptors, proteins involved in antigen
presentation, cell adhesion molecules, acute phase proteins, stress response proteins,
cell-surface receptors, regulators of apoptosis, growth factors, ligands and their
modulators, early response proteins, transcription factors and regulators, and enzymes,
among others. Updated information (Gilmore 2010) indicated that NF-B may regulated
the expression of more than 400 genes. These data thus suggest that NF-κB functions
more generally as a central regulator of stress responses. In addition, NF-κB activation
blocks apoptosis in several cell types. Indicatively, coupling stress responsiveness and
anti-apoptotic pathways through the use of a common transcription factor may result in
increased cell survival following stress insults.
This non exhaustive description (the reader should refer to the rich and day-by-day
growing literature available online for a more complete depiction of the NF-κB system
and functioning) briefly illustrates the sheer complexity of the NF-κB pathway system,
which, despite the consistent efforts dedicated to its study, has only begun to be
investigated. With these premises, NF-κB represents a perfect target for a systems
biology study. Here following in this work, one among the first attempts to face its
complexity providing a wider picture of the system is presented.

25
2. Materials and methods
_______________________________________________________________________
2.1. Network biology: a functional approach to complex biological
systems
Graph theory, a branch of mathematics that from its birth, due to Leonhard Euler in the
XVIII century, has been recently rejuvenated, is the study of “graphs”, mathematical
structures used to model relations between objects. A “graph” in this context refers to a
collection of “vertices” or “nodes”, and a collection of “edges”, or “links”, that connect
pairs of nodes. Network theory concerns itself with the study of graphs as a
representation of relations between any kind of discrete objects.
Network abstractions and graph-theoretical approaches are today common in science.
This approach has been applied for the representation of complex systems, and has
achieved a certain success, from social studies (Travers 1969) to engineering (Alderson
2005) and biology (Watts 1998, Albert 2000, Jeong 2000, Newman 2000, Jeong 2001,
Barabasi 2004, Goh 2007, Pieroni 2008).
Despite its intrinsically limited perspective, such conceptualization makes complex
biological systems able to be considered as a whole and to undergo mathematical
analysis, aiming to the discovery of salient systemic features and providing an accurate
and analytic view at glance of entities, relations and functions that characterize them.
This approach also allows to highlight how the qualities and behavior of single elements
influence the network topology and dynamics, how network structure impinges upon
processes spreading over the network, or the effect of perturbations on network
performance (Boccaletti 2006, Tieri 2005). In this regard, the network abstraction of
26
biochemical signaling pathways can represent a useful functional view that can
complement analyses and approaches from molecular biology and genomics.
Biochemical pathways are usually referred to as intracellular processes which scale can
in some way be placed between small events, such as protein complexes formation or
enzyme catalysis, and cell-wide or larger events, such as cell death or inflammation.
These processes can be divided into separate steps, which seldom follow a linear and
unambiguous succession. It is not yet simple to define a pathway in terms of its
components, steps, dynamics and function, given its manifold, hazy and intricate nature.
Actually, pathways and signaling cascades are not isolated entities. A signaling pathway
can be triggered by many different extra- or intra-cellular events, cover different parallel
paths and branches, intersect, be competitive or cooperative or interdependent with other
events, every step can have diverging functions, and so on. Pathways, in conclusion, are
processes characterized by high complexity (Bhalla 1999, Bhalla 2003, Ivakhno 2007).
Abstractions and models of biological networks and pathways discussed here are mainly
protein interaction networks (PINs) and protein-signaling networks (PSNs). PINs
represent protein-protein binding events on a proteome-wide scale. Nodes and
undirected edges represent proteins and binding events among them. In PSNs, nodes and
directed edges represent phosphoproteins and phosphorylation reactions. The two
models can be combined and enriched with additional layers, such as transcriptional
regulatory networks, among others.
2.1.1 A workflow for integrative pathway and interactome reconstruction and
analysis
Omics data and computational approaches are today providing a key to disentangle the
complexity of objects like signaling pathways, assisted by dedicated online databases
and specific software tools. Through such methodology, it is possible to integrate data of

27
different nature to extract meaningful representations and useful information, finally
leading to an increased understanding of the biochemical process under examination.
Nevertheless, the workflow for the integrated reconstruction and analysis of signaling
pathways, interactomes and biological networks is hampered by difficulties of diverse
nature, such as lack of data, shortcomings, annotation differences or multiple
interpretations, data integration problems and other difficulties (Adriaens 2008, Bauer-
Mehren 2009, Gardy 2009). Materials and workflow described here want to show a
general approach for gathering information of interest from some of the existing
pathway and protein interactions databases, for integrating and analyzing data and
reconstructed representations by using the available tools, and to understand which kind
of knowledge is possible to extract from the combination of existing information. The
characteristics of some of the many pathway and protein interactions online resources
and databases will be shortly described, together with the Cytoscape software platform
and other online analysis tools able to greatly help in reconstructing and analyzing
pathways and interactomes.
2.2. Materials: online databases and tools
2.2.1 Overview of databases and online data sources
Signaling cascades and pathways information is more and more often systematically
collected and organized into publicly available databases. Such kind of resources lay the
foundations for the systems level approach, allowing a workflow consisting in the
reconstructive process of the pathway/interactome networks, that generally consists in
the manual or automated retrieval of pathway data, their integration, merging,
comparison and enrichment with other forms of data, and then the analytical process
(simulation, mathematical modeling, statistical analysis). Iterative cycles of such

28
procedures, modeling, and prediction, combined with experimental validation (the
systems biology cycle, fig. 2.1, Kitano 2002), can result in the improvement of the
knowledge of cell signaling and responses.
Fig. 2.1 The systems biology cycle: iterative cycles of modeling and prediction, combined with experimental validation may result in the improvement of the knowledge of cell signaling and responses. Adapted by Kitano 2002.
Online dedicated databases usually store cell signaling data in exchangeable formats
(often BioPAX – Biological Pathway Exchange-, or SBML –Systems Biology Markup
Language; see Notes section) accessible by diverse software platforms and tools,
allowing for their retrieval, visualization and analysis. The following list should by no
means considered as exhaustive; links and URLs can be found in the Notes section.
The Pathguide (the Pathway Resource List, fig 2.2, Bader 2006) is a resource useful as a
starting point for biological pathway analysis, since it is a content aggregator for

29
integrated biological information systems. It is a meta-database that provides an
overview of current pathway and other systems biology-oriented databases. Pathguide
currently enlists and provides details and links to more than 300 web-accessible
biological pathway and network databases. These include databases on metabolic
pathways, signaling pathways, transcription factor targets, gene regulatory networks,
genetic interactions, protein-compound interactions, and protein-protein interactions.
The listed databases are curated and maintained by diverse scientific groups in different
worldwide locations and the information in them is derived either from the scientific
literature or from systematic, high-throughput experiments.
Fig 2.2 Screenshot of the Pathguide website (www.pathguide.org), a content aggregator for pathway analysis.
Reactome (Matthews 2009, Note 2) is a pathway database covering a very wide set of
biological processes, organized in a hierarchical manner: lower levels for smaller
reactions, higher levels for pathways and larger processes. Data are extracted from
30
literature and biomedical experiments, are human-curated and are represented as chains
of chemical reactions (including transcription, catalysis, binding). Data can be physical
entities (DNA, RNA, protein complexes, phosphorylated and unphosphorylated proteins,
small molecules…) or events (reaction-like event, for smaller reactions, or pathway-like
event, clustering many reaction-like events). It is possible to search and browse data and
representations in remote, or to download them in local in the most common formats or
in graphical representation. The website also provides some useful statistical and
graphical tools and can be accessed through a SOAP (Simple Object Access Protocol)
web service for automated data queries.
KEGG (the Kyoto Encyclopedia of Genes and Genomes, Kanehisa 2000, Kanehisa
2010, fig 2.3) consists of a number of interlinked databases devoted to several domains
in the cell, the organism and the biosphere (genes, genomes, proteins, chemical
compounds, pathways, diseases, drugs, ontologies). The pathways section covers many
organisms including human. Data are categorized into the different processes
(metabolic, genetic information, signaling etc) and are coded in its own XML format
(KGML), or also in BioPAX and SBML through the use of additional available coding
tools.

31
Fig 2.3 Screenshot of a comprehensive metabolic map in KEGG (www.genome.jp/kegg/).
The Nature Pathway Interaction Database (PID) (Schaefer 2009) is hierarchically
organized in a way similar to Reactome and hosts pathway data (available in BioPAX or
XML) obtained from peer reviewed literature or imported from other databases such as
Reactome or BioCarta (a biotech commercial supplier reagents and assays for
biopharmaceutical and academic research, see Notes). DNA and RNA are not part of the
PID pathways but active/inactive, phospho/unphosphorylation states are annotated, the
pathways can be browsed starting from UniProt, Entrez Gene (see Notes) or other types
of identifiers, and statistical or query tools are provided.
Pathway Commons is based on already existing databases such as Reactome, PID, and
other protein interactions databases, and provides an integrated access point and a
compilation of such databases, thus conserving their structure and data hierarchies.
32
However, this kind of integration is not a simple task and this can result in overlapping,
discordant and/or redundant information. A useful feature is the complete accessibility
through the dedicated Pathway Commons plugin from the Cytoscape platform (see later
in the chapter).
WikiPathways (Pico 2008) is an open source and collaborative platform for biological
pathway information, storage and curation, in the wake of the Wikipedia style. Data are
categorized by species and processes (f.i. metabolic process, molecular function, etc)
and are coded in the GenMAPP (an application designed to visualize gene expression
and other genomic data on maps representing biological pathways and groupings of
genes) Pathway Markup Language (GPML) that can be compatible with applications
such as PathVisio (a visualization tool, see Notes), Cytoscape and GenMAPP.
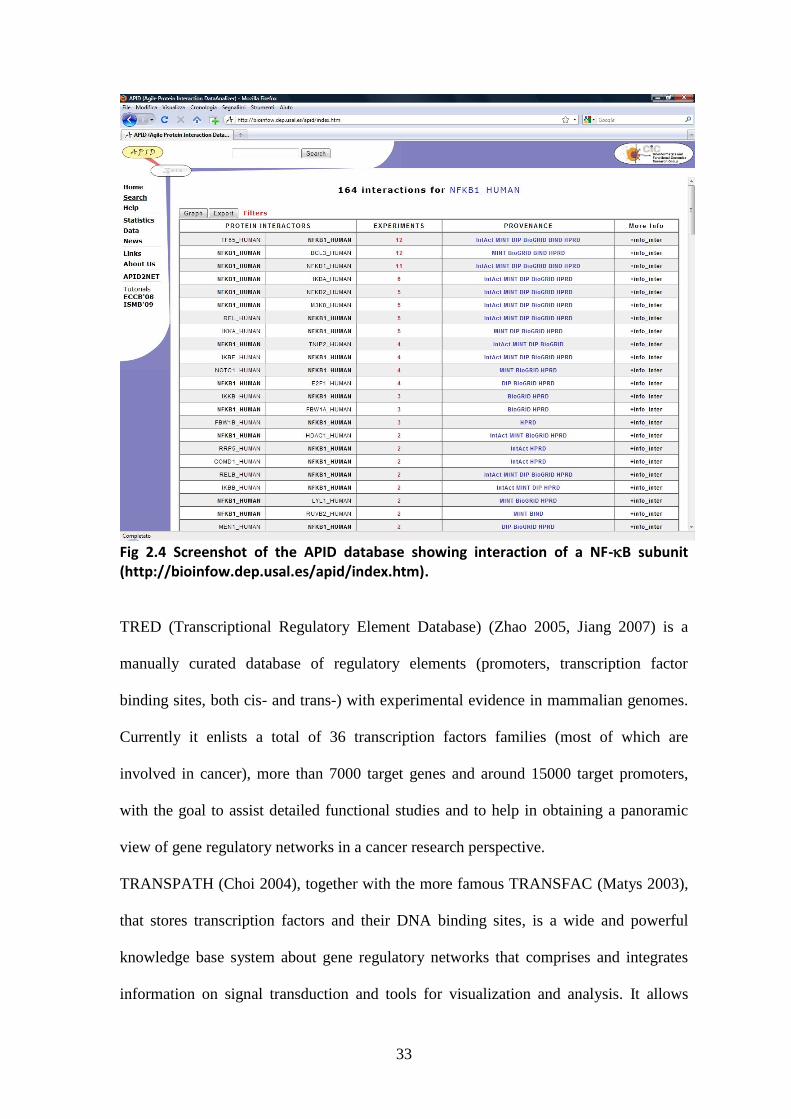
APID (Agile Protein Interaction DataAnalyzer) (Prieto 2006, fig 2.4) is an interactive
web-based platform devoted to the exploration and analysis of diverse information about
protein interactions, integrated and unified in a common and comparative environment.
APID provides an open access frame where all known experimentally-validated protein-
protein interactions (obtained by the most known protein interactions databases such as
BIND, BioGRID, DIP, HPRD, IntAct and MINT, see Notes) are unified in a unique web
application that allows the exploration and analysis of networks and interactomes. APID
provides some embedded online tools to query and browse data and, most useful, a
Cytoscape plugin (APID2NET, Hernandez-Toro 2007) that allows to extract, visualize
and analyze unified interactome data by directly quering APID servers, including all the
annotations and attributes associated to the retrieved PPIs.
33
Fig 2.4 Screenshot of the APID database showing interaction of a NF-B subunit (http://bioinfow.dep.usal.es/apid/index.htm).
TRED (Transcriptional Regulatory Element Database) (Zhao 2005, Jiang 2007) is a
manually curated database of regulatory elements (promoters, transcription factor
binding sites, both cis- and trans-) with experimental evidence in mammalian genomes.
Currently it enlists a total of 36 transcription factors families (most of which are
involved in cancer), more than 7000 target genes and around 15000 target promoters,
with the goal to assist detailed functional studies and to help in obtaining a panoramic
view of gene regulatory networks in a cancer research perspective.
TRANSPATH (Choi 2004), together with the more famous TRANSFAC (Matys 2003),
that stores transcription factors and their DNA binding sites, is a wide and powerful
knowledge base system about gene regulatory networks that comprises and integrates
information on signal transduction and tools for visualization and analysis. It allows
34
obtaining complete signaling pathways from ligand to target genes and their products.
Its access requires a license purchase, even if a version dating back to years ago can be
accessed for free.
NetPath (Keshava Prasad 2009) is a curated compendium of human signaling pathways
which currently contains annotations for several cancer and immune signaling pathways.
Pathway data are available for browsing and download in the most common formats
(included Proteomics Standards Initiative-Molecular Interaction –PSI-MI- format), and
listing of up- and down-regulated genes for each pathway is provided, based on
experiments and literature.
It is quite normal that users spend an amount of time in browsing many databases in
search for the data and models that meet the requirements of the research project.
Notwithstanding the quantity and quality of the publicly available resources, information
automatically extracted from a single pathway database is usually not yet exhaustive.
Given the often complementary nature of data in different databases, they should be
retrieved, integrated and combined, and we feel the quality of the result still strongly
relies upon a sharp manual curation effort (Adriaens 2008, Bauer-Mehren 2009, Gardy
2009). The integration process itself, however, can present several problems, not least
those of interchangeability of the different formats and data models, but also in terms of
reaction annotation, or of significant differences in other key biological factors, such as
cellular state and type (Adriaens 2008). Thus, the process of literature extraction of data
(also possibly aided with text-mining techniques) together with combination of
information from databases under expert supervision and curation probably remains a
good choice in order to get an accurate pathway reconstruction. A complete and deep
curation process can last months and employ many experts, and yet yield controversial
results. Conversely, manual integration of data extracted from online pathway resources
35
–under expert review- can be decently performed in days, allowing to create a
sufficiently accurate (also depending on the scope) representation of a given pathway, or
part of it, able to undergo further functional enrichment and analysis.
2.3. Materials: computational analysis software
2.3.1. Main platforms and tools
Since the purpose of the interactome or pathway reconstruction process is to have an
“object” can be further elaborated, enriched and analyzed step by step, we will need to
access and store data in local machines, and not only to browse them online. As
described before, most of available database allow downloading the relevant data in
diverse formats (BioPAX, SBML, PSI-MI, among others). At this point, the choice of
one or more tools for network editing and analysis is up to the user. Some of them are
directly embedded or available inside the different databases, such as Reactome,
WikiPathways, BioCarta, GenMAPP. Others are commercial suites, such as Ingenuity or
Pathway Studio, with special visualization features (see Notes).
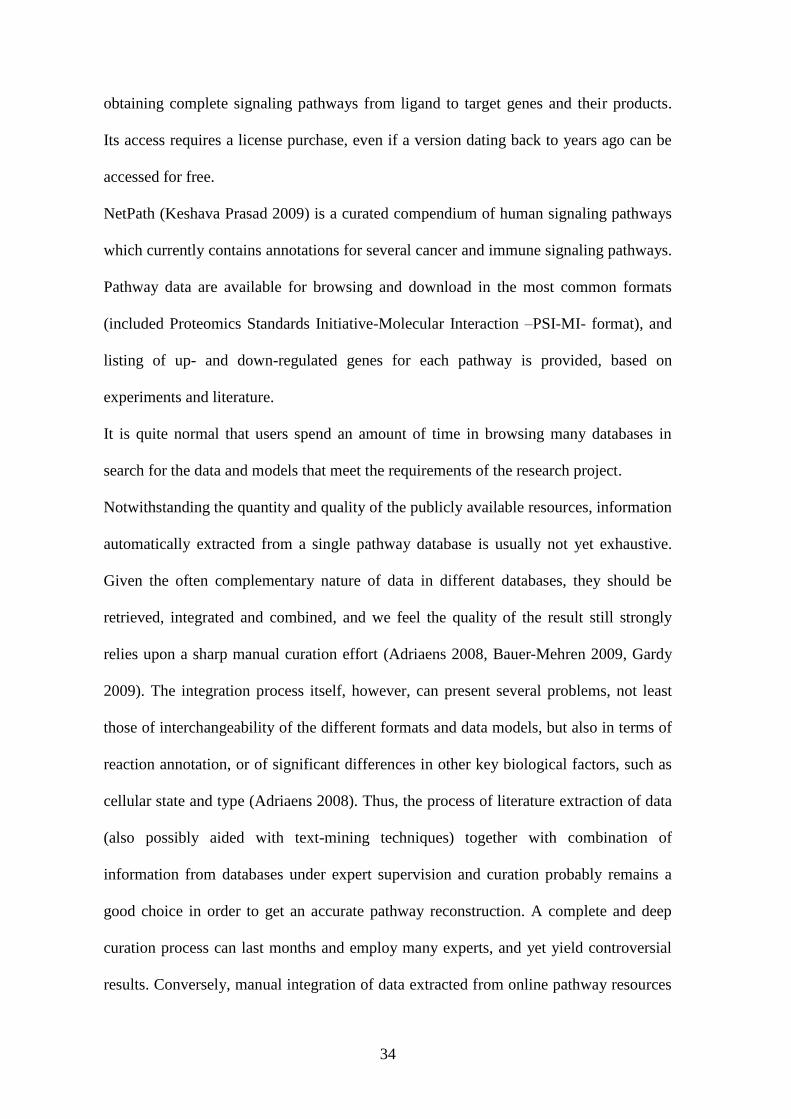
Among the open source applications, Cytoscape (Shannon 2003, fig. 2.5) is a very
powerful software platform, available for all the major operating systems, designed for
biological research, but versatile enough to be used in many other fields where network
editing, visualization and analysis are key features. The core tool has been developed to
visualize molecular interaction networks and biological pathways, and to integrate these
networks with annotations, gene expression profiles and other state data. Many more
additional features, such as advanced network and molecular profiling analyses, new
layouts, additional file format support, scripting, and connection with databases, are
available as plugins. It supports many different standard network and annotation file
36
formats, including SIF (Simple Interaction Format), BioPAX, PSI-MI, SBML, tab-
delimited text files and MS Excel.
Fig. 2.5 Screenshot of a working window in the Cytoscape visualizing and analysis tool (www.cytoscape.org).
BiologicalNetworks (Baitaluk 2006) is an integrated research environment for biological
sciences that allows querying and integrating molecular interaction networks, metabolic
and signaling pathways with a large number of biological features related to
transcriptional regulation, microarray and proteomic experiments, 3D structures
ontologies, taxonomies and other types of data. It is based on a database currently
integrating over 100 curated and publicly contributed data sources for thousands of
eukaryotic, prokaryotic and viral genomes.
CellDesigner (Funahashi 2003) is a structured diagram editor for drawing gene-
regulatory and biochemical networks. Networks are drawn based on the process
37
diagram, with a particular graphical notation system, and are stored using the SBML
format. Networks are able to link with simulation and other analysis packages through a
wider software platform named Systems Biology Workbench (SBW).
We will focus on a workflow mainly based on the Cytoscape platform given its free
availability, diffusion in biology research, upgradeability and versatility.
2.3.2 Other specific analysis tools and plugins
Powerful standalone packages specific for network analysis are freely available. Pajek
(Batagelj 2003) (“spider” in Slovene, the nationality of the developers), for instance, is
able to visualize and analyze networks of millions of nodes. Specific add-on modules
can be used inside the well-known R statistical package (www.r-project.org).
Other packages have direct web-based functionality: GraphWeb (Reimand 2008) is a
public web server for graph-based analysis that has been designed for extensive analyses
of directed and undirected, weighted and unweighted heterogeneous networks of genes,
proteins and microarray probesets for many eukaryotic genomes, and is able to integrate
multiple diverse datasets into global networks.
Among the many available Cytoscape plugins (for an exhaustive list and references see
the Cytoscape.org website), NetworkAnalyzer (Assenov 2008) requires no expert
knowledge in graph theory from the user. It is able to compute, display and shows charts
for a quite complete set of topological parameters for undirected and directed networks,
which includes the number of nodes, edges, and connected components, the network
diameter, radius, density, centralization, heterogeneity, clustering coefficient, and the
characteristic path length.
ClusterMaker (Cytoscape plugin, see Notes) unifies different clustering techniques and
displays into a single interface. It uses specific algorithms for clustering expression or
38
genetic data, and similarity networks to look for protein families and putative functional
similarities.
The Hub Objects Analyzer (Hubba) (Lin 2008) is both a web-based service and a
Cytoscape plugin for exploring networks to discover hubs and important nodes in an
interactome network generated from specific small- or large-scale experimental
methods.
2.4. Methods: general retrieval and reconstruction procedures
2.4.1. Data retrieval
The process of manual literature mining for data extraction is labor-intensive and time
consuming but typically gives back high-quality data and models. It is evident that,
given the broadness and importance of this topic, it cannot be exhaustively treated here
and we refer to Jensen and colleagues (Jensen 2006) for a comprehensive review on the
field of manual and machine-aided extraction of biomedical facts from scientific
literature.
In the first step of retrieving the pathway data of interest through Cytoscape, it is
possible to use one of the many existing plugins, each one designed to query and retrieve
data from many different databases. It is evidently advisable that the user has previously
browsed the candidate databases to understand which type, model and format data have
been stored in.
Among the many Cytoscape plugins, BioNetBuilder (Avila-Campillo 2007) can be used
to build networks for many different species, including most common model organisms
and human, retrieving data from currently supported databases that include DIP, BIND,
KEGG, HPRD, BioGrid, among others. The interface offers different options to specify
a set of initial genes/gene products for which to find molecular interactions (including
39
loading a text file, finding genes with specified Gene Ontology annotations, and finding
genes whose common name match a given string). Biological networks for whole
organisms can also be created and displayed.
Another very useful plugin is the aforementioned APID2NET, linked to the APID
database. It is possible to specify a list of proteins and get the network of their
interactions, at the desired connection level (level 0 considers only the interactions
among the listed proteins, level 1 considers all their neighbors in APID, level 2
considers also the neighbors of the neighbors, etc.) and validated by the chosen number
of different experimental methods. The system also displays additional information on
node, edge and network attributes.
The user can also start a Cytoscape session with the embedded import network from web
service function to connect directly to the Pathway Commons or WikiPathways servers
and get the data. It is also possible to retrieve the data from each single database simply
by downloading a formatted file and then upload and open it in the Cytoscape client that
will visualize the relative network.
It is not always possible to retrieve data following a plugin-automated or semi-
automated process as described above. For some databases, not specifically designed for
systems biology but containing useful and well arranged information, as for instance the
transcriptional regulatory element database TRED, it can be necessary to make the
query, to extract the data with copy/paste operations in text format and make adaptation
to import and incorporate them into a network in a very manual fashion.
2.4.2. Data merging and combination
As said, combination of data from different pathway databases is highly desirable. The
user can for instance download the same pathway data as provided by two or more
databases and try to confront and combine them in order to make it as complete as
40
possible. For this purpose, again, suitable Cytoscape plugins (f.i.
AdvancedNetworkMerge) or embedded function in the tool may be used. This is
typically a very critical point, since very often molecular and reaction data have been
encoded and modeled in different manner according to the originating database, so that
the network resulting from the merging of such two or more networks can
disappointingly result as a simple sum of the originating objects, or anyway as an
inconsistent network, without any -although expected- overlap, or any other shared
information or link. There is no trivial solution to this kind of issues, since from
database to database there are no uniquely defined identifiers for each of the entities that
compose the pathways or the networks. Accurate filtering and expert curation performed
before the merging process could purge the data from undesired or redundant
information. This will also usually make it quite easy to build improved versions of the
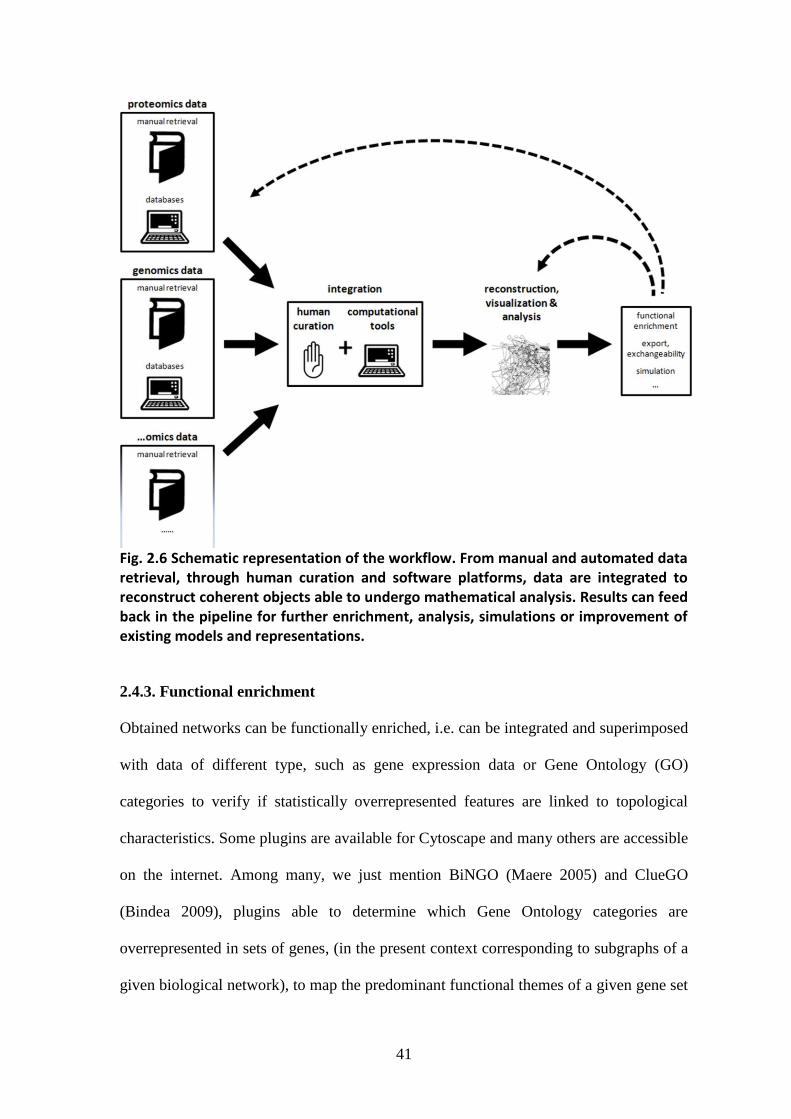
networks based on additional and different types of data. In figure 2.6 a schematic
representation of the whole workflow is presented.
41
Fig. 2.6 Schematic representation of the workflow. From manual and automated data retrieval, through human curation and software platforms, data are integrated to reconstruct coherent objects able to undergo mathematical analysis. Results can feed back in the pipeline for further enrichment, analysis, simulations or improvement of existing models and representations.
2.4.3. Functional enrichment
Obtained networks can be functionally enriched, i.e. can be integrated and superimposed
with data of different type, such as gene expression data or Gene Ontology (GO)
categories to verify if statistically overrepresented features are linked to topological
characteristics. Some plugins are available for Cytoscape and many others are accessible
on the internet. Among many, we just mention BiNGO (Maere 2005) and ClueGO
(Bindea 2009), plugins able to determine which Gene Ontology categories are
overrepresented in sets of genes, (in the present context corresponding to subgraphs of a
given biological network), to map the predominant functional themes of a given gene set
42
on the GO hierarchy as a graph, and to perform cluster analysis and comparison of
clusters. GOrilla (Eden 2009) is a tool for identifying and visualizing enriched GO terms
in ranked lists of Human genes.
2.5. Methods: network analysis
2.5.1. Topological measures
Once that the user has performed the reconstruction steps and considers the “object”
pathway or interactome in some way complete and stable (for the subjective purpose of
the study to be carried out), it is time to proceed with the subsequent network analysis.
All cited computational platforms are precisely designed to perform such analyses that
can be easily implemented through embedded or add-on features.
The goal of topological analysis of protein networks is to discern organizational „design‟
principles, relate those to dynamical properties, and establish connections to biological
functions. The detection of interesting topological properties occurs by comparing the
network under study with a “null model”; that is, a set of networks that reflect what is
expected by random chance. If a network under study possesses certain characteristics
different from what is expected by chance alone, then these might be related to the
function of the network: they could have been selected by evolution for their
advantageous properties.
Topological measures have demonstrated their usefulness in uncovering the organizing
principles that rule the development and the evolution of networks of different nature
(Barabasi 2004). Several observations led to conclude that the classical degree
distribution, and the well-investigated scale-free characteristic, of nodes in PINs, for
instance, correlates with biological meaningful features, such as importance, lethality,
robustness and dynamics of perturbations. Hierarchical topology, sub-graphs, modular
43
structures, clusters are, among others, strongly characterizing features of networks that a
focused analysis can reveal (Pieroni 2008). In some fields, such as cancer research,
extensive and deep meta-analyses have shown how some specific measures, such as
betweenness and stress centrality, among others, are particularly relevant in
characterizing pathological states and malignant tissues (Platzer 2007).
Among the many interesting network analysis techniques, clustering can help in the
identification of functional groups and in heuristic discovery of un-annotated functions
of some proteins. Since proteins tend to function in groups, or complexes, an important
goal is to reliably identify protein complexes from graphs and networks derived from
genome scale data on protein interactions. This task is commonly executed using
clustering procedures, which aim at detecting densely connected regions within the
interaction graphs. One of the most successful clustering procedures in this context has
been the Markov Cluster algorithm (MCL), often specifically applied for partitioning
protein interactions graphs. considers the connectivity properties of the underlying
network. MCL has been used to derive complexes from protein interaction data in
comprehensive analyses of the yeast interactome, and was shown to be especially
effective for clustering protein interactions in that it possesses a high degree of noise-
tolerance.
The most common and important topological parameters are briefly described below
(Bollobàs 2002; or, for further information and an useful browsable online help, see
http://med.bioinf.mpi-inf.mpg.de/netanalyzer/help/2.6.1/index.html).
Number of connected components
In undirected networks, two nodes are connected if there is a path of edges between
them. Within a network, all nodes that are pairwise connected form a connected
44
component. The number of connected components indicates the connectivity of a
network – a lower number of connected components suggests a stronger connectivity.
Parameters related to shortest paths
The length of a path is the number of edges forming it. There may be multiple paths
connecting two given nodes. The shortest path length, also called distance, between two
nodes n and m is denoted by L(n,m). The network diameter is the largest distance
between two nodes. If a network is disconnected (some nodes are isolated), its diameter
is the maximum of all diameters of its connected components. The average shortest path
length, also known as the characteristic path length, gives the expected distance between
two connected nodes.
Parameters related to neighborhood
The neighborhood of a given node n is the set of its neighbors. The connectivity of n,
denoted by kn, is the size of its neighborhood. The average number of neighbors
indicates the average connectivity of a node in the network. A normalized version of this
parameter is the network density. The density is a value between 0 and 1. It shows how
densely the network is populated with edges (self-loops and duplicated edges are
ignored). A network which contains no edges and solely isolated nodes has a density of
0.
The number of isolated nodes may provide insight how the network density is
distributed. Another related parameter is the network centralization. Networks whose
topologies resemble a star have a centralization close to 1, whereas decentralized
networks are characterized by having a centralization close to 0. The network
heterogeneity reflects the tendency of a network to contain hub nodes.
Clustering coefficient
45
In undirected networks, the clustering coefficient Cn of a node n is defined as Cn =
2en/(kn(kn-1)), where kn is the number of neighbors of n and en is the number of
connected pairs between all neighbors of n. In directed networks, the definition is
slightly different: Cn = en/(kn(kn-1)).
In both cases, the clustering coefficient is a ratio N / M, where N is the number of edges
between the neighbors of n, and M is the maximum number of edges that could possibly
exist between the neighbors of n. The clustering coefficient of a node is always a
number between 0 and 1. The network clustering coefficient is the average of the
clustering coefficients for all nodes in the network. Here, nodes with less than two
neighbors are assumed to have a clustering coefficient of 0.
Degree distributions
In undirected networks, the node degree of a node n is the number of edges linked to n.
A self-loop of a node is counted like two edges for the node degree. The node degree
distribution gives the number of nodes with degree k for k = 0,1,….
In directed networks, the in-degree of a node n is the number of incoming edges and the
out-degree is the number of outgoing edges. Similar to undirected networks, there are an
in-degree distribution and an out-degree distribution.
The node degree distribution may be used to distinguish between random (as defined by
Erdős and Rényi 1959) and scale-free network topologies.
Neighborhood connectivity
The connectivity of a node is the number of its neighbors. The neighborhood
connectivity of a node n is defined as the average connectivity of all neighbors of n. The
neighborhood connectivity distribution gives the average of the neighborhood
connectivities of all nodes n with k neighbors for k = 0,1,…. Figure 2.6 shows a simple
network and the relative neighborhood connectivity distribution. In analogy to the in-
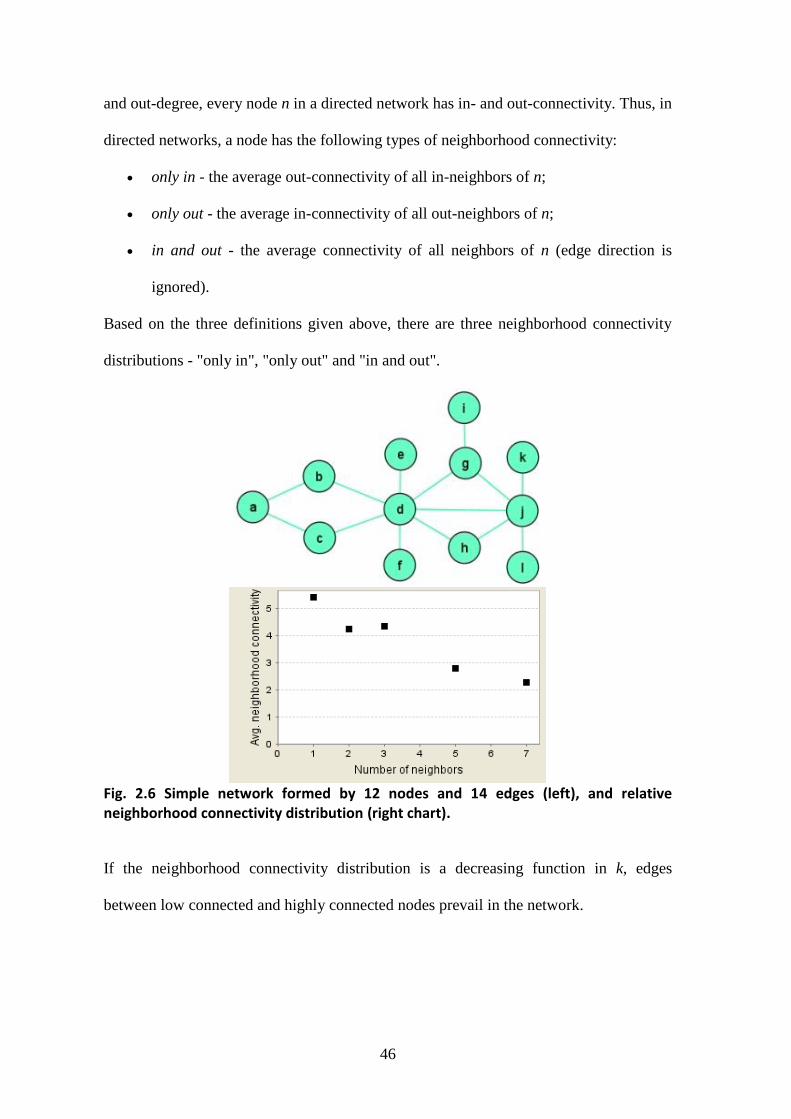
46
and out-degree, every node n in a directed network has in- and out-connectivity. Thus, in
directed networks, a node has the following types of neighborhood connectivity:
only in - the average out-connectivity of all in-neighbors of n;
only out - the average in-connectivity of all out-neighbors of n;
in and out - the average connectivity of all neighbors of n (edge direction is
ignored).
Based on the three definitions given above, there are three neighborhood connectivity
distributions - "only in", "only out" and "in and out".
Fig. 2.6 Simple network formed by 12 nodes and 14 edges (left), and relative neighborhood connectivity distribution (right chart).
If the neighborhood connectivity distribution is a decreasing function in k, edges
between low connected and highly connected nodes prevail in the network.
47
Shortest paths
The length of the shortest path between two nodes n and m is L(n,m). The shortest path
length distribution gives the number of node pairs (n,m) with L(n,m) = k for k = 1,2,….
The network diameter is the maximum length of shortest paths between two nodes. If a
network is disconnected, its diameter is the maximum of all diameters of its connected
components.
The network diameter and the shortest path length distribution may indicate small-world
properties of the analyzed network.
Clustering coefficients
A clustering coefficient is a measure of degree to which nodes in a graph tend to cluster
together. In undirected networks, the clustering coefficient Cn of a node n is defined as
Cn = 2en/(kn(kn-1)), where kn is the number of neighbors of n and en is the number of
connected pairs between all neighbors of n. In directed networks, the definition is
slightly different: Cn = en/(kn(kn-1)).
In both cases, the clustering coefficient is a ratio N / M, where N is the number of edges
between the neighbors of n, and M is the maximum number of edges that could possibly
exist between the neighbors of n. The clustering coefficient of a node is always a
number between 0 and 1.
The average clustering coefficient distribution gives the average of the clustering
coefficients for all nodes n with k neighbors for k = 2,….
The clustering coefficient of a node is the number of triangles (3-loops) that pass
through this node, relative to the maximum number of 3-loops that could pass through
the node.
48
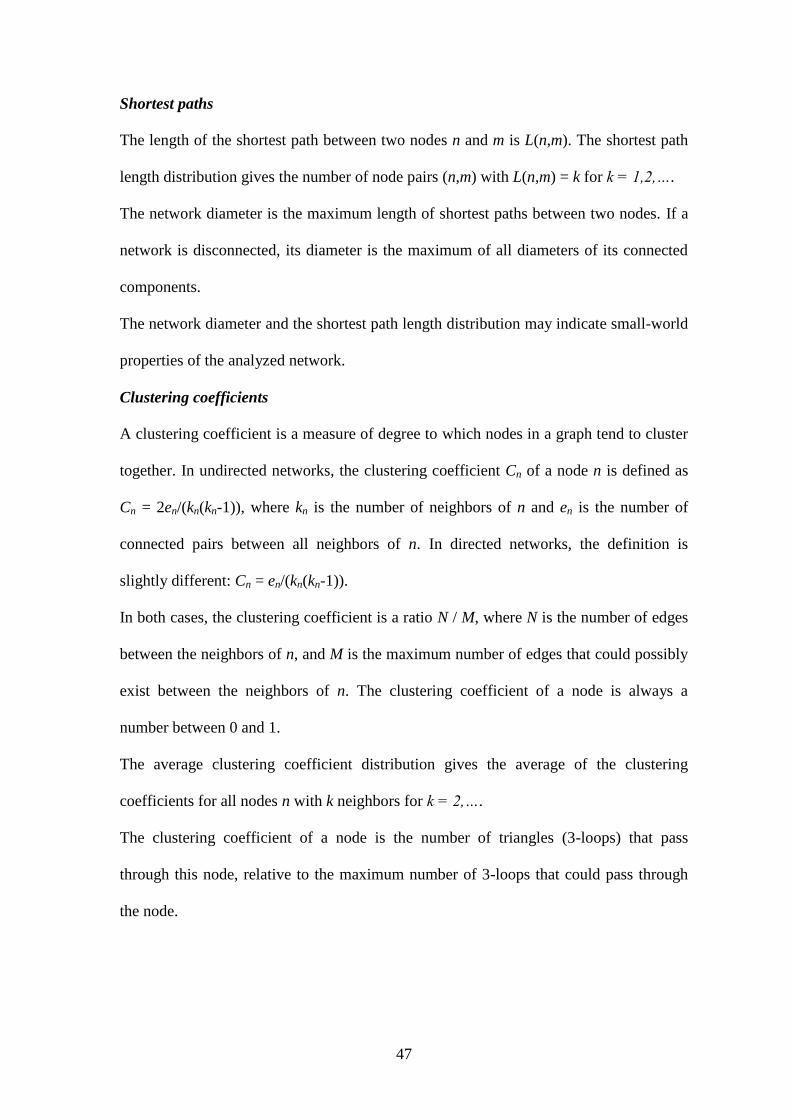
Figure 2.7 Example network with four nodes and four edges (see text).
For example, in Figure 2.7, there is one triangle that passes through node b (the triangle
bcd). The maximum number of triangles that could pass through b is three (in this case,
the pairs (a, c) and (a, d) would be connected additionally). This yields a clustering
coefficient of Cb = 1 / 3.
The average clustering coefficient distribution may be used to identify a modular
organization of metabolic networks (Ravasz 2002).
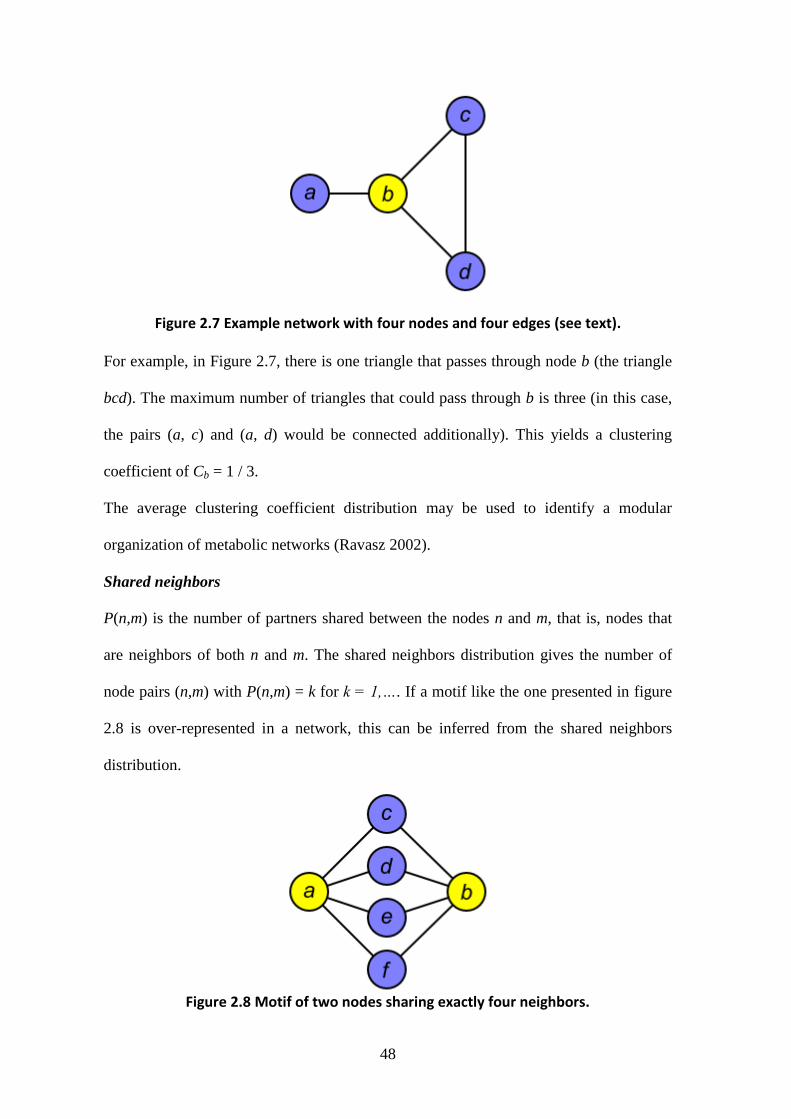
Shared neighbors
P(n,m) is the number of partners shared between the nodes n and m, that is, nodes that
are neighbors of both n and m. The shared neighbors distribution gives the number of
node pairs (n,m) with P(n,m) = k for k = 1,…. If a motif like the one presented in figure
2.8 is over-represented in a network, this can be inferred from the shared neighbors
distribution.
Figure 2.8 Motif of two nodes sharing exactly four neighbors.
49
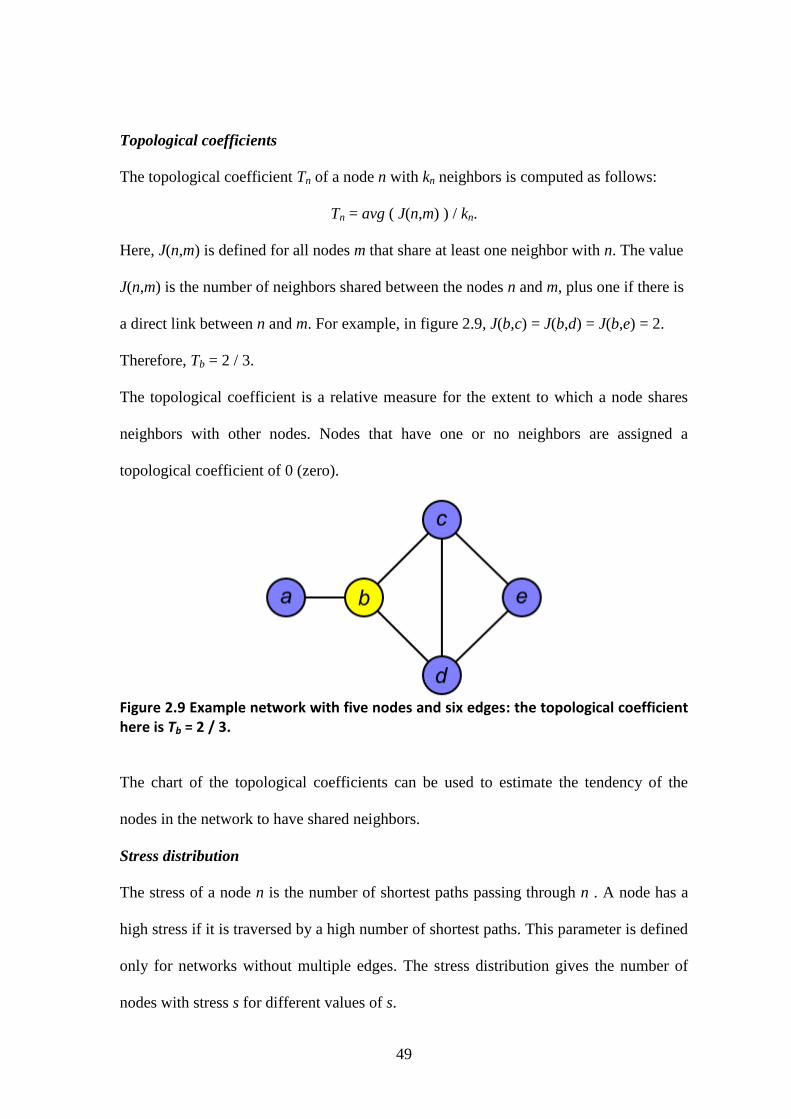
Topological coefficients
The topological coefficient Tn of a node n with kn neighbors is computed as follows:
Tn = avg ( J(n,m) ) / kn.
Here, J(n,m) is defined for all nodes m that share at least one neighbor with n. The value
J(n,m) is the number of neighbors shared between the nodes n and m, plus one if there is
a direct link between n and m. For example, in figure 2.9, J(b,c) = J(b,d) = J(b,e) = 2.
Therefore, Tb = 2 / 3.
The topological coefficient is a relative measure for the extent to which a node shares
neighbors with other nodes. Nodes that have one or no neighbors are assigned a
topological coefficient of 0 (zero).
Figure 2.9 Example network with five nodes and six edges: the topological coefficient here is Tb = 2 / 3.
The chart of the topological coefficients can be used to estimate the tendency of the
nodes in the network to have shared neighbors.
Stress distribution
The stress of a node n is the number of shortest paths passing through n . A node has a
high stress if it is traversed by a high number of shortest paths. This parameter is defined
only for networks without multiple edges. The stress distribution gives the number of
nodes with stress s for different values of s.
50
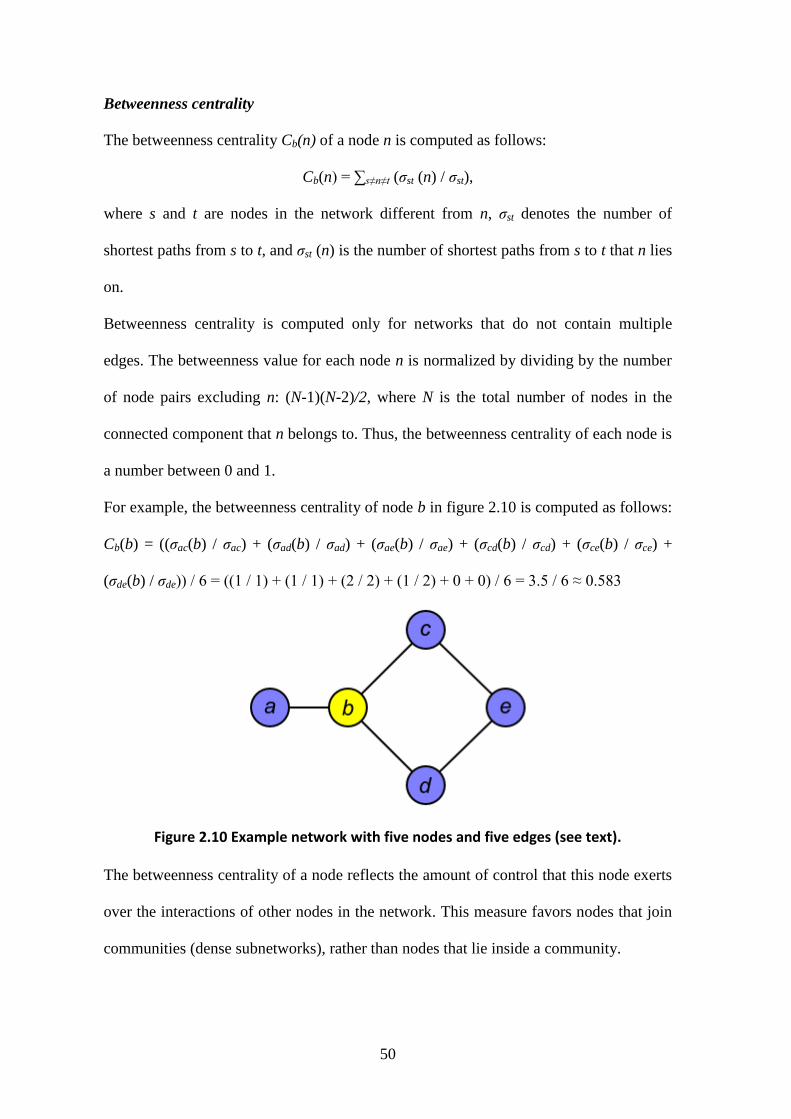
Betweenness centrality
The betweenness centrality Cb(n) of a node n is computed as follows:
Cb(n) = ∑s≠n≠t (σst (n) / σst),
where s and t are nodes in the network different from n, σst denotes the number of
shortest paths from s to t, and σst (n) is the number of shortest paths from s to t that n lies
on.
Betweenness centrality is computed only for networks that do not contain multiple
edges. The betweenness value for each node n is normalized by dividing by the number
of node pairs excluding n: (N-1)(N-2)/2, where N is the total number of nodes in the
connected component that n belongs to. Thus, the betweenness centrality of each node is
a number between 0 and 1.
For example, the betweenness centrality of node b in figure 2.10 is computed as follows:
Cb(b) = ((σac(b) / σac) + (σad(b) / σad) + (σae(b) / σae) + (σcd(b) / σcd) + (σce(b) / σce) +
(σde(b) / σde)) / 6 = ((1 / 1) + (1 / 1) + (2 / 2) + (1 / 2) + 0 + 0) / 6 = 3.5 / 6 ≈ 0.583
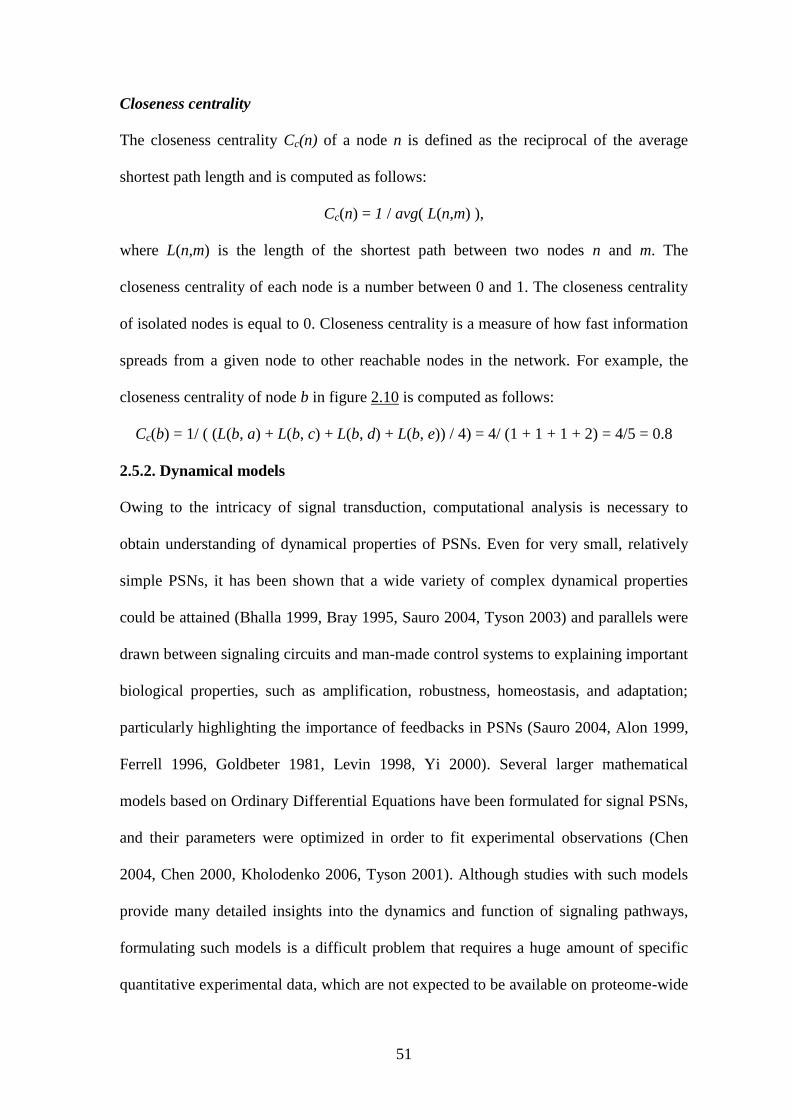
Figure 2.10 Example network with five nodes and five edges (see text).
The betweenness centrality of a node reflects the amount of control that this node exerts
over the interactions of other nodes in the network. This measure favors nodes that join
communities (dense subnetworks), rather than nodes that lie inside a community.
51
Closeness centrality
The closeness centrality Cc(n) of a node n is defined as the reciprocal of the average
shortest path length and is computed as follows:
Cc(n) = 1 / avg( L(n,m) ),
where L(n,m) is the length of the shortest path between two nodes n and m. The
closeness centrality of each node is a number between 0 and 1. The closeness centrality
of isolated nodes is equal to 0. Closeness centrality is a measure of how fast information
spreads from a given node to other reachable nodes in the network. For example, the
closeness centrality of node b in figure 2.10 is computed as follows:
Cc(b) = 1/ ( (L(b, a) + L(b, c) + L(b, d) + L(b, e)) / 4) = 4/ (1 + 1 + 1 + 2) = 4/5 = 0.8
2.5.2. Dynamical models
Owing to the intricacy of signal transduction, computational analysis is necessary to
obtain understanding of dynamical properties of PSNs. Even for very small, relatively
simple PSNs, it has been shown that a wide variety of complex dynamical properties
could be attained (Bhalla 1999, Bray 1995, Sauro 2004, Tyson 2003) and parallels were
drawn between signaling circuits and man-made control systems to explaining important
biological properties, such as amplification, robustness, homeostasis, and adaptation;
particularly highlighting the importance of feedbacks in PSNs (Sauro 2004, Alon 1999,
Ferrell 1996, Goldbeter 1981, Levin 1998, Yi 2000). Several larger mathematical
models based on Ordinary Differential Equations have been formulated for signal PSNs,
and their parameters were optimized in order to fit experimental observations (Chen
2004, Chen 2000, Kholodenko 2006, Tyson 2001). Although studies with such models
provide many detailed insights into the dynamics and function of signaling pathways,
formulating such models is a difficult problem that requires a huge amount of specific
quantitative experimental data, which are not expected to be available on proteome-wide
52
scale in the near future. Dynamical models of proteome-wide PSNs, although lacking
precise quantitative information of the kinetic dependencies, can still be used to discover
principles of global dynamical organization. For example, a qualitative approach to the
dynamic modeling of PSNs is the use of Boolean logic, in which each protein is „off‟ or
„on‟ at a given time-step depending on the states of its inputs. Recently, it was shown
that a PSN formalized with Boolean logic can classify sets of inputs into distinct output
patterns – an ability that arises through the complex wiring pattern among the proteins in
the PSNs (Helikar 2008). This ability is an emergent dynamical property determined by
the structure of the PSN, because the authors showed that randomizing the network
results in loss of this ability. Interesting metaphors have been drawn between PSNs and
computational networks (Bhalla 2003). Back in 1990, Dennis Bray highlighted the
similarity between PSNs and „artificial neural networks‟ (Bray 1990). Rather than signal
transduction as just a mechanism to transmit information from the cell surface to the
nucleus and other functions, this analogy suggests a complex process of turning complex
input signals (environments) into complex output signals (biological responses). Similar
to artificial neural networks, where the parameters are adjusted through mathematical
optimization to obtain required input-output relationships, evolution has tweaked the
parameters in PSNs to obtain the ability to generate appropriate responses to the wide
variety of complex environmental signals that organisms are subjected to (Bray 1990).
It has become clear that the proteome forms a complex system with many emergent
properties yet to be discovered and understood (Pieroni 2008, Bhalla 2003). Topological
and dynamical studies of PSNs that take explicitly the INPUT → CENTRAL
NETWORK → OUTPUT structure (Helikar 2008, Cui 2006, de la Fuente 2008, Liu
2006, Ma‟yan 2005) into account most certainly will yield many insights into the
functional organization these intricate protein networks.

53
2.6. Methods: NF-B interactome data retrieval and reconstruction
2.6.1. Workflow
The main steps of the workflow followed for the NF-B pathway interactome
reconstruction and analysis are briefly summarized here. More information can be found
in chapter 3, Results.
1. The starting point consists in the manual literature mining and review: such approach
took several months of expert work, and guarantees a quite complete list of proteins that
take part with different roles and importance to the whole signaling cascade. This basic
list has been increased, enriched and refined step by step confronting and
complementing preliminary results with data browsed and downloaded manually or with
Cytoscape from several pathway and PIN databases. The reference list is available in the
Notes section. The result at the end of this manual process is a “core list” consisting of
140 proteins. It should be noted that such list can continuously change due to new
knowledge and updates in the relative data and biological information. In the Notes
section the list of articles and reviews examined for the determination of the core
proteins list is provided.
2. Protein interactions data are added to build the first version of the “core interactome”.
The main tool used in this step is the APID database, automatically accessed through the
dedicated plugin in Cytoscape. Parameters are setup in order to consider interactions that
have been tested with one experimental method. It should be considered that it is also
possible to retrieve interaction tested with more than one experimental method, but in
this way, due to shortage of data, the percentage of false negatives is too high to be
considered reliable. Conversely, using the “one experimental method” search parameter,
it is possible to include in the interactome a acceptably low number of false positives.
54
The result is a network consisting of 140 nodes and 829 non-directional interactions,
including self-interactions.
3. By using automated retrieval tool and databases (APID2NET, BioNetBuilder in
Cytoscape, main PIN databases) a “wider interactome” is built, taking into account all
the proteins with evidence of interaction with at least one protein present in the “core
interactome”. Search parameters are set to include interactions validated with one
experimental method, as above for the core interactome. At the end of the process, the
whole “wider interactome” consists of 3146 proteins accounting for a total of more than
42600 protein-protein interactions.
4. Data elaborated from a manually curated list of NF-B-downstream genes (Gilmore
2010), from the TRED database (manually extracted) and integrated with results from
TRANSFAC allow to constitute a relatively comprehensive list of more than 400 genes
that result to be up- or down-regulated from NF-B. Gene products and relative UniProt
identifiers are obtained directly through the ID mapping functions available on the
UniProt web interface, allowing to compile the list of proteins which expression can be
regulated by NF-B.
5. The whole interactome now consisting of core proteins (those that directly participate
to signaling cascades that activate NF-B), wider interactome proteins (their direct
interactors), regulated genes and relative expressed proteins now undergoes functional
enrichment and analysis: topological characterization, GO enrichment, clustering are
performed thanks to the several standalone analysis tools, Cytoscape and web-based
services. Results from the analysis include, among others, a wider, integrated overlook
of the NF-B signaling system and its main topological characteristics, the detection of
specific hubs or central proteins, the discovery of feedback loops and cross controls
among proteins and genes that can be candidates for further in-depth studies.
55
2.6.2. Pitfalls and issues encountered
Some of the most common pitfalls in the procedure shown as well as some general
considerations on the proposed workflow and relative problems encountered are briefly
taken into account here.
One of the major concerns in pathway and PSN reconstruction is the lack of clear and
comprehensive data about reactions and subsequent directionality. Directional
information is still a rare thing. As said, the user will unlikely find that the same
pathway has been represented in similar ways on different databases. This poses the
problem of the necessity to choose one among different data models and content, or to
engage in the non trivial effort of integrating and complementing the various data and
data types. The lack of undisputable data about a number of reactions and proteins in the
NF-B interactome reconstruction and the obvious existence of time constraints forced -
at least provisionally- to omit the relative dynamical information in the obtained
representation. Without directional information it is impossible to implement dynamical
models and simulation, even a simple model based on Boolean dynamics, unless willing
to make the assumptions are made that each edge A-B corresponds to influences in both
directions, i.e. A B and B A, which is very unrealistic indeed.
Automation of procedures able to integrate different pathways in a coherent and
biological meaningful way is a critical point. Currently, there is no practical, coherent
and effective way to integrate data from multiple sources into a single object other than
manual intervention. Even if data from single pathways in the different databases are
often very close to be precise, comprehensive and satisfying to serve as a starting base, it
is the integrative process and subsequent elaboration to hopefully bring valuable
information and new knowledge. Actually, in this regard, data models and

56
representations, and annotation are key points in the discussion about these hot topics
(Ceol 2008, Leitner 2008, Gerstein 2007, Tieri 2008).
It should be finally reminded that protein-protein interactions databases frequently store
and provide PIN data without distinguish among cellular types, states and other
biologically relevant conditions. Advanced filtering on such parameters thus remains a
desirable but not often implemented query function. Commonly, pathologically relevant
states of proteins, cells and tissues are reported, even if data query cannot always be
adequately filtered and displayed. This could represents an additional hurdle for the
biologically coherent reconstruction of interactomes.
57
3 Results and discussion
_______________________________________________________________________
3.1. “Core” and “wider” NF-B pathway interactomes
Following the workflow described in the Methods section for data retrieval, we started
collecting relevant data from manual literature mining and review. This approach
guaranteed a satisfactorily complete list of proteins that take part with different roles and
importance to the whole NF-B signaling cascade, from cell receptors to regulated
genes and expressed proteins. This basic list has been increased, enriched and refined
step by step confronting and complementing preliminary, manually retrieved results
with data browsed and downloaded from several pathway and PIN databases. The result
at the end of this manual process, a “core” list consisting of 140 proteins participating in
the NF-B signaling cascade, is the first step for further information integration and
reconstruction. The list has been double checked, but –once again- it can be modified,
augmented or enhanced on the basis of the new knowledge gained in time. Protein
interactions data are added to build the first version of the “core interactome”. While, as
a second step, and by using an automated retrieval procedure instead of the manual one,
a “wider interactome” is built, taking into account all the proteins which show evidence
of interaction with at least one protein present in the “core interactome”. At the end of
the process, the whole “wider interactome” (that includes the core interactome) consists
of 3146 proteins accounting for a total of more than 42600 interactions.
The third step allows to determine the NF-B-downstream genes, providing a relatively
comprehensive list of more than 400 genes that result to be up- or down-regulated from
NF-B complexes. Gene products and relative UniProt identifiers are obtained directly
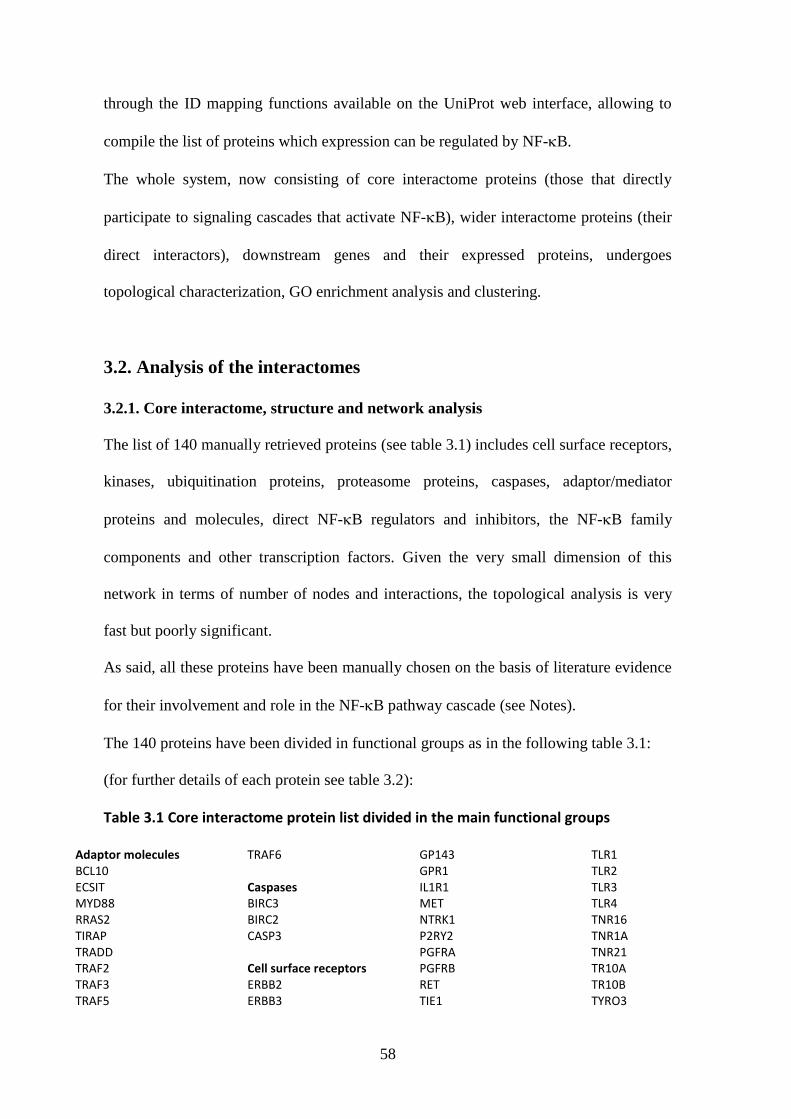
58
through the ID mapping functions available on the UniProt web interface, allowing to
compile the list of proteins which expression can be regulated by NF-B.
The whole system, now consisting of core interactome proteins (those that directly
participate to signaling cascades that activate NF-B), wider interactome proteins (their
direct interactors), downstream genes and their expressed proteins, undergoes
topological characterization, GO enrichment analysis and clustering.
3.2. Analysis of the interactomes
3.2.1. Core interactome, structure and network analysis
The list of 140 manually retrieved proteins (see table 3.1) includes cell surface receptors,
kinases, ubiquitination proteins, proteasome proteins, caspases, adaptor/mediator
proteins and molecules, direct NF-B regulators and inhibitors, the NF-B family
components and other transcription factors. Given the very small dimension of this
network in terms of number of nodes and interactions, the topological analysis is very
fast but poorly significant.
As said, all these proteins have been manually chosen on the basis of literature evidence
for their involvement and role in the NF-B pathway cascade (see Notes).
The 140 proteins have been divided in functional groups as in the following table 3.1:
(for further details of each protein see table 3.2):
Table 3.1 Core interactome protein list divided in the main functional groups
Adaptor molecules BCL10 ECSIT MYD88 RRAS2 TIRAP TRADD TRAF2 TRAF3 TRAF5
TRAF6 Caspases BIRC3 BIRC2 CASP3 Cell surface receptors ERBB2 ERBB3
GP143 GPR1 IL1R1 MET NTRK1 P2RY2 PGFRA PGFRB RET TIE1
TLR1 TLR2 TLR3 TLR4 TNR16 TNR1A TNR21 TR10A TR10B TYRO3
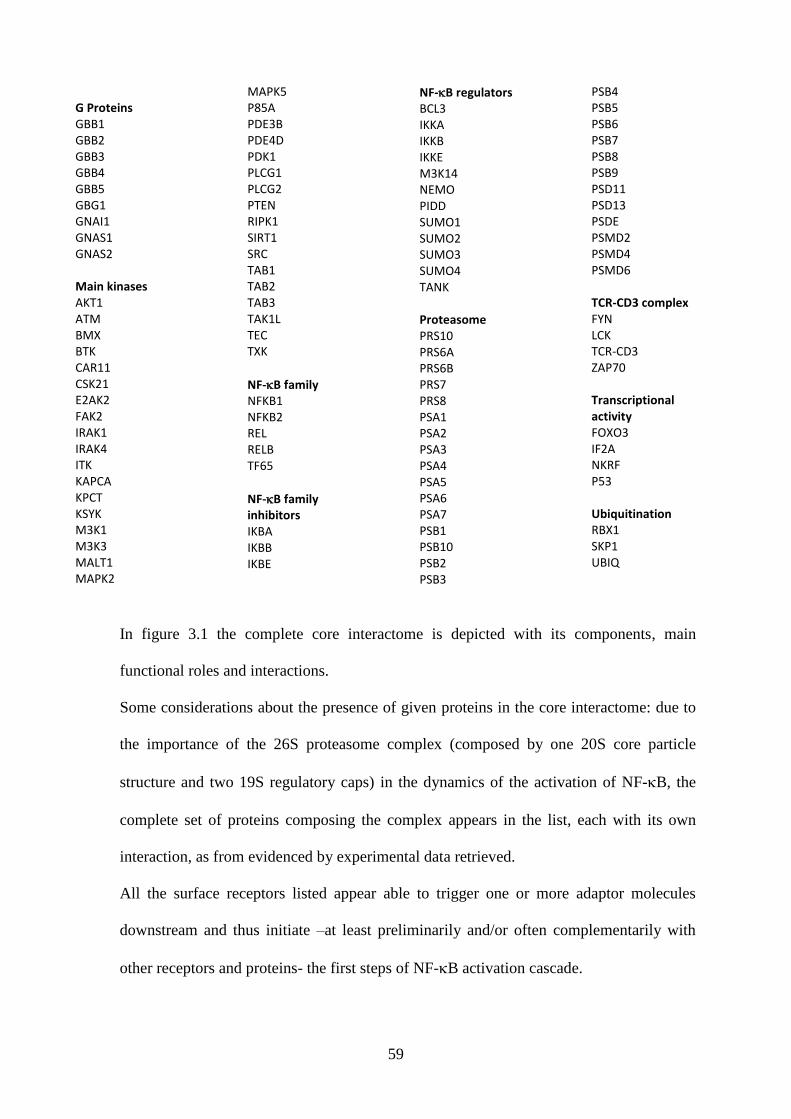
59
G Proteins GBB1 GBB2 GBB3 GBB4 GBB5 GBG1 GNAI1 GNAS1 GNAS2 Main kinases AKT1 ATM BMX BTK CAR11 CSK21 E2AK2 FAK2 IRAK1 IRAK4 ITK KAPCA KPCT KSYK M3K1 M3K3 MALT1 MAPK2
MAPK5 P85A PDE3B PDE4D PDK1 PLCG1 PLCG2 PTEN RIPK1 SIRT1 SRC TAB1 TAB2 TAB3 TAK1L TEC TXK
NF-B family NFKB1 NFKB2 REL RELB TF65
NF-B family inhibitors IKBA IKBB IKBE
NF-B regulators BCL3 IKKA IKKB IKKE M3K14 NEMO PIDD SUMO1 SUMO2 SUMO3 SUMO4 TANK Proteasome PRS10 PRS6A PRS6B PRS7 PRS8 PSA1 PSA2 PSA3 PSA4 PSA5 PSA6 PSA7 PSB1 PSB10 PSB2 PSB3
PSB4 PSB5 PSB6 PSB7 PSB8 PSB9 PSD11 PSD13 PSDE PSMD2 PSMD4 PSMD6 TCR-CD3 complex FYN LCK TCR-CD3 ZAP70 Transcriptional activity FOXO3 IF2A NKRF P53 Ubiquitination RBX1 SKP1 UBIQ
In figure 3.1 the complete core interactome is depicted with its components, main
functional roles and interactions.
Some considerations about the presence of given proteins in the core interactome: due to
the importance of the 26S proteasome complex (composed by one 20S core particle
structure and two 19S regulatory caps) in the dynamics of the activation of NF-B, the
complete set of proteins composing the complex appears in the list, each with its own
interaction, as from evidenced by experimental data retrieved.
All the surface receptors listed appear able to trigger one or more adaptor molecules
downstream and thus initiate –at least preliminarily and/or often complementarily with
other receptors and proteins- the first steps of NF-B activation cascade.
60
The TCR-CD3 complex appears as a small separate group given the very peculiar
dynamics of this kind of receptor.
G proteins, short for guanine nucleotide-binding proteins, are a family of proteins
involved in second messenger cascades. G proteins function as “molecular switches”,
alternating from 'inactive' guanosine diphosphate (GDP) to 'active' guanosine triphosphate
(GTP), which is a binding state, and which proceeds to regulate downstream cell
processes. G proteins are important signal transducing molecules in cells. There are
evidences that diseases such as diabetes, blindness, allergies, depression, cardiovascular
defects and certain forms of cancer, among other pathologies, arise due to derangement of
G protein signaling. The human genomes encodes roughly 350 G protein-coupled
receptors (GPCRs), which can detect photons (light), hormones, growth factors, drugs,
and other endogenous ligands. Up to now, approximately 150 of the GPCRs found in the
human genome have unknown functions.
In conclusion, the presence of the proteins in the list is justified by the evidence of a
relevant direct role in the integrative dynamics of NF-B activation, or otherwise by their
evident capability of interaction with one or more proteins of the pathway, thus qualifying
them as having a likely relevant role.

61
Fig. 3.1 Integral view of the NF-B pathway core interactome consisting of 140 proteins. Proteins are grouped following 12 main functional roles (see Table 3.1 and 3.2 for a detailed description of the proteins present).
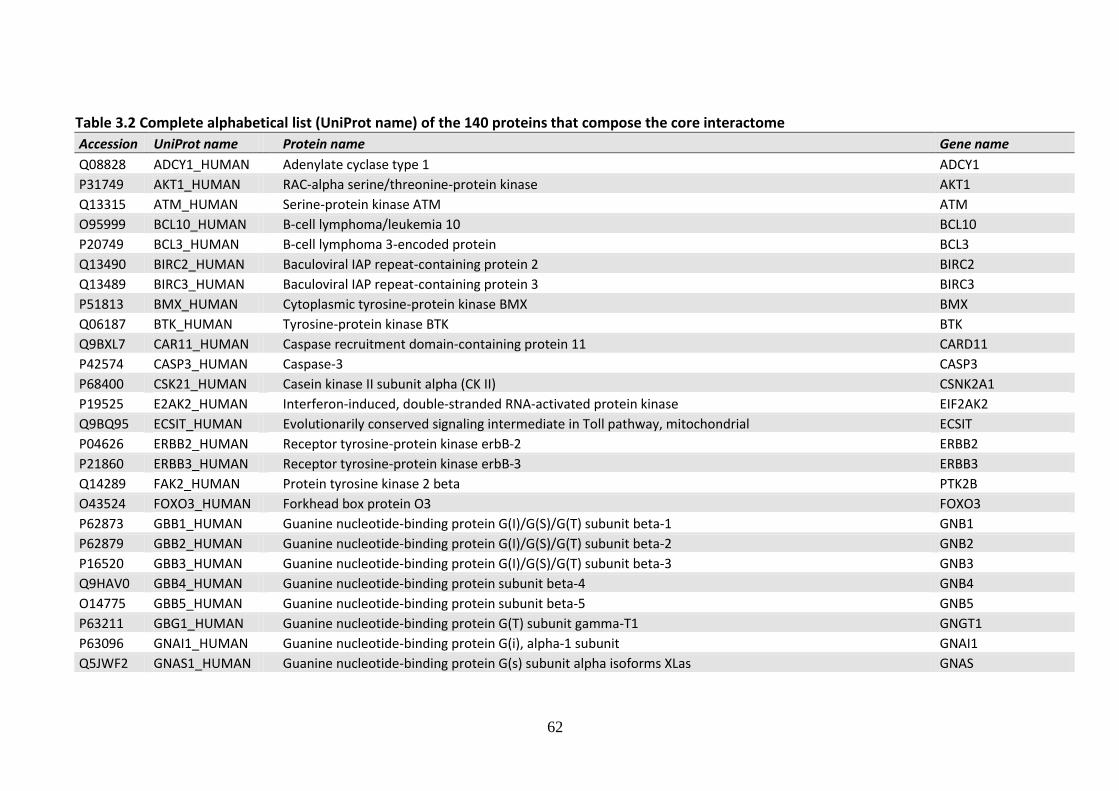
62
Table 3.2 Complete alphabetical list (UniProt name) of the 140 proteins that compose the core interactome
Accession UniProt name Protein name Gene name
Q08828 ADCY1_HUMAN Adenylate cyclase type 1 ADCY1
P31749 AKT1_HUMAN RAC-alpha serine/threonine-protein kinase AKT1
Q13315 ATM_HUMAN Serine-protein kinase ATM ATM
O95999 BCL10_HUMAN B-cell lymphoma/leukemia 10 BCL10
P20749 BCL3_HUMAN B-cell lymphoma 3-encoded protein BCL3
Q13490 BIRC2_HUMAN Baculoviral IAP repeat-containing protein 2 BIRC2
Q13489 BIRC3_HUMAN Baculoviral IAP repeat-containing protein 3 BIRC3
P51813 BMX_HUMAN Cytoplasmic tyrosine-protein kinase BMX BMX
Q06187 BTK_HUMAN Tyrosine-protein kinase BTK BTK
Q9BXL7 CAR11_HUMAN Caspase recruitment domain-containing protein 11 CARD11
P42574 CASP3_HUMAN Caspase-3 CASP3
P68400 CSK21_HUMAN Casein kinase II subunit alpha (CK II) CSNK2A1
P19525 E2AK2_HUMAN Interferon-induced, double-stranded RNA-activated protein kinase EIF2AK2
Q9BQ95 ECSIT_HUMAN Evolutionarily conserved signaling intermediate in Toll pathway, mitochondrial ECSIT
P04626 ERBB2_HUMAN Receptor tyrosine-protein kinase erbB-2 ERBB2
P21860 ERBB3_HUMAN Receptor tyrosine-protein kinase erbB-3 ERBB3
Q14289 FAK2_HUMAN Protein tyrosine kinase 2 beta PTK2B
O43524 FOXO3_HUMAN Forkhead box protein O3 FOXO3
P62873 GBB1_HUMAN Guanine nucleotide-binding protein G(I)/G(S)/G(T) subunit beta-1 GNB1
P62879 GBB2_HUMAN Guanine nucleotide-binding protein G(I)/G(S)/G(T) subunit beta-2 GNB2
P16520 GBB3_HUMAN Guanine nucleotide-binding protein G(I)/G(S)/G(T) subunit beta-3 GNB3
Q9HAV0 GBB4_HUMAN Guanine nucleotide-binding protein subunit beta-4 GNB4
O14775 GBB5_HUMAN Guanine nucleotide-binding protein subunit beta-5 GNB5
P63211 GBG1_HUMAN Guanine nucleotide-binding protein G(T) subunit gamma-T1 GNGT1
P63096 GNAI1_HUMAN Guanine nucleotide-binding protein G(i), alpha-1 subunit GNAI1
Q5JWF2 GNAS1_HUMAN Guanine nucleotide-binding protein G(s) subunit alpha isoforms XLas GNAS
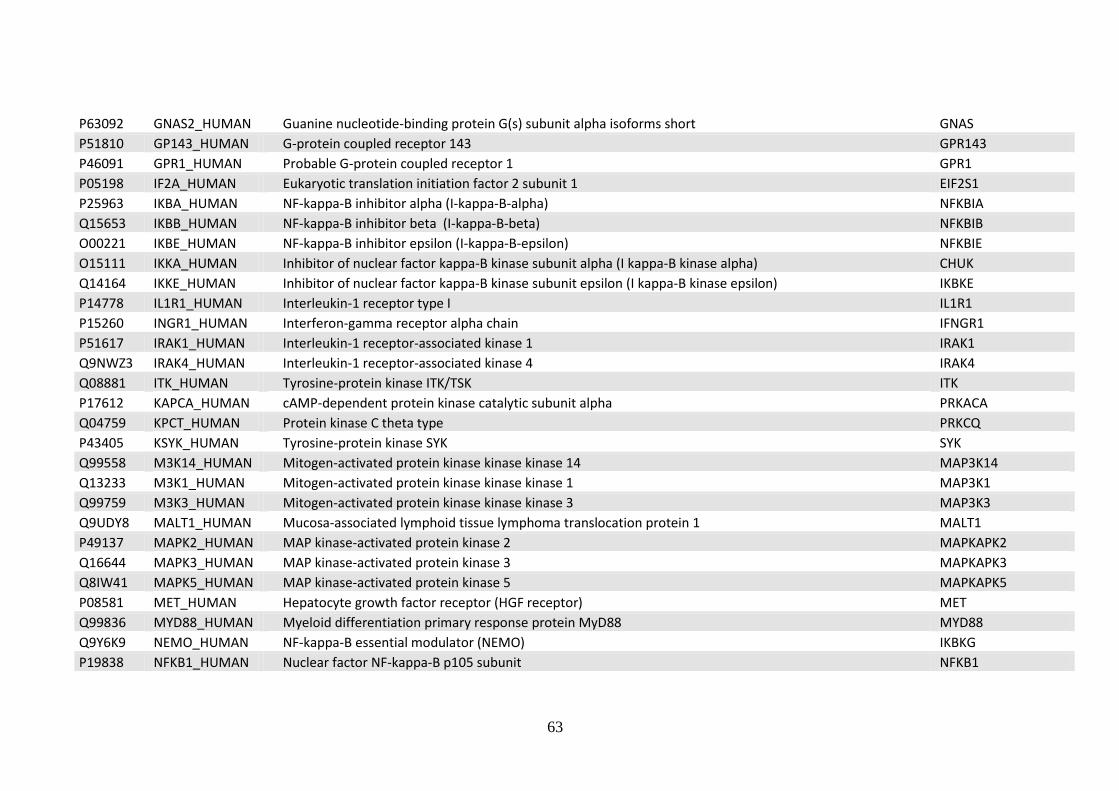
63
P63092 GNAS2_HUMAN Guanine nucleotide-binding protein G(s) subunit alpha isoforms short GNAS
P51810 GP143_HUMAN G-protein coupled receptor 143 GPR143
P46091 GPR1_HUMAN Probable G-protein coupled receptor 1 GPR1
P05198 IF2A_HUMAN Eukaryotic translation initiation factor 2 subunit 1 EIF2S1
P25963 IKBA_HUMAN NF-kappa-B inhibitor alpha (I-kappa-B-alpha) NFKBIA
Q15653 IKBB_HUMAN NF-kappa-B inhibitor beta (I-kappa-B-beta) NFKBIB
O00221 IKBE_HUMAN NF-kappa-B inhibitor epsilon (I-kappa-B-epsilon) NFKBIE
O15111 IKKA_HUMAN Inhibitor of nuclear factor kappa-B kinase subunit alpha (I kappa-B kinase alpha) CHUK
Q14164 IKKE_HUMAN Inhibitor of nuclear factor kappa-B kinase subunit epsilon (I kappa-B kinase epsilon) IKBKE
P14778 IL1R1_HUMAN Interleukin-1 receptor type I IL1R1
P15260 INGR1_HUMAN Interferon-gamma receptor alpha chain IFNGR1
P51617 IRAK1_HUMAN Interleukin-1 receptor-associated kinase 1 IRAK1
Q9NWZ3 IRAK4_HUMAN Interleukin-1 receptor-associated kinase 4 IRAK4
Q08881 ITK_HUMAN Tyrosine-protein kinase ITK/TSK ITK
P17612 KAPCA_HUMAN cAMP-dependent protein kinase catalytic subunit alpha PRKACA
Q04759 KPCT_HUMAN Protein kinase C theta type PRKCQ
P43405 KSYK_HUMAN Tyrosine-protein kinase SYK SYK
Q99558 M3K14_HUMAN Mitogen-activated protein kinase kinase kinase 14 MAP3K14
Q13233 M3K1_HUMAN Mitogen-activated protein kinase kinase kinase 1 MAP3K1
Q99759 M3K3_HUMAN Mitogen-activated protein kinase kinase kinase 3 MAP3K3
Q9UDY8 MALT1_HUMAN Mucosa-associated lymphoid tissue lymphoma translocation protein 1 MALT1
P49137 MAPK2_HUMAN MAP kinase-activated protein kinase 2 MAPKAPK2
Q16644 MAPK3_HUMAN MAP kinase-activated protein kinase 3 MAPKAPK3
Q8IW41 MAPK5_HUMAN MAP kinase-activated protein kinase 5 MAPKAPK5
P08581 MET_HUMAN Hepatocyte growth factor receptor (HGF receptor) MET
Q99836 MYD88_HUMAN Myeloid differentiation primary response protein MyD88 MYD88
Q9Y6K9 NEMO_HUMAN NF-kappa-B essential modulator (NEMO) IKBKG
P19838 NFKB1_HUMAN Nuclear factor NF-kappa-B p105 subunit NFKB1
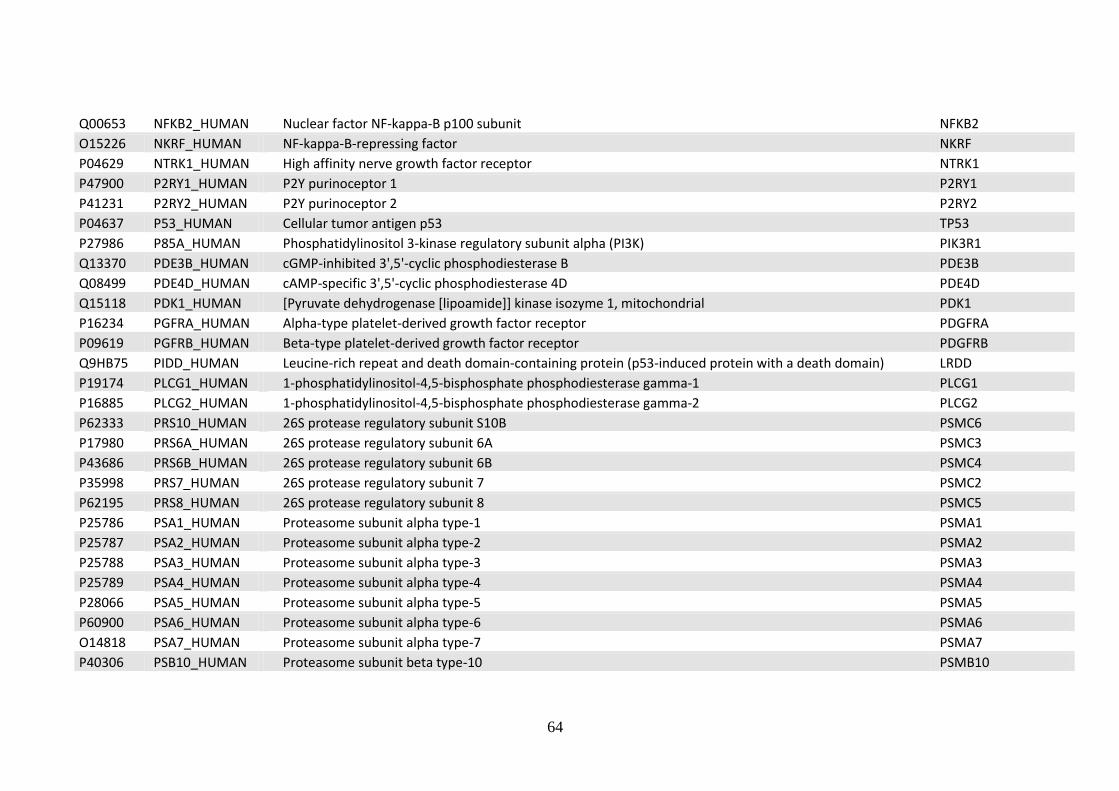
64
Q00653 NFKB2_HUMAN Nuclear factor NF-kappa-B p100 subunit NFKB2
O15226 NKRF_HUMAN NF-kappa-B-repressing factor NKRF
P04629 NTRK1_HUMAN High affinity nerve growth factor receptor NTRK1
P47900 P2RY1_HUMAN P2Y purinoceptor 1 P2RY1
P41231 P2RY2_HUMAN P2Y purinoceptor 2 P2RY2
P04637 P53_HUMAN Cellular tumor antigen p53 TP53
P27986 P85A_HUMAN Phosphatidylinositol 3-kinase regulatory subunit alpha (PI3K) PIK3R1
Q13370 PDE3B_HUMAN cGMP-inhibited 3',5'-cyclic phosphodiesterase B PDE3B
Q08499 PDE4D_HUMAN cAMP-specific 3',5'-cyclic phosphodiesterase 4D PDE4D
Q15118 PDK1_HUMAN [Pyruvate dehydrogenase [lipoamide]] kinase isozyme 1, mitochondrial PDK1
P16234 PGFRA_HUMAN Alpha-type platelet-derived growth factor receptor PDGFRA
P09619 PGFRB_HUMAN Beta-type platelet-derived growth factor receptor PDGFRB
Q9HB75 PIDD_HUMAN Leucine-rich repeat and death domain-containing protein (p53-induced protein with a death domain) LRDD
P19174 PLCG1_HUMAN 1-phosphatidylinositol-4,5-bisphosphate phosphodiesterase gamma-1 PLCG1
P16885 PLCG2_HUMAN 1-phosphatidylinositol-4,5-bisphosphate phosphodiesterase gamma-2 PLCG2
P62333 PRS10_HUMAN 26S protease regulatory subunit S10B PSMC6
P17980 PRS6A_HUMAN 26S protease regulatory subunit 6A PSMC3
P43686 PRS6B_HUMAN 26S protease regulatory subunit 6B PSMC4
P35998 PRS7_HUMAN 26S protease regulatory subunit 7 PSMC2
P62195 PRS8_HUMAN 26S protease regulatory subunit 8 PSMC5
P25786 PSA1_HUMAN Proteasome subunit alpha type-1 PSMA1
P25787 PSA2_HUMAN Proteasome subunit alpha type-2 PSMA2
P25788 PSA3_HUMAN Proteasome subunit alpha type-3 PSMA3
P25789 PSA4_HUMAN Proteasome subunit alpha type-4 PSMA4
P28066 PSA5_HUMAN Proteasome subunit alpha type-5 PSMA5
P60900 PSA6_HUMAN Proteasome subunit alpha type-6 PSMA6
O14818 PSA7_HUMAN Proteasome subunit alpha type-7 PSMA7
P40306 PSB10_HUMAN Proteasome subunit beta type-10 PSMB10
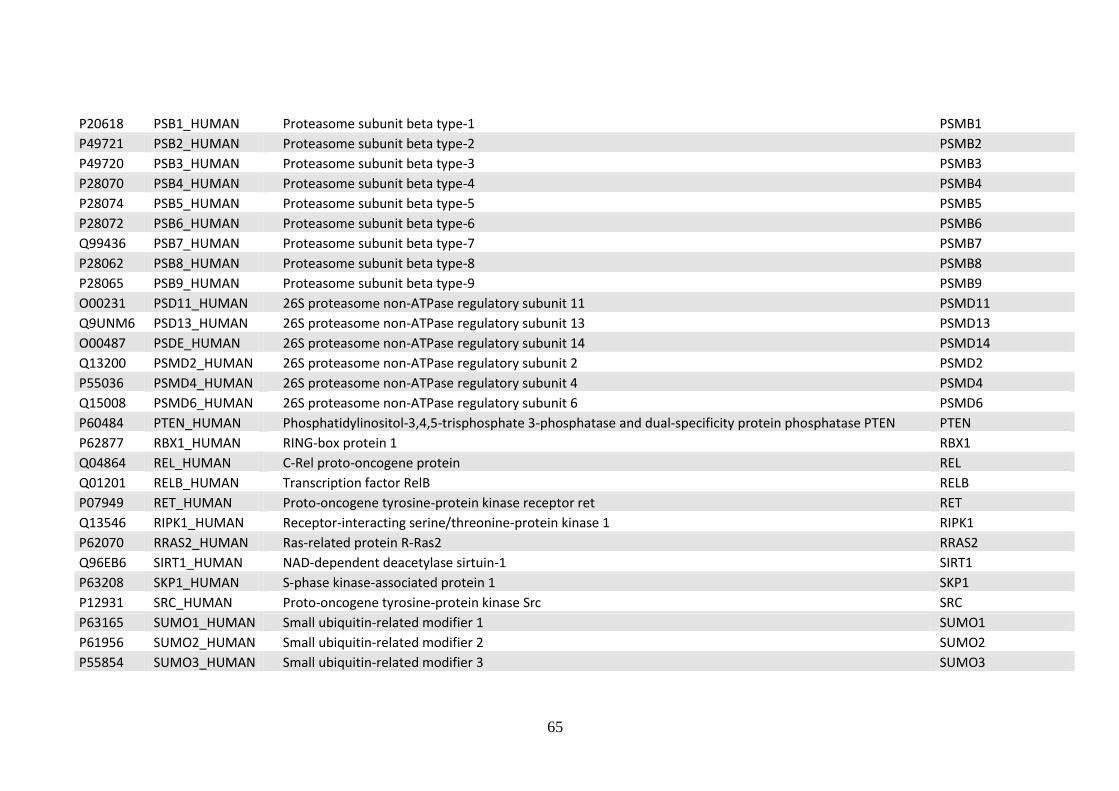
65
P20618 PSB1_HUMAN Proteasome subunit beta type-1 PSMB1
P49721 PSB2_HUMAN Proteasome subunit beta type-2 PSMB2
P49720 PSB3_HUMAN Proteasome subunit beta type-3 PSMB3
P28070 PSB4_HUMAN Proteasome subunit beta type-4 PSMB4
P28074 PSB5_HUMAN Proteasome subunit beta type-5 PSMB5
P28072 PSB6_HUMAN Proteasome subunit beta type-6 PSMB6
Q99436 PSB7_HUMAN Proteasome subunit beta type-7 PSMB7
P28062 PSB8_HUMAN Proteasome subunit beta type-8 PSMB8
P28065 PSB9_HUMAN Proteasome subunit beta type-9 PSMB9
O00231 PSD11_HUMAN 26S proteasome non-ATPase regulatory subunit 11 PSMD11
Q9UNM6 PSD13_HUMAN 26S proteasome non-ATPase regulatory subunit 13 PSMD13
O00487 PSDE_HUMAN 26S proteasome non-ATPase regulatory subunit 14 PSMD14
Q13200 PSMD2_HUMAN 26S proteasome non-ATPase regulatory subunit 2 PSMD2
P55036 PSMD4_HUMAN 26S proteasome non-ATPase regulatory subunit 4 PSMD4
Q15008 PSMD6_HUMAN 26S proteasome non-ATPase regulatory subunit 6 PSMD6
P60484 PTEN_HUMAN Phosphatidylinositol-3,4,5-trisphosphate 3-phosphatase and dual-specificity protein phosphatase PTEN PTEN
P62877 RBX1_HUMAN RING-box protein 1 RBX1
Q04864 REL_HUMAN C-Rel proto-oncogene protein REL
Q01201 RELB_HUMAN Transcription factor RelB RELB
P07949 RET_HUMAN Proto-oncogene tyrosine-protein kinase receptor ret RET
Q13546 RIPK1_HUMAN Receptor-interacting serine/threonine-protein kinase 1 RIPK1
P62070 RRAS2_HUMAN Ras-related protein R-Ras2 RRAS2
Q96EB6 SIRT1_HUMAN NAD-dependent deacetylase sirtuin-1 SIRT1
P63208 SKP1_HUMAN S-phase kinase-associated protein 1 SKP1
P12931 SRC_HUMAN Proto-oncogene tyrosine-protein kinase Src SRC
P63165 SUMO1_HUMAN Small ubiquitin-related modifier 1 SUMO1
P61956 SUMO2_HUMAN Small ubiquitin-related modifier 2 SUMO2
P55854 SUMO3_HUMAN Small ubiquitin-related modifier 3 SUMO3
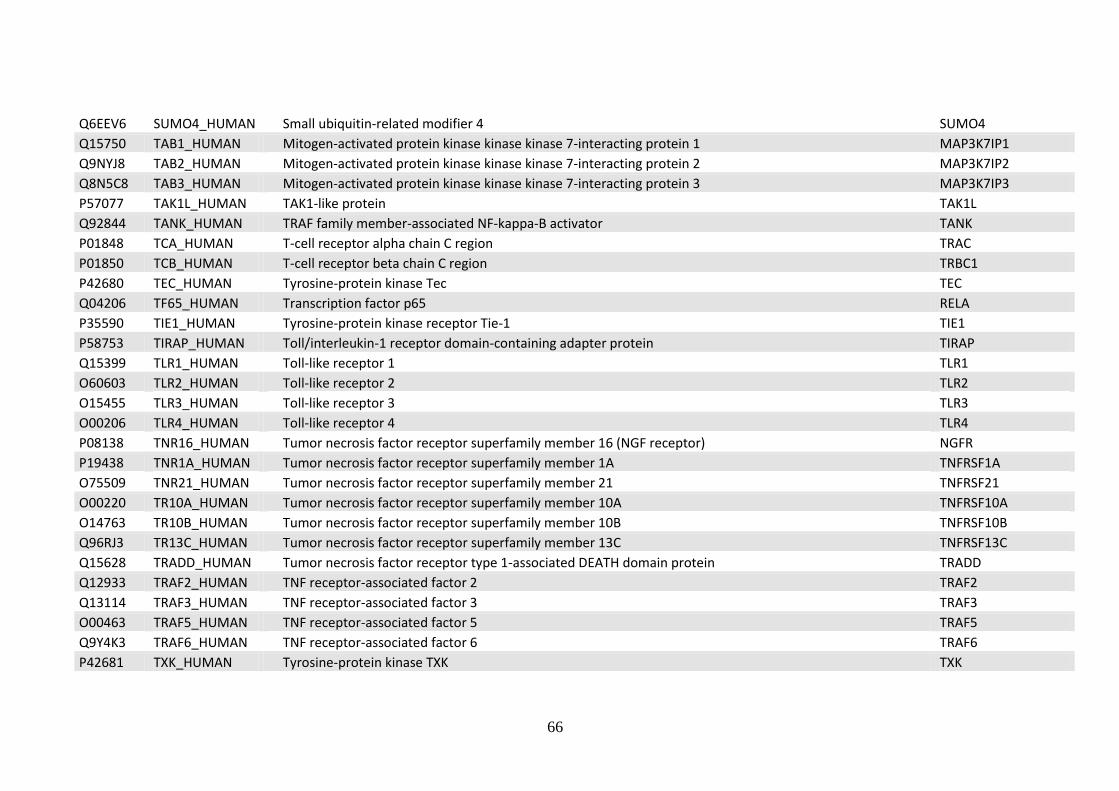
66
Q6EEV6 SUMO4_HUMAN Small ubiquitin-related modifier 4 SUMO4
Q15750 TAB1_HUMAN Mitogen-activated protein kinase kinase kinase 7-interacting protein 1 MAP3K7IP1
Q9NYJ8 TAB2_HUMAN Mitogen-activated protein kinase kinase kinase 7-interacting protein 2 MAP3K7IP2
Q8N5C8 TAB3_HUMAN Mitogen-activated protein kinase kinase kinase 7-interacting protein 3 MAP3K7IP3
P57077 TAK1L_HUMAN TAK1-like protein TAK1L
Q92844 TANK_HUMAN TRAF family member-associated NF-kappa-B activator TANK
P01848 TCA_HUMAN T-cell receptor alpha chain C region TRAC
P01850 TCB_HUMAN T-cell receptor beta chain C region TRBC1
P42680 TEC_HUMAN Tyrosine-protein kinase Tec TEC
Q04206 TF65_HUMAN Transcription factor p65 RELA
P35590 TIE1_HUMAN Tyrosine-protein kinase receptor Tie-1 TIE1
P58753 TIRAP_HUMAN Toll/interleukin-1 receptor domain-containing adapter protein TIRAP
Q15399 TLR1_HUMAN Toll-like receptor 1 TLR1
O60603 TLR2_HUMAN Toll-like receptor 2 TLR2
O15455 TLR3_HUMAN Toll-like receptor 3 TLR3
O00206 TLR4_HUMAN Toll-like receptor 4 TLR4
P08138 TNR16_HUMAN Tumor necrosis factor receptor superfamily member 16 (NGF receptor) NGFR
P19438 TNR1A_HUMAN Tumor necrosis factor receptor superfamily member 1A TNFRSF1A
O75509 TNR21_HUMAN Tumor necrosis factor receptor superfamily member 21 TNFRSF21
O00220 TR10A_HUMAN Tumor necrosis factor receptor superfamily member 10A TNFRSF10A
O14763 TR10B_HUMAN Tumor necrosis factor receptor superfamily member 10B TNFRSF10B
Q96RJ3 TR13C_HUMAN Tumor necrosis factor receptor superfamily member 13C TNFRSF13C
Q15628 TRADD_HUMAN Tumor necrosis factor receptor type 1-associated DEATH domain protein TRADD
Q12933 TRAF2_HUMAN TNF receptor-associated factor 2 TRAF2
Q13114 TRAF3_HUMAN TNF receptor-associated factor 3 TRAF3
O00463 TRAF5_HUMAN TNF receptor-associated factor 5 TRAF5
Q9Y4K3 TRAF6_HUMAN TNF receptor-associated factor 6 TRAF6
P42681 TXK_HUMAN Tyrosine-protein kinase TXK TXK
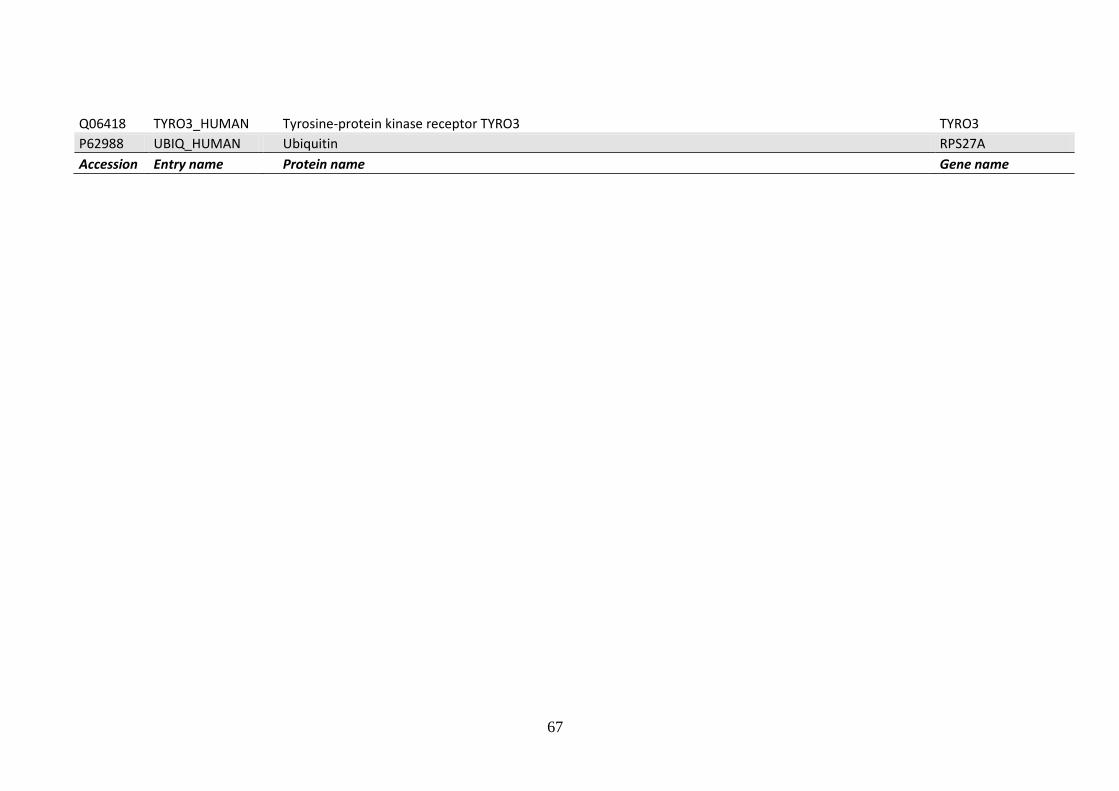
67
Q06418 TYRO3_HUMAN Tyrosine-protein kinase receptor TYRO3 TYRO3
P62988 UBIQ_HUMAN Ubiquitin RPS27A
Accession Entry name Protein name Gene name
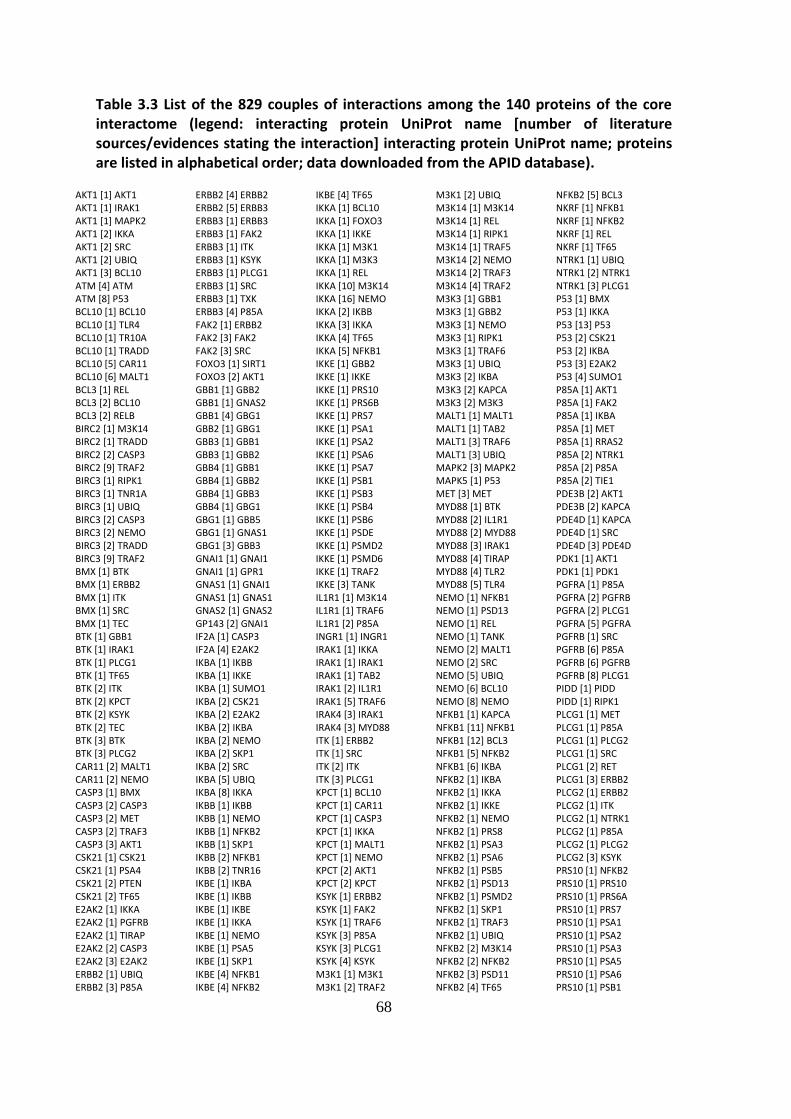
68
Table 3.3 List of the 829 couples of interactions among the 140 proteins of the core interactome (legend: interacting protein UniProt name [number of literature sources/evidences stating the interaction] interacting protein UniProt name; proteins are listed in alphabetical order; data downloaded from the APID database).
AKT1 [1] AKT1 AKT1 [1] IRAK1 AKT1 [1] MAPK2 AKT1 [2] IKKA AKT1 [2] SRC AKT1 [2] UBIQ AKT1 [3] BCL10 ATM [4] ATM ATM [8] P53 BCL10 [1] BCL10 BCL10 [1] TLR4 BCL10 [1] TR10A BCL10 [1] TRADD BCL10 [5] CAR11 BCL10 [6] MALT1 BCL3 [1] REL BCL3 [2] BCL10 BCL3 [2] RELB BIRC2 [1] M3K14 BIRC2 [1] TRADD BIRC2 [2] CASP3 BIRC2 [9] TRAF2 BIRC3 [1] RIPK1 BIRC3 [1] TNR1A BIRC3 [1] UBIQ BIRC3 [2] CASP3 BIRC3 [2] NEMO BIRC3 [2] TRADD BIRC3 [9] TRAF2 BMX [1] BTK BMX [1] ERBB2 BMX [1] ITK BMX [1] SRC BMX [1] TEC BTK [1] GBB1 BTK [1] IRAK1 BTK [1] PLCG1 BTK [1] TF65 BTK [2] ITK BTK [2] KPCT BTK [2] KSYK BTK [2] TEC BTK [3] BTK BTK [3] PLCG2 CAR11 [2] MALT1 CAR11 [2] NEMO CASP3 [1] BMX CASP3 [2] CASP3 CASP3 [2] MET CASP3 [2] TRAF3 CASP3 [3] AKT1 CSK21 [1] CSK21 CSK21 [1] PSA4 CSK21 [2] PTEN CSK21 [2] TF65 E2AK2 [1] IKKA E2AK2 [1] PGFRB E2AK2 [1] TIRAP E2AK2 [2] CASP3 E2AK2 [3] E2AK2 ERBB2 [1] UBIQ ERBB2 [3] P85A
ERBB2 [4] ERBB2 ERBB2 [5] ERBB3 ERBB3 [1] ERBB3 ERBB3 [1] FAK2 ERBB3 [1] ITK ERBB3 [1] KSYK ERBB3 [1] PLCG1 ERBB3 [1] SRC ERBB3 [1] TXK ERBB3 [4] P85A FAK2 [1] ERBB2 FAK2 [3] FAK2 FAK2 [3] SRC FOXO3 [1] SIRT1 FOXO3 [2] AKT1 GBB1 [1] GBB2 GBB1 [1] GNAS2 GBB1 [4] GBG1 GBB2 [1] GBG1 GBB3 [1] GBB1 GBB3 [1] GBB2 GBB4 [1] GBB1 GBB4 [1] GBB2 GBB4 [1] GBB3 GBB4 [1] GBG1 GBG1 [1] GBB5 GBG1 [1] GNAS1 GBG1 [3] GBB3 GNAI1 [1] GNAI1 GNAI1 [1] GPR1 GNAS1 [1] GNAI1 GNAS1 [1] GNAS1 GNAS2 [1] GNAS2 GP143 [2] GNAI1 IF2A [1] CASP3 IF2A [4] E2AK2 IKBA [1] IKBB IKBA [1] IKKE IKBA [1] SUMO1 IKBA [2] CSK21 IKBA [2] E2AK2 IKBA [2] IKBA IKBA [2] NEMO IKBA [2] SKP1 IKBA [2] SRC IKBA [5] UBIQ IKBA [8] IKKA IKBB [1] IKBB IKBB [1] NEMO IKBB [1] NFKB2 IKBB [1] SKP1 IKBB [2] NFKB1 IKBB [2] TNR16 IKBE [1] IKBA IKBE [1] IKBB IKBE [1] IKBE IKBE [1] IKKA IKBE [1] NEMO IKBE [1] PSA5 IKBE [1] SKP1 IKBE [4] NFKB1 IKBE [4] NFKB2
IKBE [4] TF65 IKKA [1] BCL10 IKKA [1] FOXO3 IKKA [1] IKKE IKKA [1] M3K1 IKKA [1] M3K3 IKKA [1] REL IKKA [10] M3K14 IKKA [16] NEMO IKKA [2] IKBB IKKA [3] IKKA IKKA [4] TF65 IKKA [5] NFKB1 IKKE [1] GBB2 IKKE [1] IKKE IKKE [1] PRS10 IKKE [1] PRS6B IKKE [1] PRS7 IKKE [1] PSA1 IKKE [1] PSA2 IKKE [1] PSA6 IKKE [1] PSA7 IKKE [1] PSB1 IKKE [1] PSB3 IKKE [1] PSB4 IKKE [1] PSB6 IKKE [1] PSDE IKKE [1] PSMD2 IKKE [1] PSMD6 IKKE [1] TRAF2 IKKE [3] TANK IL1R1 [1] M3K14 IL1R1 [1] TRAF6 IL1R1 [2] P85A INGR1 [1] INGR1 IRAK1 [1] IKKA IRAK1 [1] IRAK1 IRAK1 [1] TAB2 IRAK1 [2] IL1R1 IRAK1 [5] TRAF6 IRAK4 [3] IRAK1 IRAK4 [3] MYD88 ITK [1] ERBB2 ITK [1] SRC ITK [2] ITK ITK [3] PLCG1 KPCT [1] BCL10 KPCT [1] CAR11 KPCT [1] CASP3 KPCT [1] IKKA KPCT [1] MALT1 KPCT [1] NEMO KPCT [2] AKT1 KPCT [2] KPCT KSYK [1] ERBB2 KSYK [1] FAK2 KSYK [1] TRAF6 KSYK [3] P85A KSYK [3] PLCG1 KSYK [4] KSYK M3K1 [1] M3K1 M3K1 [2] TRAF2
M3K1 [2] UBIQ M3K14 [1] M3K14 M3K14 [1] REL M3K14 [1] RIPK1 M3K14 [1] TRAF5 M3K14 [2] NEMO M3K14 [2] TRAF3 M3K14 [4] TRAF2 M3K3 [1] GBB1 M3K3 [1] GBB2 M3K3 [1] NEMO M3K3 [1] RIPK1 M3K3 [1] TRAF6 M3K3 [1] UBIQ M3K3 [2] IKBA M3K3 [2] KAPCA M3K3 [2] M3K3 MALT1 [1] MALT1 MALT1 [1] TAB2 MALT1 [3] TRAF6 MALT1 [3] UBIQ MAPK2 [3] MAPK2 MAPK5 [1] P53 MET [3] MET MYD88 [1] BTK MYD88 [2] IL1R1 MYD88 [2] MYD88 MYD88 [3] IRAK1 MYD88 [4] TIRAP MYD88 [4] TLR2 MYD88 [5] TLR4 NEMO [1] NFKB1 NEMO [1] PSD13 NEMO [1] REL NEMO [1] TANK NEMO [2] MALT1 NEMO [2] SRC NEMO [5] UBIQ NEMO [6] BCL10 NEMO [8] NEMO NFKB1 [1] KAPCA NFKB1 [11] NFKB1 NFKB1 [12] BCL3 NFKB1 [5] NFKB2 NFKB1 [6] IKBA NFKB2 [1] IKBA NFKB2 [1] IKKA NFKB2 [1] IKKE NFKB2 [1] NEMO NFKB2 [1] PRS8 NFKB2 [1] PSA3 NFKB2 [1] PSA6 NFKB2 [1] PSB5 NFKB2 [1] PSD13 NFKB2 [1] PSMD2 NFKB2 [1] SKP1 NFKB2 [1] TRAF3 NFKB2 [1] UBIQ NFKB2 [2] M3K14 NFKB2 [2] NFKB2 NFKB2 [3] PSD11 NFKB2 [4] TF65
NFKB2 [5] BCL3 NKRF [1] NFKB1 NKRF [1] NFKB2 NKRF [1] REL NKRF [1] TF65 NTRK1 [1] UBIQ NTRK1 [2] NTRK1 NTRK1 [3] PLCG1 P53 [1] BMX P53 [1] IKKA P53 [13] P53 P53 [2] CSK21 P53 [2] IKBA P53 [3] E2AK2 P53 [4] SUMO1 P85A [1] AKT1 P85A [1] FAK2 P85A [1] IKBA P85A [1] MET P85A [1] RRAS2 P85A [2] NTRK1 P85A [2] P85A P85A [2] TIE1 PDE3B [2] AKT1 PDE3B [2] KAPCA PDE4D [1] KAPCA PDE4D [1] SRC PDE4D [3] PDE4D PDK1 [1] AKT1 PDK1 [1] PDK1 PGFRA [1] P85A PGFRA [2] PGFRB PGFRA [2] PLCG1 PGFRA [5] PGFRA PGFRB [1] SRC PGFRB [6] P85A PGFRB [6] PGFRB PGFRB [8] PLCG1 PIDD [1] PIDD PIDD [1] RIPK1 PLCG1 [1] MET PLCG1 [1] P85A PLCG1 [1] PLCG2 PLCG1 [1] SRC PLCG1 [2] RET PLCG1 [3] ERBB2 PLCG2 [1] ERBB2 PLCG2 [1] ITK PLCG2 [1] NTRK1 PLCG2 [1] P85A PLCG2 [1] PLCG2 PLCG2 [3] KSYK PRS10 [1] NFKB2 PRS10 [1] PRS10 PRS10 [1] PRS6A PRS10 [1] PRS7 PRS10 [1] PSA1 PRS10 [1] PSA2 PRS10 [1] PSA3 PRS10 [1] PSA5 PRS10 [1] PSA6 PRS10 [1] PSB1
69
PRS10 [1] PSB2 PRS10 [1] PSB3 PRS10 [1] PSB4 PRS10 [1] PSB5 PRS10 [1] PSB7 PRS10 [1] PSD11 PRS10 [1] PSMD2 PRS10 [2] PRS8 PRS10 [2] PSD13 PRS10 [2] PSMD4 PRS6A [1] PSA2 PRS6A [1] PSA3 PRS6A [1] PSA5 PRS6A [1] PSB2 PRS6A [1] PSB4 PRS6A [1] PSB7 PRS6A [1] PSMD2 PRS6A [2] PRS6A PRS6A [2] PRS7 PRS6A [2] PSB5 PRS6A [2] PSMD4 PRS6A [3] PSD13 PRS6B [1] PRS10 PRS6B [1] PSA1 PRS6B [1] PSA2 PRS6B [1] PSA3 PRS6B [1] PSA4 PRS6B [1] PSA5 PRS6B [1] PSA6 PRS6B [1] PSA7 PRS6B [1] PSB1 PRS6B [1] PSB2 PRS6B [1] PSB3 PRS6B [1] PSB4 PRS6B [1] PSB5 PRS6B [1] PSB7 PRS6B [2] PSD11 PRS6B [2] PSD13 PRS6B [2] PSMD2 PRS6B [2] PSMD4 PRS6B [3] PRS7 PRS6B [4] PRS6A PRS6B [4] PRS8 PRS7 [1] PSA2 PRS7 [1] PSA3 PRS7 [1] PSB2 PRS7 [1] PSB4 PRS7 [1] PSB7 PRS7 [1] SUMO4 PRS7 [2] PSB5 PRS7 [3] PSD13 PRS8 [1] PSA1 PRS8 [1] PSA2 PRS8 [1] PSA3 PRS8 [1] PSA5 PRS8 [1] PSA6 PRS8 [1] PSB1 PRS8 [1] PSB2 PRS8 [1] PSB3 PRS8 [1] PSB4 PRS8 [1] PSB5 PRS8 [1] PSB7 PRS8 [1] PSD11 PRS8 [1] PSMD2 PRS8 [2] PRS7 PRS8 [2] PSD13 PRS8 [2] PSMD4 PRS8 [3] PRS6A PSA1 [1] PRS6A
PSA1 [1] PRS7 PSA1 [1] PSB8 PSA1 [1] PSB9 PSA1 [1] PSMD2 PSA1 [1] PSMD4 PSA1 [2] PSD13 PSA1 [4] PSB1 PSA1 [4] PSB4 PSA1 [5] PSB2 PSA1 [6] PSA4 PSA1 [6] PSA6 PSA1 [9] PSA7 PSA2 [10] PSA1 PSA2 [10] PSA4 PSA2 [10] PSA6 PSA2 [10] PSA7 PSA2 [3] PSB10 PSA2 [4] PSB8 PSA2 [4] PSB9 PSA2 [6] PSA5 PSA2 [7] PSA3 PSA2 [7] PSB1 PSA2 [7] PSB2 PSA2 [7] PSB3 PSA2 [7] PSB4 PSA2 [7] PSB5 PSA2 [7] PSB6 PSA2 [7] PSB7 PSA3 [2] CSK21 PSA3 [2] PSD13 PSA3 [4] PSB1 PSA3 [4] PSB2 PSA3 [4] PSB4 PSA3 [5] PSB5 PSA3 [6] PSA1 PSA3 [7] PSA4 PSA3 [7] PSA7 PSA3 [8] PSA6 PSA4 [1] PRS10 PSA4 [1] PRS6A PSA4 [1] PRS7 PSA4 [1] PRS8 PSA4 [1] PSA4 PSA4 [1] PSB8 PSA4 [1] PSB9 PSA4 [1] PSD11 PSA4 [1] PSD13 PSA4 [1] PSMD2 PSA4 [1] PSMD4 PSA4 [1] PSMD6 PSA4 [10] PSA7 PSA4 [4] PSB1 PSA4 [4] PSB2 PSA4 [4] PSB4 PSA4 [6] PSA6 PSA5 [1] PRS7 PSA5 [1] PSD13 PSA5 [1] PSMD2 PSA5 [2] PSMD4 PSA5 [4] PSB1 PSA5 [4] PSB2 PSA5 [4] PSB3 PSA5 [4] PSB4 PSA5 [4] PSB5 PSA5 [4] PSB7 PSA5 [5] PSA1 PSA5 [5] PSA3 PSA5 [5] PSA6 PSA5 [6] PSA4
PSA5 [6] PSA7 PSA6 [1] PRS6A PSA6 [1] PRS7 PSA6 [1] PSB8 PSA6 [1] PSB9 PSA6 [1] PSD11 PSA6 [1] PSMD2 PSA6 [2] PSD13 PSA6 [2] PSMD4 PSA6 [4] PSB2 PSA6 [4] PSB4 PSA6 [9] PSA7 PSA7 [1] PRS10 PSA7 [1] PRS6A PSA7 [1] PRS7 PSA7 [1] PRS8 PSA7 [1] PSB8 PSA7 [1] PSB9 PSA7 [1] PSD11 PSA7 [1] PSMD2 PSA7 [1] PSMD6 PSA7 [2] PSD13 PSA7 [2] PSMD4 PSA7 [3] PSA7 PSA7 [4] PSB2 PSA7 [4] PSB4 PSB1 [1] PRS6A PSB1 [1] PRS7 PSB1 [1] PSB8 PSB1 [1] PSB9 PSB1 [1] PSD13 PSB1 [1] PSMD2 PSB1 [2] PSMD4 PSB1 [4] PSA6 PSB1 [4] PSA7 PSB1 [4] PSB4 PSB1 [5] PSB2 PSB10 [1] PSA1 PSB10 [1] PSB3 PSB10 [1] PSB9 PSB2 [1] PSB8 PSB2 [1] PSB9 PSB2 [1] PSD13 PSB3 [1] PRS6A PSB3 [1] PRS7 PSB3 [1] PSB8 PSB3 [1] PSB9 PSB3 [1] PSD11 PSB3 [1] PSD13 PSB3 [1] PSMD2 PSB3 [1] PSMD4 PSB3 [4] PSA1 PSB3 [4] PSA3 PSB3 [4] PSA4 PSB3 [4] PSA6 PSB3 [4] PSB4 PSB3 [5] PSA7 PSB3 [5] PSB7 PSB3 [6] PSB1 PSB3 [6] PSB2 PSB3 [6] PSB5 PSB4 [1] PSB8 PSB4 [1] PSB9 PSB4 [4] PSB2 PSB5 [1] PSB8 PSB5 [1] PSB9 PSB5 [2] PSD13 PSB5 [4] PSA1 PSB5 [4] PSA4
PSB5 [4] PSA6 PSB5 [4] PSA7 PSB5 [5] PSB2 PSB5 [5] PSB4 PSB5 [6] PSB1 PSB6 [1] PRS10 PSB6 [1] PRS6A PSB6 [1] PRS6B PSB6 [1] PRS7 PSB6 [1] PRS8 PSB6 [1] PSB8 PSB6 [1] PSB9 PSB6 [1] PSD11 PSB6 [1] PSD13 PSB6 [1] PSMD2 PSB6 [1] PSMD4 PSB6 [1] PSMD6 PSB6 [4] PSA1 PSB6 [4] PSA3 PSB6 [4] PSA4 PSB6 [4] PSA5 PSB6 [4] PSA6 PSB6 [4] PSA7 PSB6 [4] PSB1 PSB6 [4] PSB2 PSB6 [4] PSB3 PSB6 [4] PSB4 PSB6 [4] PSB5 PSB6 [6] PSB7 PSB7 [1] PSB8 PSB7 [1] PSD13 PSB7 [2] PSB7 PSB7 [4] PSA1 PSB7 [4] PSA3 PSB7 [4] PSA4 PSB7 [4] PSA6 PSB7 [4] PSB2 PSB7 [5] PSA7 PSB7 [5] PSB4 PSB7 [6] PSB1 PSB7 [6] PSB5 PSB8 [1] PSA3 PSB8 [1] PSA5 PSB8 [1] PSB9 PSB8 [2] PSB8 PSB9 [1] PSA3 PSB9 [1] PSA5 PSB9 [2] PSB7 PSD11 [1] P53 PSD11 [1] PRS6A PSD11 [1] PRS7 PSD11 [1] PSA1 PSD11 [1] PSA2 PSD11 [1] PSA3 PSD11 [1] PSA5 PSD11 [1] PSB1 PSD11 [1] PSB2 PSD11 [1] PSB4 PSD11 [1] PSB5 PSD11 [1] PSB7 PSD11 [1] PSMD2 PSD11 [1] SUMO2 PSD11 [2] PSD13 PSD11 [2] PSMD4 PSD13 [1] PSA2 PSD13 [1] PSB4 PSD13 [1] PSDE PSMD2 [1] PSA2 PSMD2 [1] PSA3
PSMD2 [1] PSB2 PSMD2 [1] PSB4 PSMD2 [1] PSB5 PSMD2 [1] PSB7 PSMD2 [1] PSMD2 PSMD2 [2] PRS7 PSMD2 [2] PSD13 PSMD4 [1] PSB2 PSMD4 [1] PSB4 PSMD4 [1] PSB5 PSMD4 [1] PSMD4 PSMD4 [2] PRS7 PSMD4 [2] PSA2 PSMD4 [2] PSA3 PSMD4 [2] PSB7 PSMD4 [2] PSMD2 PSMD4 [3] PSD13 PSMD4 [4] UBIQ PSMD6 [1] PSA5 PSMD6 [1] PSB1 PSMD6 [1] PSB2 PSMD6 [1] PSB4 PSMD6 [1] PSDE PSMD6 [2] PRS10 PSMD6 [2] PRS6B PSMD6 [2] PRS8 PSMD6 [2] PSA1 PSMD6 [2] PSA2 PSMD6 [2] PSA3 PSMD6 [2] PSA6 PSMD6 [2] PSB3 PSMD6 [2] PSB7 PSMD6 [2] PSD11 PSMD6 [2] PSMD2 PSMD6 [3] PRS6A PSMD6 [3] PRS7 PSMD6 [3] PSB5 PSMD6 [3] PSD13 PSMD6 [3] PSMD4 PTEN [1] P53 PTEN [1] PGFRB PTEN [2] AKT1 REL [1] IKKE REL [2] IKBA REL [2] IKBB REL [2] RELB REL [3] REL REL [4] NFKB2 REL [5] IKBE REL [5] NFKB1 REL [9] TF65 RELB [1] IKBA RELB [1] IKBB RELB [1] IKBE RELB [1] IKKA RELB [1] NEMO RELB [1] RELB RELB [1] UBIQ RELB [2] NFKB1 RELB [2] TF65 RELB [4] NFKB2 RET [2] P85A RET [2] RET RIPK1 [1] TR10A RIPK1 [1] TRAF5 RIPK1 [2] RIPK1 RIPK1 [4] NEMO RIPK1 [5] TRAF2 RRAS2 [2] TRAF3
70
SIRT1 [3] P53 SKP1 [1] IKKA SKP1 [1] IKKE SKP1 [1] NEMO SKP1 [1] NFKB1 SKP1 [1] REL SKP1 [1] TF65 SKP1 [12] RBX1 SKP1 [3] SKP1 SRC [1] KSYK SRC [1] MET SRC [1] RET SRC [2] ERBB2 SRC [2] KAPCA SRC [2] P2RY2 SRC [2] P85A SRC [3] IKKA SRC [4] SRC SUMO1 [1] IRAK1 SUMO1 [2] SUMO1 SUMO2 [1] SUMO3 SUMO2 [2] SUMO2 SUMO3 [1] SUMO3 SUMO4 [2] IKBA TAB1 [1] IRAK1 TAB1 [1] TAB1 TAB1 [1] TRAF2 TAB1 [1] UBIQ TAB1 [2] TAB3 TAB2 [1] E2AK2 TAB2 [1] TLR3 TAB2 [1] TRAF2 TAB2 [1] UBIQ TAB2 [2] NFKB1 TAB2 [2] TAB2
TAB2 [3] TAB1 TAB3 [1] NEMO TAB3 [1] TAB3 TAB3 [1] TRAF2 TAB3 [2] TAB2 TAK1L [1] TAB3 TANK [1] IKKA TANK [1] TANK TANK [5] TRAF2 TCB [3] TCA TEC [1] ERBB2 TEC [1] P85A TEC [1] PLCG1 TEC [1] PLCG2 TEC [1] TEC TF65 [1] BCL3 TF65 [1] IKKE TF65 [1] M3K14 TF65 [1] NEMO TF65 [1] SIRT1 TF65 [12] NFKB1 TF65 [15] IKBA TF65 [4] TF65 TF65 [4] UBIQ TF65 [5] KAPCA TF65 [8] IKBB TIE1 [1] TIE1 TIRAP [1] TIRAP TIRAP [1] TRAF6 TIRAP [2] BTK TLR1 [1] TLR2 TLR2 [1] IRAK1 TLR2 [1] P85A TLR2 [1] TLR2 TLR3 [1] E2AK2
TLR3 [1] MYD88 TLR3 [1] TRAF6 TLR3 [2] P85A TLR3 [2] SRC TLR3 [3] TLR3 TLR4 [1] BTK TLR4 [1] IRAK1 TLR4 [1] KSYK TLR4 [1] TLR1 TLR4 [3] TIRAP TNR16 [1] TRADD TNR16 [1] TRAF2 TNR16 [1] TRAF3 TNR16 [1] TRAF5 TNR16 [2] TRAF6 TNR16 [5] NTRK1 TNR1A [1] BCL10 TNR1A [1] IKKA TNR1A [1] NEMO TNR1A [1] TR10B TNR1A [1] UBIQ TNR1A [3] BIRC2 TNR1A [3] SUMO1 TNR1A [4] PSMD2 TNR1A [4] TRAF2 TNR1A [6] RIPK1 TNR1A [6] TNR1A TNR21 [1] TRADD TR10A [1] BTK TR10A [2] TR10A TR10B [1] RIPK1 TR10B [1] TR10A TR10B [1] TRADD TR13C [2] TR13C TRADD [1] TRAF3
TRADD [1] UBIQ TRADD [16] TNR1A TRADD [2] RIPK1 TRADD [3] TR10A TRADD [4] TRADD TRADD [8] TRAF2 TRAF2 [1] MALT1 TRAF2 [1] UBIQ TRAF2 [2] BCL10 TRAF2 [2] IKKA TRAF2 [3] TRAF6 TRAF2 [6] TRAF2 TRAF3 [1] SRC TRAF3 [1] TRAF3 TRAF3 [2] BIRC3 TRAF3 [2] RIPK1 TRAF3 [3] TANK TRAF3 [3] TRAF2 TRAF5 [2] TRAF2 TRAF5 [2] TRAF3 TRAF5 [2] TRAF5 TRAF5 [2] TRAF6 TRAF6 [1] BCL10 TRAF6 [1] E2AK2 TRAF6 [1] GBB2 TRAF6 [1] IF2A TRAF6 [1] PRS10 TRAF6 [1] PRS6A TRAF6 [1] PRS6B TRAF6 [1] PRS7 TRAF6 [1] PSA2 TRAF6 [1] PSA3 TRAF6 [1] PSA4 TRAF6 [1] PSA6 TRAF6 [1] PSB2
TRAF6 [1] PSB3 TRAF6 [1] PSB4 TRAF6 [1] PSB6 TRAF6 [1] PSD11 TRAF6 [1] PSDE TRAF6 [1] PSMD4 TRAF6 [1] SRC TRAF6 [2] IRAK4 TRAF6 [2] PRS8 TRAF6 [2] PSA1 TRAF6 [2] PSB5 TRAF6 [2] PSD13 TRAF6 [2] PSMD2 TRAF6 [2] PSMD6 TRAF6 [2] TRAF6 TRAF6 [3] ECSIT TRAF6 [3] M3K14 TRAF6 [3] TAB1 TRAF6 [3] TAB3 TRAF6 [4] TAB2 TRAF6 [4] UBIQ TXK [1] ERBB2 TXK [2] SRC TXK [2] TXK TYRO3 [1] SRC TYRO3 [2] P85A UBIQ [1] IKBB UBIQ [1] IRAK1 UBIQ [1] KSYK UBIQ [1] SRC UBIQ [1] SUMO3 UBIQ [19] P53 UBIQ [4] BCL10 UBIQ [4] UBIQ
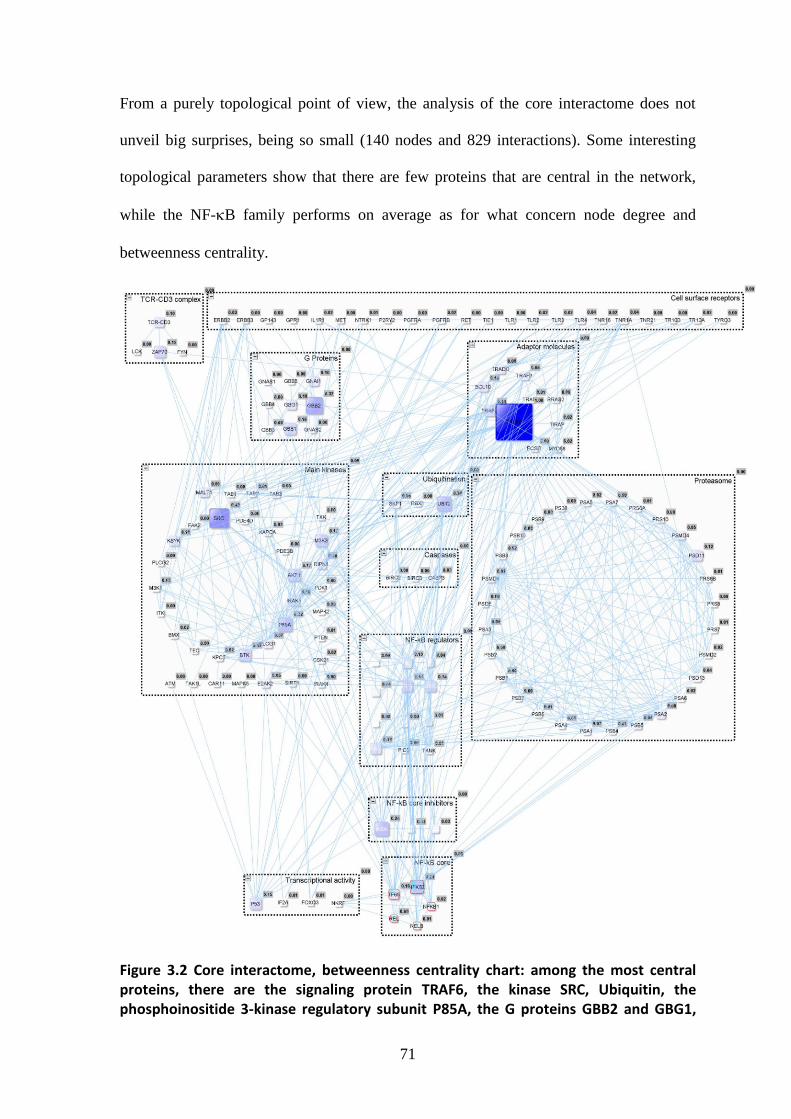
71
From a purely topological point of view, the analysis of the core interactome does not
unveil big surprises, being so small (140 nodes and 829 interactions). Some interesting
topological parameters show that there are few proteins that are central in the network,
while the NF-B family performs on average as for what concern node degree and
betweenness centrality.
Figure 3.2 Core interactome, betweenness centrality chart: among the most central proteins, there are the signaling protein TRAF6, the kinase SRC, Ubiquitin, the phosphoinositide 3-kinase regulatory subunit P85A, the G proteins GBB2 and GBG1,
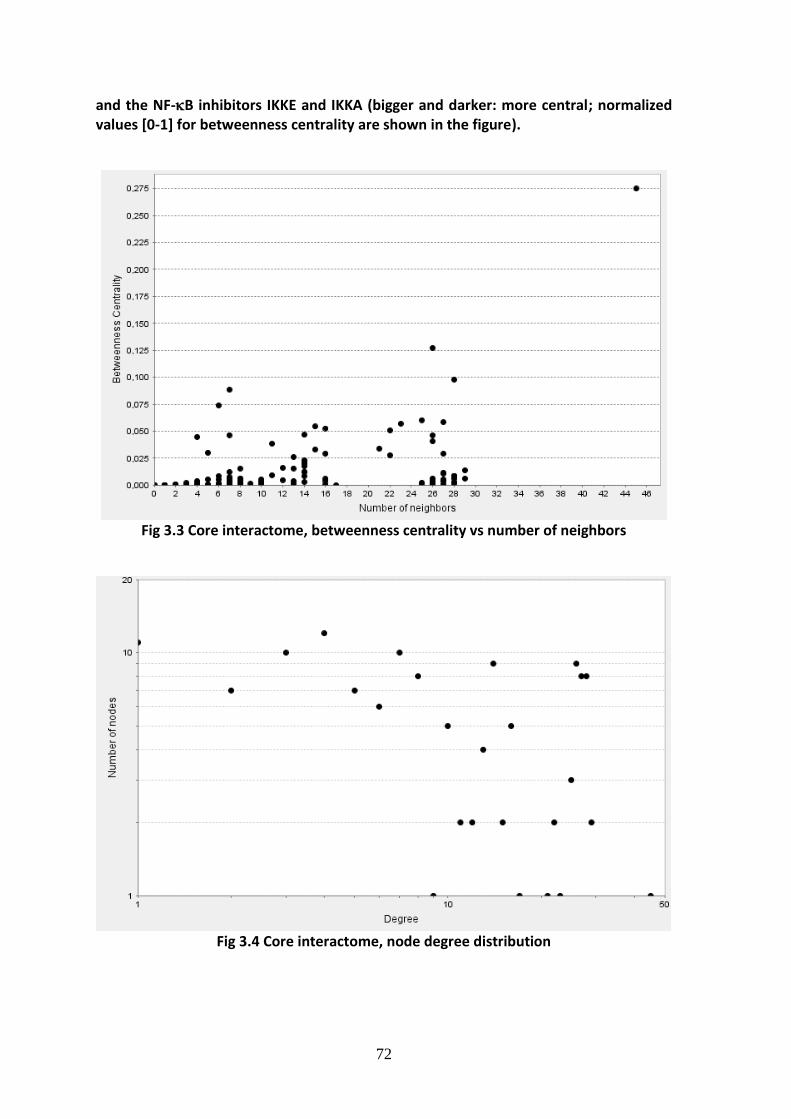
72
and the NF-B inhibitors IKKE and IKKA (bigger and darker: more central; normalized values [0-1] for betweenness centrality are shown in the figure).
Fig 3.3 Core interactome, betweenness centrality vs number of neighbors
Fig 3.4 Core interactome, node degree distribution
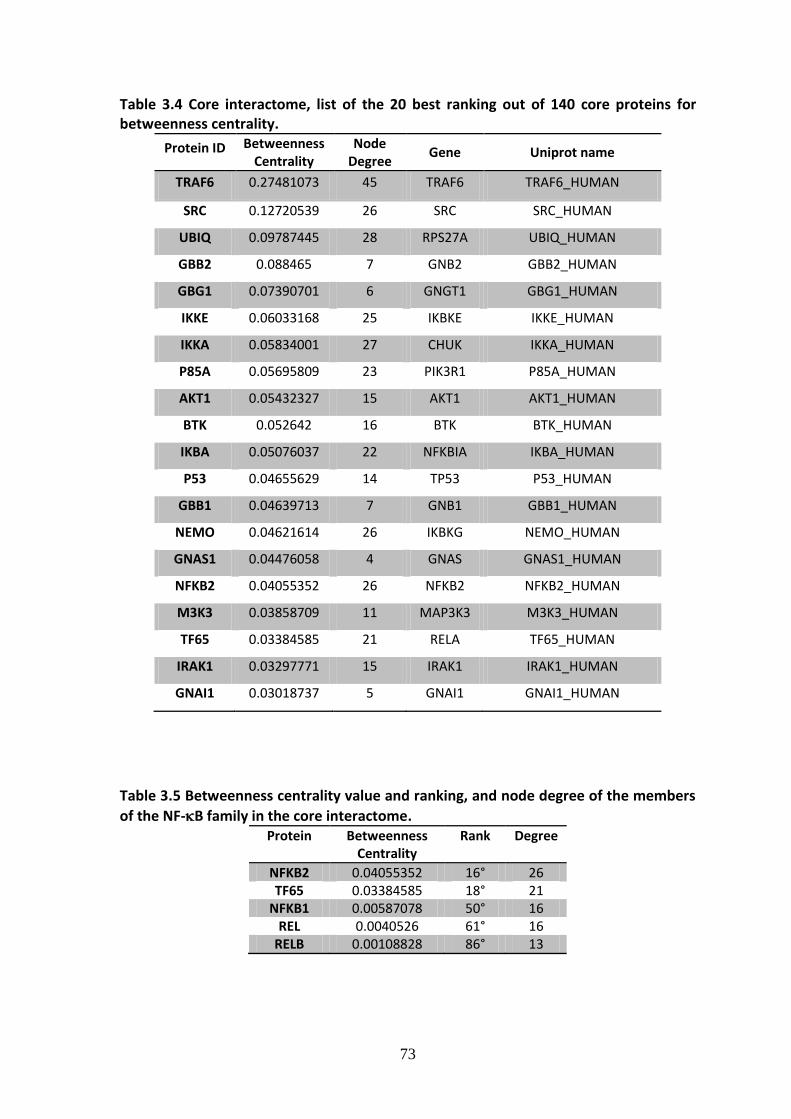
73
Table 3.4 Core interactome, list of the 20 best ranking out of 140 core proteins for betweenness centrality.
Protein ID Betweenness Centrality
Node Degree
Gene Uniprot name
TRAF6 0.27481073 45 TRAF6 TRAF6_HUMAN
SRC 0.12720539 26 SRC SRC_HUMAN
UBIQ 0.09787445 28 RPS27A UBIQ_HUMAN
GBB2 0.088465 7 GNB2 GBB2_HUMAN
GBG1 0.07390701 6 GNGT1 GBG1_HUMAN
IKKE 0.06033168 25 IKBKE IKKE_HUMAN
IKKA 0.05834001 27 CHUK IKKA_HUMAN
P85A 0.05695809 23 PIK3R1 P85A_HUMAN
AKT1 0.05432327 15 AKT1 AKT1_HUMAN
BTK 0.052642 16 BTK BTK_HUMAN
IKBA 0.05076037 22 NFKBIA IKBA_HUMAN
P53 0.04655629 14 TP53 P53_HUMAN
GBB1 0.04639713 7 GNB1 GBB1_HUMAN
NEMO 0.04621614 26 IKBKG NEMO_HUMAN
GNAS1 0.04476058 4 GNAS GNAS1_HUMAN
NFKB2 0.04055352 26 NFKB2 NFKB2_HUMAN
M3K3 0.03858709 11 MAP3K3 M3K3_HUMAN
TF65 0.03384585 21 RELA TF65_HUMAN
IRAK1 0.03297771 15 IRAK1 IRAK1_HUMAN
GNAI1 0.03018737 5 GNAI1 GNAI1_HUMAN
Table 3.5 Betweenness centrality value and ranking, and node degree of the members
of the NF-B family in the core interactome. Protein Betweenness
Centrality Rank Degree
NFKB2 0.04055352 16° 26 TF65 0.03384585 18° 21
NFKB1 0.00587078 50° 16 REL 0.0040526 61° 16
RELB 0.00108828 86° 13
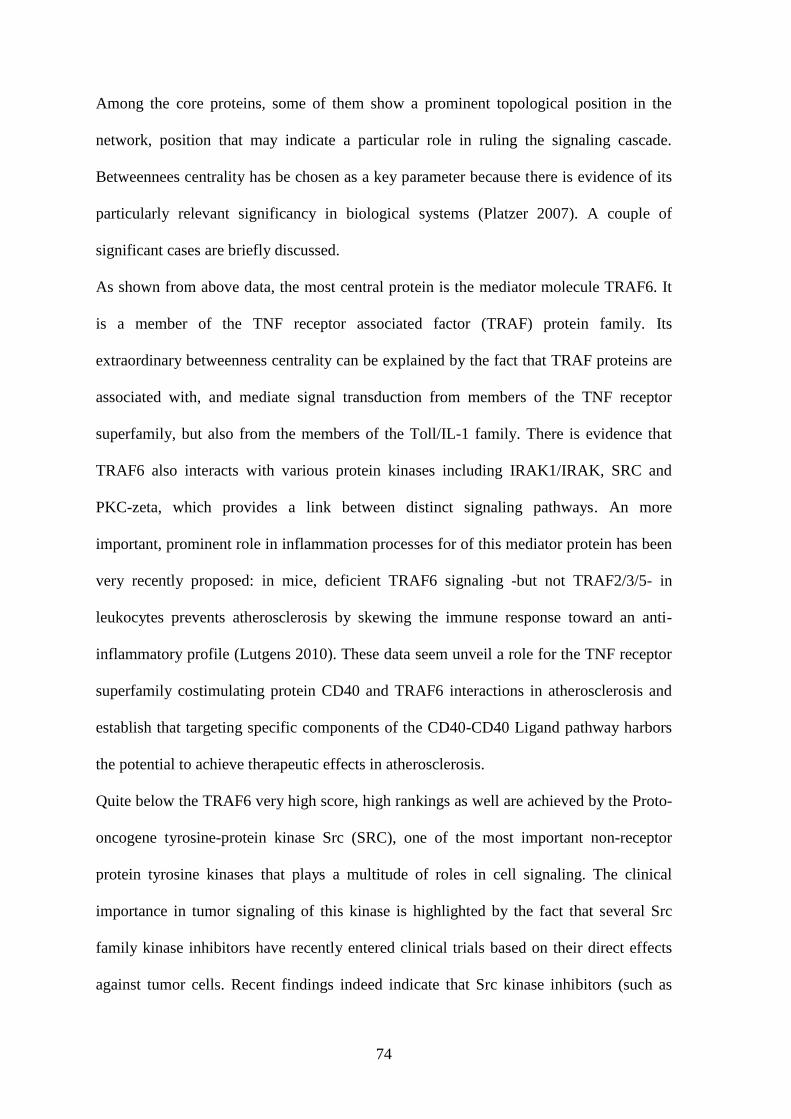
74
Among the core proteins, some of them show a prominent topological position in the
network, position that may indicate a particular role in ruling the signaling cascade.
Betweennees centrality has be chosen as a key parameter because there is evidence of its
particularly relevant significancy in biological systems (Platzer 2007). A couple of
significant cases are briefly discussed.
As shown from above data, the most central protein is the mediator molecule TRAF6. It
is a member of the TNF receptor associated factor (TRAF) protein family. Its
extraordinary betweenness centrality can be explained by the fact that TRAF proteins are
associated with, and mediate signal transduction from members of the TNF receptor
superfamily, but also from the members of the Toll/IL-1 family. There is evidence that
TRAF6 also interacts with various protein kinases including IRAK1/IRAK, SRC and
PKC-zeta, which provides a link between distinct signaling pathways. An more
important, prominent role in inflammation processes for of this mediator protein has been
very recently proposed: in mice, deficient TRAF6 signaling -but not TRAF2/3/5- in
leukocytes prevents atherosclerosis by skewing the immune response toward an anti-
inflammatory profile (Lutgens 2010). These data seem unveil a role for the TNF receptor
superfamily costimulating protein CD40 and TRAF6 interactions in atherosclerosis and
establish that targeting specific components of the CD40-CD40 Ligand pathway harbors
the potential to achieve therapeutic effects in atherosclerosis.
Quite below the TRAF6 very high score, high rankings as well are achieved by the Proto-
oncogene tyrosine-protein kinase Src (SRC), one of the most important non-receptor
protein tyrosine kinases that plays a multitude of roles in cell signaling. The clinical
importance in tumor signaling of this kinase is highlighted by the fact that several Src
family kinase inhibitors have recently entered clinical trials based on their direct effects
against tumor cells. Recent findings indeed indicate that Src kinase inhibitors (such as
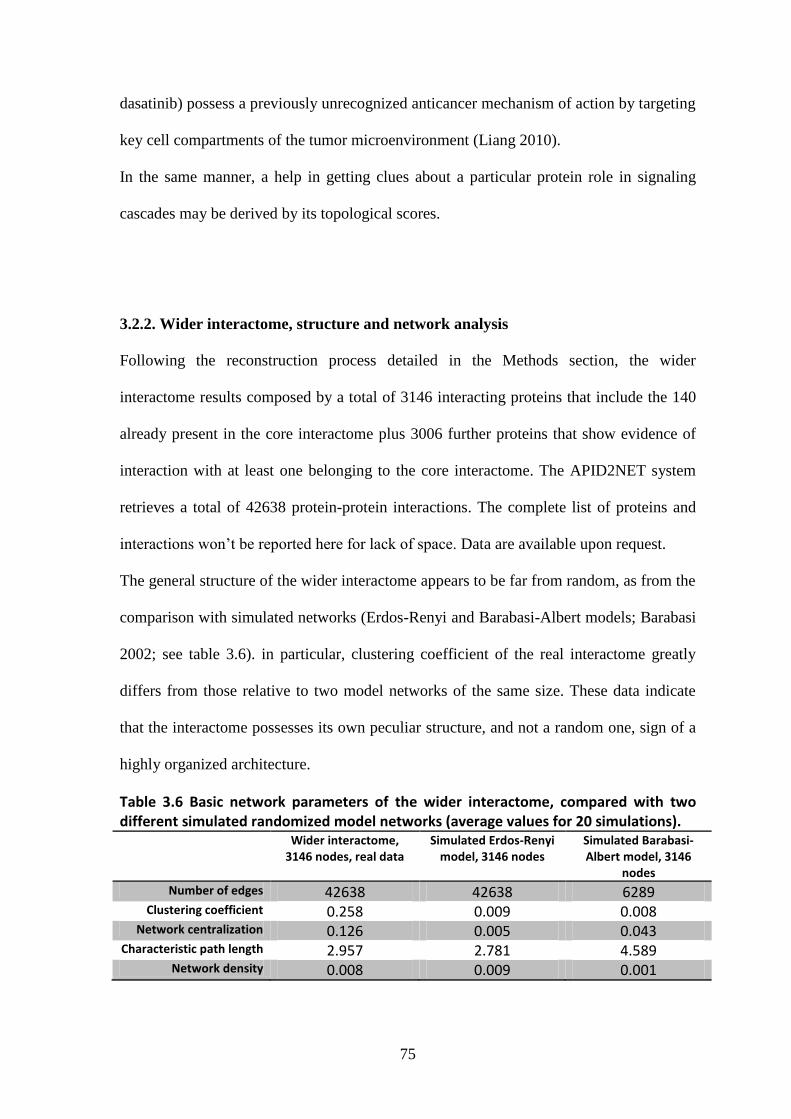
75
dasatinib) possess a previously unrecognized anticancer mechanism of action by targeting
key cell compartments of the tumor microenvironment (Liang 2010).
In the same manner, a help in getting clues about a particular protein role in signaling
cascades may be derived by its topological scores.
3.2.2. Wider interactome, structure and network analysis
Following the reconstruction process detailed in the Methods section, the wider
interactome results composed by a total of 3146 interacting proteins that include the 140
already present in the core interactome plus 3006 further proteins that show evidence of
interaction with at least one belonging to the core interactome. The APID2NET system
retrieves a total of 42638 protein-protein interactions. The complete list of proteins and
interactions won‟t be reported here for lack of space. Data are available upon request.
The general structure of the wider interactome appears to be far from random, as from the
comparison with simulated networks (Erdos-Renyi and Barabasi-Albert models; Barabasi
2002; see table 3.6). in particular, clustering coefficient of the real interactome greatly
differs from those relative to two model networks of the same size. These data indicate
that the interactome possesses its own peculiar structure, and not a random one, sign of a
highly organized architecture.
Table 3.6 Basic network parameters of the wider interactome, compared with two different simulated randomized model networks (average values for 20 simulations).
Wider interactome, 3146 nodes, real data
Simulated Erdos-Renyi model, 3146 nodes
Simulated Barabasi-Albert model, 3146
nodes
Number of edges 42638 42638 6289 Clustering coefficient 0.258 0.009 0.008
Network centralization 0.126 0.005 0.043 Characteristic path length 2.957 2.781 4.589
Network density 0.008 0.009 0.001
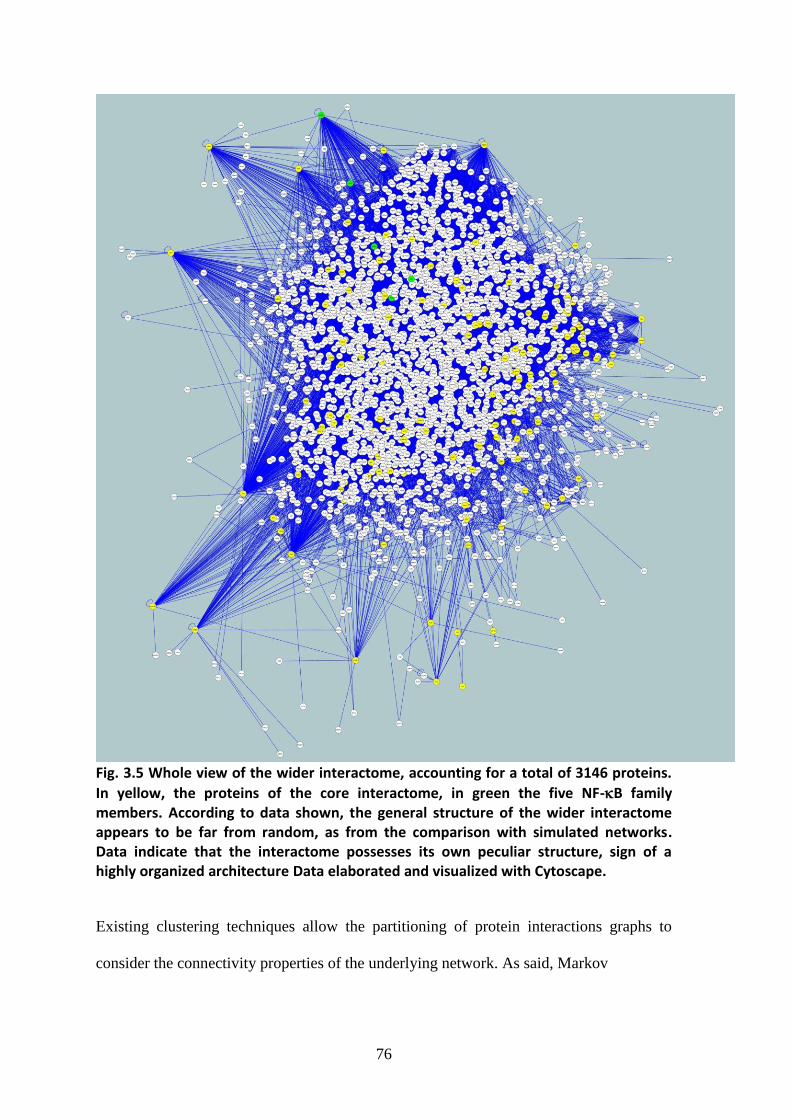
76
Fig. 3.5 Whole view of the wider interactome, accounting for a total of 3146 proteins.
In yellow, the proteins of the core interactome, in green the five NF-B family members. According to data shown, the general structure of the wider interactome appears to be far from random, as from the comparison with simulated networks. Data indicate that the interactome possesses its own peculiar structure, sign of a highly organized architecture Data elaborated and visualized with Cytoscape.
Existing clustering techniques allow the partitioning of protein interactions graphs to
consider the connectivity properties of the underlying network. As said, Markov
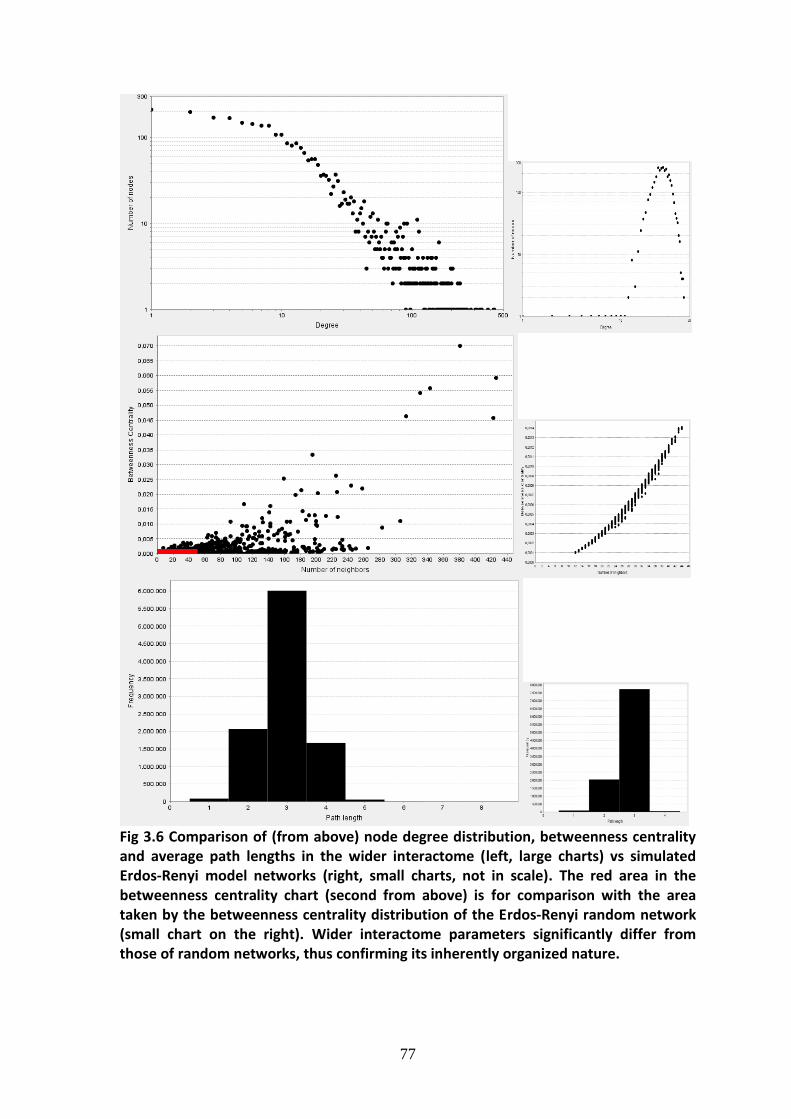
77
Fig 3.6 Comparison of (from above) node degree distribution, betweenness centrality and average path lengths in the wider interactome (left, large charts) vs simulated Erdos-Renyi model networks (right, small charts, not in scale). The red area in the betweenness centrality chart (second from above) is for comparison with the area taken by the betweenness centrality distribution of the Erdos-Renyi random network (small chart on the right). Wider interactome parameters significantly differ from those of random networks, thus confirming its inherently organized nature.
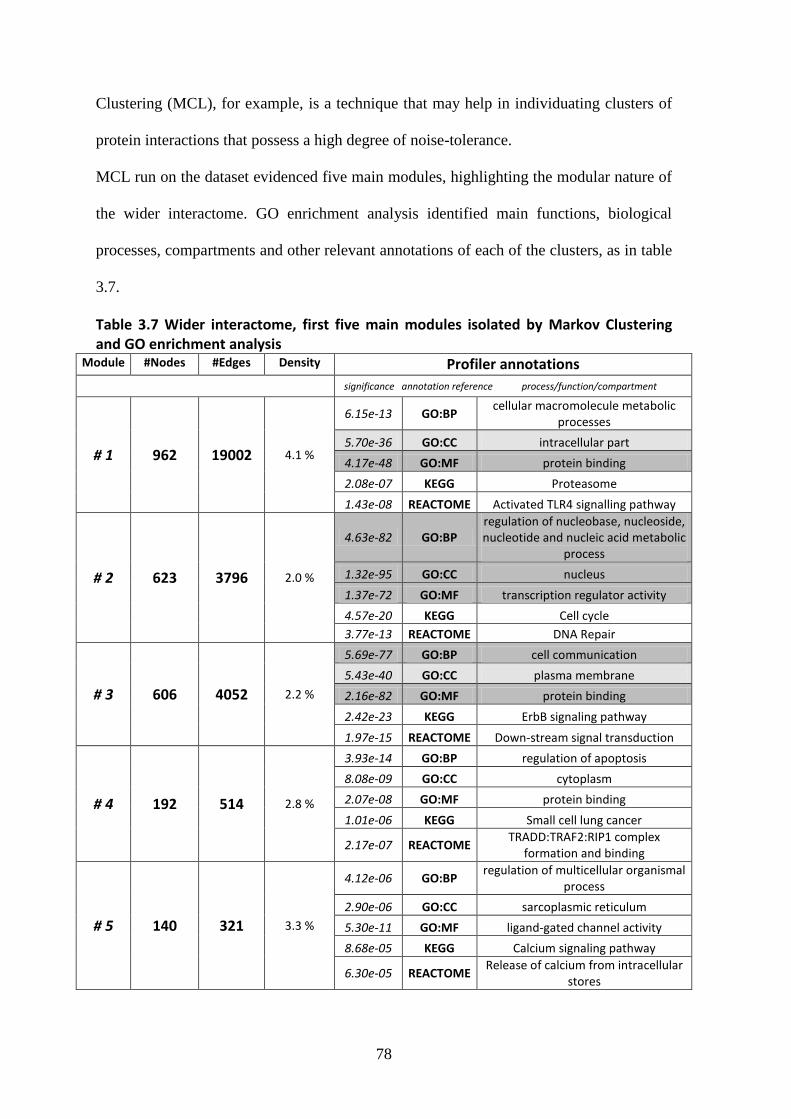
78
Clustering (MCL), for example, is a technique that may help in individuating clusters of
protein interactions that possess a high degree of noise-tolerance.
MCL run on the dataset evidenced five main modules, highlighting the modular nature of
the wider interactome. GO enrichment analysis identified main functions, biological
processes, compartments and other relevant annotations of each of the clusters, as in table
3.7.
Table 3.7 Wider interactome, first five main modules isolated by Markov Clustering and GO enrichment analysis
Module #Nodes #Edges Density Profiler annotations significance annotation reference process/function/compartment
# 1 962 19002 4.1 %
6.15e-13 GO:BP cellular macromolecule metabolic
processes
5.70e-36 GO:CC intracellular part
4.17e-48 GO:MF protein binding
2.08e-07 KEGG Proteasome
1.43e-08 REACTOME Activated TLR4 signalling pathway
# 2 623 3796 2.0 %
4.63e-82 GO:BP regulation of nucleobase, nucleoside, nucleotide and nucleic acid metabolic
process
1.32e-95 GO:CC nucleus
1.37e-72 GO:MF transcription regulator activity
4.57e-20 KEGG Cell cycle
3.77e-13 REACTOME DNA Repair
# 3 606 4052 2.2 %
5.69e-77 GO:BP cell communication
5.43e-40 GO:CC plasma membrane
2.16e-82 GO:MF protein binding
2.42e-23 KEGG ErbB signaling pathway
1.97e-15 REACTOME Down-stream signal transduction
# 4 192 514 2.8 %
3.93e-14 GO:BP regulation of apoptosis
8.08e-09 GO:CC cytoplasm
2.07e-08 GO:MF protein binding
1.01e-06 KEGG Small cell lung cancer
2.17e-07 REACTOME TRADD:TRAF2:RIP1 complex
formation and binding
# 5 140 321 3.3 %
4.12e-06 GO:BP regulation of multicellular organismal
process
2.90e-06 GO:CC sarcoplasmic reticulum
5.30e-11 GO:MF ligand-gated channel activity
8.68e-05 KEGG Calcium signaling pathway
6.30e-05 REACTOME Release of calcium from intracellular
stores
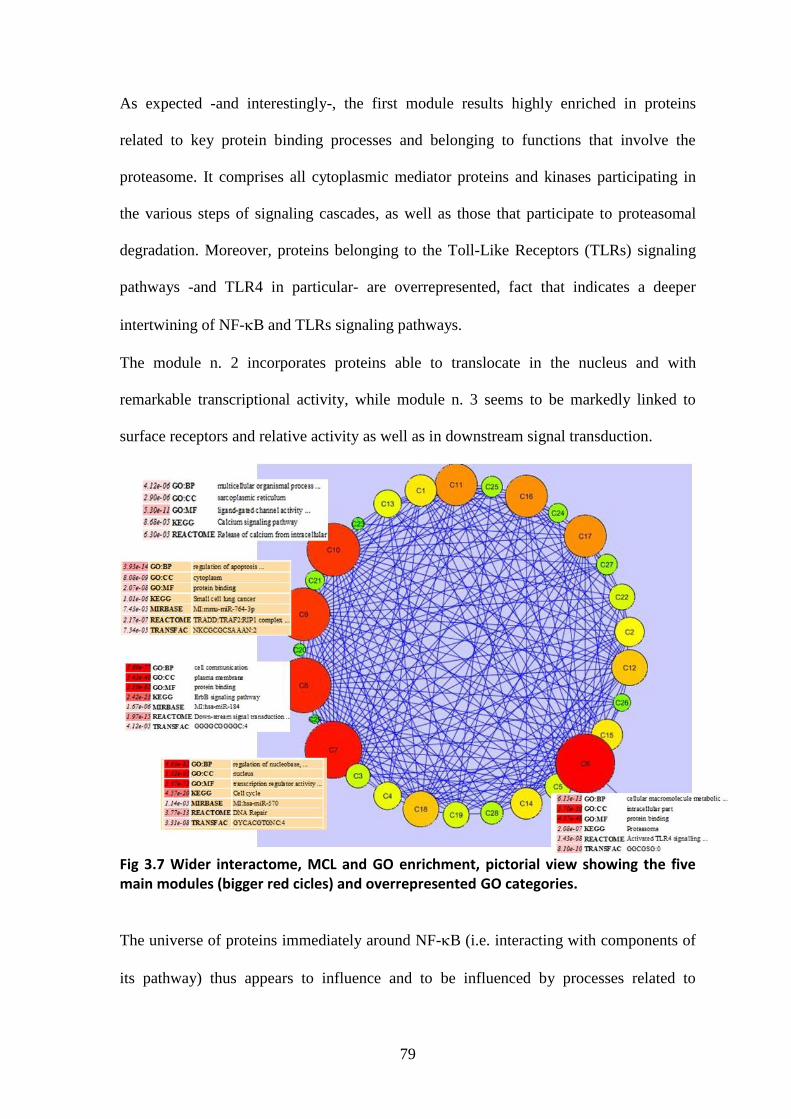
79
As expected -and interestingly-, the first module results highly enriched in proteins
related to key protein binding processes and belonging to functions that involve the
proteasome. It comprises all cytoplasmic mediator proteins and kinases participating in
the various steps of signaling cascades, as well as those that participate to proteasomal
degradation. Moreover, proteins belonging to the Toll-Like Receptors (TLRs) signaling
pathways -and TLR4 in particular- are overrepresented, fact that indicates a deeper
intertwining of NF-B and TLRs signaling pathways.
The module n. 2 incorporates proteins able to translocate in the nucleus and with
remarkable transcriptional activity, while module n. 3 seems to be markedly linked to
surface receptors and relative activity as well as in downstream signal transduction.
Fig 3.7 Wider interactome, MCL and GO enrichment, pictorial view showing the five main modules (bigger red cicles) and overrepresented GO categories.
The universe of proteins immediately around NF-B (i.e. interacting with components of
its pathway) thus appears to influence and to be influenced by processes related to
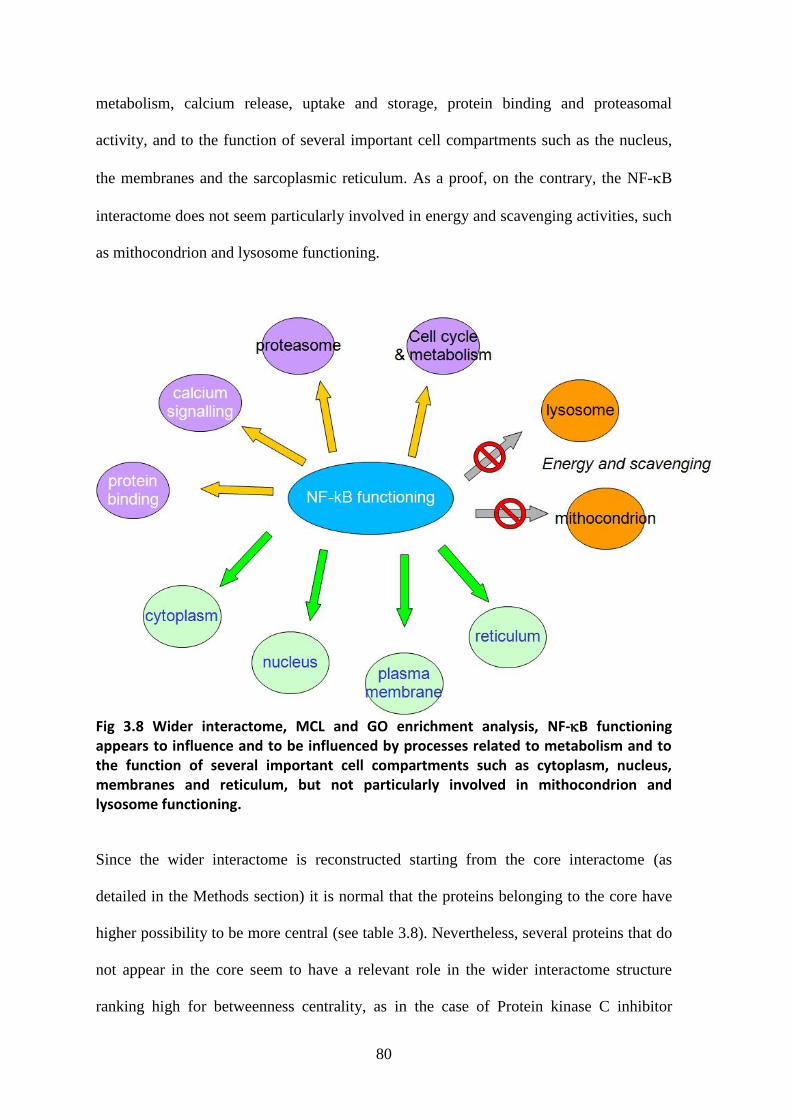
80
metabolism, calcium release, uptake and storage, protein binding and proteasomal
activity, and to the function of several important cell compartments such as the nucleus,
the membranes and the sarcoplasmic reticulum. As a proof, on the contrary, the NF-B
interactome does not seem particularly involved in energy and scavenging activities, such
as mithocondrion and lysosome functioning.
Fig 3.8 Wider interactome, MCL and GO enrichment analysis, NF-B functioning appears to influence and to be influenced by processes related to metabolism and to the function of several important cell compartments such as cytoplasm, nucleus, membranes and reticulum, but not particularly involved in mithocondrion and lysosome functioning.
Since the wider interactome is reconstructed starting from the core interactome (as
detailed in the Methods section) it is normal that the proteins belonging to the core have
higher possibility to be more central (see table 3.8). Nevertheless, several proteins that do
not appear in the core seem to have a relevant role in the wider interactome structure
ranking high for betweenness centrality, as in the case of Protein kinase C inhibitor
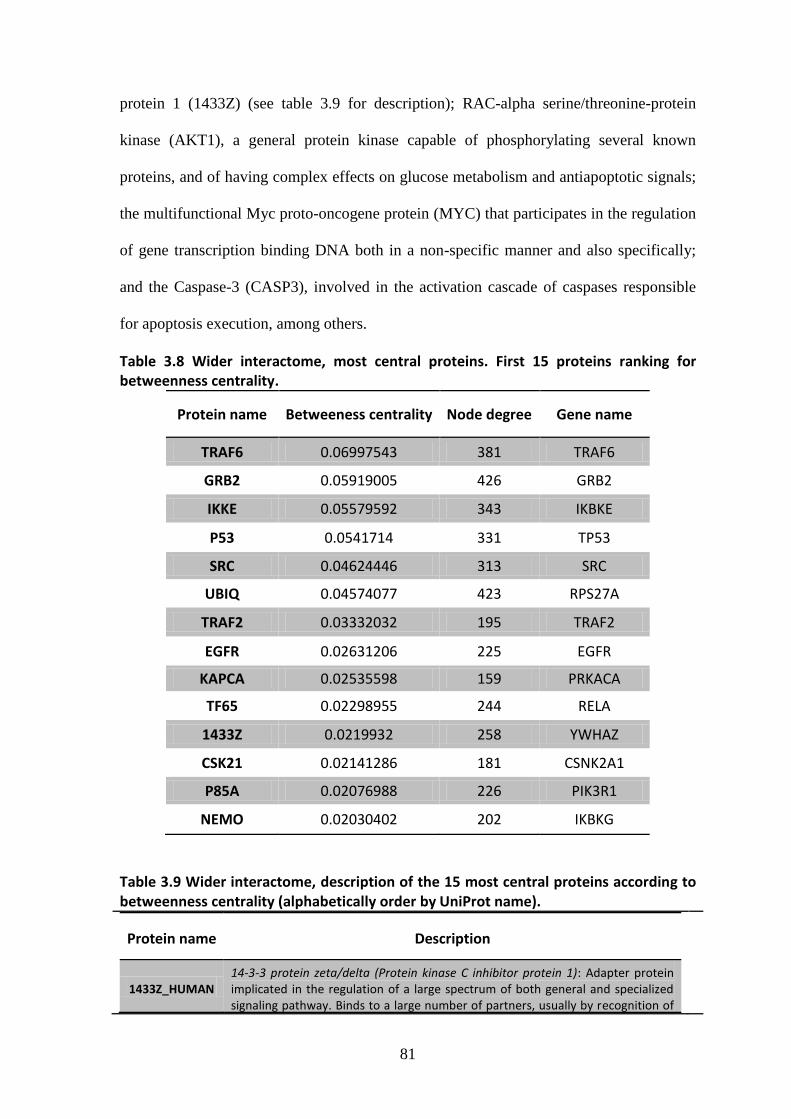
81
protein 1 (1433Z) (see table 3.9 for description); RAC-alpha serine/threonine-protein
kinase (AKT1), a general protein kinase capable of phosphorylating several known
proteins, and of having complex effects on glucose metabolism and antiapoptotic signals;
the multifunctional Myc proto-oncogene protein (MYC) that participates in the regulation
of gene transcription binding DNA both in a non-specific manner and also specifically;
and the Caspase-3 (CASP3), involved in the activation cascade of caspases responsible
for apoptosis execution, among others.
Table 3.8 Wider interactome, most central proteins. First 15 proteins ranking for betweenness centrality.
Protein name Betweeness centrality Node degree Gene name
TRAF6 0.06997543 381 TRAF6
GRB2 0.05919005 426 GRB2
IKKE 0.05579592 343 IKBKE
P53 0.0541714 331 TP53
SRC 0.04624446 313 SRC
UBIQ 0.04574077 423 RPS27A
TRAF2 0.03332032 195 TRAF2
EGFR 0.02631206 225 EGFR
KAPCA 0.02535598 159 PRKACA
TF65 0.02298955 244 RELA
1433Z 0.0219932 258 YWHAZ
CSK21 0.02141286 181 CSNK2A1
P85A 0.02076988 226 PIK3R1
NEMO 0.02030402 202 IKBKG
Table 3.9 Wider interactome, description of the 15 most central proteins according to betweenness centrality (alphabetically order by UniProt name).
Protein name Description
1433Z_HUMAN 14-3-3 protein zeta/delta (Protein kinase C inhibitor protein 1): Adapter protein implicated in the regulation of a large spectrum of both general and specialized signaling pathway. Binds to a large number of partners, usually by recognition of
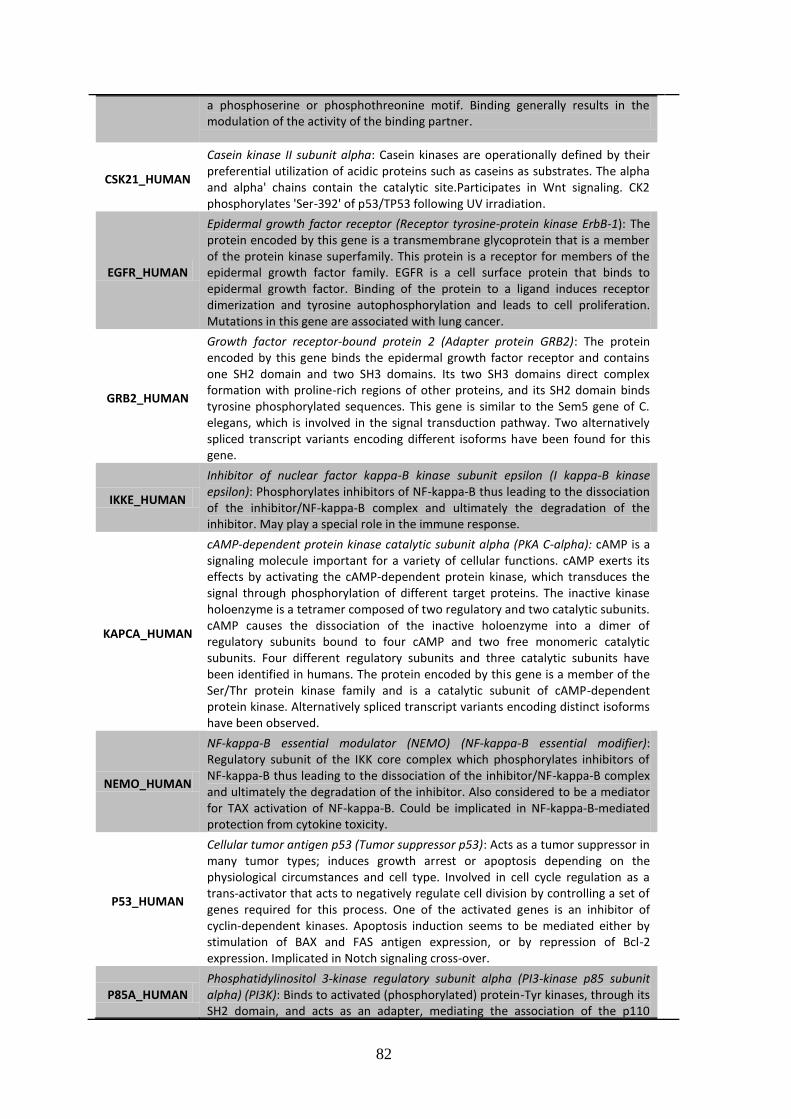
82
a phosphoserine or phosphothreonine motif. Binding generally results in the modulation of the activity of the binding partner.
CSK21_HUMAN
Casein kinase II subunit alpha: Casein kinases are operationally defined by their preferential utilization of acidic proteins such as caseins as substrates. The alpha and alpha' chains contain the catalytic site.Participates in Wnt signaling. CK2 phosphorylates 'Ser-392' of p53/TP53 following UV irradiation.
EGFR_HUMAN
Epidermal growth factor receptor (Receptor tyrosine-protein kinase ErbB-1): The protein encoded by this gene is a transmembrane glycoprotein that is a member of the protein kinase superfamily. This protein is a receptor for members of the epidermal growth factor family. EGFR is a cell surface protein that binds to epidermal growth factor. Binding of the protein to a ligand induces receptor dimerization and tyrosine autophosphorylation and leads to cell proliferation. Mutations in this gene are associated with lung cancer.
GRB2_HUMAN
Growth factor receptor-bound protein 2 (Adapter protein GRB2): The protein encoded by this gene binds the epidermal growth factor receptor and contains one SH2 domain and two SH3 domains. Its two SH3 domains direct complex formation with proline-rich regions of other proteins, and its SH2 domain binds tyrosine phosphorylated sequences. This gene is similar to the Sem5 gene of C. elegans, which is involved in the signal transduction pathway. Two alternatively spliced transcript variants encoding different isoforms have been found for this gene.
IKKE_HUMAN
Inhibitor of nuclear factor kappa-B kinase subunit epsilon (I kappa-B kinase epsilon): Phosphorylates inhibitors of NF-kappa-B thus leading to the dissociation of the inhibitor/NF-kappa-B complex and ultimately the degradation of the inhibitor. May play a special role in the immune response.
KAPCA_HUMAN
cAMP-dependent protein kinase catalytic subunit alpha (PKA C-alpha): cAMP is a signaling molecule important for a variety of cellular functions. cAMP exerts its effects by activating the cAMP-dependent protein kinase, which transduces the signal through phosphorylation of different target proteins. The inactive kinase holoenzyme is a tetramer composed of two regulatory and two catalytic subunits. cAMP causes the dissociation of the inactive holoenzyme into a dimer of regulatory subunits bound to four cAMP and two free monomeric catalytic subunits. Four different regulatory subunits and three catalytic subunits have been identified in humans. The protein encoded by this gene is a member of the Ser/Thr protein kinase family and is a catalytic subunit of cAMP-dependent protein kinase. Alternatively spliced transcript variants encoding distinct isoforms have been observed.
NEMO_HUMAN
NF-kappa-B essential modulator (NEMO) (NF-kappa-B essential modifier): Regulatory subunit of the IKK core complex which phosphorylates inhibitors of NF-kappa-B thus leading to the dissociation of the inhibitor/NF-kappa-B complex and ultimately the degradation of the inhibitor. Also considered to be a mediator for TAX activation of NF-kappa-B. Could be implicated in NF-kappa-B-mediated protection from cytokine toxicity.
P53_HUMAN
Cellular tumor antigen p53 (Tumor suppressor p53): Acts as a tumor suppressor in many tumor types; induces growth arrest or apoptosis depending on the physiological circumstances and cell type. Involved in cell cycle regulation as a trans-activator that acts to negatively regulate cell division by controlling a set of genes required for this process. One of the activated genes is an inhibitor of cyclin-dependent kinases. Apoptosis induction seems to be mediated either by stimulation of BAX and FAS antigen expression, or by repression of Bcl-2 expression. Implicated in Notch signaling cross-over.
P85A_HUMAN Phosphatidylinositol 3-kinase regulatory subunit alpha (PI3-kinase p85 subunit alpha) (PI3K): Binds to activated (phosphorylated) protein-Tyr kinases, through its SH2 domain, and acts as an adapter, mediating the association of the p110
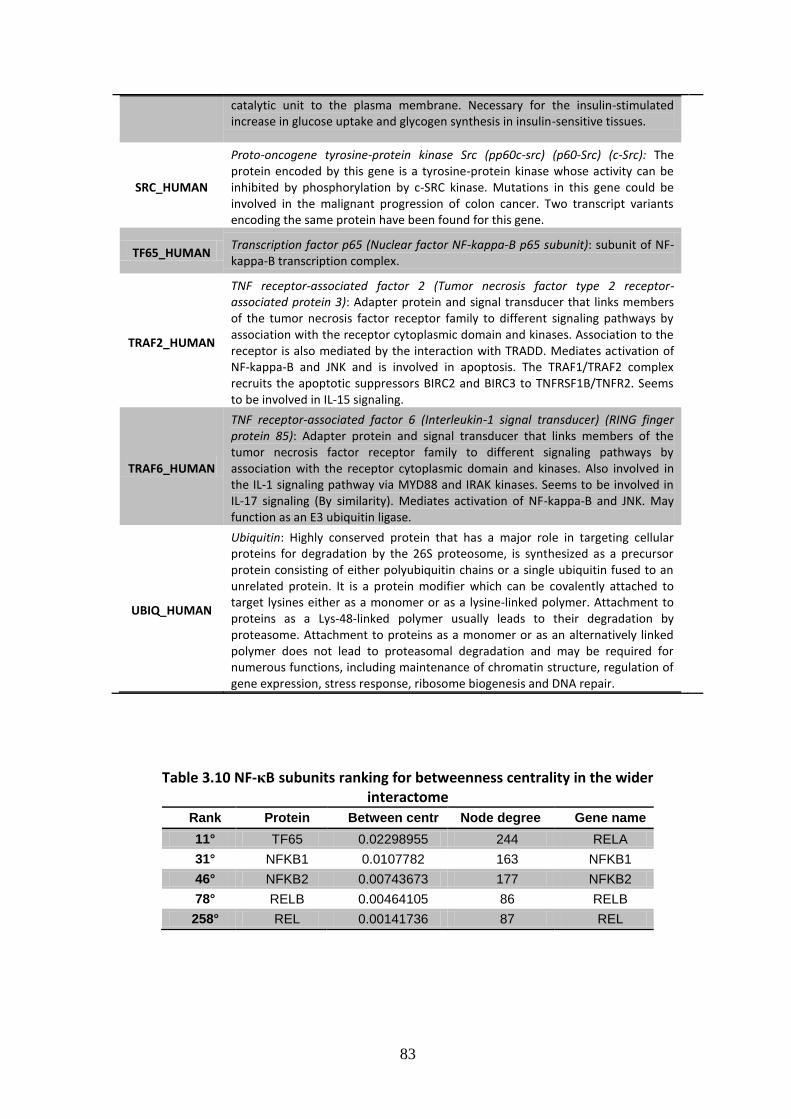
83
catalytic unit to the plasma membrane. Necessary for the insulin-stimulated increase in glucose uptake and glycogen synthesis in insulin-sensitive tissues.
SRC_HUMAN
Proto-oncogene tyrosine-protein kinase Src (pp60c-src) (p60-Src) (c-Src): The protein encoded by this gene is a tyrosine-protein kinase whose activity can be inhibited by phosphorylation by c-SRC kinase. Mutations in this gene could be involved in the malignant progression of colon cancer. Two transcript variants encoding the same protein have been found for this gene.
TF65_HUMAN Transcription factor p65 (Nuclear factor NF-kappa-B p65 subunit): subunit of NF-kappa-B transcription complex.
TRAF2_HUMAN
TNF receptor-associated factor 2 (Tumor necrosis factor type 2 receptor-associated protein 3): Adapter protein and signal transducer that links members of the tumor necrosis factor receptor family to different signaling pathways by association with the receptor cytoplasmic domain and kinases. Association to the receptor is also mediated by the interaction with TRADD. Mediates activation of NF-kappa-B and JNK and is involved in apoptosis. The TRAF1/TRAF2 complex recruits the apoptotic suppressors BIRC2 and BIRC3 to TNFRSF1B/TNFR2. Seems to be involved in IL-15 signaling.
TRAF6_HUMAN
TNF receptor-associated factor 6 (Interleukin-1 signal transducer) (RING finger protein 85): Adapter protein and signal transducer that links members of the tumor necrosis factor receptor family to different signaling pathways by association with the receptor cytoplasmic domain and kinases. Also involved in the IL-1 signaling pathway via MYD88 and IRAK kinases. Seems to be involved in IL-17 signaling (By similarity). Mediates activation of NF-kappa-B and JNK. May function as an E3 ubiquitin ligase.
UBIQ_HUMAN
Ubiquitin: Highly conserved protein that has a major role in targeting cellular proteins for degradation by the 26S proteosome, is synthesized as a precursor protein consisting of either polyubiquitin chains or a single ubiquitin fused to an unrelated protein. It is a protein modifier which can be covalently attached to target lysines either as a monomer or as a lysine-linked polymer. Attachment to proteins as a Lys-48-linked polymer usually leads to their degradation by proteasome. Attachment to proteins as a monomer or as an alternatively linked polymer does not lead to proteasomal degradation and may be required for numerous functions, including maintenance of chromatin structure, regulation of gene expression, stress response, ribosome biogenesis and DNA repair.
Table 3.10 NF-κB subunits ranking for betweenness centrality in the wider interactome
Rank Protein Between centr Node degree Gene name
11° TF65 0.02298955 244 RELA
31° NFKB1 0.0107782 163 NFKB1
46° NFKB2 0.00743673 177 NFKB2
78° RELB 0.00464105 86 RELB
258° REL 0.00141736 87 REL

84
Table 3.11 Wider interactome, proteins ranking from 16 to 100 for betweenness centrality
Protein Between centr Node degree Gene name
M3K3 0.01978339 174 MAP3K3
SUMO1 0.01672142 109 SUMO1
AKT1 0.01601919 142 AKT1
ABL1 0.01433885 183 ABL1
CASP3 0.01398608 141 CASP3
MYC 0.01300149 198 MYC
CRCM 0.01286892 191 MCC
1433G 0.01269315 212 YWHAG
FYN 0.01242612 227 FYN
TNR1A 0.01196486 132 TNFRSF1A
HS90A 0.01133857 187 HSP90AA1
EF1A1 0.01101538 306 EEF1A1
HSP7C 0.01086117 200 HSPA8
PLCG1 0.0108359 167 PLCG1
SKP1 0.01083512 92 SKP1
NFKB1 0.0107782 163 NFKB1
KPCA 0.01050862 133 PRKCA
ESR1 0.01007701 142 ESR1
1B42 0.00972535 200 HLA-B
ARRB2 0.00945463 201 ARRB2
IKBA 0.00942124 107 NFKBIA
GNAI2 0.00923252 112 GNAI2
ERBB2 0.00922718 113 ERBB2
MK01 0.00920674 142 MAPK1
SUMO3 0.00880842 122 SUMO3
HS90B 0.00871235 283 HSP90AB1
VIME 0.00844735 157 VIM
EP300 0.00779088 153 EP300
CTNB1 0.00768794 113 CTNNB1
M3K14 0.0075835 139 MAP3K14
NFKB2 0.00743673 177 NFKB2
IKKA 0.00734046 128 CHUK
VHL 0.00711999 161 VHL
SUMO4 0.00698174 74 SUMO4
CUL1 0.00674148 151 CUL1
BRCA1 0.00670832 123 BRCA1
LCK 0.00654623 167 LCK
ACTB 0.00648923 164 ACTB
GRP78 0.00636037 107 HSPA5
NCK1 0.00634203 165 NCK1
GNAI1 0.0063114 64 GNAI1
CBP 0.00615844 147 CREBBP
PAXI 0.00592148 132 PXN
ANDR 0.00589548 128 AR
ERBB3 0.00588372 69 ERBB3
UBC9 0.00585242 92 UBE2I
SMAD3 0.00580522 116 SMAD3
1433F 0.00562166 161 YWHAH
CALM 0.00553478 74 CALM1
BTK 0.00538402 63 BTK
ARRB1 0.00524068 122 ARRB1
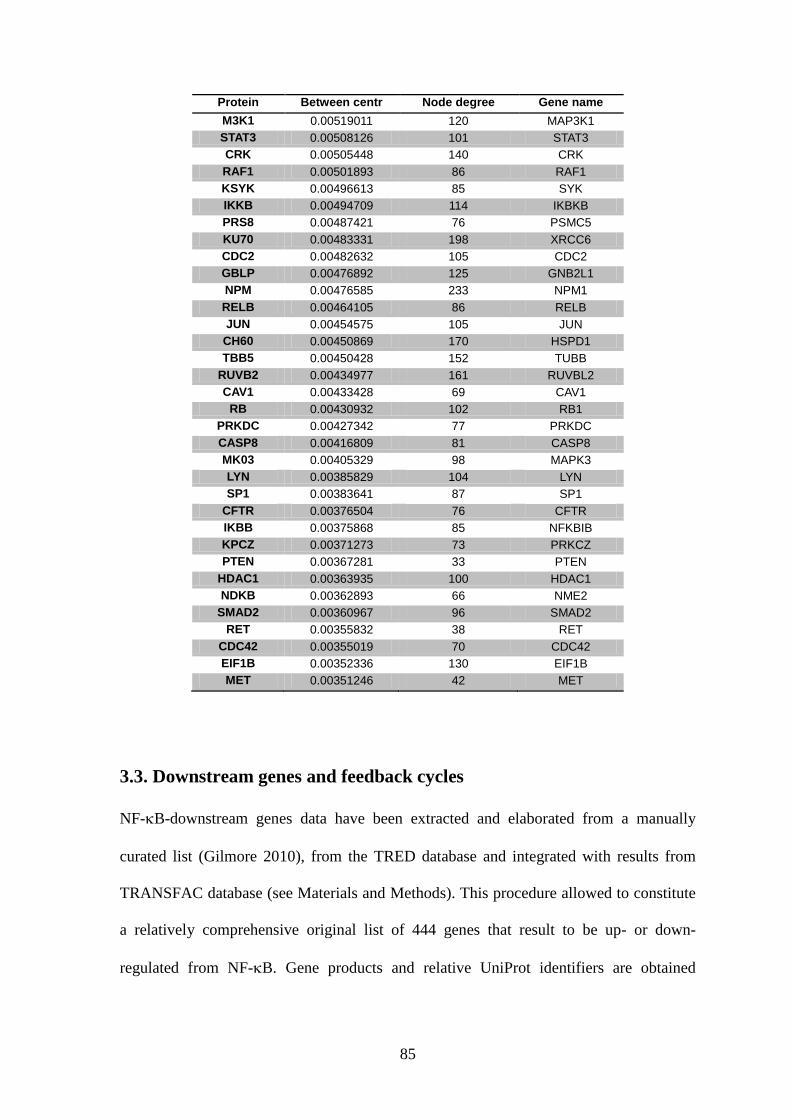
85
Protein Between centr Node degree Gene name
M3K1 0.00519011 120 MAP3K1
STAT3 0.00508126 101 STAT3
CRK 0.00505448 140 CRK
RAF1 0.00501893 86 RAF1
KSYK 0.00496613 85 SYK
IKKB 0.00494709 114 IKBKB
PRS8 0.00487421 76 PSMC5
KU70 0.00483331 198 XRCC6
CDC2 0.00482632 105 CDC2
GBLP 0.00476892 125 GNB2L1
NPM 0.00476585 233 NPM1
RELB 0.00464105 86 RELB
JUN 0.00454575 105 JUN
CH60 0.00450869 170 HSPD1
TBB5 0.00450428 152 TUBB
RUVB2 0.00434977 161 RUVBL2
CAV1 0.00433428 69 CAV1
RB 0.00430932 102 RB1
PRKDC 0.00427342 77 PRKDC
CASP8 0.00416809 81 CASP8
MK03 0.00405329 98 MAPK3
LYN 0.00385829 104 LYN
SP1 0.00383641 87 SP1
CFTR 0.00376504 76 CFTR
IKBB 0.00375868 85 NFKBIB
KPCZ 0.00371273 73 PRKCZ
PTEN 0.00367281 33 PTEN
HDAC1 0.00363935 100 HDAC1
NDKB 0.00362893 66 NME2
SMAD2 0.00360967 96 SMAD2
RET 0.00355832 38 RET
CDC42 0.00355019 70 CDC42
EIF1B 0.00352336 130 EIF1B
MET 0.00351246 42 MET
3.3. Downstream genes and feedback cycles
NF-B-downstream genes data have been extracted and elaborated from a manually
curated list (Gilmore 2010), from the TRED database and integrated with results from
TRANSFAC database (see Materials and Methods). This procedure allowed to constitute
a relatively comprehensive original list of 444 genes that result to be up- or down-
regulated from NF-B. Gene products and relative UniProt identifiers are obtained
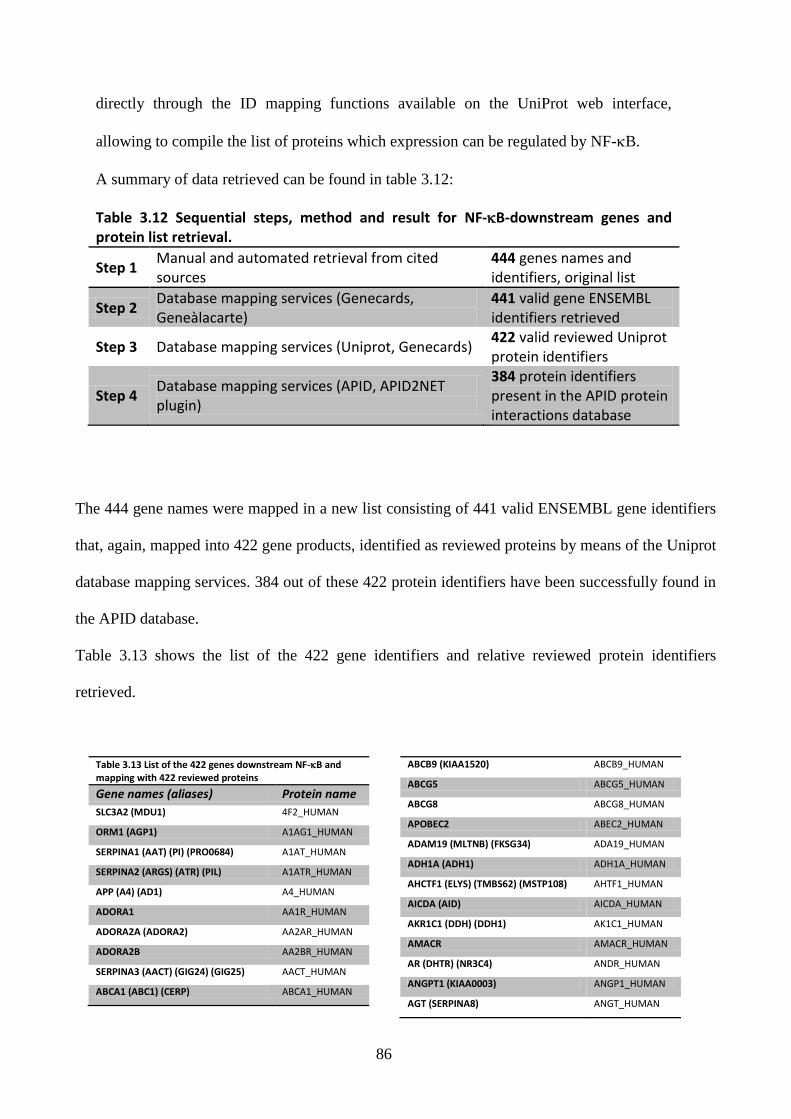
86
directly through the ID mapping functions available on the UniProt web interface,
allowing to compile the list of proteins which expression can be regulated by NF-B.
A summary of data retrieved can be found in table 3.12:
Table 3.12 Sequential steps, method and result for NF-B-downstream genes and protein list retrieval.
Step 1 Manual and automated retrieval from cited sources
444 genes names and identifiers, original list
Step 2 Database mapping services (Genecards, Geneàlacarte)
441 valid gene ENSEMBL identifiers retrieved
Step 3 Database mapping services (Uniprot, Genecards) 422 valid reviewed Uniprot protein identifiers
Step 4 Database mapping services (APID, APID2NET plugin)
384 protein identifiers present in the APID protein interactions database
The 444 gene names were mapped in a new list consisting of 441 valid ENSEMBL gene identifiers
that, again, mapped into 422 gene products, identified as reviewed proteins by means of the Uniprot
database mapping services. 384 out of these 422 protein identifiers have been successfully found in
the APID database.
Table 3.13 shows the list of the 422 gene identifiers and relative reviewed protein identifiers
retrieved.
Table 3.13 List of the 422 genes downstream NF-B and mapping with 422 reviewed proteins
Gene names (aliases) Protein name
SLC3A2 (MDU1) 4F2_HUMAN
ORM1 (AGP1) A1AG1_HUMAN
SERPINA1 (AAT) (PI) (PRO0684) A1AT_HUMAN
SERPINA2 (ARGS) (ATR) (PIL) A1ATR_HUMAN
APP (A4) (AD1) A4_HUMAN
ADORA1 AA1R_HUMAN
ADORA2A (ADORA2) AA2AR_HUMAN
ADORA2B AA2BR_HUMAN
SERPINA3 (AACT) (GIG24) (GIG25) AACT_HUMAN
ABCA1 (ABC1) (CERP) ABCA1_HUMAN
ABCB9 (KIAA1520) ABCB9_HUMAN
ABCG5 ABCG5_HUMAN
ABCG8 ABCG8_HUMAN
APOBEC2 ABEC2_HUMAN
ADAM19 (MLTNB) (FKSG34) ADA19_HUMAN
ADH1A (ADH1) ADH1A_HUMAN
AHCTF1 (ELYS) (TMBS62) (MSTP108) AHTF1_HUMAN
AICDA (AID) AICDA_HUMAN
AKR1C1 (DDH) (DDH1) AK1C1_HUMAN
AMACR AMACR_HUMAN
AR (DHTR) (NR3C4) ANDR_HUMAN
ANGPT1 (KIAA0003) ANGP1_HUMAN
AGT (SERPINA8) ANGT_HUMAN
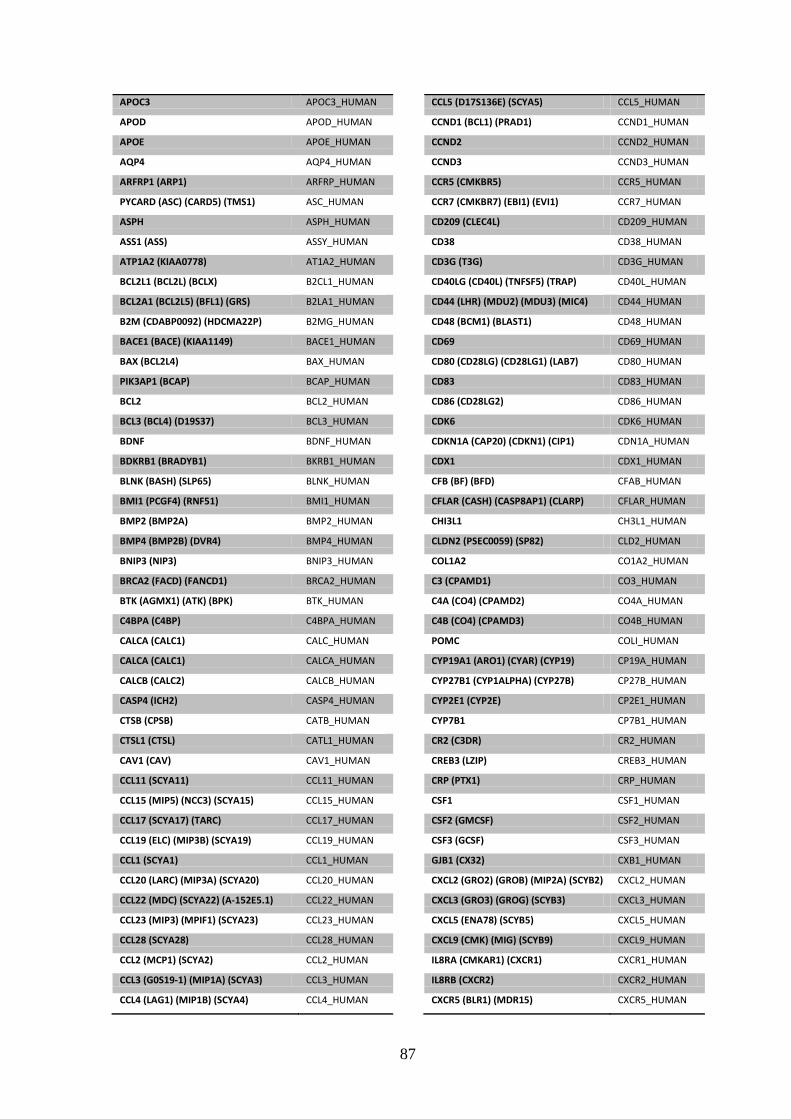
87
APOC3 APOC3_HUMAN
APOD APOD_HUMAN
APOE APOE_HUMAN
AQP4 AQP4_HUMAN
ARFRP1 (ARP1) ARFRP_HUMAN
PYCARD (ASC) (CARD5) (TMS1) ASC_HUMAN
ASPH ASPH_HUMAN
ASS1 (ASS) ASSY_HUMAN
ATP1A2 (KIAA0778) AT1A2_HUMAN
BCL2L1 (BCL2L) (BCLX) B2CL1_HUMAN
BCL2A1 (BCL2L5) (BFL1) (GRS) B2LA1_HUMAN
B2M (CDABP0092) (HDCMA22P) B2MG_HUMAN
BACE1 (BACE) (KIAA1149) BACE1_HUMAN
BAX (BCL2L4) BAX_HUMAN
PIK3AP1 (BCAP) BCAP_HUMAN
BCL2 BCL2_HUMAN
BCL3 (BCL4) (D19S37) BCL3_HUMAN
BDNF BDNF_HUMAN
BDKRB1 (BRADYB1) BKRB1_HUMAN
BLNK (BASH) (SLP65) BLNK_HUMAN
BMI1 (PCGF4) (RNF51) BMI1_HUMAN
BMP2 (BMP2A) BMP2_HUMAN
BMP4 (BMP2B) (DVR4) BMP4_HUMAN
BNIP3 (NIP3) BNIP3_HUMAN
BRCA2 (FACD) (FANCD1) BRCA2_HUMAN
BTK (AGMX1) (ATK) (BPK) BTK_HUMAN
C4BPA (C4BP) C4BPA_HUMAN
CALCA (CALC1) CALC_HUMAN
CALCA (CALC1) CALCA_HUMAN
CALCB (CALC2) CALCB_HUMAN
CASP4 (ICH2) CASP4_HUMAN
CTSB (CPSB) CATB_HUMAN
CTSL1 (CTSL) CATL1_HUMAN
CAV1 (CAV) CAV1_HUMAN
CCL11 (SCYA11) CCL11_HUMAN
CCL15 (MIP5) (NCC3) (SCYA15) CCL15_HUMAN
CCL17 (SCYA17) (TARC) CCL17_HUMAN
CCL19 (ELC) (MIP3B) (SCYA19) CCL19_HUMAN
CCL1 (SCYA1) CCL1_HUMAN
CCL20 (LARC) (MIP3A) (SCYA20) CCL20_HUMAN
CCL22 (MDC) (SCYA22) (A-152E5.1) CCL22_HUMAN
CCL23 (MIP3) (MPIF1) (SCYA23) CCL23_HUMAN
CCL28 (SCYA28) CCL28_HUMAN
CCL2 (MCP1) (SCYA2) CCL2_HUMAN
CCL3 (G0S19-1) (MIP1A) (SCYA3) CCL3_HUMAN
CCL4 (LAG1) (MIP1B) (SCYA4) CCL4_HUMAN
CCL5 (D17S136E) (SCYA5) CCL5_HUMAN
CCND1 (BCL1) (PRAD1) CCND1_HUMAN
CCND2 CCND2_HUMAN
CCND3 CCND3_HUMAN
CCR5 (CMKBR5) CCR5_HUMAN
CCR7 (CMKBR7) (EBI1) (EVI1) CCR7_HUMAN
CD209 (CLEC4L) CD209_HUMAN
CD38 CD38_HUMAN
CD3G (T3G) CD3G_HUMAN
CD40LG (CD40L) (TNFSF5) (TRAP) CD40L_HUMAN
CD44 (LHR) (MDU2) (MDU3) (MIC4) CD44_HUMAN
CD48 (BCM1) (BLAST1) CD48_HUMAN
CD69 CD69_HUMAN
CD80 (CD28LG) (CD28LG1) (LAB7) CD80_HUMAN
CD83 CD83_HUMAN
CD86 (CD28LG2) CD86_HUMAN
CDK6 CDK6_HUMAN
CDKN1A (CAP20) (CDKN1) (CIP1) CDN1A_HUMAN
CDX1 CDX1_HUMAN
CFB (BF) (BFD) CFAB_HUMAN
CFLAR (CASH) (CASP8AP1) (CLARP) CFLAR_HUMAN
CHI3L1 CH3L1_HUMAN
CLDN2 (PSEC0059) (SP82) CLD2_HUMAN
COL1A2 CO1A2_HUMAN
C3 (CPAMD1) CO3_HUMAN
C4A (CO4) (CPAMD2) CO4A_HUMAN
C4B (CO4) (CPAMD3) CO4B_HUMAN
POMC COLI_HUMAN
CYP19A1 (ARO1) (CYAR) (CYP19) CP19A_HUMAN
CYP27B1 (CYP1ALPHA) (CYP27B) CP27B_HUMAN
CYP2E1 (CYP2E) CP2E1_HUMAN
CYP7B1 CP7B1_HUMAN
CR2 (C3DR) CR2_HUMAN
CREB3 (LZIP) CREB3_HUMAN
CRP (PTX1) CRP_HUMAN
CSF1 CSF1_HUMAN
CSF2 (GMCSF) CSF2_HUMAN
CSF3 (GCSF) CSF3_HUMAN
GJB1 (CX32) CXB1_HUMAN
CXCL2 (GRO2) (GROB) (MIP2A) (SCYB2) CXCL2_HUMAN
CXCL3 (GRO3) (GROG) (SCYB3) CXCL3_HUMAN
CXCL5 (ENA78) (SCYB5) CXCL5_HUMAN
CXCL9 (CMK) (MIG) (SCYB9) CXCL9_HUMAN
IL8RA (CMKAR1) (CXCR1) CXCR1_HUMAN
IL8RB (CXCR2) CXCR2_HUMAN
CXCR5 (BLR1) (MDR15) CXCR5_HUMAN
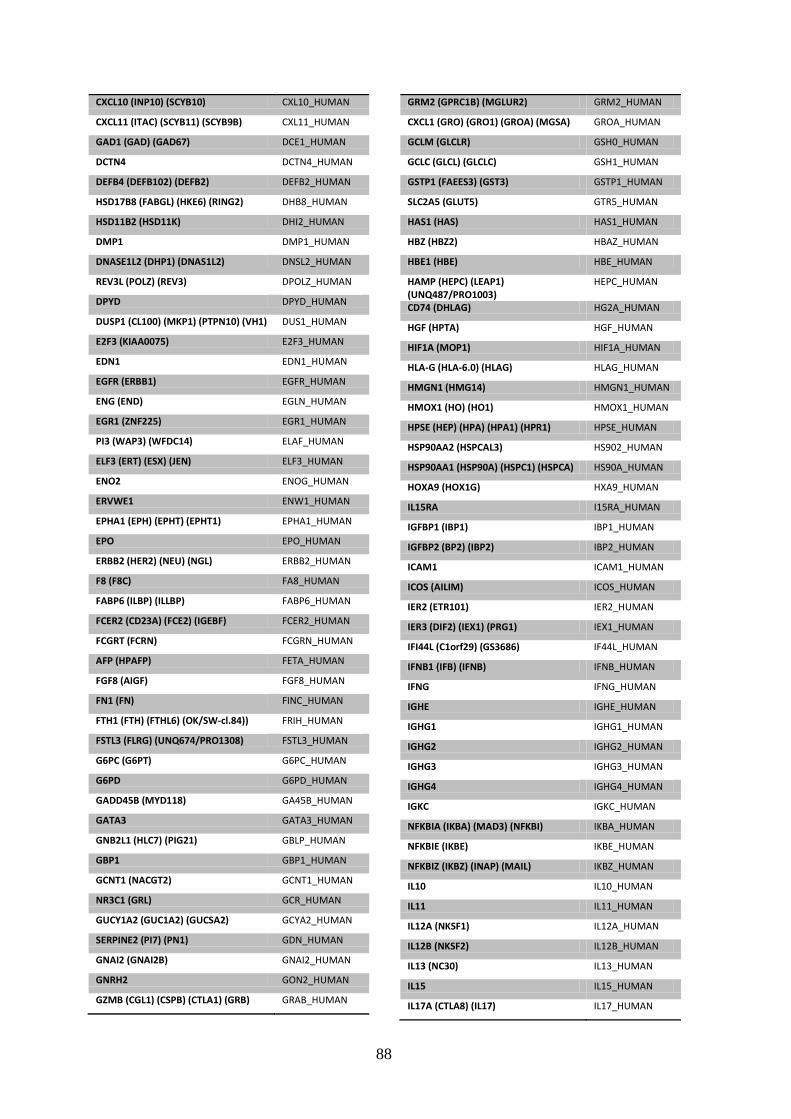
88
CXCL10 (INP10) (SCYB10) CXL10_HUMAN
CXCL11 (ITAC) (SCYB11) (SCYB9B) CXL11_HUMAN
GAD1 (GAD) (GAD67) DCE1_HUMAN
DCTN4 DCTN4_HUMAN
DEFB4 (DEFB102) (DEFB2) DEFB2_HUMAN
HSD17B8 (FABGL) (HKE6) (RING2) DHB8_HUMAN
HSD11B2 (HSD11K) DHI2_HUMAN
DMP1 DMP1_HUMAN
DNASE1L2 (DHP1) (DNAS1L2) DNSL2_HUMAN
REV3L (POLZ) (REV3) DPOLZ_HUMAN
DPYD DPYD_HUMAN
DUSP1 (CL100) (MKP1) (PTPN10) (VH1) DUS1_HUMAN
E2F3 (KIAA0075) E2F3_HUMAN
EDN1 EDN1_HUMAN
EGFR (ERBB1) EGFR_HUMAN
ENG (END) EGLN_HUMAN
EGR1 (ZNF225) EGR1_HUMAN
PI3 (WAP3) (WFDC14) ELAF_HUMAN
ELF3 (ERT) (ESX) (JEN) ELF3_HUMAN
ENO2 ENOG_HUMAN
ERVWE1 ENW1_HUMAN
EPHA1 (EPH) (EPHT) (EPHT1) EPHA1_HUMAN
EPO EPO_HUMAN
ERBB2 (HER2) (NEU) (NGL) ERBB2_HUMAN
F8 (F8C) FA8_HUMAN
FABP6 (ILBP) (ILLBP) FABP6_HUMAN
FCER2 (CD23A) (FCE2) (IGEBF) FCER2_HUMAN
FCGRT (FCRN) FCGRN_HUMAN
AFP (HPAFP) FETA_HUMAN
FGF8 (AIGF) FGF8_HUMAN
FN1 (FN) FINC_HUMAN
FTH1 (FTH) (FTHL6) (OK/SW-cl.84)) FRIH_HUMAN
FSTL3 (FLRG) (UNQ674/PRO1308) FSTL3_HUMAN
G6PC (G6PT) G6PC_HUMAN
G6PD G6PD_HUMAN
GADD45B (MYD118) GA45B_HUMAN
GATA3 GATA3_HUMAN
GNB2L1 (HLC7) (PIG21) GBLP_HUMAN
GBP1 GBP1_HUMAN
GCNT1 (NACGT2) GCNT1_HUMAN
NR3C1 (GRL) GCR_HUMAN
GUCY1A2 (GUC1A2) (GUCSA2) GCYA2_HUMAN
SERPINE2 (PI7) (PN1) GDN_HUMAN
GNAI2 (GNAI2B) GNAI2_HUMAN
GNRH2 GON2_HUMAN
GZMB (CGL1) (CSPB) (CTLA1) (GRB) GRAB_HUMAN
GRM2 (GPRC1B) (MGLUR2) GRM2_HUMAN
CXCL1 (GRO) (GRO1) (GROA) (MGSA) GROA_HUMAN
GCLM (GLCLR) GSH0_HUMAN
GCLC (GLCL) (GLCLC) GSH1_HUMAN
GSTP1 (FAEES3) (GST3) GSTP1_HUMAN
SLC2A5 (GLUT5) GTR5_HUMAN
HAS1 (HAS) HAS1_HUMAN
HBZ (HBZ2) HBAZ_HUMAN
HBE1 (HBE) HBE_HUMAN
HAMP (HEPC) (LEAP1) (UNQ487/PRO1003)
HEPC_HUMAN
CD74 (DHLAG) HG2A_HUMAN
HGF (HPTA) HGF_HUMAN
HIF1A (MOP1) HIF1A_HUMAN
HLA-G (HLA-6.0) (HLAG) HLAG_HUMAN
HMGN1 (HMG14) HMGN1_HUMAN
HMOX1 (HO) (HO1) HMOX1_HUMAN
HPSE (HEP) (HPA) (HPA1) (HPR1) HPSE_HUMAN
HSP90AA2 (HSPCAL3) HS902_HUMAN
HSP90AA1 (HSP90A) (HSPC1) (HSPCA) HS90A_HUMAN
HOXA9 (HOX1G) HXA9_HUMAN
IL15RA I15RA_HUMAN
IGFBP1 (IBP1) IBP1_HUMAN
IGFBP2 (BP2) (IBP2) IBP2_HUMAN
ICAM1 ICAM1_HUMAN
ICOS (AILIM) ICOS_HUMAN
IER2 (ETR101) IER2_HUMAN
IER3 (DIF2) (IEX1) (PRG1) IEX1_HUMAN
IFI44L (C1orf29) (GS3686) IF44L_HUMAN
IFNB1 (IFB) (IFNB) IFNB_HUMAN
IFNG IFNG_HUMAN
IGHE IGHE_HUMAN
IGHG1 IGHG1_HUMAN
IGHG2 IGHG2_HUMAN
IGHG3 IGHG3_HUMAN
IGHG4 IGHG4_HUMAN
IGKC IGKC_HUMAN
NFKBIA (IKBA) (MAD3) (NFKBI) IKBA_HUMAN
NFKBIE (IKBE) IKBE_HUMAN
NFKBIZ (IKBZ) (INAP) (MAIL) IKBZ_HUMAN
IL10 IL10_HUMAN
IL11 IL11_HUMAN
IL12A (NKSF1) IL12A_HUMAN
IL12B (NKSF2) IL12B_HUMAN
IL13 (NC30) IL13_HUMAN
IL15 IL15_HUMAN
IL17A (CTLA8) (IL17) IL17_HUMAN

89
IL1A (IL1F1) IL1A_HUMAN
IL1B (IL1F2) IL1B_HUMAN
IL1RN (IL1F3) (IL1RA) IL1RA_HUMAN
IL23A (SGRF) (UNQ2498/PRO5798) IL23A_HUMAN
IL27 (IL27A) IL27A_HUMAN
EBI3 (IL27B) IL27B_HUMAN
IL2 IL2_HUMAN
IL2RA IL2RA_HUMAN
IL32 (NK4) (TAIF) IL32_HUMAN
IL6 (IFNB2) IL6_HUMAN
IL8 (CXCL8) IL8_HUMAN
IL9 IL9_HUMAN
SERPINB1 (ELANH2) (MNEI) (PI2) ILEU_HUMAN
INHBA INHBA_HUMAN
DIO2 (ITDI2) (TXDI2) IOD2_HUMAN
IRF1 IRF1_HUMAN
IRF2 IRF2_HUMAN
IRF4 (MUM1) IRF4_HUMAN
IRF7 IRF7_HUMAN
F11R (JAM1) (JCAM) (UNQ264/PRO301)
JAM1_HUMAN
JMJD3 (KDM6B) (KIAA0346) JMJD3_HUMAN
JUNB JUNB_HUMAN
KRT15 (KRTB) K1C15_HUMAN
KRT3 K2C3_HUMAN
KRT5 K2C5_HUMAN
KRT6B (K6B) (KRTL1) K2C6B_HUMAN
KCNK5 (TASK2) KCNK5_HUMAN
KCNN2 KCNN2_HUMAN
KISS1 (PP5098) KISS1_HUMAN
KLF10 (TIEG) (TIEG1) KLF10_HUMAN
KLK3 (APS) KLK3_HUMAN
PRKCD KPCD_HUMAN
LAMB2 (LAMS) LAMB2_HUMAN
LBP LBP_HUMAN
LEF1 LEF1_HUMAN
LGALS3 (MAC2) LEG3_HUMAN
LIPG (UNQ387/PRO719) LIPE_HUMAN
ALOX12 (LOG12) LOX12_HUMAN
ALOX5 (LOG5) LOX5_HUMAN
SELE (ELAM1) LYAM2_HUMAN
SELP (GMRP) (GRMP) LYAM3_HUMAN
LYZ (LZM) LYSC_HUMAN
MAP4K1 (HPK1) M4K1_HUMAN
MADCAM1 MADCA_HUMAN
MBP MBP_HUMAN
ABCB1 (MDR1) (PGY1) MDR1_HUMAN
ABCB4 (MDR3) (PGY3) MDR3_HUMAN
AMH (MIF) MIS_HUMAN
MDK (MK1) (NEGF2) MK_HUMAN
MMP1 (CLG) MMP1_HUMAN
MMP3 (STMY1) MMP3_HUMAN
MMP9 (CLG4B) MMP9_HUMAN
SLC16A1 (MCT1) MOT1_HUMAN
ABCC6 (ARA) (MRP6) MRP6_HUMAN
MT3 MT3_HUMAN
MTHFR MTHR_HUMAN
MUC2 (SMUC) MUC2_HUMAN
MX1 MX1_HUMAN
MYB MYB_HUMAN
MYC MYC_HUMAN
MYLK (MLCK) MYLK_HUMAN
MYOZ1 (MYOZ) MYOZ1_HUMAN
NLRP2 (NALP2) (NBS1) (PAN1) (PYPAF2)
NALP2_HUMAN
ART1 NAR1_HUMAN
NCAM1 (NCAM) NCAM1_HUMAN
NFKB1 NFKB1_HUMAN
NFKB2 (LYT10) NFKB2_HUMAN
LCN2 (HNL) (NGAL) NGAL_HUMAN
NGF (NGFB) NGF_HUMAN
TACR1 (NK1R) (TAC1R) NK1R_HUMAN
FAM148A (NLF1) NLF1_HUMAN
GRIN2A (NMDAR2A) NMDE1_HUMAN
GRIN1 (NMDAR1) NMDZ1_HUMAN
NOD2 (CARD15) (IBD1) NOD2_HUMAN
NOS1 NOS1_HUMAN
NOS2 (NOS2A) NOS2_HUMAN
NPY1R (NPYR) (NPYY1) NPY1R_HUMAN
NQO1 (DIA4) (NMOR1) NQO1_HUMAN
NR4A2 (NOT) (NURR1) (TINUR) NR4A2_HUMAN
SLC11A2 (NRAMP2) (OK/SW-cl.20) NRAM2_HUMAN
NRG1 (GGF) (HGL) (HRGA) (NDF) NRG1_HUMAN
NUAK2 (SNARK) NUAK2_HUMAN
OLR1 (LOX1) OLR1_HUMAN
OPRD1 (OPRD) OPRD_HUMAN
OPRM1 (MOR1) OPRM_HUMAN
OPN1SW (BCP) OPSB_HUMAN
SPP1 (BNSP) (OPN) (PSEC0156) OSTP_HUMAN
OXTR OXYR_HUMAN
TP53 (P53) P53_HUMAN
PLA2G4C PA24C_HUMAN
PAFAH2 PAFA2_HUMAN
SERPINE1 (PAI1) (PLANH1) PAI1_HUMAN

90
PAX8 PAX8_HUMAN
CD274 (B7H1) (PDCD1L1) (PDCD1LG1) PD1L1_HUMAN
PDE7A PDE7A_HUMAN
PDGFB (PDGF2) (SIS) PDGFB_HUMAN
PDYN PDYN_HUMAN
PENK PENK_HUMAN
PRF1 (PFP) PERF_HUMAN
PTGS2 (COX2) PGH2_HUMAN
PGK1 (PGKA) (MIG10) (OK/SW-cl.110) PGK1_HUMAN
PGLYRP1 (PGLYRP) (PGRP) (TNFSF3L) PGRP_HUMAN
BGN (SLRR1A) PGS1_HUMAN
PIGF PIGF_HUMAN
PIGR PIGR_HUMAN
PIM1 PIM1_HUMAN
PIK3CA PK3CA_HUMAN
PLCD1 PLCD1_HUMAN
PLK3 (CNK) (FNK) (PRK) PLK3_HUMAN
PPP5C (PPP5) PPP5_HUMAN
PRDM1 (BLIMP1) PRDM1_HUMAN
PGR (NR3C3) PRGR_HUMAN
PRL PRL_HUMAN
PSMA2 (PSC3) PSA2_HUMAN
PSMB9 (LMP2) (RING12) PSB9_HUMAN
PSME1 (IFI5111) PSME1_HUMAN
PSME2 PSME2_HUMAN
PTAFR (PAFR) PTAFR_HUMAN
PTEN (MMAC1) (TEP1) PTEN_HUMAN
PTGDS (PDS) PTGDS_HUMAN
PTGES (MGST1L1) (PGES) (PIG12) PTGES_HUMAN
PTGIS (CYP8) (CYP8A1) PTGIS_HUMAN
PTHLH (PTHRP) PTHR_HUMAN
PTPN13 (PNP1) (PTP1E) (PTPL1) PTN13_HUMAN
PTPN1 (PTP1B) PTN1_HUMAN
PTS PTPS_HUMAN
PTX3 (TNFAIP5) (TSG14) PTX3_HUMAN
RAG1 (RNF74) RAG1_HUMAN
RAG2 RAG2_HUMAN
AGER (RAGE) RAGE_HUMAN
RBBP4 (RBAP48) RBBP4_HUMAN
RDH5 (RDH1) RDH1_HUMAN
REL REL_HUMAN
RELB RELB_HUMAN
RIPK2 (CARDIAK) (RICK) (RIP2) RIPK2_HUMAN
S100A4 (CAPL) (MTS1) S10A4_HUMAN
S100A6 (CACY) S10A6_HUMAN
S100A10 (ANX2LG) (CAL1L) (CLP11) S10AA_HUMAN
SAA3P (SAA3) SAA3_HUMAN
SAA1; SAA2 SAA_HUMAN
SAT1 (SAT) SAT1_HUMAN
SLC6A6 SC6A6_HUMAN
KITLG (MGF) (SCF) SCF_HUMAN
SCNN1A (SCNN1) SCNNA_HUMAN
SDC4 SDC4_HUMAN
SELS (VIMP) (AD-015) (SBBI8) SELS_HUMAN
SH3BGRL SH3L1_HUMAN
ST8SIA1 (SIAT8) (SIAT8A) SIA8A_HUMAN
ST6GAL1 (SIAT1) SIAT1_HUMAN
SKP2 (FBXL1) SKP2_HUMAN
NRG1 (GGF) (HGL) (HRGA) (NDF) SMDF_HUMAN
SNAI1 (SNAH) SNAI1_HUMAN
SOD1 SODC_HUMAN
SOD2 SODM_HUMAN
SOX9 SOX9_HUMAN
SP7 (OSX) SP7_HUMAN
SPATA19 (SPERGEN1) SPT19_HUMAN
STAT5A (STAT5) STA5A_HUMAN
SUPV3L1 (SUV3) SUV3_HUMAN
TAP1 (ABCB2) (PSF1) (RING4) (Y3) TAP1_HUMAN
TICAM1 (PRVTIRB) (TRIF) TCAM1_HUMAN
TNC (HXB) TENA_HUMAN
TERT (EST2) (TCS1) (TRT) TERT_HUMAN
F3 TF_HUMAN
TFEC (TCFEC) (TFECL) TFEC_HUMAN
TFF3 (ITF) (TFI) TFF3_HUMAN
TFPI2 TFPI2_HUMAN
TGM1 (KTG) TGM1_HUMAN
TGM2 TGM2_HUMAN
TIFA (T2BP) TIFA_HUMAN
TLR2 (TIL4) TLR2_HUMAN
TLR9 (UNQ5798/PRO19605) TLR9_HUMAN
TNFSF13B (BAFF) (BLYS) (TALL1) TN13B_HUMAN
TNFAIP2 TNAP2_HUMAN
TNFAIP3 TNAP3_HUMAN
TNFSF10 (APO2L) (TRAIL) TNF10_HUMAN
TNFSF15 (TL1) (VEGI) TNF15_HUMAN
TNF (TNFA) (TNFSF2) TNFA_HUMAN
LTA (TNFB) (TNFSF1) TNFB_HUMAN
LTB (TNFC) (TNFSF3) TNFC_HUMAN
FASLG (APT1LG1) (FASL) (TNFSF6) TNFL6_HUMAN
TNIP1 (KIAA0113) (NAF1) TNIP1_HUMAN
TNIP3 (ABIN3) (LIND) TNIP3_HUMAN
TNFRSF1B (TNFBR) (TNFR2) TNR1B_HUMAN
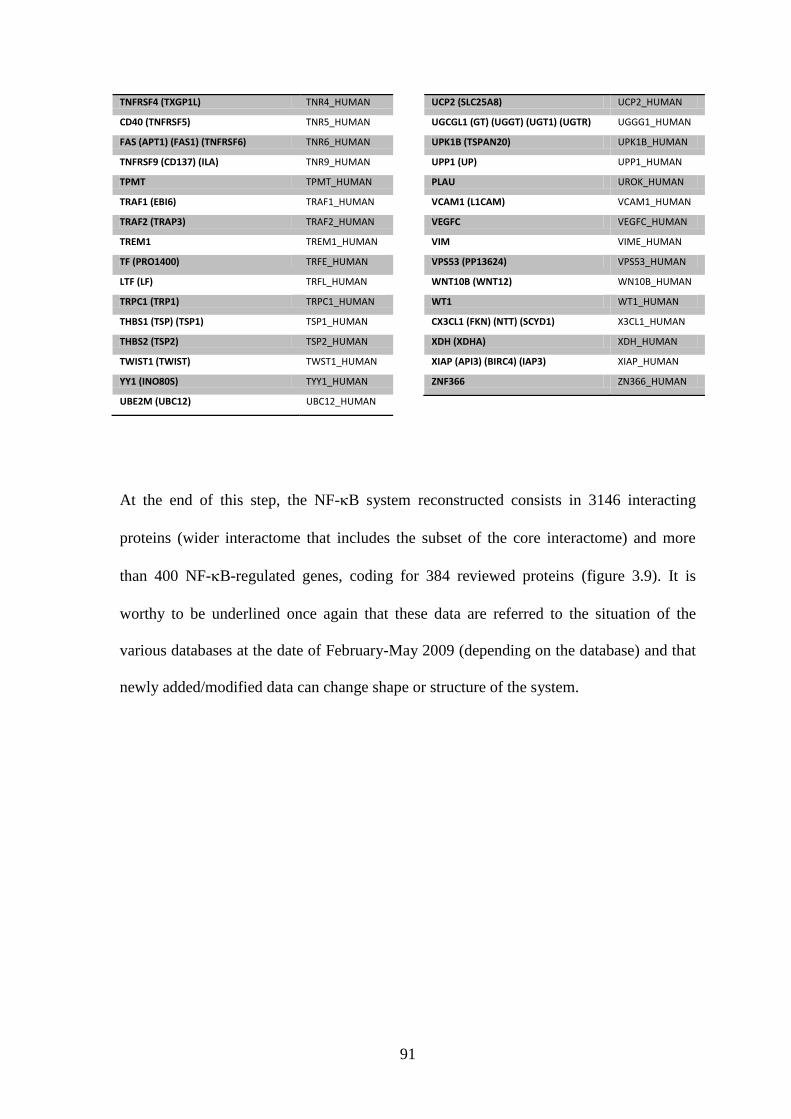
91
TNFRSF4 (TXGP1L) TNR4_HUMAN
CD40 (TNFRSF5) TNR5_HUMAN
FAS (APT1) (FAS1) (TNFRSF6) TNR6_HUMAN
TNFRSF9 (CD137) (ILA) TNR9_HUMAN
TPMT TPMT_HUMAN
TRAF1 (EBI6) TRAF1_HUMAN
TRAF2 (TRAP3) TRAF2_HUMAN
TREM1 TREM1_HUMAN
TF (PRO1400) TRFE_HUMAN
LTF (LF) TRFL_HUMAN
TRPC1 (TRP1) TRPC1_HUMAN
THBS1 (TSP) (TSP1) TSP1_HUMAN
THBS2 (TSP2) TSP2_HUMAN
TWIST1 (TWIST) TWST1_HUMAN
YY1 (INO80S) TYY1_HUMAN
UBE2M (UBC12) UBC12_HUMAN
UCP2 (SLC25A8) UCP2_HUMAN
UGCGL1 (GT) (UGGT) (UGT1) (UGTR) UGGG1_HUMAN
UPK1B (TSPAN20) UPK1B_HUMAN
UPP1 (UP) UPP1_HUMAN
PLAU UROK_HUMAN
VCAM1 (L1CAM) VCAM1_HUMAN
VEGFC VEGFC_HUMAN
VIM VIME_HUMAN
VPS53 (PP13624) VPS53_HUMAN
WNT10B (WNT12) WN10B_HUMAN
WT1 WT1_HUMAN
CX3CL1 (FKN) (NTT) (SCYD1) X3CL1_HUMAN
XDH (XDHA) XDH_HUMAN
XIAP (API3) (BIRC4) (IAP3) XIAP_HUMAN
ZNF366 ZN366_HUMAN
At the end of this step, the NF-B system reconstructed consists in 3146 interacting
proteins (wider interactome that includes the subset of the core interactome) and more
than 400 NF-B-regulated genes, coding for 384 reviewed proteins (figure 3.9). It is
worthy to be underlined once again that these data are referred to the situation of the
various databases at the date of February-May 2009 (depending on the database) and that
newly added/modified data can change shape or structure of the system.
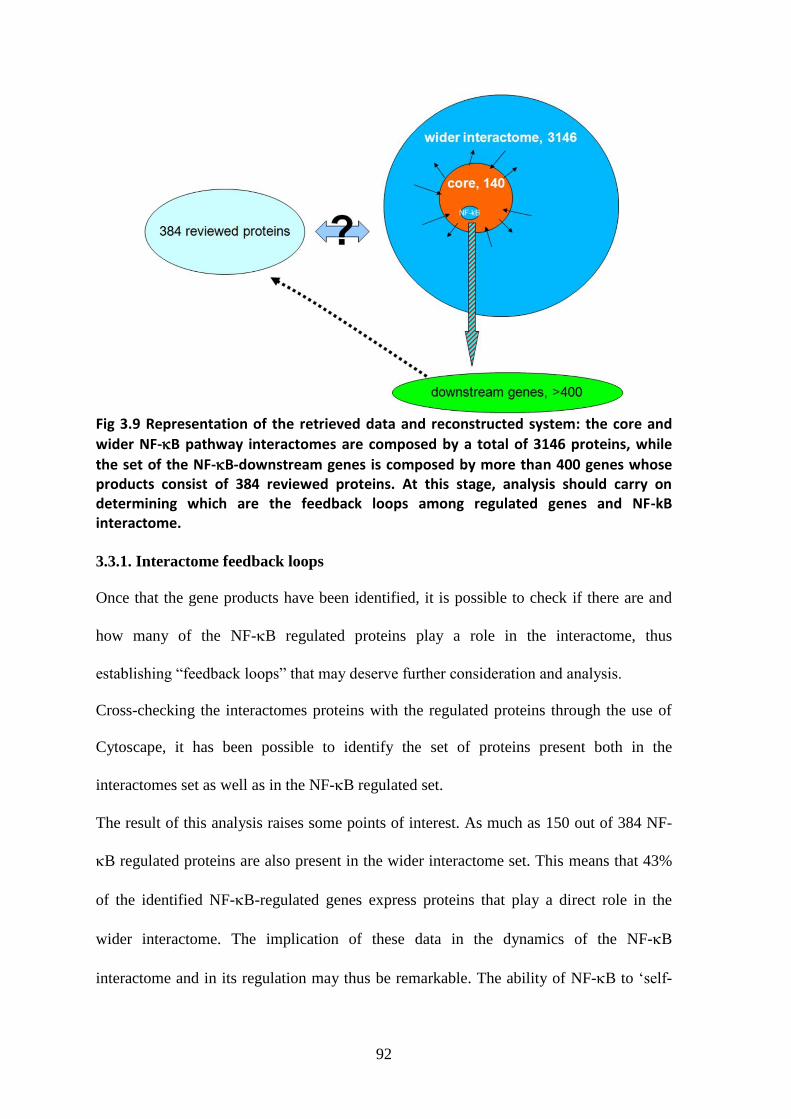
92
Fig 3.9 Representation of the retrieved data and reconstructed system: the core and
wider NF-B pathway interactomes are composed by a total of 3146 proteins, while
the set of the NF-B-downstream genes is composed by more than 400 genes whose products consist of 384 reviewed proteins. At this stage, analysis should carry on determining which are the feedback loops among regulated genes and NF-kB interactome. 3.3.1. Interactome feedback loops
Once that the gene products have been identified, it is possible to check if there are and
how many of the NF-B regulated proteins play a role in the interactome, thus
establishing “feedback loops” that may deserve further consideration and analysis.
Cross-checking the interactomes proteins with the regulated proteins through the use of
Cytoscape, it has been possible to identify the set of proteins present both in the
interactomes set as well as in the NF-B regulated set.
The result of this analysis raises some points of interest. As much as 150 out of 384 NF-
B regulated proteins are also present in the wider interactome set. This means that 43%
of the identified NF-B-regulated genes express proteins that play a direct role in the
wider interactome. The implication of these data in the dynamics of the NF-B
interactome and in its regulation may thus be remarkable. The ability of NF-B to „self-
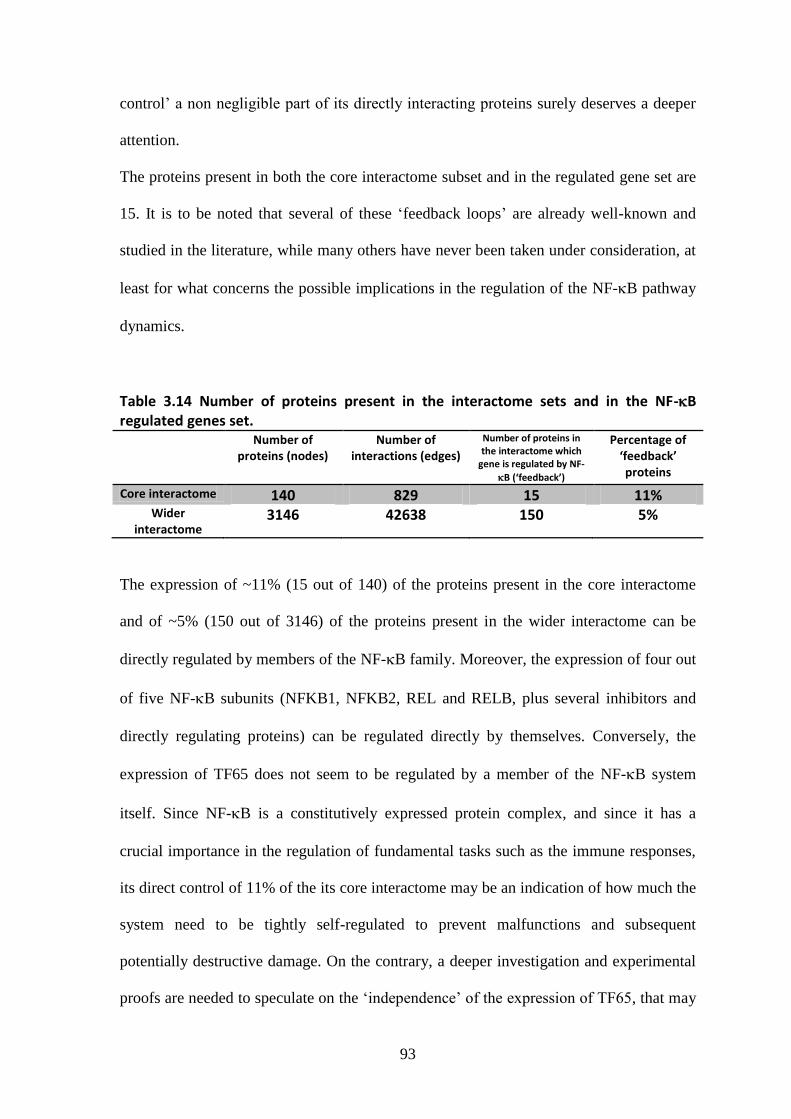
93
control‟ a non negligible part of its directly interacting proteins surely deserves a deeper
attention.
The proteins present in both the core interactome subset and in the regulated gene set are
15. It is to be noted that several of these „feedback loops‟ are already well-known and
studied in the literature, while many others have never been taken under consideration, at
least for what concerns the possible implications in the regulation of the NF-B pathway
dynamics.
Table 3.14 Number of proteins present in the interactome sets and in the NF-B regulated genes set.
Number of proteins (nodes)
Number of interactions (edges)
Number of proteins in the interactome which
gene is regulated by NF-
B (‘feedback’)
Percentage of ‘feedback’ proteins
Core interactome 140 829 15 11% Wider
interactome 3146 42638 150 5%
The expression of ~11% (15 out of 140) of the proteins present in the core interactome
and of ~5% (150 out of 3146) of the proteins present in the wider interactome can be
directly regulated by members of the NF-B family. Moreover, the expression of four out
of five NF-B subunits (NFKB1, NFKB2, REL and RELB, plus several inhibitors and
directly regulating proteins) can be regulated directly by themselves. Conversely, the
expression of TF65 does not seem to be regulated by a member of the NF-B system
itself. Since NF-B is a constitutively expressed protein complex, and since it has a
crucial importance in the regulation of fundamental tasks such as the immune responses,
its direct control of 11% of the its core interactome may be an indication of how much the
system need to be tightly self-regulated to prevent malfunctions and subsequent
potentially destructive damage. On the contrary, a deeper investigation and experimental
proofs are needed to speculate on the „independence‟ of the expression of TF65, that may
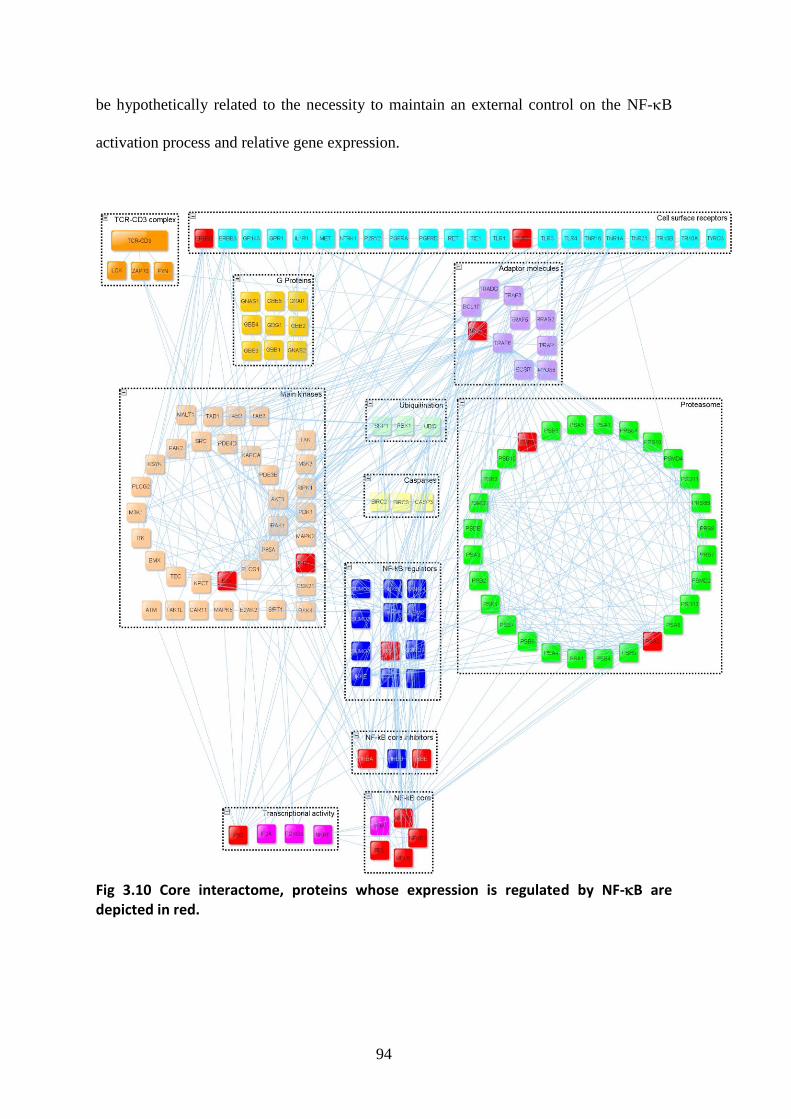
94
be hypothetically related to the necessity to maintain an external control on the NF-B
activation process and relative gene expression.
Fig 3.10 Core interactome, proteins whose expression is regulated by NF-B are depicted in red.
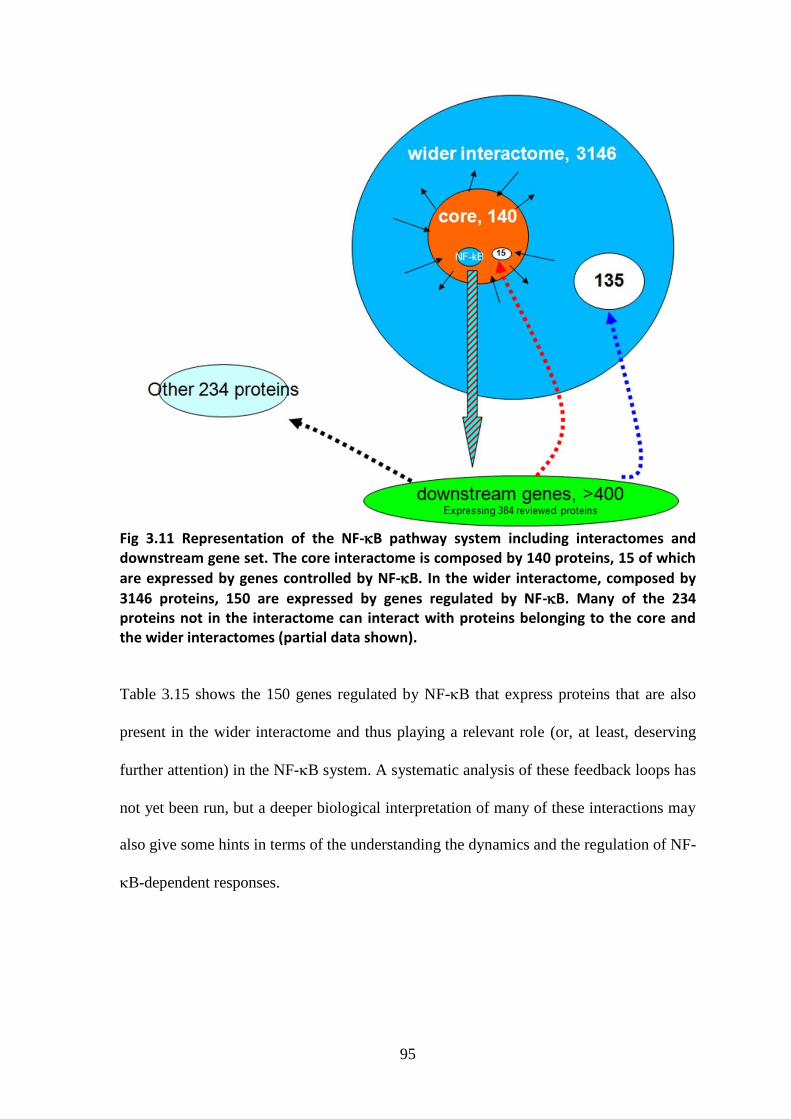
95
Fig 3.11 Representation of the NF-B pathway system including interactomes and downstream gene set. The core interactome is composed by 140 proteins, 15 of which
are expressed by genes controlled by NF-B. In the wider interactome, composed by
3146 proteins, 150 are expressed by genes regulated by NF-B. Many of the 234 proteins not in the interactome can interact with proteins belonging to the core and the wider interactomes (partial data shown).
Table 3.15 shows the 150 genes regulated by NF-B that express proteins that are also
present in the wider interactome and thus playing a relevant role (or, at least, deserving
further attention) in the NF-B system. A systematic analysis of these feedback loops has
not yet been run, but a deeper biological interpretation of many of these interactions may
also give some hints in terms of the understanding the dynamics and the regulation of NF-
B-dependent responses.
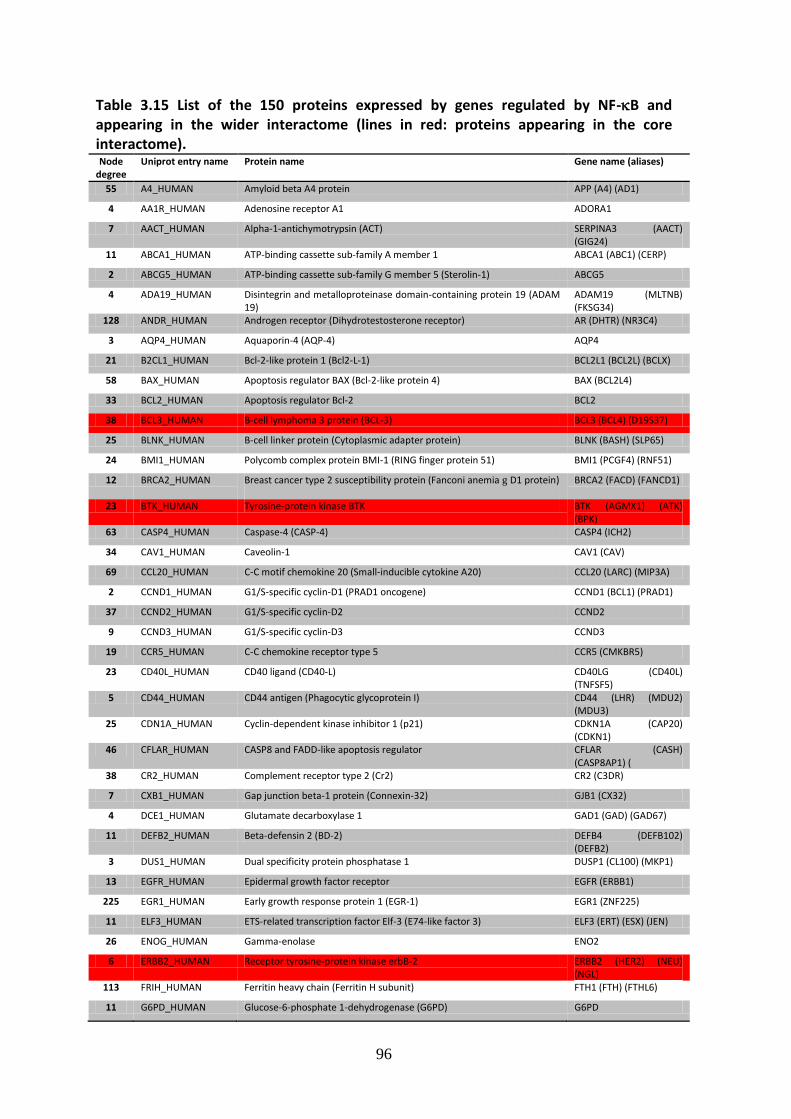
96
Table 3.15 List of the 150 proteins expressed by genes regulated by NF-B and appearing in the wider interactome (lines in red: proteins appearing in the core interactome). Node
degree Uniprot entry name Protein name Gene name (aliases)
55 A4_HUMAN Amyloid beta A4 protein APP (A4) (AD1)
4 AA1R_HUMAN Adenosine receptor A1 ADORA1
7 AACT_HUMAN Alpha-1-antichymotrypsin (ACT) SERPINA3 (AACT) (GIG24)
11 ABCA1_HUMAN ATP-binding cassette sub-family A member 1 ABCA1 (ABC1) (CERP)
2 ABCG5_HUMAN ATP-binding cassette sub-family G member 5 (Sterolin-1) ABCG5
4 ADA19_HUMAN Disintegrin and metalloproteinase domain-containing protein 19 (ADAM 19)
ADAM19 (MLTNB) (FKSG34)
128 ANDR_HUMAN Androgen receptor (Dihydrotestosterone receptor) AR (DHTR) (NR3C4)
3 AQP4_HUMAN Aquaporin-4 (AQP-4) AQP4
21 B2CL1_HUMAN Bcl-2-like protein 1 (Bcl2-L-1) BCL2L1 (BCL2L) (BCLX)
58 BAX_HUMAN Apoptosis regulator BAX (Bcl-2-like protein 4) BAX (BCL2L4)
33 BCL2_HUMAN Apoptosis regulator Bcl-2 BCL2
38 BCL3_HUMAN B-cell lymphoma 3 protein (BCL-3) BCL3 (BCL4) (D19S37)
25 BLNK_HUMAN B-cell linker protein (Cytoplasmic adapter protein) BLNK (BASH) (SLP65)
24 BMI1_HUMAN Polycomb complex protein BMI-1 (RING finger protein 51) BMI1 (PCGF4) (RNF51)
12 BRCA2_HUMAN Breast cancer type 2 susceptibility protein (Fanconi anemia g D1 protein) BRCA2 (FACD) (FANCD1)
23 BTK_HUMAN Tyrosine-protein kinase BTK BTK (AGMX1) (ATK) (BPK)
63 CASP4_HUMAN Caspase-4 (CASP-4) CASP4 (ICH2)
34 CAV1_HUMAN Caveolin-1 CAV1 (CAV)
69 CCL20_HUMAN C-C motif chemokine 20 (Small-inducible cytokine A20) CCL20 (LARC) (MIP3A)
2 CCND1_HUMAN G1/S-specific cyclin-D1 (PRAD1 oncogene) CCND1 (BCL1) (PRAD1)
37 CCND2_HUMAN G1/S-specific cyclin-D2 CCND2
9 CCND3_HUMAN G1/S-specific cyclin-D3 CCND3
19 CCR5_HUMAN C-C chemokine receptor type 5 CCR5 (CMKBR5)
23 CD40L_HUMAN CD40 ligand (CD40-L) CD40LG (CD40L) (TNFSF5)
5 CD44_HUMAN CD44 antigen (Phagocytic glycoprotein I) CD44 (LHR) (MDU2) (MDU3)
25 CDN1A_HUMAN Cyclin-dependent kinase inhibitor 1 (p21) CDKN1A (CAP20) (CDKN1)
46 CFLAR_HUMAN CASP8 and FADD-like apoptosis regulator CFLAR (CASH) (CASP8AP1) (
38 CR2_HUMAN Complement receptor type 2 (Cr2) CR2 (C3DR)
7 CXB1_HUMAN Gap junction beta-1 protein (Connexin-32) GJB1 (CX32)
4 DCE1_HUMAN Glutamate decarboxylase 1 GAD1 (GAD) (GAD67)
11 DEFB2_HUMAN Beta-defensin 2 (BD-2) DEFB4 (DEFB102) (DEFB2)
3 DUS1_HUMAN Dual specificity protein phosphatase 1 DUSP1 (CL100) (MKP1)
13 EGFR_HUMAN Epidermal growth factor receptor EGFR (ERBB1)
225 EGR1_HUMAN Early growth response protein 1 (EGR-1) EGR1 (ZNF225)
11 ELF3_HUMAN ETS-related transcription factor Elf-3 (E74-like factor 3) ELF3 (ERT) (ESX) (JEN)
26 ENOG_HUMAN Gamma-enolase ENO2
6 ERBB2_HUMAN Receptor tyrosine-protein kinase erbB-2 ERBB2 (HER2) (NEU) (NGL)
113 FRIH_HUMAN Ferritin heavy chain (Ferritin H subunit) FTH1 (FTH) (FTHL6)
11 G6PD_HUMAN Glucose-6-phosphate 1-dehydrogenase (G6PD) G6PD
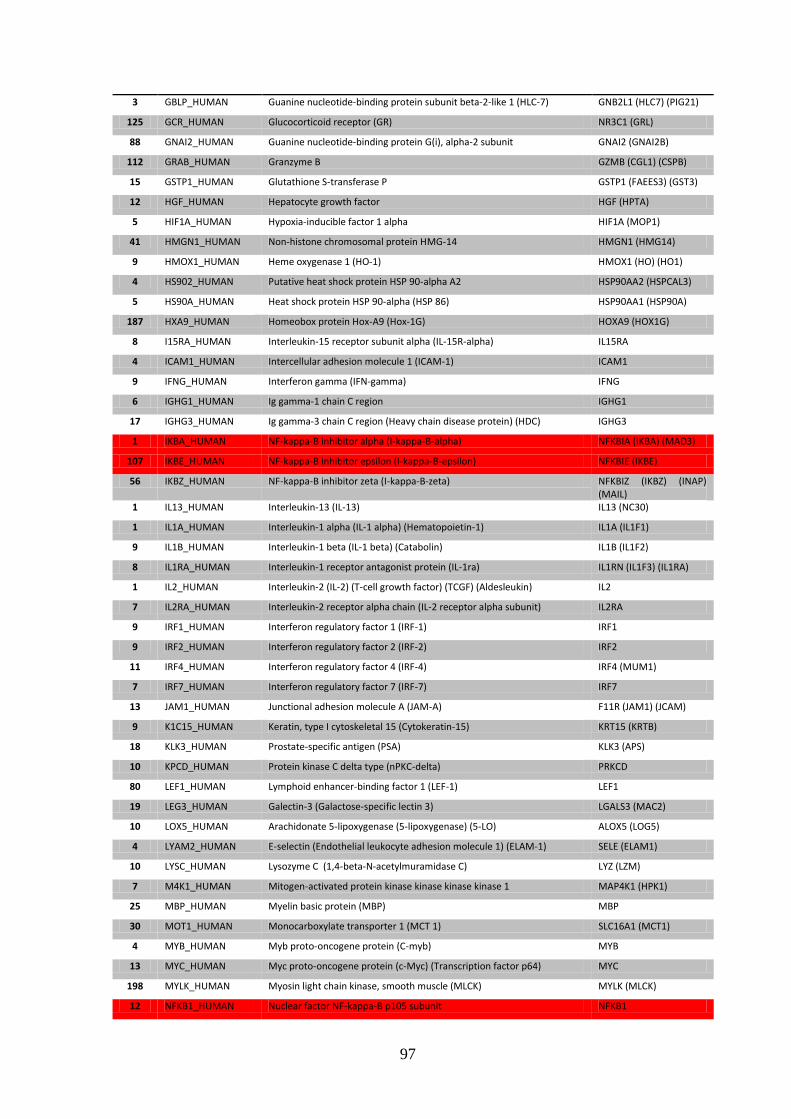
97
3 GBLP_HUMAN Guanine nucleotide-binding protein subunit beta-2-like 1 (HLC-7) GNB2L1 (HLC7) (PIG21)
125 GCR_HUMAN Glucocorticoid receptor (GR) NR3C1 (GRL)
88 GNAI2_HUMAN Guanine nucleotide-binding protein G(i), alpha-2 subunit GNAI2 (GNAI2B)
112 GRAB_HUMAN Granzyme B GZMB (CGL1) (CSPB)
15 GSTP1_HUMAN Glutathione S-transferase P GSTP1 (FAEES3) (GST3)
12 HGF_HUMAN Hepatocyte growth factor HGF (HPTA)
5 HIF1A_HUMAN Hypoxia-inducible factor 1 alpha HIF1A (MOP1)
41 HMGN1_HUMAN Non-histone chromosomal protein HMG-14 HMGN1 (HMG14)
9 HMOX1_HUMAN Heme oxygenase 1 (HO-1) HMOX1 (HO) (HO1)
4 HS902_HUMAN Putative heat shock protein HSP 90-alpha A2 HSP90AA2 (HSPCAL3)
5 HS90A_HUMAN Heat shock protein HSP 90-alpha (HSP 86) HSP90AA1 (HSP90A)
187 HXA9_HUMAN Homeobox protein Hox-A9 (Hox-1G) HOXA9 (HOX1G)
8 I15RA_HUMAN Interleukin-15 receptor subunit alpha (IL-15R-alpha) IL15RA
4 ICAM1_HUMAN Intercellular adhesion molecule 1 (ICAM-1) ICAM1
9 IFNG_HUMAN Interferon gamma (IFN-gamma) IFNG
6 IGHG1_HUMAN Ig gamma-1 chain C region IGHG1
17 IGHG3_HUMAN Ig gamma-3 chain C region (Heavy chain disease protein) (HDC) IGHG3
1 IKBA_HUMAN NF-kappa-B inhibitor alpha (I-kappa-B-alpha) NFKBIA (IKBA) (MAD3)
107 IKBE_HUMAN NF-kappa-B inhibitor epsilon (I-kappa-B-epsilon) NFKBIE (IKBE)
56 IKBZ_HUMAN NF-kappa-B inhibitor zeta (I-kappa-B-zeta) NFKBIZ (IKBZ) (INAP) (MAIL)
1 IL13_HUMAN Interleukin-13 (IL-13) IL13 (NC30)
1 IL1A_HUMAN Interleukin-1 alpha (IL-1 alpha) (Hematopoietin-1) IL1A (IL1F1)
9 IL1B_HUMAN Interleukin-1 beta (IL-1 beta) (Catabolin) IL1B (IL1F2)
8 IL1RA_HUMAN Interleukin-1 receptor antagonist protein (IL-1ra) IL1RN (IL1F3) (IL1RA)
1 IL2_HUMAN Interleukin-2 (IL-2) (T-cell growth factor) (TCGF) (Aldesleukin) IL2
7 IL2RA_HUMAN Interleukin-2 receptor alpha chain (IL-2 receptor alpha subunit) IL2RA
9 IRF1_HUMAN Interferon regulatory factor 1 (IRF-1) IRF1
9 IRF2_HUMAN Interferon regulatory factor 2 (IRF-2) IRF2
11 IRF4_HUMAN Interferon regulatory factor 4 (IRF-4) IRF4 (MUM1)
7 IRF7_HUMAN Interferon regulatory factor 7 (IRF-7) IRF7
13 JAM1_HUMAN Junctional adhesion molecule A (JAM-A) F11R (JAM1) (JCAM)
9 K1C15_HUMAN Keratin, type I cytoskeletal 15 (Cytokeratin-15) KRT15 (KRTB)
18 KLK3_HUMAN Prostate-specific antigen (PSA) KLK3 (APS)
10 KPCD_HUMAN Protein kinase C delta type (nPKC-delta) PRKCD
80 LEF1_HUMAN Lymphoid enhancer-binding factor 1 (LEF-1) LEF1
19 LEG3_HUMAN Galectin-3 (Galactose-specific lectin 3) LGALS3 (MAC2)
10 LOX5_HUMAN Arachidonate 5-lipoxygenase (5-lipoxygenase) (5-LO) ALOX5 (LOG5)
4 LYAM2_HUMAN E-selectin (Endothelial leukocyte adhesion molecule 1) (ELAM-1) SELE (ELAM1)
10 LYSC_HUMAN Lysozyme C (1,4-beta-N-acetylmuramidase C) LYZ (LZM)
7 M4K1_HUMAN Mitogen-activated protein kinase kinase kinase kinase 1 MAP4K1 (HPK1)
25 MBP_HUMAN Myelin basic protein (MBP) MBP
30 MOT1_HUMAN Monocarboxylate transporter 1 (MCT 1) SLC16A1 (MCT1)
4 MYB_HUMAN Myb proto-oncogene protein (C-myb) MYB
13 MYC_HUMAN Myc proto-oncogene protein (c-Myc) (Transcription factor p64) MYC
198 MYLK_HUMAN Myosin light chain kinase, smooth muscle (MLCK) MYLK (MLCK)
12 NFKB1_HUMAN Nuclear factor NF-kappa-B p105 subunit NFKB1
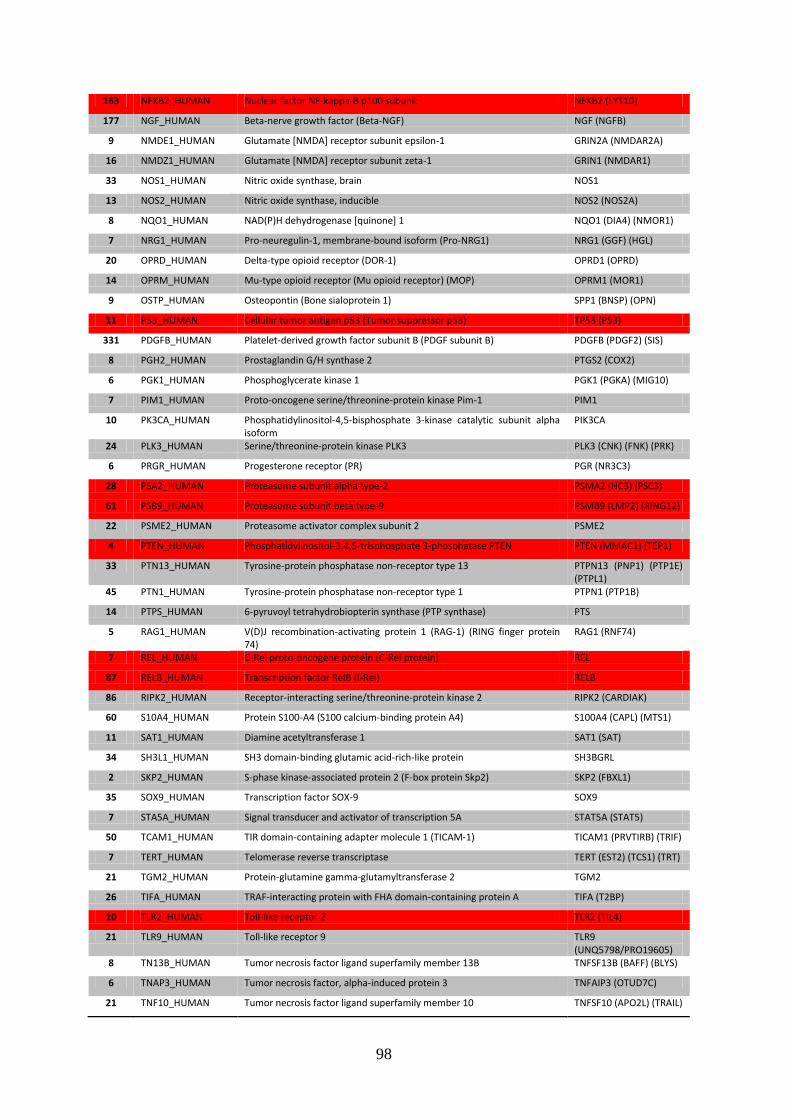
98
163 NFKB2_HUMAN Nuclear factor NF-kappa-B p100 subunit NFKB2 (LYT10)
177 NGF_HUMAN Beta-nerve growth factor (Beta-NGF) NGF (NGFB)
9 NMDE1_HUMAN Glutamate [NMDA] receptor subunit epsilon-1 GRIN2A (NMDAR2A)
16 NMDZ1_HUMAN Glutamate [NMDA] receptor subunit zeta-1 GRIN1 (NMDAR1)
33 NOS1_HUMAN Nitric oxide synthase, brain NOS1
13 NOS2_HUMAN Nitric oxide synthase, inducible NOS2 (NOS2A)
8 NQO1_HUMAN NAD(P)H dehydrogenase [quinone] 1 NQO1 (DIA4) (NMOR1)
7 NRG1_HUMAN Pro-neuregulin-1, membrane-bound isoform (Pro-NRG1) NRG1 (GGF) (HGL)
20 OPRD_HUMAN Delta-type opioid receptor (DOR-1) OPRD1 (OPRD)
14 OPRM_HUMAN Mu-type opioid receptor (Mu opioid receptor) (MOP) OPRM1 (MOR1)
9 OSTP_HUMAN Osteopontin (Bone sialoprotein 1) SPP1 (BNSP) (OPN)
11 P53_HUMAN Cellular tumor antigen p53 (Tumor suppressor p53) TP53 (P53)
331 PDGFB_HUMAN Platelet-derived growth factor subunit B (PDGF subunit B) PDGFB (PDGF2) (SIS)
8 PGH2_HUMAN Prostaglandin G/H synthase 2 PTGS2 (COX2)
6 PGK1_HUMAN Phosphoglycerate kinase 1 PGK1 (PGKA) (MIG10)
7 PIM1_HUMAN Proto-oncogene serine/threonine-protein kinase Pim-1 PIM1
10 PK3CA_HUMAN Phosphatidylinositol-4,5-bisphosphate 3-kinase catalytic subunit alpha isoform
PIK3CA
24 PLK3_HUMAN Serine/threonine-protein kinase PLK3 PLK3 (CNK) (FNK) (PRK)
6 PRGR_HUMAN Progesterone receptor (PR) PGR (NR3C3)
28 PSA2_HUMAN Proteasome subunit alpha type-2 PSMA2 (HC3) (PSC3)
61 PSB9_HUMAN Proteasome subunit beta type-9 PSMB9 (LMP2) (RING12)
22 PSME2_HUMAN Proteasome activator complex subunit 2 PSME2
4 PTEN_HUMAN Phosphatidylinositol-3,4,5-trisphosphate 3-phosphatase PTEN PTEN (MMAC1) (TEP1)
33 PTN13_HUMAN Tyrosine-protein phosphatase non-receptor type 13 PTPN13 (PNP1) (PTP1E) (PTPL1)
45 PTN1_HUMAN Tyrosine-protein phosphatase non-receptor type 1 PTPN1 (PTP1B)
14 PTPS_HUMAN 6-pyruvoyl tetrahydrobiopterin synthase (PTP synthase) PTS
5 RAG1_HUMAN V(D)J recombination-activating protein 1 (RAG-1) (RING finger protein 74)
RAG1 (RNF74)
7 REL_HUMAN C-Rel proto-oncogene protein (C-Rel protein) REL
87 RELB_HUMAN Transcription factor RelB (I-Rel) RELB
86 RIPK2_HUMAN Receptor-interacting serine/threonine-protein kinase 2 RIPK2 (CARDIAK)
60 S10A4_HUMAN Protein S100-A4 (S100 calcium-binding protein A4) S100A4 (CAPL) (MTS1)
11 SAT1_HUMAN Diamine acetyltransferase 1 SAT1 (SAT)
34 SH3L1_HUMAN SH3 domain-binding glutamic acid-rich-like protein SH3BGRL
2 SKP2_HUMAN S-phase kinase-associated protein 2 (F-box protein Skp2) SKP2 (FBXL1)
35 SOX9_HUMAN Transcription factor SOX-9 SOX9
7 STA5A_HUMAN Signal transducer and activator of transcription 5A STAT5A (STAT5)
50 TCAM1_HUMAN TIR domain-containing adapter molecule 1 (TICAM-1) TICAM1 (PRVTIRB) (TRIF)
7 TERT_HUMAN Telomerase reverse transcriptase TERT (EST2) (TCS1) (TRT)
21 TGM2_HUMAN Protein-glutamine gamma-glutamyltransferase 2 TGM2
26 TIFA_HUMAN TRAF-interacting protein with FHA domain-containing protein A TIFA (T2BP)
10 TLR2_HUMAN Toll-like receptor 2 TLR2 (TIL4)
21 TLR9_HUMAN Toll-like receptor 9 TLR9 (UNQ5798/PRO19605)
8 TN13B_HUMAN Tumor necrosis factor ligand superfamily member 13B TNFSF13B (BAFF) (BLYS)
6 TNAP3_HUMAN Tumor necrosis factor, alpha-induced protein 3 TNFAIP3 (OTUD7C)
21 TNF10_HUMAN Tumor necrosis factor ligand superfamily member 10 TNFSF10 (APO2L) (TRAIL)
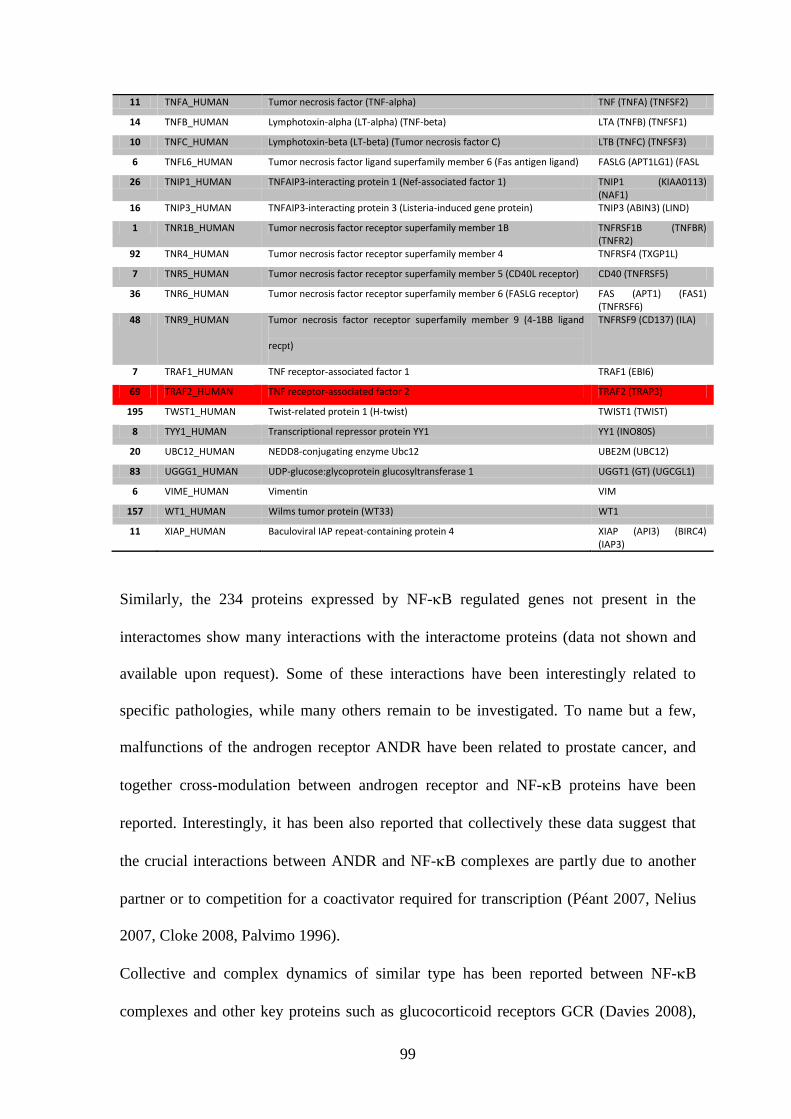
99
11 TNFA_HUMAN Tumor necrosis factor (TNF-alpha) TNF (TNFA) (TNFSF2)
14 TNFB_HUMAN Lymphotoxin-alpha (LT-alpha) (TNF-beta) LTA (TNFB) (TNFSF1)
10 TNFC_HUMAN Lymphotoxin-beta (LT-beta) (Tumor necrosis factor C) LTB (TNFC) (TNFSF3)
6 TNFL6_HUMAN Tumor necrosis factor ligand superfamily member 6 (Fas antigen ligand) FASLG (APT1LG1) (FASL
26 TNIP1_HUMAN TNFAIP3-interacting protein 1 (Nef-associated factor 1) TNIP1 (KIAA0113) (NAF1)
16 TNIP3_HUMAN TNFAIP3-interacting protein 3 (Listeria-induced gene protein) TNIP3 (ABIN3) (LIND)
1 TNR1B_HUMAN Tumor necrosis factor receptor superfamily member 1B TNFRSF1B (TNFBR) (TNFR2)
92 TNR4_HUMAN Tumor necrosis factor receptor superfamily member 4 TNFRSF4 (TXGP1L)
7 TNR5_HUMAN Tumor necrosis factor receptor superfamily member 5 (CD40L receptor) CD40 (TNFRSF5)
36 TNR6_HUMAN Tumor necrosis factor receptor superfamily member 6 (FASLG receptor) FAS (APT1) (FAS1) (TNFRSF6)
48 TNR9_HUMAN Tumor necrosis factor receptor superfamily member 9 (4-1BB ligand
recpt)
TNFRSF9 (CD137) (ILA)
7 TRAF1_HUMAN TNF receptor-associated factor 1 TRAF1 (EBI6)
69 TRAF2_HUMAN TNF receptor-associated factor 2 TRAF2 (TRAP3)
195 TWST1_HUMAN Twist-related protein 1 (H-twist) TWIST1 (TWIST)
8 TYY1_HUMAN Transcriptional repressor protein YY1 YY1 (INO80S)
20 UBC12_HUMAN NEDD8-conjugating enzyme Ubc12 UBE2M (UBC12)
83 UGGG1_HUMAN UDP-glucose:glycoprotein glucosyltransferase 1 UGGT1 (GT) (UGCGL1)
6 VIME_HUMAN Vimentin VIM
157 WT1_HUMAN Wilms tumor protein (WT33) WT1
11 XIAP_HUMAN Baculoviral IAP repeat-containing protein 4 XIAP (API3) (BIRC4) (IAP3)
Similarly, the 234 proteins expressed by NF-B regulated genes not present in the
interactomes show many interactions with the interactome proteins (data not shown and
available upon request). Some of these interactions have been interestingly related to
specific pathologies, while many others remain to be investigated. To name but a few,
malfunctions of the androgen receptor ANDR have been related to prostate cancer, and
together cross-modulation between androgen receptor and NF-B proteins have been
reported. Interestingly, it has been also reported that collectively these data suggest that
the crucial interactions between ANDR and NF-B complexes are partly due to another
partner or to competition for a coactivator required for transcription (Péant 2007, Nelius
2007, Cloke 2008, Palvimo 1996).
Collective and complex dynamics of similar type has been reported between NF-B
complexes and other key proteins such as glucocorticoid receptors GCR (Davies 2008),
100
or between Receptor-interacting serine/threonine-protein kinase 2 (RIPK2), Ubiquitin,
NEMO and IKKs (Hasegawa 2008), among several other examples. It is worthy to be
noted that all mentioned interactions have been duly evidenced in the network analysis
performed on the NF-B pathway system here reconstructed. It may be thus surmised that
the integrative work performed here can act as a heuristic basis for the discovery and the
deeper understanding of collective dynamics of complex systems such as the NF-B
pathway system.
101
4. Conclusion
________________________________________________________________________
4.1. Overview of obtained results
Considering the wide variety of extra- and intracellular events contributing to the
activation and the dynamics of NF-B signaling, the complexity of its entangled signaling
cascade, and the number and diversity of controlled genes, it has been a challenging task
to reconstruct and get a global view of its interactome, and to finally point out critical
proteins and feedback cycles that can potentially affect, impinge upon or determine
alterations in the intricate regulatory mechanisms of the NF-B signaling system.
Starting from literature and database-stored available data, a map of NF-B pathway-
related protein interactions has been reconstructed. This map is composed by a total of
140 proteins accounting for 829 protein interactions, including self-interactions. The
structure of this preliminary system is clearly depicted and includes many cell surface
receptors (including the TCR-CD3 complex) and several adaptor molecules immediately
downstream, many caspases, many G proteins, the main kinases, the NF-B family as
well as the NF-B family inhibitors and their direct regulators, all the proteins composing
the proteasome complex, some transcriptional activity proteins, and finally few proteins
with ubiquitination activity. All these proteins have been included in the NF-B pathway
interactome because they actively participate with different roles and at various stages to
the signaling cascade that leads to the NF-B transcription factor activation and
translocation.
On the basis of this “core interactome”, and using computational tools for automated data
retrieval, a “wider interactome” has been reconstructed, taking into account all the
proteins that show evidence of interaction with at least one belonging to the “core
102
interactome”. Running this process, the NF-B pathway wider interactome has been
reconstructed, resulting in a network of 3146 proteins accounting for more than 42000
interactions.
Accessing online available data, the list of the downstream NF-B regulated genes has
been compiled. The search gave back 422 valid ENSEMBL gene identifiers that map onto
a 384 reviewed proteins set. This set has been compared with the reconstructed NF-B
interactomes for the discovery of “protein expression signal cascade transcriptional
activation protein expression” feedback loops.
Network analysis and other omics analyses helped in determining and characterizing the
salient features of the networks, their peculiar architecture and the key nodes in terms of
the main topological parameters. Overrepresentations of particular Gene Ontology
categories gave some interesting clues on the composition of the interactomes, in terms of
belonging to given cellular compartment, or specific molecular functions and biological
processes, or also to evidence the participation of many proteins to other signaling
pathways than NF-B.
The feedback loops discovery analysis helped in determining a number of “self-
regulated” proteins, that is to say proteins that participate to the NF-B activation
signaling cascade and whose expression is in turn regulated by NF-B itself. While some
of these feedbacks were already well-known and characterized, many others remain not
yet studied and analyzed. It can be speculated that a number of these non exhaustively
studied feedback signals may be key controls for the NF-B dynamics and downstream
gene expression. Undoubtedly, in this sense, a simple and non exhaustive analysis of
several feedback cycles has evidenced promising hints about their role in ruling NF-B
signaling, and many others surely deserve more attention.
103
4.2. Feedback controls
As said, a major relevant result of this study is the determination of the so-called feedback
loops or controls. Their number and the nature of the proteins whose expression is
controlled by NF-B seem to suggest a distinctive structure of the whole NF-B system.
Conversely, a fundamental question should concern if number and “quality” of the
feedback loops appear by chance or if it is a peculiar characteristic of the NF-B
signaling system. Unfortunately, up to now, there is no further easily available data that
can help to solve this thesis. As explained, and notwithstanding the quantity and quality
of information at disposal on the internet, there is no plain solution for the integrated view
of such data nor for the reconstruction of complex objects such as signaling pathways
starting from omics data. As a consequence, the answer to the request for the comparison
of structures and architectures of complex pathways remains a non trivial question.
In the same manner, without the possibility to compare different pathways and without a
deeper analysis of the feedback, it is still difficult to answer to the question if the nature
of the feedback loops observed is in some way trivial or if they hide a specific cellular
function and a meaningful biological interpretation.
In this view, and speaking on a purely speculative plane, it is possible to consider the
ability of NF-B to self-regulate the expression of its subunits NFKB1, NFKB2, REL and
RELB as a form of self-control of such a complex system, while, at the same moment, to
regard the independence of the TF65 expression (it is the only non-self-regulated subunit)
from NF-B as a sort of counterbalanced need for external control. In this perspective, it
is worthy to be noted that TF65 hold a prominent topological position being the most
central subunit of the NF-B family in the wider interactome. Undoubtedly, further
integrative and experimental studies are needed to exhaustively respond to the questions
that arise from the study of the interactomes and the collective analysis of such data.

104
In the same way, from the deeper investigation of any single feedback loop, possibly
integrated with wet-lab experimental setup, as in the virtuous systems biology cycle,
many other similarly interesting results may be hopefully arise.
4.3. Further perspectives
As it can easily guessed, this kind of work is continuously in progress, since the available
knowledge and data grow and are modified practically on a daily basis. Thus, information
on proteins, interactions, network and pathways are highly dynamic and rapidly changing.
Therefore, a necessary task for the updated reconstruction and correct interpretation of
these complex objects is the continuous integration of newly created and modified data.
Automation of these kinds of tasks by means of computational tools and databases should
be made in the near future much easier, together with the much desirable improvement of
the quality and quantity of the available information. In special way, the meaningful
structure, arrangement and management of omics data is today a very topical problem,
since they still need to be dramatically improved and made more accessible.
From a technical point of view, another interesting perspective consists in the deeper
integration and further investigation of interaction data among the remaining 234 NF-B
regulated proteins and the interactomes, task that seems not to pose particular problems
but the time needed.
A (necessary) comparison of the such reconstructed NF-B interactomes with other
pathway interactome is timely and absolutely interesting. As said, since the reconstruction
and analysis procedures are still strewed with many hurdles, and thus structural and
topological differences and general comparative analyses should be postponed after the
completion of integrative work on other available pathway datasets. In this view, the
progress of methodological and strictly scientific perspectives are tightly joined together.
105
Being this study of a highly integrative and systemic nature, the combination of its
analytical steps and results with different approaches and methodologies is also desirable.
A nice addition would be an integrative co-expressed gene network analysis by means of
microarrays technology, that could be performed in a relatively easy way on the basis of
already available data or specific and suitable experimental setup.
Another fundamental type of information worthy to be integrated in such netowrks is that
relative to protein post-translational modifications (PTMs). PTMs are an extremely
important cellular control mechanism because it may alter proteins' physical and chemical
properties, folding, conformation, spatial distribution, stability, activity and consequently,
their biological functions. Biological effects of PTMs include phosphorylation for signal
transduction, glycosylation for changing protein half-life, targeting substrates, and
promoting cell-cell and cell-matrix interactions, among others. Biological
knowledgebases containing PTM information are not yet very common, but they may
play key roles in cell regulation and cellular signal elaboration research. More, this kind
of information may result fundamental for the implementation of dynamical and
predictive models of cellular information processing networks.
As said, complex biochemical intracellular signal transduction networks are basically
information processing network. The integrated characteristics of such networks confers
nontrivial decision-making ability to the cellular systems and finally to the cell. Likely,
decision-making functions are an emergent property of the entire system working in
concert. Thus, starting from static connectivity maps and interactomes of signal
transduction networks, a major step would consist in extending these initial and
fundamental results to the study of actual dynamics of large-scale systems (Helikar 2008).
In order to simulate and observe the dynamics of a system, the complete logic of each
node in the system, i.e. the set of the outputs in function of the set of the inputs, must be
106
taken into account. Unfortunately, today this kind of valuable information remains very
difficult to collect, store and make publicly available. On the other hand, the nature itself
of this kind of information is often ambiguous and unclear. Think for example how many
states (and function) could be taken by a single protein on the basis of its phosphorylation
sites, cellular location, time, and other key biological parameters. The full output
description of a single entity thus becomes a very hard task. As a consequence, the
implementation of even a simple dynamical model as a Boolean model (with only two
“on” or “off” output states) is hampered by non trivial difficulties. Again, enabling
methodologies and computational technologies for high-throughput and automated
information processing will facilitate and speed up this particularly interesting integrative
effort, leading to more and more accurate and potentially predictive models.
107
5 Notes
________________________________________________________________________
5.1 Notes on existing information representation stardards
Standards for representation of information about pathways are necessary for integration
and analysis of data from various sources.
XML (Extensible Markup Language) is a set of rules for encoding any kind of document
and information (and not only limited to the biological field) electronically. It is thus
suitable for very general purposes. It is defined in the XML 1.0 Specification produced by
the World Wide Web Consortium (W3C) and several other related specifications; all are
fee-free open standards. XML‟s design goals emphasize simplicity, generality, and
usability over the Internet. It is a textual data format, with strong support via Unicode for
the languages of the world. Although XML‟s design focuses on documents, it is widely
used for the representation of arbitrary data structures, for example in web services.
BioPAX (Biological Pathway Exchange - http://www.biopax.org) is a biological pathway
data exchange format. It enables the integration of diverse pathway resources by defining
an open file format specification for the exchange of biological pathway data. Widespread
adoption of BioPAX for data exchange will facilitate access to uniformity of pathway
data from varied sources, thereby increasing the efficiency of computational pathway
research.
The Systems Biology Markup Language (SBML - http://www.sbml.org) is a computer-
readable format for representing models of biological processes. It is mostly used for
dynamical models of metabolism, cell-signaling, and many other topics.
PSI-MI (Proteomics Standards Initiative-Molecular Interactions format –
http://www.psidev.info) is a standard proposed for improving the annotation and
108
representation of molecular interaction data wherever it is published, i.e. in journal
articles, authors‟ web-sites or public domain databases, and for improving the
accessibility of molecular interaction data to the user community.
The Gene Ontology project (http://www.geneontology.org/) is a major bioinformatics
initiative with the aim of standardizing the representation of gene and gene product
attributes across species and databases. The project provides a controlled vocabulary of
terms for describing gene product characteristics and gene product annotation data from
GO Consortium members, as well as tools to access and process this data.
5.2 List of cited online resources URLs
The following is an alphabetical and non-exhaustive list of the resources cited and used in
the described reconstruction and analysis process.
APID Agile Protein Interaction DataAnalyzer -
http://bioinfow.dep.usal.es/apid/index.htm
Ariadne Genomics Pathway Studio -
http://www.ariadnegenomics.com/products/pathway-studio/
BIND Biomolecular Interaction Network Database -
http://bond.unleashedinformatics.com/
BioCarta Pathways - http://www.biocarta.com/genes/index.asp
BioGRID The Biological General Repository for Interaction Datasets -
http://www.thebiogrid.org/
BiologicalNetworks - http://biologicalnetworks.net/
CellDesigner - http://www.celldesigner.org/
ClusterMaker - http://www.cgl.ucsf.edu/cytoscape/cluster/clusterMaker.html
109
Cytoscape - http://www.cytoscape.org/
DIP Database of Interacting Proteins - http://dip.doe-mbi.ucla.edu/dip/Main.cgi
Entrez Gene - http://www.ncbi.nlm.nih.gov/gene/
GenMAPP Gene Map Annotator and Pathway Profiler - http://www.genmapp.org/
Gorilla - http://cbl-gorilla.cs.technion.ac.il/
GraphWeb - http://biit.cs.ut.ee/graphweb/
HPRD Human Protein Reference Database - http://www.hprd.org/
HUBBA Hub objects analyzer - http://hub.iis.sinica.edu.tw/Hubba/
Ingenuity Systems - http://www.ingenuity.com/
IntAct - http://www.ebi.ac.uk/intact/
KEGG Kyoto Encyclopedia of Genes and Genomes - http://www.genome.jp/kegg/
MINT the Molecular INTeraction database - http://mint.bio.uniroma2.it/mint/
NCI-Nature Pathway Interaction Database - http://pid.nci.nih.gov/
NetPath - http://www.netpath.org/
NetworkAnalyzer - http://med.bioinf.mpi-inf.mpg.de/netanalyzer/
Pajek - http://vlado.fmf.uni-lj.si/pub/networks/pajek/
Pathguide: the pathway resource list - http://www.pathguide.org/
PathVisio - http://www.pathvisio.org/
Pathway Commons - http://www.pathwaycommons.org/
R Project for Statistical Computing - http://www.r-project.org/
Reactome - http://www.reactome.org/
SBW Systems Biology Workbench - http://sbw.sourceforge.net/
TRANSFAC & TRANSPATH - http://www.gene-regulation.com/
TRED Transcriptional Regulatory Element Database - http://rulai.cshl.edu/cgi-
bin/TRED/
110
UniProt - http://www.uniprot.org/
WikiPathways - http://www.wikipathways.org/index.php/WikiPathways
5.3 Bibliographic references for the compilation the core interactome
protein list
Barkett M, Gilmore TD - Control of apoptosis by Rel/NF-kappaB transcription factors – Oncogene
18(49):6910-24 (1999)
Bell S, Matthews JR, Jaffray E, Hay RT - I(kappa)B(gamma) inhibits DNA binding of NF-kappaB
p50 homodimers by interacting with residues that contact DNA - Molecular and cellular biology
16(11):6477-85 (1996)
Ben-Neriah Y. Regulatory functions of ubiquitination in the immune system. Nat Immunol, 2002,
3, 20-26.
Campbell KJ, O'Shea JM, Perkins ND. Differential regulation of NF-kappaB activation and
function by topoisomerase II inhibitors. BMC Cancer. 2006 Apr 21;6:101.
Chen LF, Greene WC. Shaping the nuclear action of NF-kappaB. Nat Rev Mol Cell Biol. 2004
May;5(5):392-401.
Chen Zj. Ubiquitin Signaling in the NF-κB Pathway. Nat Cell Biol. 2005 August ; 7(8): 758–765.
Cohen S, Achbert-Weiner H, Ciechanover A. Dual effects of IkappaB kinase beta-mediated
phosphorylation on p105 Fate: SCF(beta-TrCP)-dependent degradation and SCF(beta-TrCP)-
independent processing. Mol Cell Biol. 2004 Jan;24(1):475-86.
Dobrzanski P, Ryseck RP, Bravo R - Differential interactions of Rel-NF-kappa B complexes with I
kappa B alpha determine pools of constitutive and inducible NF-kappa B activity - The EMBO
Journal - 13(19):4608-16 (1994)
Donzé O, Deng J, Curran J, Sladek R, Picard D, Sonenberg N. The protein kinase PKR: a
molecular clock that sequentially activates survival and death programs. EMBO J. 2004 Feb
11;23(3):564-71.
Elliott PJ, Zollner TM, Boehncke WH. Proteasome inhibition: a new anti-inflammatory strategy. J
Mol Med. 2003 Apr;81(4):235-45.
Franzoso G, Bours V, Park S, Tomita-Yamaguchi M, Kelly K, Siebenlist U - The candidate
oncoprotein Bcl-3 is an antagonist of p50/NF-kappa B-mediated inhibition - Nature
359(6393):339-4 (1992)
Gilmore T, Gapuzan ME, Kalaitzidis D, Starczynowski D - Rel/NF-kappa B/I kappa B signal
transduction in the generation and treatment of human cancer - Cancer letters 181(1):1-9 (2002)
Häcker H, Karin M - Regulation and function of IKK and IKK-related kinases - Science's STKE:
signal transduction knowledge environment 2006(357):re13 (2006)
Hayden MS, Ghosh S - Signaling to NF-kappaB - Genes & development 18(18):2195-224 (2004)
Hinz M, Löser P, Mathas S, Krappmann D, Dörken B, Scheidereit C - Constitutive NF-kappaB
maintains high expression of a characteristic gene network, including CD40, CD86, and a set of
antiapoptotic genes in Hodgkin/Reed-Sternberg cells - Blood 97(9):2798-807 (2001)
Ishinaga H, Jono H, Lim JH, Kweon SM, Xu H, Ha UH, Xu H, Koga T, Yan C, Feng XH, Chen
LF, Li JD. TGF-beta induces p65 acetylation to enhance bacteria-induced NF-kappaB activation.
EMBO J. 2007 Feb 21;26(4):1150-62.
Krappmann D, Wegener E, Sunami Y, Esen M, Thiel A, Mordmuller B, Scheidereit C. The
IkappaB kinase complex and NF-kappaB act as master regulators of lipopolysaccharide-induced
111
gene expression and control subordinate activation of AP-1. Mol Cell Biol. 2004 Jul;24(14):6488-
500.
Malek S, Chen Y, Huxford T, Ghosh G - IkappaBbeta, but not IkappaBalpha, functions as a
classical cytoplasmic inhibitor of NF-kappaB dimers by masking both NF-kappaB nuclear
localization sequences in resting cells - The Journal of biological chemistry 276(48):45225-35
(2001)
Malek S, Huang DB, Huxford T, Ghosh S, Ghosh G - X-ray crystal structure of an IkappaBbeta x
NF-kappaB p65 homodimer complex - The Journal of biological chemistry 278(25):23094-100
(2003)
Moorthy AK, Savinova OV, Ho JQ, Wang VY, Vu D, Ghosh G. The 20S proteasome processes
NF-kappaB1 p105 into p50 in a translation-independent manner. EMBO J. 2006 May
3;25(9):1945-56. Epub 2006 Apr 13.
Pasparakis M Luedde T Schmidt-Supprian M. Dissection of the NF-kB signalling cascade in
transgenic and knockout mice. Cell Death and Differentiation (2006) 13, 861–872
Perkins ND - Integrating cell-signalling pathways with NF-kappaB and IKK function – Nature
reviews. Molecular cell biology - 8(1):49-62 (2007)
Pham LV, Tamayo AT, Yoshimura LC, Lin-Lee YC, Ford RJ - Constitutive NF-kappaB and
NFAT activation in aggressive B-cell lymphomas synergistically activates the CD154 gene and
maintains lymphoma cell survival - Blood 106(12):3940-7 (2005)
Rodriguez MS, Thompson J, Hay RT, Dargemont C - Nuclear retention of IkappaBalpha protects
it from signal-induced degradation and inhibits nuclear factor kappaB transcriptional activation –
The Journal of biological chemistry 74(13):9108-15 (1999)
Saccani S, Pantano S, Natoli G - Modulation of NF-kappaB activity by exchange of dimer -
Molecular cell 11(6):1563-74 (2003)
Salminen A, Huuskonen J, Ojala J, Kauppinen A, Kaarniranta K, Suuronen T - Activation of
innate immunity system during aging: NF-kB signaling is the molecular culprit of inflamm-aging –
Ageing research reviews 7(2):83-105 (2008)
Schmitz ML, Baeuerle PA - The p65 subunit is responsible for the strong transcription activating
potential of NF-kappa B - The EMBO journal 10(12):3805-17 (1991)
Taylor IW and Wrana JL - SnapShot: The TGF - Cell 133:378-378.e1
(2008)
Thompson JE, Phillips RJ, Erdjument-Bromage H, Tempst P, Ghosh S - I kappa B-beta regulates
the persistent response in a biphasic activation of NF-kappa B - Cell 80(4):573-82 (1995)
Ward KR, Zhang KX, Somasiri AM, Roskelley CD, Schrader JW. Expression of activated M-Ras
in a murine mammary epithelial cell line induces epithelial-mesenchymal transition and
tumorigenesis. Oncogene. 2004 Feb 12;23(6):1187-96. Erratum in: Oncogene. 2004 Nov
18;23(54):8858.
Wegener E et al. - Essential role for IkappaB kinase beta in remodeling Carma1-Bcl10-Malt1
complexes upon T cell activation - Molecular and cellular biology 23(1):13-23 (2006)
Weil R, Israel A. Deciphering the pathway from the TCR to NF-kB. Cell Death and Differentiation
(2006) 13, 826–833
Wertz IE et al. - De-ubiquitination and ubiquitin ligase domains of A20 downregulate NF-kappaB
signalling - Nature. 430(7000):694-9 (2004)
Whiteside ST, Epinat JC, Rice NR, Israël A - kappa B epsilon, a novel member of the I kappa B
family, controls RelA and cRel NF-kappa B activity - The EMBO journal 16(6):1413-26 (1997)
Wulczyn FG, Naumann M, Scheidereit C - Candidate proto-oncogene bcl-3 encodes a
subunitspecific inhibitor of transcription factor NF-kappaB - Nature 358(6387):597-9 (1992)

112
Acknowledgements
________________________________________________________________________
I thank Professor Claudio Franceschi, all the staff of the Immunology Section and „L
Galvani‟ Interdepartmental Center, and the doctorate‟s colleagues and friends for the
inspiration and the help in carrying on and writing this work. In particular, I thank A.
Termanini and E. Bellavista, especially for the initial steps of this work, and S. Salvioli
and A. de la Fuente for very useful additions, help, comments and feedback.
I also thank my family for spiritual (and material…) support during these three years.
Last but not least, a special thank to those persons always close to my heart: my friends,
they know who they are, and… yes. She.
113
References
________________________________________________________________________
Adriaens M.E., Jaillard M., Waagmeester A., Coort S.L.M., Pico A.R., Evelo
C.T.A. (2008) The public road to high-quality curated biological pathways. Drug
Discov Today 13, 856–862
Albert R., Jeong H., Barabasi A.L. (2000) Error and attack tolerance of complex
networks. Nature, 406, 378-382.
Alderson D.L., Li L., Willinger W., Doyle J.C. (2005) Understanding internet
topology: principles, models, and validation. IEEE/ACM Transactions on
Networking, 13, 1205–1218.
Alon U., Surette M.G., Barkai N., Leibler S. (1999) Robustness in bacterial
chemotaxis. Nature 397, 168-171.
Assenov, Y., Ramírez, F., Schelhorn, S.E., Lengauer, T., Albrecht, M. (2008)
Computing topological parameters of biological networks. Bioinformatics, 24,
282-284
Avila-Campillo I., Drew K., Lin J., Reiss D.J., Bonneau R. (2007) BioNetBuilder:
automatic integration of biological networks. Bioinformatics. 23, 392-3.
Bader G.D., Cary M.P., Sander C. (2006) Pathguide: a pathway resource list.
Nucleic Acids Res. 34, D504-6
Baitaluk M., Sedova M., Ray A., Gupta A. (2006) BiologicalNetworks:
visualization and analysis tool for systems biology. Nucleic Acids Res. 34, W466-
71
Barabasi A.L., Oltvai Z.N. (2004) Network biology: Understanding the cell's
functional organization. Nature Reviews Genetics, 5, 101-U15.
114
Barabasi AL, Albert R, (2002) Statistical mechanics of complex networks, Rev
Mod Phys,; 74, 47-97
Baranov VS, Baranova EV. (2007) Genetic aspects of aging. Adv Gerontol.;
20(2): 26-34.
Barbieri M, Ferrucci L, Ragno E, Corsi A, Bandinelli S, Bonafè M, et al. (2003)
Chronic inflammation andthe effect of IGF-I on muscle strength and power in
older persons. Am J Physiol Endocrinol Metab; 284(3): E481-7.
Batagelj, V., Mrvar A. (2003): Pajek - Analysis and Visualization of Large
Networks. in Jünger, M., Mutzel, P., (Eds.) Graph Drawing Software. Springer,
Berlin. 77-103
Bauer-Mehren A., Furlong L.I., Sanz F. (2009) Pathway databases and tools for
their exploitation: benefits, current limitations and challenges. Mol Syst Biol., 5,
290
Bhalla US, Iyengar R. (1999) Emergent properties of networks of biological
signaling pathways. Science, 283, 381-7
Bhalla U.S. (2003) Understanding complex signaling networks through models
and metaphors, Progress in Biophysics and Molecular Biology 81, 45-65
Bindea G., Mlecnik B., Hackl H., Charoentong P., Tosolini M., Kirilovsky A.,
Fridman W.H., Pagès F., Trajanoski Z., Galon J. (2009) ClueGO: a Cytoscape
plug-in to decipher functionally grouped gene ontology and pathway annotation
networks. Bioinformatics. 25, 1091-3.
Boccaletti S., Latora V., Moreno Y., Chavez M., Hwang D.U., (2006) Complex
networks: Structure and dynamics. Physics Reports-Review Section of Physics
Letters, 424, 175-308.
Bollobàs B, (2002) Modern Graph Theory, Springer Verlag, Berlin-New York.
115
Bray D. (1990) Intracellular signalling as a parallel distributed process. J Theor
Biol 143, 215-231.
Bray D. (1995). Protein molecules as computational elements in living cells.
Nature 376, 307-312
Butler RN, Miller RA, Perry D, Carnes BA, Williams TF, Cassel C et al. (2008)
New model of health promotion and disease prevention for the 21st century. BMJ;
337: a399.
Capri M, Salvioli S, Cevenini E, Celani L, Sevini F, Bellavista E, Lanzarini C,
Lukas S, Lescai F, Tieri P, Monti D, Franceschi C (2009) Aging and Longevity in
Animal Models and Humans, in: Life-Span Extension, Aging Medicine, Sell C et
al. eds., Springer/Humana Press, DOI: 10.1007/978-1-60327-507-1_11, 175-191
Cedersund G, Roll J. (2009) Systems biology: model based evaluation and
comparison of potential explanations for given biological data. FEBS J; 276(4):
903-22.
Ceol,A.,Chatr-Aryamontri,A.,Licata,L.,Cesareni,G., (2008) Linking entries in
protein interaction database to structured text: The FEBS Letters experiment.
FEBS Letters 582, 1171-1177.
Cevenini E, Invidia L, Lescai F, Salvioli S, Tieri P, Castellani G et al. (2008)
Human models of aging and longevity. Expert Opin Biol Ther; 8(9): 1393-405.
Cevenini E, Bellavista E, Tieri P, Castellani G, Lescai F, Francesconi M, Mishto
M, Santoro A, Valensin S, Salvioli S, Capri M, Zaikin A, Monti D, de Magalhães
JP, Franceschi C (2009) Systems Biology and Longevity: an emerging approach
to identify innovative anti-aging targets and strategies, Curr. Pharm. Des., in
press.
116
Chen K.C., Calzone L., Csikasz-Nagy A., Cross F.R., Novak B., Tyson J.J.
(2004). Integrative analysis of cell cycle control in budding yeast. Mol Biol Cell
15, 3841-3862.
Chen K.C., Csikasz-Nagy A., Gyorffy B., Val J., Novak B., Tyson J.J. (2000)
Kinetic analysis of a molecular model of the budding yeast cell cycle. Mol Biol
Cell 11, 369-391.
Choi C., Krull M., Kel A., Kel-Margoulis O., Pistor S., Potapov A., Voss N.,
Wingender E. (2004) TRANSPATH-A High Quality Database Focused on Signal
Transduction. Comp Funct Genomics, 2, 163-8.
Chondrogianni N, de C M Simoes D, Franceschi C, Gonos ES. (2004) Cloning of
differentially expressed genes in skin fibroblasts from centenarians.
Biogerontology; 5(6): 401-9.
Cloke B, Huhtinen K, Fusi L, Kajihara T, Yliheikkilä M, Ho KK, Teklenburg G,
Lavery S, Jones MC, Trew G, Kim JJ, Lam EW, Cartwright JE, Poutanen M,
Brosens JJ (2008) The androgen and progesterone receptors regulate distinct gene
networks and cellular functions in decidualizing endometrium. Endocrinology.
149(9):4462-74.
Cui Q., Yu Z., Purisima E.O., Wang E. (2006) Principles of microRNA regulation
of a human cellular signaling network. Mol Syst Biol 2, 46.
Davies L, Karthikeyan N, Lynch JT, Sial EA, Gkourtsa A, Demonacos C, Krstic-
Demonacos M (2008) Cross talk of signaling pathways in the regulation of the
glucocorticoid receptor function. Mol Endocrinol. 22(6):1331-44.
De Benedictis G, Carotenuto L, Carrieri G, De Luca M, Falcone E, Rose G et al.
(1998) Age-related changes of the 3'APOB-VNTR genotype pool in ageing
cohorts. Ann Hum Genet; 62(Pt 2): 115-22.
117
De Benedictis G, Franceschi C. (2006) The unusual genetics of human longevity.
Sci Aging Knowledge Environ 2006; 10: pe20.
de la Fuente A., Fotia G., Maggio F., Mancosu G., Pieroni E. (2008) Insights into
biological information processing: structural and dynamical analysis of a Human
Protein Signalling Network. Journal of Physics A, 41, 224013..
Demetrius L. Aging in mouse and human systems: a comparative study. (2006)
Ann N Y Acad Sci; 1067: 66-82.
Doyle FJ 3rd, Stelling J. (2006) Systems interface biology. J R Soc Interface;
3(10): 603-16.
Eden E, Roy Navon, Israel Steinfeld, Doron Lipson and Zohar Yakhini. (2009)
GOrilla: A Tool For Discovery And Visualization of Enriched GO Terms in
Ranked Gene Lists, BMC Bioinformatics, 10:48.
Erdős, P. Rényi, A. (1959). On Random Graphs. I. Publicationes Mathematicae 6:
290–297.
Ferrell J.E., Jr. (1996) Tripping the switch fantastic: how a protein kinase cascade
can convert graded inputs into switch-like outputs. Trends Biochem Sci 21, 460-
466.
Fraga MF, Ballestar E, Paz MF, Roper S, Setien F, Ballestar ML et al. (2005)
Epigenetic differences arise during the lifetime of monozygotic twins. Proc Natl
Acad Sci U S A; 102(30): 10604-9.
Fraga MF, Esteller M. (2007) Epigenetics and aging: the targets and the marks.
Trends Genet; 23(8): 413-418.
Franceschi C, Mondello C, Bonafè M, Valensin S, Sansoni P, Sorbi S. (1999)
Long telomeres and well preserved proliferative vigor in cells from centenarians:
a contribution to longevity? Aging; 11(2): 69-72.

118
Franceschi C, Bonafè M, Valensin S, Olivieri F, De Luca M, Ottaviani E, De
Benedictis G. (2000) Inflamm-aging. An evolutionary perspective on
immunosenescence. Ann N Y Acad Sci.;908:244-54.
Franceschi C, Olivieri F, Marchegiani F, Cardelli M, Cavallone L, Capri M et al.
(2005) Genes involved in immune response/inflammation, IGF1/insulin pathway
and response to oxidative stress play a major role in the genetics of human
longevity: the lesson of centenarians. Mech Ageing Dev; 126(2): 351-61.
Franceschi C, Capri M, Monti D, Giunta S, Olivieri F, Sevini F, Panourgia MP,
Invidia L, Celani L, Scurti M, Cevenini E, Castellani GC, Salvioli S. (2007a)
Inflammaging and anti-inflammaging: a systemic perspective on aging and
longevity emerged from studies in humans. Mech Ageing Dev.;128(1):92-105.
Franceschi C. (2007b) Inflammaging as a major characteristic of old people: can it
be prevented or cured? Nutr Rev; 65(12 Pt 2): S173-6.
Franceschi C, Motta L, Motta M, Malaguarnera M, Capri M, Vasto S et al. (2008)
IMUSCE. The extreme longevity: the state of the art in Italy. Exp Gerontol; 43(2):
45-52.
Funahashi, A., Tanimura, N., Morohashi, M., and Kitano, H. (2003) CellDesigner:
a process diagram editor for gene-regulatory and biochemical networks,
BIOSILICO, 1, 159-162
Gardy J.L., Lynn D.J., Brinkman F.S., Hancock R.E. (2009) Enabling a systems
biology approach to immunology: focus on innate immunity. Trends Immunol. 30,
249-62.
Gems D, Partridge L. (2008) Stress-response hormesis and aging: "that which
does not kill us makes us stronger". Cell Metab; 7(3): 200-3.
119
Gerstein,M., Seringhaus,M., Fields,S., (2007) Structured digital abstract makes
text mining easy. Nature 447, 142.
Gilmore T.D., (2010) Rel/NF-kB Transcription Factors website, http://www.nf-
kb.org
Goh K.I., Cusick M.E., Valle D., Childs B., Vidal M ., et al. (2007) The human
disease network. Proceedings of the National Academy of Sciences of the United
States of America, 104, 8685-8690.
Goldbeter A., Koshland D.E., Jr. (1981) An amplified sensitivity arising from
covalent modification in biological systems. Proc Natl Acad Sci U S A 78, 6840-
6844.
Kitano H, (2002) Systems Biology: a brief overview, Science, 295:1662-1664,
Hasegawa M, Fujimoto Y, Lucas PC, Nakano H, Fukase K, Núñez G, Inohara N.
(2008) A critical role of RICK/RIP2 polyubiquitination in Nod-induced NF-
kappaB activation. EMBO J. 27(2):373-83.
Helikar T., Konvalina J., Heidel J., Rogers J.A. (2008) Emergent decision-making
in biological signal transduction networks. Proc Natl Acad Sci U S A 105, 1913-
1918.
Hernandez-Toro J., Prieto C., De las Rivas J. (2007) APID2NET: unified
interactome graphic analyzer. Bioinformatics. 23, 2495-7.
Hotamisligil GS. (2006) Inflammation and metabolic disorders. Nature; 444
(7121): 860-7.
Hunter PJ, Borg TK. (2003) Integration from proteins to organs: the Physiome
Project. Nat Rev Mol Cell Biol; 4(3): 237-43
Invidia L, Salvioli S, Altilia S, Pierini M, Panourgia MP, Monti D et al. (2009)
The frequency of Klotho KL-VS polymorphism in a large Italian population, from
120
young subjects to centenarians, suggests the presence of specific time windows for
its effect. Biogerontology; in press.
Ivakhno S, Armstrong JD. (2007) Non-linear dimensionality reduction of
signaling networks. BMC Syst Biol. 8, 1:27
Jensen L.J., Saric J., Bork P. (2006) Literature mining for the biologist: from
information retrieval to biological discovery. Nat Rev Genet. 7, 119-29
Jeong H., Mason S.P., Barabasi A.L., Oltvai Z.N. (2001) Lethality and centrality
in protein networks. Nature,. 411, 41-42.
Jeong H., Tombor B., Albert R., Oltvai Z.N., Barabasi A.L. (2000) The large-scale
organization of metabolic networks. Nature, 407, 651-654.
Jiang C., Xuan Z., Zhao F., Zhang M.Q. (2007) TRED: a transcriptional
regulatory element database, new entries and other development. Nucleic Acids
Res. 35, D137-40
Kanehisa, M., Goto, S. (2000) KEGG: Kyoto Encyclopedia of Genes and
Genomes. Nucleic Acids Res. 28, 27-30
Kanehisa, M., Goto, S., Furumichi, M., Tanabe, M., and Hirakawa, M. (2010)
KEGG for representation and analysis of molecular networks involving diseases
and drugs. Nucleic Acids Res., in press
Kaput J, Dawson K. (2007) Complexity of type 2 diabetes mellitus data sets
emerging from nutrigenomic research: a case for dimensionality reduction?. Mutat
Res; 622(1-2): 19-32.
Keshava Prasad T.S., Goel R., Kandasamy K., Keerthikumar S., Kumar S.,
Mathivanan S., Telikicherla D., Raju R., Shafreen B., Venugopal A., Balakrishnan
L., Marimuthu A., Banerjee S., Somanathan D.S., Sebastian A., Rani S., Ray S.,
Harrys Kishore C.J., Kanth S., Ahmed M., Kashyap M.K., Mohmood R.,
121
Ramachandra Y.L., Krishna V., Rahiman B.A., Mohan S., Ranganathan P.,
Ramabadran S., Chaerkady R., Pandey A. (2009) Human Protein Reference
Database--2009 update. Nucleic Acids Res. 37, D767-72.
Kholodenko B.N. (2006) Cell-signalling dynamics in time and space. Nat Rev Mol
Cell Biol 7, 165-176.
Kirkwood TB. (2008) A systematic look at an old problem. Nature; 451(7179):
644-7.
Kloetzel PM. Antigen processing by the proteasome. Nat Rev Mol Cell Biol 2001;
2(3): 179-87.
Larbi A, Franceschi C, Mazzatti D, Solana R, Wikby A, Pawelec G. (2008) Aging
of the immune system as a prognostic factor for human longevity. Physiology
(Bethesda); 23: 64-74.
Lee MP, Dunn BK. (2008) Influence of genetic inheritance on global epigenetic
states and cancer risk prediction with DNA methylation signature: challenges in
technology and data analysis. Nutr Rev; 66 Suppl 1: S69-72.
Leitner, F., Valencia, A., (2008) A text-mining perspective on the requirements
for electronically annotated abstracts. FEBS Lett., 582, 1178-1181.
Leroi AM, Bartke A, De Benedictis G, Franceschi C, Gartner A, Gonos ES, et al.
(2005) What evidence is there for the existence of individual genes with
antagonistic pleiotropic effects? Mech Ageing Dev; 126(3): 421-9.
Levin M.D., Morton-Firth C.J., Abouhamad W.N., Bourret R.B., Bray D. (1998)
Origins of individual swimming behavior in bacteria. Biophys J 74, 175-181.
Liang W, Kujawski M, Wu J, Lu J, Herrmann A, Loera S, Yen Y, Lee F, Yu H,
Wen W, Jove R. (2010) Antitumor Activity of Targeting Src Kinases in
122
Endothelial and Myeloid Cell Compartments of the Tumor Microenvironment.
Clin Cancer Res. In press.
Licastro F, Grimaldi LM, Bonafè M, Martina C, Olivieri F, Cavallone L, et al.
(2003) Interleukin-6 gene alleles affect the risk of Alzheimer's disease and levels
of the cytokine in blood and brain. Neurobiol Aging; 24(7): 921-6.
Lin C.Y., Chin C.H., Wu H.H., Chen S.H., Ho C.W., Ko M.T. (2008) Hubba: hub
objects analyzer--a framework of interactome hubs identification for network
biology. Nucleic Acids Res. 36, W438-43
Liu W., Li D., Zhang J., Zhu Y., He F. (2006) SigFlux: a novel network feature to
evaluate the importance of proteins in signal transduction networks. BMC
Bioinformatics 7, 515.
Lutgens E, Lievens D, Beckers L, Wijnands E, Soehnlein O, Zernecke A, Seijkens
T, Engel D, Cleutjens J, Keller AM, Naik SH, Boon L, Oufella HA, Mallat Z,
Ahonen CL, Noelle RJ, de Winther MP, Daemen MJ, Biessen EA, Weber C.
(2010) Deficient CD40-TRAF6 signaling in leukocytes prevents atherosclerosis
by skewing the immune response toward an antiinflammatory profile. J Exp Med.
In press.
Ma'ayan A., Jenkins S.L., Neves S., Hasseldine A., Grace E., Dubin-Thaler B.,
Eungdamrong N.J., Weng G., Ram P.T., Rice J.J., Kershenbaum A., Stolovitzky
G.A., Blitzer R.D., Iyengar R. (2005) Formation of regulatory patterns during
signal propagation in a Mammalian cellular network. Science 309, 1078-1083
Maere S., Heymans K., Kuiper M. (2005) BiNGO: a Cytoscape plugin to assess
overrepresentation of gene ontology categories in biological networks.
Bioinformatics. 21, 3448-9.
123
Matthews L., Gopinath G., Gillespie M., Caudy M., Croft D., de Bono B.,
Garapati P., Hemish J., Hermjakob H., Jassal B., Kanapin A., Lewis S., Mahajan
S., May B., Schmidt E., Vastrik I., Wu G., Birney E., Stein L., D'Eustachio P.
(2009) Reactome knowledgebase of human biological pathways and processes.
Nucleic Acids Res. 37, D619-22
Matys V., Fricke E., Geffers R., Gössling E., Haubrock M., Hehl R., Hornischer
K., Karas D., Kel A.E., Kel-Margoulis O.V., Kloos D.U., Land S., Lewicki-
Potapov B., Michael H., Münch R., Reuter I., Rotert S., Saxel H., Scheer M.,
Thiele S., Wingender E. (2003) TRANSFAC: transcriptional regulation, from
patterns to profiles. Nucleic Acids Res. 31, 374-8.
Mishto M, Bellavista E, Dyllick-Brenzinger M, Dahlmann B, Franceschi C.
(2009) In: NOVA Publishers, The ubiquitin proteasome system in nervous
system: from physiology to pathology. 2008 Update". New York, DiNapoli M and
Wojcik C, in press.
Mishto M, Bellavista E, Santoro A, Stolzing A, Ligorio C, Nacmias B et al.
(2006) Immunoproteasome and LMP2 polymorphism in aged and Alzheimer's
disease brains. Neurobiol Aging; 27(1): 54-66.
Mori T, Kai S. (2002) Noise-induced entrainment and stochastic resonance in
human brain waves. Phys Rev Lett; 88(21): 218101.
Nelius T, Filleur S, Yemelyanov A, Budunova I, Shroff E, Mirochnik Y, Aurora
A, Veliceasa D, Xiao W, Wang Z, Volpert OV (2007) Androgen receptor targets
NFkappaB and TSP1 to suppress prostate tumor growth in vivo. Int J Cancer. Sep
1;121(5):999-1008.
Newman M.E.J. (2000) Models of the small world. Journal of Statistical Physics,
101, 819-841.
124
Noorbakhsh F, Overall CM, Power C. (2009) Deciphering complex mechanisms
in neurodegenerative diseases: the advent of systems biology. Trends Neurosci;
32(2): 88-100.
Ordovas JM. (2007) Gender, a significant factor in the cross talk between genes,
environment, and health. Gend Med; 4 Suppl B: 111-22.
Pahl HL. (1999) Activators and target genes of Rel/NF-kappaB transcription
factors. Oncogene. 18(49):6853-66.
Palvimo JJ, Reinikainen P, Ikonen T, Kallio PJ, Moilanen A, Jänne OA (1996)
Mutual transcriptional interference between RelA and androgen receptor. J Biol
Chem. 271(39):24151-6.
Paulsson J. (2004) Summing up the noise in gene networks. Nature; 427: 415–18;
Péant B, Diallo JS, Lessard L, Delvoye N, Le Page C, Saad F, Mes-Masson AM.
(2007) Regulation of IkappaB kinase epsilon expression by the androgen receptor
and the nuclear factor-kappaB transcription factor in prostate cancer. Mol Cancer
Res. 5(1):87-94.
Perkins ND. (2007) Integrating cell-signalling pathways with NF-kappaB and
IKK function. Nat Rev Mol Cell Biol. 8(1):49-62.
Pico A.R., Kelder T., van Iersel M.P., Hanspers K., Conklin B.R., Evelo C. (2008)
WikiPathways: pathway editing for the people. PLoS Biol. 6, e184
Pieroni, E., de la Fuente, S., van Bentem, Mancosu, G., Capobianco E., Hirt, H.,
de la Fuente A. (2008) Protein networking: insights into global functional
organization of proteomes. Proteomics 8, 799-816
Platzer A., Perco P., Lukas A., Mayer B. (2007) Characterization of protein-
interaction networks in tumors. BMC Bioinformatics. 8, 224.
125
Prieto C., De Las Rivas J. (2006) APID: Agile Protein Interaction DataAnalyzer.
Nucleic Acids Res. 34, W298-302
Raser JM, O'Shea EK. (2005) Noise in gene expression: origins, consequences,
and control. Science; 309: 2010–3.
Rattan SI. (2007) The science of healthy aging: genes, milieu, and chance. Ann N
Y Acad Sci; 1114: 1-10.
Ravasz, E, Somera AL, Mongru DA, Oltvai ZN, Barabási AL. (2002) Hierarchical
organization of modularity in metabolic networks. Science 297 1551-1555
Raza S, Robertson KA, Lacaze PA, Page D, Enright AJ, Ghazal P et al. (2008) A
logic-based diagram of signalling pathways central to macrophage activation.
BMC Syst Biol; 23: 2-36.
Reimand J., Tooming L., Peterson H., Adler P., Vilo J. (2008) GraphWeb: mining
heterogeneous biological networks for gene modules with functional significance.
Nucl. Acids Res. 36, W452-W459
Russell DF, Wilkens LA, Moss F. (1999) Use of behavioural stochastic resonance
by paddle fish for feeding. Nature; 402(6759): 291-4.
Salminen A, Huuskonen J, Ojala J, Kauppinen A, Kaarniranta K, Suuronen T.
(2008) Activation of innate immunity system during aging: NF-kB signaling is the
molecular culprit of inflamm-aging. Ageing Res Rev. 7(2):83-105.
Salvioli S, Olivieri F, Marchegiani F, Cardelli M, Santoro A, Bellavista E et al.
(2006a) Genes, ageing and longevity in humans: problems, advantages and
perspectives. Free Radic Res; 40(12): 1303-23.
Salvioli S, Capri M, Valensin S, Tieri P, Monti D, Ottaviani E, et al. (2006b)
Inflamm-aging, cytokines and aging: state of the art, new hypotheses on the role
126
of mitochondria and new perspectives from systems biology. Curr Pharm Des;
12(24): 3161-71.
Salvioli S, Capri M, Tieri P, Loroni J, Barbi C, Invidia L et al. (2008a) Different
types of cell death in organismal aging and longevity: state of the art and possible
systems biology approach. Curr Pharm Des; 14(3): 226-36.
Sansoni P, Vescovini R, Fagnoni F, Biasini C, Zanni F, Zanlari L, Telera A,
Lucchini G, Passeri G, Monti D, Franceschi C, Passeri M. (2008b) The immune
system in extreme longevity. Exp Gerontol. 43(2):61-5.
Sauro H.M., Kholodenko B.N. (2004). Quantitative analysis of signaling
networks. Prog Biophys Mol Biol 86, 5-43.
Schaefer C.F., Anthony K., Krupa S., Buchoff J., Day M., Hannay T., Buetow
K.H. (2009) PID: the Pathway Interaction Database. Nucleic Acids Res. 37, D674-
9.
Schumacher B, van der Pluijm I, Moorhouse MJ, Kosteas T, Robinson AR, Suh Y
et al. (2008) Delayed and accelerated aging share common longevity assurance
mechanisms. PLoS Genet; 4(8): e1000161.
Shannon P., Markiel A., Ozier O., Baliga N.S., Wang J.T., Ramage D., Amin N.,
Schwikowski B., Ideker T. (2003) Cytoscape: a software environment for
integrated models of biomolecular interaction networks. Genome Res. 13, 2498-
504
Tieri P, Valensin S, Latora V, Castellani GC, Marchiori M, Remondini D,
Franceschi C. (2005) Quantifying the relevance of different mediators in the
human immune cell network. Bioinformatics. 21, 1639-43
Tieri, P., Termanini, A., Fariselli, P., and Franceschi, C. (2008) Embedding
machine-readable proteins interactions data in scientific articles for easy access
127
and retrieval. Available from Nature Precedings
<http://hdl.handle.net/10101/npre.2008.2337.1>
Tieri P, de la Fuente A, Termanini A, Franceschi C (2010) Integrating omics data
for signaling pathway and interactome reconstruction and functional analysis, in:
Bioinformatics for Omics Data: Methods and Protocols, Mayer B Ed., Springer/
Humana Press, in press.
Travers, J., Milgram, S. (1969) An Experimental Study of the Small World
Problem. Sociometry, 32, 425-443
Tyson J.J., Chen K., Novak B. (2001) Network dynamics and cell physiology. Nat
Rev Mol Cell Biol 2, 908-916.
Tyson J.J., Chen K.C., Novak B. (2003) Sniffers, buzzers, toggles and blinkers:
dynamics of regulatory and signaling pathways in the cell. Curr Opin Cell Biol
15, 221-231.
Usher M, Feingold M. (2000) Stochastic resonance in the speed of memory
retrieval. Biol Cybern; 83(6): L11-6.
Vescovini R, Biasini C, Fagnoni FF, Telera AR, Zanlari L, Pedrazzoni M, et al.
(2007) Massive load of functional effector CD4+ and CD8+ T cells against
cytomegalovirus in very old subjects. J Immunol; 179(6): 4283-91.
Villoslada P, Steinman L, Baranzini SE. (2009) Systems biology and its
application to the understanding of neurological diseases. Ann Neurol. 65(2):124-
39.
Watts D.J., Strogatz S.H. (1998) Collective dynamics of 'small-world' networks.
Nature, 393, 440-442.

128
West GB, Bergman A. (2009) Toward a systems biology framework for
understanding aging and health span. J Gerontol A Biol Sci Med Sci; 64(2): 205-
8.
Williams GC. (1957) Pleiotropy, natural selection, and the evolution of
senescence. Evolution; 11: 398–411.
Yashin AI, De Benedictis G, Vaupel JW, Tan Q, Andreev KF, Iachine IA et al.
(1999) Genes, demography, and life span: the contribution of demographic data in
genetic studies on aging and longevity. Am J Hum Genet; 65: 1178-93.
Yi T.M., Huang Y., Simon M.I., Doyle J. (2000) Robust perfect adaptation in
bacterial chemotaxis through integral feedback control. Proc Natl Acad Sci U S A
97, 4649-4653.
Zahn JM, Poosala S, Owen AB, Ingram DK, Lustig A, Carter A, Weeraratna AT
et al. (2007) AGEMAP: a gene expression database for aging in mice.
PLoSGenet.; 3(11): e201.
Zaikin A, Pöschel T. (2005) Peptide-size-dependent active transport in the
proteasome. Europhys Lett; 69 (5): 725-31.
Zhao F., Xuan Z., Liu L., Zhang M.Q. (2005) TRED: a Transcriptional Regulatory
Element Database and a platform for in silico gene regulation studies. Nucleic
Acids Res. 33, D103-7