on using semantic complex event processing for...
TRANSCRIPT

On Using Semantic Complex Event Processing forDynamic Demand Response Optimization
Qunzhi ZhouDepartment of Computer ScienceUniversity of Southern California
Los Angeles, CA 90089, USAEmail: [email protected]
Yogesh SimmhanDepartment of Electrical Engineering
University of Southern CaliforniaLos Angeles, CA 90089, USA
Email: [email protected]
Viktor PrasannaDepartment of Electrical Engineering
University of Southern CaliforniaLos Angeles, CA 90089, USA
Email: [email protected]
Abstract—Demand response optimization (DR) is a key com-ponent of Smart Grids. However, existing DR programs fail toeffectively leverage the near-realtime information available fromAMIs and BANs to adapt to increasing dynamism in energyuse profiles. In this paper, we investigate the use of SemanticComplex Event Processing (CEP) to model and detect dynamicsituations in a campus micro grid that facilitates DR. We abstractevent streams from various information sources including smartmeters, sensors, and online services as a logical stream of events.We offer a taxonomy of DR event patterns that can be definedfor power use prediction, curtailment opportunity detection, andsituation awareness. Further, we illustrate the efficacy of patterndetection for DR by applying them to realtime event streams inthe USC Campus micro grid using our SCEPter Semantic CEPframework and analyzing their statistics over a 4 day period.
I. INTRODUCTION
Smart Grids provide realtime monitoring capability of in-terconnected power grid elements, two way communicationsbetween end-use devices, customers and utilities, and theopportunity to integrate and use information from diversesources such as weather forecasts and event schedules. Thisinformation infrastructure enables the design of advancedinformation technology systems to improve the grid efficiencyand meet the rapidly increasing electricity demand.
Demand response optimization (DR) is a cornerstone com-ponent of Smart Grids, and deals with managing demand-side load in response to supply conditions. The advantageof DR is twofold: it reduces the captive power generationcapacity required for to meet peak load, and avoids startingand stopping power generating units by flattening the demandprofile. Traditional DR approaches may be categorized as: (1)schedule-based, where curtailment is scheduled a priori basedon customer commitments, and (2) incentive-based, wherecustomers are offered pricing incentives during peak loadperiods to encourage voluntary curtailment [2]. Both theseapproaches are static, in that the decision of the DR periodis made hours if not days ahead, and for a large swathe ofcustomers in the service area.
Complex Event Processing (CEP) can supplement tradi-tional DR by offering a more fine-grained approach that isresponsive to dynamic conditions. CEP refers to an infor-mation processing framework that can detect the occurrenceof specified patterns of events by examining hundreds or
thousands of event data streams with a low latency on theorder of seconds. The pervasive sensing capability in powergrids is enabling us to monitor power consumption and itsindirect influencers in near realtime. CEP can help correlatethese continuous streams of monitored data, and performonline analysis to detect situations of interest modeled as eventpatterns. For e.g., a CEP pattern could detect an opportunityfor temperature reset in a classroom if it is not occupied,the setpoint temperature for the room is less than 72◦F andno classes are scheduled for the next hour. Such analysisoffers deeper insight into power usage behavior for timely andopportunistic DR operations.
In this paper, we explore the potential for using CEP fordynamic DR using the University of Southern California’scampus microgrid testbed. We make two key contributions:
1) We categorize CEP patterns for different aspects ofDR, and offer a taxonomy of patterns with associatedexamples for a campus microgrid.
2) We evaluate the efficacy of event-based DR using cam-pus microgrid experiments to detect DR patterns.
The rest of the paper is organized as follows: Section IIdescribes the USC campus Micro Grid testbed and introducessemantic CEP; Section III proposes a taxonomy of DR eventpatterns and illustrates it with examples from the microgrid;Section IV offers a case study and empirical evaluation of CEPfor DR; we review related work in Section V; and present ourconclusions in Section VI.
II. BACKGROUND
The University of Southern California serves as a test-bed to experiment and evaluate DR technologies as partof the Department of Energy-sponsored Los Angeles SmartGrid Demonstration Project [17]. USC is the largest privatecustomer of the Los Angeles Department of Water and Power(LADWP) with over 60,000 students, faculty and staff spreadover 170 buildings containing classrooms, residence halls, of-fices, labs, hospitals and restaurants. USC is well instrumented,with a campus-wide Building Area Network (BAN) that canmonitor buildings and equipment to measure power usage,operational status, space and setpoint temperatures, airflow,occupancy and so on at minute intervals at the Campus EnergyControl Center.

The DR operations in the campus microgrid include directcontrol strategies like Global Temperature Reset (GTR) andDuty Cycling that are scheduled at pre-determined time peri-ods, days ahead, based on historical power usage trends. Vol-untary curtailment strategies are also being tested using emailnotifications sent to building occupants during peak hours.However, these strategies need to be supplemented with nimbleones that adapt to dynamic campus conditions, in both spaceand time. Realtime information on buildings and equipmentprovided by the campus BAN, along with campus schedule,facility descriptions and weather forecasts, can be analyzed todetect additional demand curtailment opportunities.
Semantic Complex Event Processing. Complex EventProcessing (CEP) is an information processing framework todetect a the occurrence of a pattern of events over a setof event streams. Continuous, time-series data from sensorsand other information sources in the Smart Grid can beabstracted as event streams. For example, an event stream maycomprise timestamped KWh power usage by an HVAC unit ina particular room reported every minute by the BAN. Weatherconditions for a particular zipcode provided every hour by theNOAA web service may also form an event stream. DynamicDR situations of interest can be modeled as combination ofthese events i.e. as a complex event pattern.
ee:D105VOLUME bd:RTH105
ee:hasID
ee:hasLocation
bd:Office
rdf:type
< D105VOL 510.0 2012-01-12T05:00 >event data =
ee:AirflowSensor
rdf:type
ontology
sensorID flowrate timestamp
Fig. 1. Semantic Event for Airflow Event Stream
We have developed a semantic CEP framework, SCEPter[13], to facilitate user-friendly, high level specification ofDR patterns. While existing CEP systems process eventsas plain relational data tuples that require precise knowl-edge of attributes presented in raw event data, our semanticCEP framework incorporates domain knowledge as meta-data to describe events in a more accessible manner [18].Figure 1 shows how properties of entities in the micro-grid such as buildings, rooms (bd:RTH105), facility types(bd:Office), sensors (ee:D105VOLUME), measurement vari-ables (ee:AirflowSensor), organizations, as well as their rela-tionships with each other and to time series event data arecaptured using semantic ontologies.
Patterns over the semantic event model are specifiedsimilar to SQL queries, with semantic and temporal windowextensions. For example, the following simple pattern detectswhen the airflow in an Office room exceeds 500 cfm, and isapplied to the airflow stream described in Figure 1:
SELECT ?a.flowrateFROM ?a airflowStreamWHERE (?a.flowrate > 500){?a evt:hasEventSource ?src} .{?src bd:hasLocation ?loc}.{?loc rdf:type bd:Office}
Semantic constraints represented using SPARQL triple pat-terns [1] are inserted in the “WHERE” clause. More advancedsemantic CEP patterns, discussed next, can be used to correlatedistributed events to detect meaningful patterns for differentDR techniques and provide realtime decision support.
III. DR EVENT PATTERN TAXONOMY
To fully exploit the capabilities of semantic complex eventprocessing for DR applications, we classify DR patterns fromdifferent perspectives. Figure 2 shows top level categories ofthis taxonomy, discussed further below. The examples we pro-vide are based on semantic concepts for and experiences in theUSC microgrid, but can be generalized to other environments.
1. DR Pattern
1.1
End-use Purpose
1.2
Spatial Scale
1.3
Temporal Scale
1.4
Representation
1.5
Life Cycle
1.6
Adaptivity
Fig. 2. Top-level DR Pattern Taxonomy
A. End-use Purpose
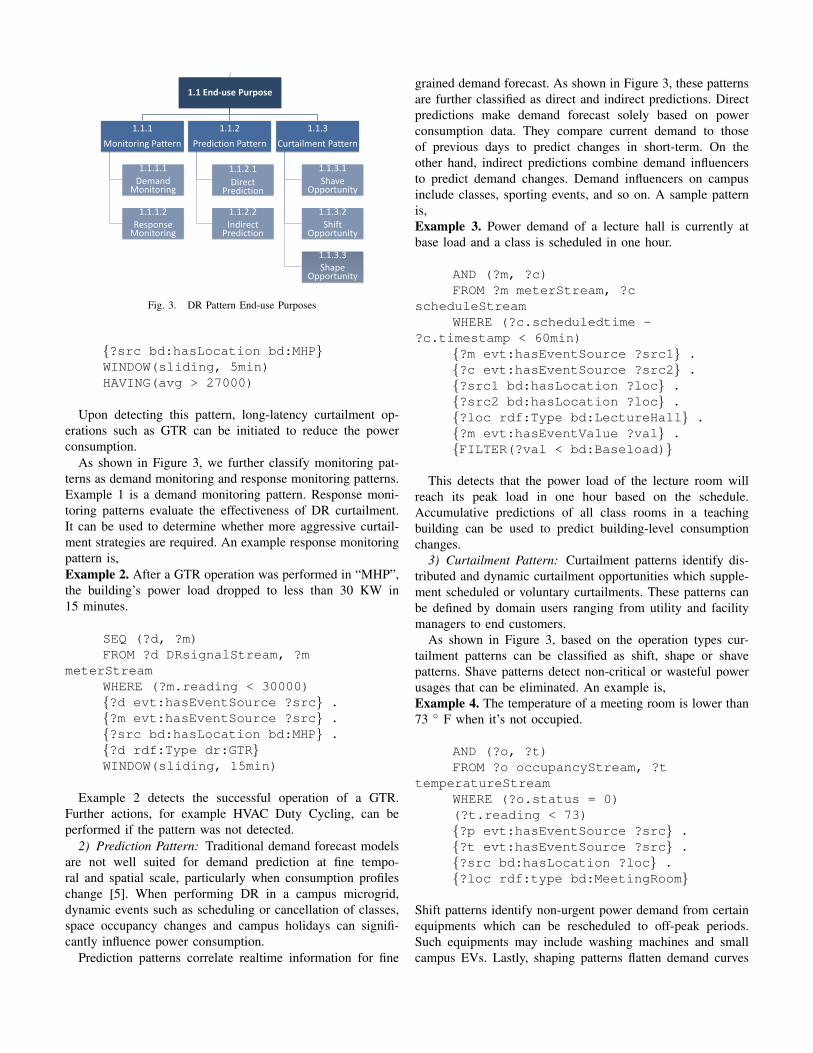
Patterns are defined for different objectives as shown inFigure 3. For example, meter readings can be aggregatedto monitor demand levels, power usage influencers can beincorporated to predict demand trends, ambient sensors can becorrelated to identify power wastage that occurs in differentplaces occasionally. The monitoring and prediction patternshelp determine when to perform DR. The curtailment patterns,on the other hand, identify curtailment opportunities in addi-tion to scheduled and voluntary curtailments. Together, theyenable incremental opportunistic DR.
1) Monitoring Pattern: These patterns evaluate current de-mand behavior by analyzing meter and sensor data. In USCcampus, a variety of meters and sensors measure buildingand equipment level power consumption. Monitoring patternscan be defined over such event streams to evaluate powerusage status of specific spaces or equipments. An examplemonitoring pattern is,Example 1. The power consumption of building “MHP”,AVERAGED over 5-minutes, exceeds its pre-peak load of27 KW.
SELECT AVG(?m.reading) AS avgFROM ?m meterStreamWHERE{?m evt:hasEventSource ?src} .
1.1 End-use Purpose
1.1.1
Monitoring Pattern
1.1.1.1
Demand Monitoring
1.1.1.2
Response Monitoring
1.1.2
Prediction Pattern
1.1.2.1
Direct Prediction
1.1.2.2
Indirect Prediction
1.1.3
Curtailment Pattern
1.1.3.1
Shave Opportunity
1.1.3.2
Shift Opportunity
1.1.3.3
Shape Opportunity
Fig. 3. DR Pattern End-use Purposes
{?src bd:hasLocation bd:MHP}WINDOW(sliding, 5min)HAVING(avg > 27000)
Upon detecting this pattern, long-latency curtailment op-erations such as GTR can be initiated to reduce the powerconsumption.
As shown in Figure 3, we further classify monitoring pat-terns as demand monitoring and response monitoring patterns.Example 1 is a demand monitoring pattern. Response moni-toring patterns evaluate the effectiveness of DR curtailment.It can be used to determine whether more aggressive curtail-ment strategies are required. An example response monitoringpattern is,Example 2. After a GTR operation was performed in “MHP”,the building’s power load dropped to less than 30 KW in15 minutes.
SEQ (?d, ?m)FROM ?d DRsignalStream, ?m
meterStreamWHERE (?m.reading < 30000){?d evt:hasEventSource ?src} .{?m evt:hasEventSource ?src} .{?src bd:hasLocation bd:MHP} .{?d rdf:Type dr:GTR}WINDOW(sliding, 15min)
Example 2 detects the successful operation of a GTR.Further actions, for example HVAC Duty Cycling, can beperformed if the pattern was not detected.
2) Prediction Pattern: Traditional demand forecast modelsare not well suited for demand prediction at fine tempo-ral and spatial scale, particularly when consumption profileschange [5]. When performing DR in a campus microgrid,dynamic events such as scheduling or cancellation of classes,space occupancy changes and campus holidays can signifi-cantly influence power consumption.
Prediction patterns correlate realtime information for fine
grained demand forecast. As shown in Figure 3, these patternsare further classified as direct and indirect predictions. Directpredictions make demand forecast solely based on powerconsumption data. They compare current demand to thoseof previous days to predict changes in short-term. On theother hand, indirect predictions combine demand influencersto predict demand changes. Demand influencers on campusinclude classes, sporting events, and so on. A sample patternis,Example 3. Power demand of a lecture hall is currently atbase load and a class is scheduled in one hour.
AND (?m, ?c)FROM ?m meterStream, ?c
scheduleStreamWHERE (?c.scheduledtime -
?c.timestamp < 60min){?m evt:hasEventSource ?src1} .{?c evt:hasEventSource ?src2} .{?src1 bd:hasLocation ?loc} .{?src2 bd:hasLocation ?loc} .{?loc rdf:Type bd:LectureHall} .{?m evt:hasEventValue ?val} .{FILTER(?val < bd:Baseload)}
This detects that the power load of the lecture room willreach its peak load in one hour based on the schedule.Accumulative predictions of all class rooms in a teachingbuilding can be used to predict building-level consumptionchanges.
3) Curtailment Pattern: Curtailment patterns identify dis-tributed and dynamic curtailment opportunities which supple-ment scheduled or voluntary curtailments. These patterns canbe defined by domain users ranging from utility and facilitymanagers to end customers.
As shown in Figure 3, based on the operation types cur-tailment patterns can be classified as shift, shape or shavepatterns. Shave patterns detect non-critical or wasteful powerusages that can be eliminated. An example is,Example 4. The temperature of a meeting room is lower than73 ◦ F when it’s not occupied.
AND (?o, ?t)FROM ?o occupancyStream, ?t
temperatureStreamWHERE (?o.status = 0)(?t.reading < 73){?p evt:hasEventSource ?src} .{?t evt:hasEventSource ?src} .{?src bd:hasLocation ?loc} .{?loc rdf:type bd:MeetingRoom}
Shift patterns identify non-urgent power demand from certainequipments which can be rescheduled to off-peak periods.Such equipments may include washing machines and smallcampus EVs. Lastly, shaping patterns flatten demand curves

by performing duty cycling of equipments. An example is tostagger the operations of fan coils in HVAC systems,Example 5. More than 6 fan coils are operating at the sametime in “MHP” during peak hours.
SELECT COUNT(?f) AS cntFROM ?f fanCoilStreamWHERE (?f.status = 1){?f evt:hasEventSource ?src} .{?src evt:hasLocation bd:MHP}HAVING (cng > 6)
B. Spatial Scale
Besides end-use purpose, DR patterns can also be classifiedbased on the spatial entities on which they are defined. Asshown in Figure 4, the spatial objects can be physic or virtual.1. DR Patterns
1.2
Spatial Scale
1.2.1
Physic Space & Infrastructure
1.2.2
Electric Equipments
1.2.2.1 Stationary
1.2.2.2
Mobile
1.2.3
Virtual Space
1.2.3.1
Organization
1.2.3.2
Group
1.3
Temporal Scale
1.3.1
Frequency
1.3.1.1
Sliding Window
1.3.1.2
Batch Window
1.3.2
Distance
1.3.2.1Immediate/Z
ero
1.3.2.2Future/Positi
ve
Fig. 4. DR Pattern Spatial and Temporal Scales
1) Physic Space and Equipment: DR patterns for physicobjects can be defined for campus, buildings, rooms as wellas individual equipment. Different domain users may definepatterns for various spaces. For example, campus managersdefine campus-level monitoring patterns to send global DRsignals, while building managers define room or equipmentdemand prediction and curtailment patterns – the prior ex-amples fall into this category. Physic objects can be furtherclassified as stationary and mobile; the latter include EVs andportable appliances.
2) Virtual Space: DR Patterns can also be defined forvirtual spaces or objects such as organizations and customergroups. These virtual spaces may be physically contiguoussuch as a department located in neighboring buildings orscattered such as a customer segment that responds to specificDR signal. Example 6 shows a DR pattern defined for adepartment in the campus microgrid.Example 6. The total power demands from EE departmentexceed 600 KW.
SELECT SUM(?m) AS sumFROM ?m meterStreamWHERE{?m evt:hasEventSource ?src} .{?src bd:hasLocation ?loc} .
{?loc bd:belongsTo org:EEDepartment}HAVING (sum > 600000)
Upon detecting the above pattern, the department DR co-ordinator can be notified to carry out effective curtailmentstrategies implemented in the department.
C. Temporal Scale
The temporal properties of a DR pattern include howfrequently the pattern is evaluated and when the pattern takeseffect after detection, as shown in Figure 4.
1) Frequency: The frequency of a DR pattern is determinedby its time window constraints. There are two types of timewindows: sliding and batch. Window width can be eitherspecified using number of events or length of time period. Fora sliding window, events are processed by gradually movingthe window in single event increments. For a batch window,events are processed by moving the window in discrete, non-overlapping time blocks. If no window is specified for apattern, a sliding window of one event is used by default.Example 2 used a sliding window. A batch window is useful,for example, when we want to monitor the aggregated buildingconsumption every hour.
2) Distance: Pattern distance refers to the time differencebetween detection and when to take effective. Most patterns,including the monitoring and curtailment patterns definedabove, have immediate impact of zero distance. A predictionpattern however has a positive distance which specifies a futuretime it predicts. A curtailment pattern may also have a positivedistance if it is used to schedule a curtailment operation ratherthan trigger it immediately.
D. Representation
As shown in Figure 5, DR patterns are specified at differentabstraction levels primarily determined by the underlying eventmodels. If using traditional CEP systems, patterns have to bedefined over raw data streams as syntactic patterns. The eventattributes can be either crisp values or fuzzy concepts. In oursemantic CEP framework, users define patterns over domainontologies. The semantic-rich event model offers expressiveand intuitive pattern specification. Examples 1–6 show howtarget DR situations are represented as semantic patterns,shielding users from low-level details of the grid infrastructure.
E. Life Cycle
The life cycle of an event pattern is the time period duringwhich it is active. As shown in Figure 5, some DR patternsmay be running persistently, some only activated for scheduledperiods, and others instantiated on-demand. Persistent patternsare standing queries over event streams. Most monitoringand prediction patterns belong to this category. Patterns suchas those identifying curtailment opportunities are meaningfulonly when there is a need to curtail, for example, duringpeak hours or after receiving a DR request. These patternsare scheduled and on-demand patterns respectively.

1. DR Pattern
1.4 Representation
1.4.1
Syntactic Pattern
1.4.1.1
Crisp Value
1.4.1.2
Fuzzy Value
1.4.2
Semantic Pattern
1.4.2.1
Single Domain
1.4.2.2
Cross Domain
1.5 Life Cycle
1.5.1
Persistent
1.5.2
Scheduled
1.5.3
On-demand
1.6 Adaptivity
1.6.1
Static
1.6.2
Dynamic
Fig. 5. DR Pattern Representation, Life Cycle and Adaptivity
F. Adaptivity
Another important property of DR patterns is whether theyare self-adaptive or evolving over time. Some patterns maybe static and do not need to change after they were initiallydefined. However, some patterns such as prediction patternsmay be impacted by changes of the grid infrastructure andcustomer behavior. A novel area of research is to perform minehistorical event streams to automate the process of defininginteresting patterns.
IV. USC MICROGRID CASE STUDY
We evaluate the effectiveness of the categories of patternsintroduced in the taxonomy by implementing them for theUSC campus microgrid. We use SCEPter, our semantic com-plex event processing engine [13], to detect semantic CEPpatterns defined over select event streams in the USC cam-pus microgrid. These patterns support different DR end-uses:monitoring, prediction and curtailment patterns/situations. Ourexperimental results are presented for patterns active over fourdays in the campus.
A. Event Streams and Ontologies
Several event streams in USC microgrid are used in ourexperiments. These include:
• Meter measurement. Events from smart meters whichmeasure a buildings’ KW loads.
• Fan coil status. Events from HVAC sensors which reportthe operation status of fan coils: “1” means ON and “0”means OFF.
• Class schedule. Data from a calendar schedule servicewhich generates classroom schedule events an hour be-fore a class began.
• Room temperature. Measurement from a room’s spacetemperature sensor.
• Room occupancy. Events from room occupancy sensorsthat provides a boolean value.
• DR signal. Events sent by the BAN at start and the endof a curtailment period.
Events of the same type from multiple stream sources arepushed single logical stream. For example, smart meters thatmonitor different buildings push their events to the metermeasurement stream.The campus microgrid domain ontologies
are described in [18]. These ontologies capture properties ofand relationships between physical space, electric equipment,and organizations on campus.
B. DR Patterns and Empirical Evaluations
Pattern 1
Pattern 4
Pattern 5
Pattern 6
(Fri) (Sat) (Sun) (Mon) (Tue)
05/04 00:00 05/05 00:00 05/06 00:00 05/07 00:00 05/08 00:00
Pattern 1 Pattern 4 Pattern 5 Pattern 6
Fig. 6. Experiment Results
The sample DR patterns introduced in Section III are eval-uated over the above event streams on campus. Specifically,we analyze patterns 1 (average power consumption exceedsa peak load), 4 (space temperature of unoccupied room lessthan 73◦F), 5 (more than six fan coils are concurrently active)and 6 (load on EE department exceeds 600KW).
The experiments were conducted from Friday May 4th toTuesday May 7th, 2012. Figure 6 shows the detection of thesefour patterns over the six event streams during that time period.The detection frequency of some patterns were limited sincethis time period coincided with final exam week when classesand DR curtailment were not actively scheduled.
In Figure 6, pattern 1’s detection indicates that the powerconsumption of the MHP building exceeded its pre-peakthreshold from around 8:20AM to 4:00PM on Friday andfrom around 8:40AM to 5:00PM on Monday. The power loadof MHP during weekends is below the pre-peak thresholdbecause it is primarily used for teaching. However, we observefrom Pattern 6 that the power consumption of the EE depart-ment exceeds its pre-peak threshold even on the weekend.Detection of these patterns help us decide when and whereto initiate curtailment on campus.
Pattern 4 and 5 show opportunities for curtailments. Frompattern 4, we know more than 6 fan coils in MHP operate atthe same time from around 8:00AM to 5:00PM on weekdays.By duty cycling the operations of fan coils during this period,we can flatten the demand curve. In a separate experiment,we observed over 27% curtailment in peak demand by dutycycling fan coils in MHP. Pattern 4 monitors a meeting roomin the EE department. Several group meetings occurred onFriday and Monday. It is observed that people leave the roomwithout resetting the thermostat and this causes power wastagewhen the room is not occupied – which is most of the timeand especially during the weekend.
These patterns and situations are detected in realtime,which offers opportunities for fine grained and timely DR

operations, and help undertake more intelligent DR strategies.We are planning a comprehensive suite of experiments oversummer during the peak load season. Additional buildings andinstrumented rooms will be included and this will allow us toestimate the overall curtailment potential using event-basedapproaches.
V. RELATED WORK
In this paper, we propose a CEP framework to detectrealtime patterns for opportunistic DR in Smart Grids. Ex-isting DR use incentive-based and schedule-based programs.Incentive-based programs such as dynamic pricing offer ben-efits to customers who perform voluntary curtailment. Thisrequires manual intervention by customers and the outcomeis less reliable. Efforts have been made to enable realtimepricing. Open Automated Demand Response CommunicationsSpecifications (OpenADR) model [14], [10] is increasinglyused to communicate pricing signals to customers. Thesesignals are mapped to operation modes of building controlsystems through simple production rules. Compared to ourwork, this approach only considers pricing DR signals asevents to drive curtailment.
Demand schedules are commonly used in Smart Grids.These typically model demand management as a mathematicoptimization problem, maximizing user or utility’s benefits.[12] discusses optimal schedules of generation units anddemand-side reserves, formulating the objective function asa standard two-stage stochastic programming model. [11], [8]proposes demand management models for a single householdwhich schedule appliance activities attempting to minimizeuser bills. [15] takes user preferences into account with theconcept of discomfort level and formulates DR as an optimiza-tion problem to balance the load and the user comfortness.Other work also include schedule-based DR in microgridscenarios. [4], [6] proposed two models to compute the opti-mum energy plan, i.e. the amount of power to be purchased,sold, transferred, and stored in microgrid for a time period tominimize the total operation cost.
Nevertheless, these DR approaches are predicated on accu-rate mathematical modeling which require in-depth knowledgeof the system and are not sustainable as the power grid evolveswith new appliances and information sources deployed. Un-predictable events that influence power consumptions alsooccur dynamically. An opportunistic DR scheme driven byreal-time monitoring data is hence useful to supplement theseexisting approaches. CEP itself has received much attentionin the research community motivated by its applications in avariety of domains such as financial services [3], [9] and sensornetwork [7], [16]. To our knowledge, we are among the firstgroups to apply CEP for DR applications at a microgrid scale.
VI. CONCLUSION
In this paper, we have discussed the application of semanticcomplex event processing for dynamic DR in a campus micro-grid environment. Realtime power grid monitoring informationand domain knowledge are abstracted as semantic events. DR
applications such as monitoring, prediction and opportunisticcurtailment are modeled as high level pattern queries overthe event streams. These and other categories of DR pattersare analyzed from different perspectives and structured into ataxonomy. We believe this taxonomy will inform and spurfurther interest in investigating the role of CEP for theirpower grid environment. We have validated our illustrativepatterns through real world experiments in the USC campusmicrogrid. We believe the opportunistic DR strategy offeredby our proposed informatics paradigm is a vital supplementto traditional schedule and incentive based DR, and advancesthe state of the art.
ACKNOWLEDGMENT
This work is supported by the Department of Energyunder Award Number DE-OE0000192 and the Los AngelesDepartment of Water and Power. The views and opinions ofauthors expressed herein do not necessarily state or reflectthose of the United States Government or any agency thereof,the LA DWP, nor any of their employees.
REFERENCES
[1] SPARQL. http://www.w3.org/TR/rdf-sparql-query.[2] FERC assessment of demand response and advanced metering. Staff
Report, December 2008.[3] A. Adi, D. Botzer et al. Complex event processing for financial services.
In IEEE Services Computing Workshops, 2006.[4] A. Bagherian and S. Tafreshi. A developed energy management system
for a microgrid in the competitive electricity market. In PowerTech,IEEE Bucharest, 2009.
[5] S. Bhattacharyya and G. Timilsina. Energy demand models for policyformulation. The World Bank, Policy Research Working paper, 2009.
[6] S. Choi, S. Park, D.-J. Kang, S. jae Han, and H.-M. Kim. A microgridenergy management system for inducing optimal demand response. InIEEE International Conference on Smart Grid Communications, 2011.
[7] J. Dunkel. On complex event processing for sensor networks. InInternational Symposium on Autonomous Decentralized Systems, 2009.
[8] S. Hatami and M. Pedram. Minimizing the electricity bill of cooperativeusers under a quasi-dynamic pricing model. In IEEE InternationalConference on Smart Grid Communications, 2010.
[9] Y. Magid, A. Adi, M. Barnea, D. Botzer, and E. Rabinovich. Applicationgeneration framework for real-time complex event processing. In IEEEInternational Conference on Computer Software and Applications, 2008.
[10] J. Mathieu, P. Price, S. Kiliccote, and M. Piette. Quantifying changesin building electricity use, with application to demand response. IEEETransactions on Smart Grid, 2011.
[11] A.-H. Mohsenian-Rad and A. Leon-Garcia. Optimal residential load con-trol with price prediction in real-time electricity pricing environments.IEEE Transactions on Smart Grid, 2010.
[12] M. Parvania and M. Fotuhi-Firuzabad. Demand response scheduling bystochastic SCUC. IEEE Transactions on Smart Grid, 2010.
[13] Q. Zhou, Y. Simmhan and V. Prasanna. Semantic complex eventprocessing over end-to-end data flows. Technical report, USC, 2012.
[14] G. Thatikar, J. Mathieu, M. Piette, and S. Kiliccote. Open automateddemand response technologies for dynamic pricing and smart grid. InGrid-Interop Conference, 2010.
[15] C. Wang and M. de Groot. Managing end-user preferences in thesmart grid. In ACM Conference on Energy-Efficient Computing andNetworking, 2010.
[16] W. Wang, J. Sung, and D. Kim. Complex event processing in epcsensor network middleware for both rfid and wsn. In IEEE InternationalSymposium on Object Oriented Real-Time Distributed Computing, 2008.
[17] Y. Simmhan, S. Aman et al. An informatics approach to demandresponse optimization in Smart Grids. Technical report, USC, 2011.
[18] Q. Zhou, S. Natarajan, Y. Simmhan, and V. Prasanna. Semanticinformation modeling for emerging applications in smart grid. In IEEEConference on Information Technology: New Generations, 2012.