on the signal processing operations in ligo signals · that gw170814, gw170817, gw151226 and...
TRANSCRIPT

,
On the Signal Processing Operationsin LIGO signals
Akhila Ramana
aUniversity of California at Berkeley
E-mail: [email protected]
Abstract. This article analyzes the data for the four gravitational wave (GW) events detected inHanford(H1) and Livingston(L1) detectors by the LIGO1 collaboration and also two more eventsdetected by H1, L1 and Virgo(V1) detectors. It is shown that GW170608, GW170814, GW151226and GW170104 are very weak signals whose amplitude does not rise significantly during the GWevent, and they are indistinguishable from non-stationary detector noise.
LIGO software implements cross-correlation funcion(CCF) of H1/L1 signals with the templatereference signal, in frequency domain, in a matched filter, using 32 second windows. It is shown thatthis matched filter misfires with high SNR/CCF peaks, even for very low-amplitude, short bursts ofsine wave signals and additive white gaussian noise(AWGN), all the time. It is shown that this erraticbehaviour of the matched filter, is due to the error in signal processing operations, such as lack ofcyclic prefix necessary to account for circular convolution and error in whitening operations. It isalso shown that normalized CCF method implemented in time domain using short windows, does nothave false CCF peaks for sine wave and noise bursts.
It is shown that the normalized CCF for GW151226 and GW170104, when correlating H1/L1and template, is indistinguishable from correlating detector noise and the template. It is also shownthat the normalized CCF for GW151226 and GW170104, when correlating H1/L1 and template, isindistinguishable from correlating the template vs bogus chirp templates which are frequency modu-lated(FM) waveforms which differ significantly from ideal templates. Similar results are shown withLIGO matched filter, which misfires with high Signal to Noise Ratio(SNR) for bogus chirp templates.
Hence it is argued that H1 vs L1 cross-correlation test is necessary to avoid this wrong classi-fication of detector noise and bogus templates as GW signals. It is shown that normalized CCF ispoor, when correlating H1 and L1, which is indistinguishable from detector noise correlations, forGW151226, GW170104, GW170608 and GW170814 and hence it is suggested that they are furtherstudied as candidates for GW signals. The implications of these results are discussed for GW150914and GW170817 and the possibility of electro-magnetic interference is discussed. All the results inthis paper are demonstrated using modified versions of LIGO’s Python scripts[16].2
1The Laser Interferometer Gravitational-Wave Observatory2The specific Python script used to generate Fig.1 to Fig.23 in this manuscript, is mentioned in [16].
arX
iv:1
711.
0742
1v3
[ee
ss.S
P] 1
2 M
ar 2
018

Contents
1 Introduction 1
2 Errors in Signal Processing Operations in LIGO’s Matched Filter 22.1 Signal Processing Operations in LIGO’s Matched Filter 32.2 Error in LIGO Whitening operation in the matched filter 6
3 Bogus Chirp Templates produce false peaks in the matched filter 8
4 Need for H1 vs L1 cross-correlation test: Ruling Out False detection of non-GW signals 9
5 H1 vs L1 cross-correlation test fails for GW170814 and GW170608 11
6 Electro-Magnetic Interference in the GW channel as a candidate for GW signals 126.1 The case of GW170817 13
7 Concluding remarks 13
8 Appendix A 15
9 Appendix B 20
1 Introduction
The first gravitational wave GW signal observed in the LIGO detector was GW150914 [1] whichis the strongest of the GW signals observed so far. But, we can see from Fig.1 that, the maximumamplitude of the recovered template1 (1.2 ∗ 10−21) shown in the right panel, after LIGO whiteningprocedure(detailed in Section 2.2) and filtered in 43-300Hz range, is 1
400 th of the amplitude of theraw strain2 in the left panel (0.5∗10−18). 85 percent of the template energy is in the 43-300Hz range.We can also see that, the recovered template for GW150914 in the right panel, is submerged belowthe maximum amplitude of the filtered strain (3 ∗ 10−21) in the middle panel.
Figure 1. GW150914 H1 and L1 strains: Left Panel: Raw strain. Middle Panel: Raw strain filtered in 43-300Hz range. Right Panel: LIGO whitened and filtered strains
1 Template is the reference signal we hope to detect.2Raw strain contains detector noise and the short duration GW event, which may contain the template.
– 1 –

The first gravitational wave GW signal observed in the LIGO detector was GW150914 [1]which was a relatively strong signal whose amplitude, after whitening and filtering3, rose signifi-cantly, well over detector noise level, during the 0.2 second GW event duration. In comparison, thesecond signal[2] GW151226, the third signal[3] GW170104, the fourth signal [6] GW170608, thefifth signal[4] GW170814 and the sixth signal[5] GW170817 were very weak signals, which looklike noise after whitening and filtering and whose signal amplitude does not rise above the detectornoise level during the GW event of duration of less than 1 second (Fig.19, Fig.20, Fig.21, Fig.22,Fig.23 ).
This raises the important question of whether GW151226 and GW170104 could have beencaused by bogus chirp templates, non-GW signals from other sources or non-stationary detectornoise. Because we are more often likely to observe weak signals which look like noise and whoseamplitude does not rise during assumed GW event, it is of paramount importance that we should notclassify non-GW signals or noise as GW events. We must insist on high standards before classifyingan observed time series as a GW signal.
The organization of this paper is as follows. In Section 2, it is shown that LIGO matched filtermisfires with high SNR/CCF peaks, even for very low-amplitude, short bursts of sine wave signalsand additive white gaussian noise(AWGN), all the time. It is shown that this erratic behaviour of thematched filter, is due to the error in signal processing operations.
In Section 3, bogus chirp templates are simulated, which model the ideal template as a frequencymodulated signal and then noise is added to the phase. It will be shown that the LIGO matched filtermisfires with high SNR, even for bogus chirp templates added to the detector noise and is indistin-guishable from the SNR observed for ideal template, resulting in false coincidence, for GW151226and GW170104.
Hence it is argued that H1 vs L1 cross-correlation test is necessary to avoid this wrong clas-sification of bogus templates as GW signals, irrespective of the source of these bogus templates. InSection 4, using Normalized Cross Correlation Function(CCF) method, it will be shown that the nor-malized CCF of H1 vs L1, is indistinguishable from detector noise correlations, for GW151226 andGW170104. In Section 5, it will be shown that the normalized CCF of H1 vs L1, is indistinguishablefrom detector noise correlations, for GW170814 and GW170608.
2 Errors in Signal Processing Operations in LIGO’s Matched Filter
The core engine of the LIGO software for identification of GW signals is the matched filter as de-scribed in Eq.1-4 in [7], which is used in two independent search methods, PYCBC and GSTLALanalysis4. For the case of PYCBC analysis, matched filter SNR(MF-SNR) ρ2(t) is given as follows.
3LIGO detectors have significant impulsive interference at 60*n Hz and other frequencies, hence they are removed bywhitening the signal. Then fourth order Butterworth bandpass filters are used in frequency range 43-300Hz for GW150914,43-800Hz for GW170104 and GW151226.
4 GSTLAL analysis also uses matched filter search, and as per Page 7 in [7], ”the data s(t) and templates h(t) are eachwhitened in the frequency domain by dividing them by an estimate of the power spectral density of the detector noise.”and also ”By the convolution theorem, ρ(t) obtained in this manner is the same as the ρ(t) obtained by frequency domainfiltering in Eq. (1).”[in PYCBC analysis]. These equations are implemented in lines 662-740 in the matched filter sectionof LIGO’s tutorial python script. [14].
– 2 –

ρ2(t) =1
|〈h|h〉||〈s|h〉(t)|2
〈s|h〉(t) = 4
∫ ∞0
s(f)h∗(f)
Sn(f)ei2πftdf
(2.1)
where s(t) and h(t) are the strain signal and the template respectively and s(f) and h∗(f) are theFourier Transforms of s(t) and h∗(−t) respectively and Sn(f) is the power spectral density of thedetector noise. In the time domain, this is equivalent to the convolution of whitened version of s(t)with real h(−t), which is equivalent to the Cross-Correlation Function(CCF) of the whitened strainsignal s(t) and the template h(t), with a normalization scale factor as follows.
〈h|h〉 = 4
∫ ∞0
h(f)h∗(f)
Sn(f)df (2.2)
It is noted that the above CCF is not normalized to give MF-SNR =1 for an ideal templatecorrelated with itself. The expression for re-weighted SNR is given in Eq.6. in [7] and the re-weighted SNR threshold of 5 is used to declare a GW event.
2.1 Signal Processing Operations in LIGO’s Matched Filter
LIGO software implements cross-correlation funcion(CCF) of H1/L1 signals with the template ref-erence signal, in frequency domain, in a matched filter, using 32 second windows. It is shown in thesubsections below, that this matched filter misfires with high SNR/CCF peaks, even for very low-amplitude, short bursts of sine wave signals and additive white gaussian noise(AWGN), all the time.It is also shown that normalized CCF method implemented in time domain using short windows, doesnot have false CCF peaks for sine wave and noise bursts (It may produce false CCF peaks for noiseburst rarely, but not all the time).
It is shown here that this erratic behaviour of the matched filter, is due to the error in signalprocessing operations, such as lack of cyclic prefix necessary to account for circular convolution.LIGO matched filter is supposed to implement Eq. 2.1 and we see that the Fourier transform ofthe whitened strain signal s(t) is multiplied by the complex conjugate of the Fourier transform ofthe template h(t) and then the inverse Fourier transform is taken. This is equivalent to the linearconvolution of whitened version of s(t) with real h(−t), which is Cross-Correlation Function(CCF)of the whitened strain signal s(t) and the template h(t), which is the desired operation.
However, in the discrete time implementation in LIGO python script (code section), this isequivalent to circular convolution of s(t) with h(−t) in time domain. Circular convolution fordiscrete time signals differs from linear convolution (here) and cyclic prefix, which is given by thelast N samples of s(t), where N is the length of the template h(t), should be included, to accountfor the resulting artifacts (here). LIGO implementation does not provide a cyclic prefix for the timedomain signal s(t). This may be one reason why LIGO matched filter misfires with high SNR, evenfor very low-amplitude, short bursts of sine wave signals and noise burst, all the time.
LIGO’s Matched Filter Misfires for Sine Wave and AWGN
In this section, we will examine whether LIGO’s matched filter fires with high SNR, if it is fed witha signal other than the template. Let us test it by replacing the GW150914 signal at H1 with thesignal wd(t)+a(t), where wd(t) is the raw unwhitened H1 detector noise, obtained from a 32 second
– 3 –

Figure 2. Upper Panels: LIGO matched filter Reweighted SNR. Left: Sinewave + H1 detector noise vstemplate. Right: AWGN + L1 detector noise vs template. Middle panels: Raw unwhitened signals in the timedomain. Left: (Sinewave + H1 detector noise) . Right: AWGN + L1 detector noise. Lower Panels: NormalizedCCF of whitened and filtered signals. Left: (Sinewave + H1 detector noise) vs template. Middle: (AWGN+ L1detector noise) vs template. Right: (Sinewave + H1 detector noise) vs (AWGN + L1 detector noise).
block of data which does not contain the GW signal, and a(t) is a sine wave of duration 1 secondand frequency 64 Hz, scaled so that the standard deviation of a(t) is at least 100 times lower thanstandard deviation of wd(t) and has an exponential decay. Then we correlate wd(t) + a(t) with theGW150914 template h(t) in the LIGO matched filter.
Similarly, we replace the GW150914 signal at L1 with the signal wd(t) + b(t), where wd(t)is the raw L1 detector noise, obtained from a 32 second block of data which does not contain theGW signal, and b(t) is AWGN of duration 1 second, scaled so that the standard deviation of b(t) isat least 500 times lower than standard deviation of wd(t). Then we correlate wd(t) + b(t) with theGW150914 template h(t) in the LIGO matched filter.
Fig. 2 shows the results, and we can see from upper left panel that, even a low-amplitude sinewave added to the detector noise can produce high reweighted SNR in LIGO’s matched filter, wellhigher than the specified threshold of 5 . This result is not unique to any specific sine wave frequency,but similar results are observed for other frequencies as well and also for GW151226 and GW170104.Similarly, we can see from the upper right panel that, even low-amplitude white gaussian noise addedto the detector noise can produce high reweighted SNR in LIGO’s matched filter, well higher than
– 4 –

the specified threshold of 5 . Similar results are observed for GW151226 and GW170104.This means, we cannot be sure whether GW signal or a low-amplitude sine wave or noise burst,
produced high SNR in LIGO’s matched filter. It is possible that there was coincident false detectionat H1 and L1, due to a low-amplitude sine wave at one detector and noise burst in the other detector.We do not know the probability of this false coincident detection, due to unknown external factors.LIGO’s false alarm rate calculation is not applicable for this case, which pertains only to coincidentfalse detection due to detector noise.
It should be noted that we do not claim that a sinewave or noise burst caused GW150914 or theother GW signals. The point is that when LIGO matched filter shows high SNR, it could be due to asine wave or noise burst as well. We cannot be sure that a GW signal caused high SNR.
On the other hand, normalized Cross Correlation Function(CCF) in time domain, described inthe next subsection, of whitened and filtered wd(t)+a(t) with the template h(t), CCF of wd(t)+b(t)with the template h(t), and also CCF of wd(t) + a(t) with wd(t) + b(t), using short windows for theduration of the GW signal, does not produce peaky CCF 5 as in the lower panels in Fig. 2. Hence itis suggested that normalized CCF in time domain, using short windows be used. Besides, long 32second windows used in LIGO’s matched filter, include noise outside the duration of the GW signal,which can only reduce the sensitivity, as shown in the following subsections.
Hence H1 vs L1 cross-correlation test is necessary to avoid this wrong classification of low-amplitude noise burst/sine wave, as GW signals, detailed in Section 4.
Section 9 explains in detail why the false alarm rate calculation is not applicable for this examplein the presence of non-stationary detector noise.
Normalized CCF method
Let us consider a normalized Cross Correlation Function(CCF) described in Eq 2.3, where both s(t)and h(t) are normalized over the time window [-T,T] during which GW signal was observed, suchthat CCF of each signal with itself gives a result of unity for zero lag. GW150914 was observed in thewindow of duration 0.2 seconds, GW151226 in a duration of 1 second and GW170104 in a durationof 0.12 seconds[1–3].6 We will use reference systems as follows.
CCF (t) =
∫ T
−Ts(τ)h(t− τ)dτ (2.3)
Normalized CCF of H1/L1 with template is the same as ”matched filtering of H1/L1 withtemplate” using short windows in time domain and is an equally sensitive test. It was shown inSection 2 that matched filter in fact does cross-correlation. The tests listed in this section are newtests with short windows.
In this manuscript, the term ”Normalized CCF” is used to describe the cross-correlation of anytwo signals, such as H1/L1 with templates or H1 with L1, in time domain, using short windowsover which GW event was observed, and the signals are normalized such that CCF of a signal withitself gives a value of unity at zero lag. The term ”LIGO matched filter” is used to describe the
5By peaky CCF, we mean that the ratio, R, of the the absolute value of CCF for any lag greater than the decorrelationtime of the template, to the absolute maximum value of CCF, should be less than a certain threshold. Decorrelation time ofthe template τ0 is defined as the time taken for the autocorrelation of the template to fall to 1
e= 0.36 of the maximum value
at zero lag [12] We will use the ratio R3, which is the ratio of the absolute value of CCF at any lag greater than τ0 ∗ 3 tothe absolute maximum value of CCF, and test whether R3 <
1e
. Lag greater than τ0 ∗ 3 is taken to allow for some cushion.6Normalized CCF using running windows method using, say 32 seconds of H1 and 0.2 seconds of L1, gives similar
results as this method using short windows for both H1 and L1.
– 5 –
matched filter implemented in LIGO python script[15], which does matched filtering of H1/L1 andthe template, using 32 second windows, implemented in frequency domain.
Long windows vs short windows for CCF
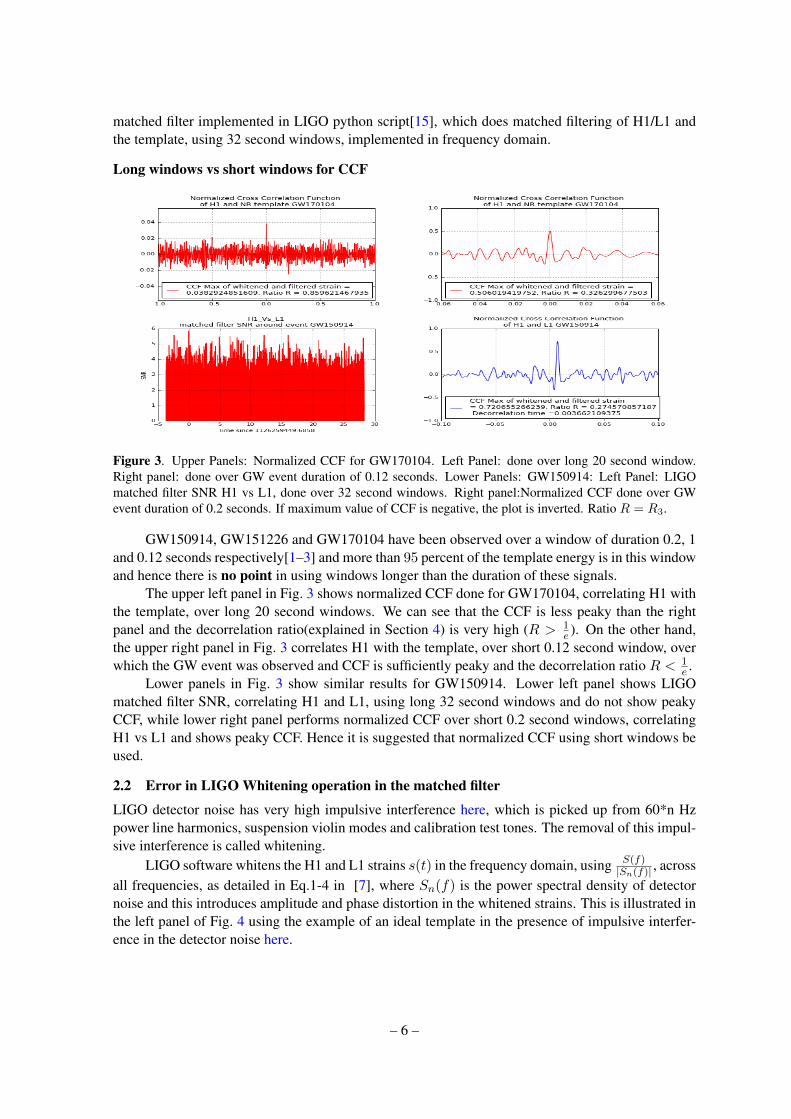
Figure 3. Upper Panels: Normalized CCF for GW170104. Left Panel: done over long 20 second window.Right panel: done over GW event duration of 0.12 seconds. Lower Panels: GW150914: Left Panel: LIGOmatched filter SNR H1 vs L1, done over 32 second windows. Right panel:Normalized CCF done over GWevent duration of 0.2 seconds. If maximum value of CCF is negative, the plot is inverted. Ratio R = R3.
GW150914, GW151226 and GW170104 have been observed over a window of duration 0.2, 1and 0.12 seconds respectively[1–3] and more than 95 percent of the template energy is in this windowand hence there is no point in using windows longer than the duration of these signals.
The upper left panel in Fig. 3 shows normalized CCF done for GW170104, correlating H1 withthe template, over long 20 second windows. We can see that the CCF is less peaky than the rightpanel and the decorrelation ratio(explained in Section 4) is very high (R > 1
e ). On the other hand,the upper right panel in Fig. 3 correlates H1 with the template, over short 0.12 second window, overwhich the GW event was observed and CCF is sufficiently peaky and the decorrelation ratio R < 1
e .Lower panels in Fig. 3 show similar results for GW150914. Lower left panel shows LIGO
matched filter SNR, correlating H1 and L1, using long 32 second windows and do not show peakyCCF, while lower right panel performs normalized CCF over short 0.2 second windows, correlatingH1 vs L1 and shows peaky CCF. Hence it is suggested that normalized CCF using short windows beused.
2.2 Error in LIGO Whitening operation in the matched filter
LIGO detector noise has very high impulsive interference here, which is picked up from 60*n Hzpower line harmonics, suspension violin modes and calibration test tones. The removal of this impul-sive interference is called whitening.
LIGO software whitens the H1 and L1 strains s(t) in the frequency domain, using S(f)|Sn(f)| , across
all frequencies, as detailed in Eq.1-4 in [7], where Sn(f) is the power spectral density of detectornoise and this introduces amplitude and phase distortion in the whitened strains. This is illustrated inthe left panel of Fig. 4 using the example of an ideal template in the presence of impulsive interfer-ence in the detector noise here.
– 6 –

Figure 4. GW150914: Left Panel: LIGO Whitening of (ideal template + impulsive interference). Right Panel:Modified Whitening only around impulsive interference of (ideal template + impulsive interference).
A modified whitening procedure is proposed here, where we whiten the strain, only around thevicinity of the impulsive interference. We can see in the right panel in Fig. 4 that this procedure worksbetter than LIGO whitening procedure and lowers amplitude and phase distortion.
We can show mathematically how the whitening procedure used in LIGO python scripts givenby Sw(f) = S(f)
|Sn(f)| introduces amplitude and phase distortion in the whitened strains. This is il-lustrated in a simplified example, with s(t) = h(t) + wem(t) where h(t) is the ideal template andwem(t) = A cos(2πf0t) is the 60 Hz EM interference, where f0 = 60+ δ, where δ is chosen to be inbetween the FFT frequency bins, so that they will have an effect on the adjacent frequency bins. Thisis a reasonable example given that 60 Hz EM interference is likely to have a frequency spread around60 Hz.
s(t) = h(t) + wem(t) = h(t) +A cos(2πf0t)
S(f) = H(f) +Wem(f) = (Hr(f) + i ∗Hi(f)) + (Wr(f) + i ∗Wi(f))
|S(f)| =√
(Hr(f) +Wr(f))2 + (Hi(f) +Wi(f))2
(2.4)
This can also be written as follows.
S(f) = H(f) +Wem(f) = |H(f)|eiθh(f) + |Wem(f)|eiθw(f)
= [|H(f)| cos θh(f) + |Wem(f)| cos θw(f)] + i[|H(f)| sin θh(f) + |Wem(f)| sin θw(f)]
Sw(f) =S(f)
|Sn(f)|=|S(f)||Sn(f)|
ei tan−1 [|H(f)| sin θh(f)+|Wem(f)| sin θw(f)]
[|H(f)| cos θh(f)+|Wem(f)| cos θw(f)]
Sw(f) =
√(Hr(f) +Wr(f))2 + (Hi(f) +Wi(f))2
|Sn(f)|ei tan−1 [|H(f)| sin θh(f)+|Wem(f)| sin θw(f)]
[|H(f)| cos θh(f)+|Wem(f)| cos θw(f)]
(2.5)
Hence whitening using Sw(f) = S(f)|Sn(f)| causes amplitude distortion in the whitened strain,
given that the magnitude of FFT of the ideal template has been artificially modified by the whiteningprocedure.
In the absence of 60 Hz EM interference, Wem(f) = 0 and Sw(f) =|H(f)||Sn(f)|e
iθh(f) and we cansee that the addition of 60 Hz EM interference causes phase distortion in the whitened strain.
– 7 –

We know that the Fourier Transform of a continuous time signal wem(t) = A cos(2πf0t) isgiven by Wem(f) = A
2 (δ(f − f0) + δ(f + f0)). In discrete-time version, we have Wem[k] =N−1∑n=0
wem[n]e−i2πn k
N and given that the chosen frequency f0 could be in between the frequency bins,
it will spread into adjacent bins and cause more amplitude and phase distortion.
3 Bogus Chirp Templates produce false peaks in the matched filter
Figure 5. GW170104: Left: Ideal template. Middle: Simulated FM Chirp Template. Right: Phase of Simu-lated FM Template
Let us consider the ideal template h(t) for GW170104, which is shown in the left panel of Fig.5.We can simulate this ideal template by a frequency modulated(FM) waveform in the middle panel,where hs(t) = cos(m(t)), where m(t) is the phase of FM signal, which is shown in the right panel.This simulated FM signal also is a chirp signal with frequency increasing from the left to the right.
Now we can simulate bogus chirp templates hb(t), where hb(t) = cos(mb(t)),mb(t) = m(t)+wm(t) and wm(t) is additive white gaussian noise(AWGN) added to the phase of the FM template.
We will inject these bogus chirp templates to the detector noise and show in the section below,that LIGO matched filter misfires with high SNR, even for bogus chirp templates. We will showsimilar results using time domain CCF method.
It is possible that there was coincident false detection at H1 and L1, due to a bogus chirptemplate at one detector and a different bogus chirp template or a noise burst, in the other detector.We do not know the probability of this false coincident detection, due to unknown external factors.LIGO’s false alarm rate calculation is not applicable for this case, which pertains only coincidentfalse detection due to detector noise.
Irrespective of the source of these bogus chirp templates, it will be argued that H1 vs L1 cross-correlation test is necessary to avoid this wrong classification of bogus templates as GW signals,detailed in Section 4, given the need for high standards for classifying a GW signal.
False SNR peaks in LIGO matched filter with bogus templates for GW150914.
Let us consider the case where a noisy signal roughly resembling the template but generated byfrequency modulation(FM) 7, is observed at L1. This bogus template also produces SNR peaks,when correlated with the template, as in the lower right panel of Fig. 6. This happens more than 50percent of the time, in Monte-Carlo simulations with white gaussian noise.
The upper left panel in Fig. 6 shows the ideal L1 template of GW150914 and the bogus L1template. The upper right panel shows the error between the L1 bogus template and the ideal template.
7The template for GW150914 is represented by a FM signal h(t) = cos(m(t)). Bogus template is given by hb(t) =cos(mb(t)) where mb(t) = m(t) + wm(t) and wm(t) are white gaussian noise.
– 8 –

Figure 6. GW150914: Upper Left: Red: Ideal template. Black: Bogus Template. Upper Right: Error betweenIdeal and Bogus Templates. Lower Left: LIGO matched filter Reweighted SNR for L1 vs Ideal template.Lower Right: LIGO matched filter Reweighted SNR for L1 vs Bogus template.
The lower left panel in Fig. 6 shows LIGO matched filter reweighted SNR, when correlating L1 withthe template of GW150914 and the lower right panel shows SNR peaks obtained by correlatingtemplate vs L1 bogus template added to the detector noise. We can see that GW150914 shows SNRpeaks comparable with SNR peaks corresponding to bogus template correlations.
Given that bogus template can produce comparable correlations with the template, as the ob-served GW150914 signal, this means that we cannot be sure whether the SNR peaks in GW150914were caused by GW signals or bogus template correlations. Hence H1 vs L1 cross-correlation test isnecessary to avoid this wrong classification of bogus templates as GW signals, detailed in Section 4.
Similar results are observed for GW151226 and GW170104 and are detailed in the section 8.
4 Need for H1 vs L1 cross-correlation test: Ruling Out False detection of non-GWsignals
We do not want to accept above false coincident detection in section 2, section 3 as a valid GW signal,because they were false coincidences. We can rule out these cases of false coincident detection bycorrelating H1 with L1, which gives poor CCF peaks for GW151226 and GW170104, as in the leftpanel in Fig. 8, which are indistinguishable from detector noise correlations in the right panels.
It is possible that there was coincident false detection at H1 and L1, due to any combinationof sine wave/noise burst/bogus chirp templates/detector noise, in both detectors. We do not know theprobability of this false coincident detection, due to unknown external factors. LIGO’s false alarm
– 9 –
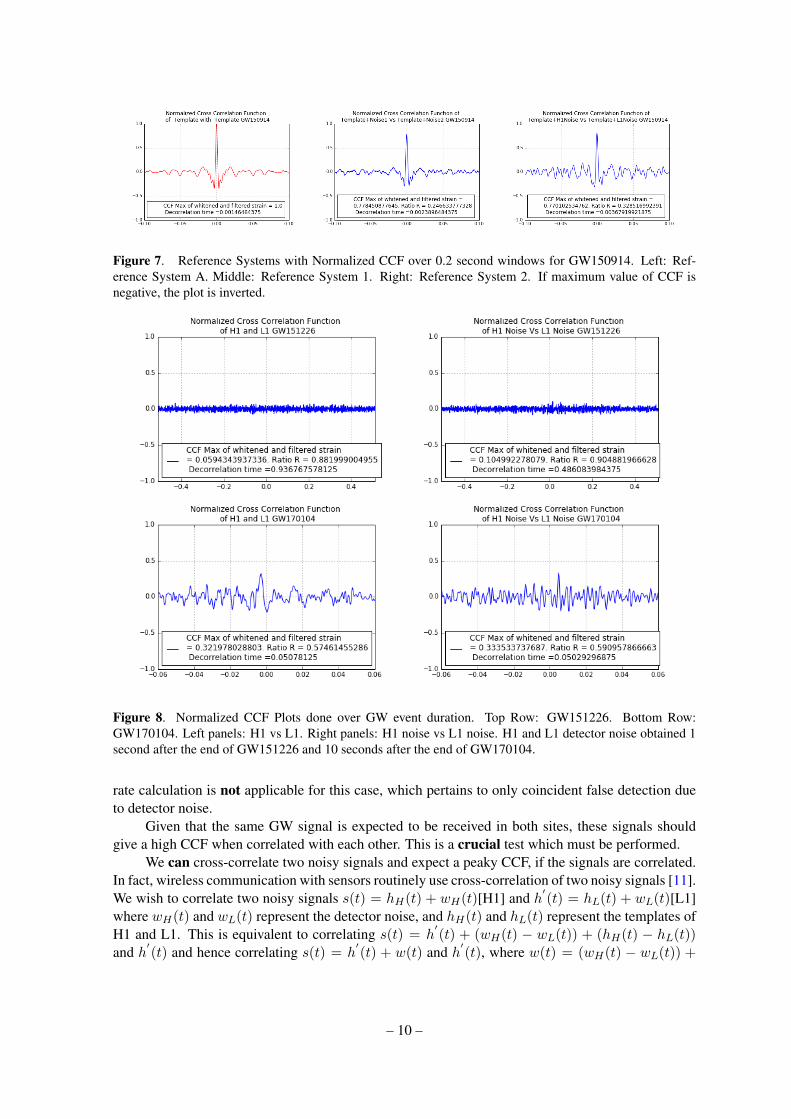
Figure 7. Reference Systems with Normalized CCF over 0.2 second windows for GW150914. Left: Ref-erence System A. Middle: Reference System 1. Right: Reference System 2. If maximum value of CCF isnegative, the plot is inverted.
Figure 8. Normalized CCF Plots done over GW event duration. Top Row: GW151226. Bottom Row:GW170104. Left panels: H1 vs L1. Right panels: H1 noise vs L1 noise. H1 and L1 detector noise obtained 1second after the end of GW151226 and 10 seconds after the end of GW170104.
rate calculation is not applicable for this case, which pertains to only coincident false detection dueto detector noise.
Given that the same GW signal is expected to be received in both sites, these signals shouldgive a high CCF when correlated with each other. This is a crucial test which must be performed.
We can cross-correlate two noisy signals and expect a peaky CCF, if the signals are correlated.In fact, wireless communication with sensors routinely use cross-correlation of two noisy signals [11].We wish to correlate two noisy signals s(t) = hH(t) + wH(t)[H1] and h
′(t) = hL(t) + wL(t)[L1]
where wH(t) and wL(t) represent the detector noise, and hH(t) and hL(t) represent the templates ofH1 and L1. This is equivalent to correlating s(t) = h
′(t) + (wH(t) − wL(t)) + (hH(t) − hL(t))
and h′(t) and hence correlating s(t) = h
′(t) + w(t) and h
′(t), where w(t) = (wH(t) − wL(t)) +
– 10 –

(hH(t)−hL(t)). h′(t) is the noisy template. The theory of matched filter or cross-correlation imposes
no constraints on the characteristics of the template.The same template h(t) is used in the right panels CCF plots of Fig. 7, because the templates
received at H1 and L1 detectors are nearly identical, which differ only by a time shift and a scalefactor, and this does not matter for the ratio R, in the the normalized CCF plots. We observe thatR < 1
e . Given that GW signals are assumed to be the sum of an ideal template and detector noise,this comparison is reasonable.
Reference System A: An ideal template for GW151226 or GW170104 h(t) is correlated withitself, after normalization, to give a peaky CCF. The maximum value of CCF = 1 at zero lag, as in leftpanels in Fig. 7.
Reference System 1: Fig. 7 shows this system in the second panel, which correlates twonoisy signals, s(t) and h
′(t), where s(t) is the sum of the template for GW150914 and AWGN,
and h′(t) is the sum of the same template and an independent AWGN. Then it computes the nor-
malized CCF (t) =∫ T−T s(τ)h
′(t− τ)dτ . We can see that the CCF shows strong peaky behaviour.
Average decorrelation time for this system is τ1 = 0.0024 seconds.Reference System 2: Fig. 7 shows a reference system 2 in the third panel, which correlates two
noisy signals, s(t) and h′(t), where s(t) is the sum of the template for GW150914 and H1 detector
noise outside the GW event, and h′(t) is the sum of the same template and and L1 detector noise
outside the GW event, and computes the normalized CCF. We can see that the CCF shows strongpeaky behaviour. Average decorrelation time for this system is τ2 = 0.0037 seconds.
Reference systems 1 and 2 are shown only for the purpose of demonstrating the fact that we cancross-correlate two noisy signals and expect a peaky CCF. Given the need for high standards requiredin classifying GW signals, we will use only the decorrelation time τ0 of the reference system A, whichcorrelates the template of each GW signal with itself, when we compare the decorrelation times andthe ratio R, of the three GW signals.
Fig. 8 plots the normalized CCF for GW151226(top row) and GW170104 (bottom row) bycorrelating H1 with L1 in the left column and correlating H1 detector noise with L1 detector noise inthe right column. We can see that GW151226 and GW170104 show very poor CCF peaks (R3 >
1e )
when correlating H1 with L1, and we can see that CCF peaks are indistinguishable from CCF peakscorresponding to detector noise in the right column. Hence, we cannot be sure whether detector noiseor GW signal caused the CCF peaks.
We can reproduce these results for longer H1/L1 strains of GW151226 and GW170104 as well.Figure shows CCF done over 14 second duration, when correlating H1 with L1 for GW151226(toppanel) and GW170104(bottom panel). We can see that GW151226 and GW170104 show CCF peaks(left panel) indistinguishable from CCF peaks corresponding to detector noise correlations (rightpanel).
Hence GW170104 and GW151226 should be further studied, based on this test alone[Reason5].
5 H1 vs L1 cross-correlation test fails for GW170814 and GW170608
GW170814 has been observed at three detectors H1, L1 and V1. For the purpose of this section, wewill do the correlation test for H1 vs L1 only and this is enough to show that the correlation test fails.
Fig. 9 plots the normalized CCF for GW170814(top row) and GW170608 (bottom row) bycorrelating H1 with L1 in the left column and correlating H1 detector noise with L1 detector noise inthe right column. We can see that GW170814 and GW170608 show very poor CCF peaks (R3 >
1e )
when correlating H1 with L1, and we can see that CCF peaks are indistinguishable from CCF peaks
– 11 –

Figure 9. Normalized CCF Plots done over GW event duration of 0.2 seconds. Top Row: GW170814. BottomRow: GW170608. Left panels: H1 vs L1. Right panels: H1 noise vs L1 noise. H1 and L1 detector noiseobtained 10 seconds after the end of GW events.
corresponding to detector noise in the right column. Hence, we cannot be sure whether detector noiseor GW signal caused the CCF peaks.
Hence GW170814 and GW170608 should be further studied, based on this test alone[Reason6].
6 Electro-Magnetic Interference in the GW channel as a candidate for GW signals
The gravitational wave(GW) channel in the LIGO detectors, picks up 60*n Hz electro-magnetic(EM)interference(figure) and also wideband EM interference. EM interference may enter the GW channelthrough several paths, by air or wires. Each such path in the GW channel may have a differentcoupling (frequency response).
It is quite possible that lightning, which is an EM interference signal, can be picked up at bothdetectors H1 and L1 and may be mistaken for a GW signal. Lightning has low frequency components,in the 0 to 2048 Hz range. EM signals also travel at the speed of light, similar to the GW signal, andarrive within the 10 ms window at the two detectors.
Given that the strongest signal GW150914 is buried by a factor of 1400 in the raw detector noise
in Fig.1 and does not show any signal spikes in the time domain, the raw magnetometer signal in timedomain, also may not show any signal spikes during the GW events.
We can rule out EM interference in the GW channel, by doing cross-correlation of the magne-tometer signal with the template, during GW event duration. If the EM signal in the magnetometerchannel is subjected to a transfer function different from that of the GW channel, it is entirely possi-
– 12 –

ble that the magnetometer channel may not produce cross correlation peaks when correlated with thetemplate and hence this EM signal may be mistaken for GW signals.
This possibility is explored in detail here and shown that EM interference is a good candidatefor all the 6 GW signals observed so far.
6.1 The case of GW170817
The Gamma Ray Burst(GRB) which was observed with GW170817 was picked up by the telescopes.We know that astrophysical objects such as stars, emit EM signals in a broad frequency range, down toKHz. Our Sun is also known to emit EM signals as low as 30 KHz (NASA document). We know thatGW170817 was observed as a weak signal, whose amplitude does not rise above the detector noiseduring the GW event. If the astrophysical object which emitted the Gamma Ray Burst, also emittedEM signal in the 0 to 2048 Hz frequency range, magnetometers may not show any signal spikes intime domain during the GW event and hence low frequency EM signals from the astrophysical objectwhich emitted the GRB, may be a good candidate for GW170817.
7 Concluding remarks
It is possible that there was coincident false detection at H1 and L1, due to any combination ofexternal sources of sine wave/noise burst/bogus chirp templates, in both detectors. We do not knowthe probability of this false coincident detection, due to unknown external factors. LIGO’s false alarmrate calculation is not applicable for this case, which pertains to only coincident false detection dueto detector noise. It is also possible that external EM signals like lightning may be picked up in theGW channel and mistaken as GW.
Reiterating the point made earlier, because we are more often likely to observe weak signalswhich look like noise and whose amplitude does not rise during assumed GW event, it is of paramountimportance that we should not classify noise or EM interference as GW events. We need high stan-dards to classify an observed time series as a GW signal.
Acknowledgments
I am grateful to Andrew D. Jackson, Dr. A. Paulraj, Helmut Bolcskei and John M Cioffi for encour-agement, suggestions and discussions. I would like to thank Sebastian Domenico von Hausegger andArunava Chaudhuri for review of our Python scripts and helpful suggestions. I would like to thankM.A. Srinivas, Hao Liu, James Creswell, Bhavna Antony, Anant Sahai and Kannan Ramachandranfor discussions and helpful suggestions. I would like to thank LIGO Open Science Center for makingthe data and Python scripts available online. I would like to thank LIGO scientists who answeredmany questions in detail.
References
[1] Abbott, B. P., Abbott, R., Abbott, T. D., et al., Observation of Gravitational Waves from a Binary BlackHole Merger, Physical Review Letters, 116, 061102 (2016) Online version of paper.
[2] Abbott, B. P., Abbott, R., Abbott, T. D., et al., GW151226: Observation of Gravitational Waves from a22-Solar-Mass Binary Black Hole Coalescence, Physical Review Letters, 116, 241103(2016) Onlineversion of paper.
[3] Abbott, B. P., Abbott, R., Abbott, T. D., et al.GW170104: Observation of a 50-Solar-Mass Binary BlackHole Coalescence at Redshift 0.2, Physical Review Letters, 118, 221101 (2017) Online version of paper.
– 13 –
[4] Abbott, B. P., Abbott, R., Abbott, T. D., et al.GW170814: A Three-Detector Observation of GravitationalWaves from a Binary Black Hole Coalescence, Physical Review Letters, 119, 141101 (2017) Onlineversion of paper.
[5] Abbott, B. P., Abbott, R., Abbott, T. D., et al.GW170817: Observation of Gravitational Waves from aBinary Neutron Star Inspiral, Physical Review Letters, 119, 161101 (2017) Online version of paper.
[6] Abbott, B. P., Abbott, R., Abbott, T. D., et al.GW170608: Observation of a 19 Solar-mass Binary BlackHole Coalescence, The Astrophysical Journal Letters, Volume 851, Number 2 (2017) Online version ofpaper.
[7] Abbott, B. P., Abbott, R., Abbott, T. D., et al., GW150914: First Results from the Search for Binary BlackHole Coalescence with Advanced LIGO, Phys. Rev. D 93, 122003 (2016) [see pp.4-9] Arxiv copy of paper.see pp.8-13.
[8] Creswell, J., Hausegger,S., Jackson, A. D., Liu,H., Naselsky, P., On the time lags of the LIGO signals,2017, arxiv:1706.04191 Arxiv copy of paper.
[9] Naselsky, P., Jackson, A. D., & Liu, H., Understanding the LIGO GW150914 event, Journal ofCosmology and Astroparticle Physics, 8, 029 (2016)
[10] Liu, H., & Jackson, A. D., Possible associated signal with GW150914 in the LIGO data, Journal ofCosmology and Astroparticle Physics, 10, 014 (2016)
[11] Garnier, J., Papanicolaou,G., Passive Sensor Imaging Using Cross Correlations of Noisy Signals in aScattering Medium, SIAM J. Imaging Sci., 2(2), 396437.(2009). Online version of paper
[12] Kenneth Y. Jo, Satellite Communications Network Design and Analysis, Page 415.
[13] LOSC LIGO GW150914 Tutorial
[14] LOSC LIGO GW151226 Tutorial matched filter equations are implemented in the section ”matchedfiltering to find the signal”
[15] LIGO Tutorials
[16] Zip Files of Modified LIGO Tutorials which demonstrate the results in this paper..Matched Filter SNR results are demonstrated with 32 second block of data, used in the original LIGOtutorial scripts. Results hold for 512 second block of data also.
– 14 –

8 Appendix A
False SNR peaks in LIGO matched filter with bogus templates for GW151226.
Figure 10. GW151226: Upper Left: Red: Ideal template. Black: Bogus Template. Upper Right: Errorbetween Ideal and Bogus Templates. Lower Left: LIGO matched filter Reweighted SNR for L1 vs Idealtemplate. Lower Right: LIGO matched filter Reweighted SNR for L1 vs Bogus template.
Let us consider the case where a noisy signal roughly resembling the template but generated byfrequency modulation(FM), is observed at L1. This bogus template hb(t) also produces SNR peaks,when correlated with the template, as in the lower right panel of Fig. 10.
The upper left panel in Fig. 10 shows the ideal template of GW151226 and the bogus L1 tem-plate. We can see that the bogus template differs significantly from the ideal template, in fact thelast 5 cycles in the crucial final chirp portion is completely absent. The upper right panel shows theerror between the L1 bogus template and the ideal template. The lower left panel in Fig. 10 showsLIGO matched filter reweighted SNR, when correlating L1 with the template of GW151226 and thelower right panel shows SNR peaks obtained by correlating template vs L1 bogus template added tothe detector noise. We can see that the reweighted SNR due to the bogus template is greater thanthe threshold of 5 and GW151226 shows SNR peaks comparable with SNR peaks corresponding tobogus template correlations.
We can also show high SNR peaks with a bogus H1 template, which is different from a bogusL1 template, as in Fig. 16. This may result in false coincidence. In Section 8, it is shown that detectornoise itself may produce false cross-correlation peaks in L1, while a bogus template may producefalse peaks in H1.
Given that bogus template can produce comparable correlations with the template, as the ob-served GW151226 signal, this means that we cannot be sure whether the SNR peaks in GW151226
– 15 –

were caused by GW signals or bogus template correlations. Hence H1 vs L1 cross-correlation test isnecessary to avoid this wrong classification of bogus templates as GW signals, detailed in Section 4.
Using normalized CCF method in time domain, we can also show high CCF peaks with abogus L1 template, which is different from a bogus L1 template, as in Fig. 13 for GW151226 forGW170104.
Hence GW151226 should be further studied, based on this test alone[Reason 3c].
False SNR peaks in LIGO matched filter with bogus templates for GW170104.
Figure 11. GW170104: Upper Left: Red: Ideal template. Black: Bogus Template. Upper Right: Errorbetween Ideal and Bogus Templates. Lower Left: LIGO matched filter Reweighted SNR for L1 vs Idealtemplate. Lower Right: LIGO matched filter Reweighted SNR for L1 vs Bogus template.
Let us consider the case where a noisy signal roughly resembling the template but generated byfrequency modulation(FM), is observed at L1. This bogus template hb(t) also produces SNR peaks,when correlated with the template, as in the lower right panel of Fig. 11.
The upper left panel in Fig. 11 shows the ideal template of GW170104 and the bogus L1 tem-plate. The upper right panel shows the error between the L1 bogus template and the ideal template.The lower left panel in Fig. 11 shows LIGO matched filter reweighted SNR, when correlating L1 withthe template of GW170104 and the lower right panel shows SNR peaks obtained by correlating tem-plate vs L1 bogus template added to the detector noise. We can see that the reweighted SNR due tothe bogus template is greater than the threshold of 5 and GW170104 shows SNR peaks comparablewith SNR peaks corresponding to bogus template correlations.
We can also show high SNR peaks with a bogus H1 template, which is different from a bogusL1 template, as in Fig. 15. This may result in false coincidence.
– 16 –

Given that bogus template can produce comparable correlations with the template, as the ob-served GW170104 signal, this means that we cannot be sure whether the SNR peaks in GW170104were caused by GW signals or bogus template correlations. Hence H1 vs L1 cross-correlation test isnecessary to avoid this wrong classification of bogus templates as GW signals, detailed in Section 4.
Using normalized CCF method in time domain, we can also show high CCF peaks with a bogusL1 template, which is different from a bogus L1 template, as in Fig. 14 for GW170104.
Hence GW170104 should be further studied, based on this test alone[Reason 3b].
False peaks in time domain cross-correlation method due to Detector Noise and BogusChirp Templates
False coincidence with L1 detector noise and bogus template at H1, in 4096 second block ofdata.
Figure 12. GW151226: CCF Plots done over GW event duration of 1 second, using running windows for theright panels. Upper Left: L1 vs template. Upper Right: L1 Noise vs template. Lower Middle: H1 vs template.Lower Right: (Fake Template+H1 noise) vs template. Lower left: Error between actual and fake template.H1/L1 detector noise obtained from a 4096 second block of data and excluding GW event portions and edges.
The upper left panel in Fig. 12 shows Cross Correlation Function (CCF) done over 1 secondduration, when correlating L1 with the template of GW151226 and the upper right panel shows CCFpeaks obtained by correlating L1 detector noise with the template, using running windows, over 4096second block of data, excluding the GW event portions and edges. We can see that GW151226 showsCCF peaks comparable with CCF peaks corresponding to detector noise correlations, and do notrise well above detector noise correlations.
Given that detector noise can produce comparable correlations with the template, as the ob-served GW151226 signal, let us consider the case where a) detector noise at L1 produces CCF peaks,when correlated with the template, in 4096 second block of data, as in the upper right panel of Fig. 12,and b) a noisy signal roughly resembling the template but generated by frequency modulation(FM)
– 17 –

and amplitude modulation(AM) 8 in the last 0.3 seconds and zero in the first 0.7 seconds, is observedat H1, which also produces CCF peaks, when correlated with the template, as in the lower right panelof Fig. 12.
It is possible that there was coincident false detection at H1 and L1, due to a bogus chirptemplate at one detector and detector noise, in the other detector. We do not know the probability ofthis false coincident detection, due to unknown external factors. LIGO’s false alarm rate calculationis not applicable for this case, which pertains only coincident false detection due to detector noise.
This means that we cannot be sure whether the CCF peaks in GW151226 were caused byGW signals or detector noise correlations and bogus templates. Similar results hold for the case ofGW170104. Hence H1 vs L1 cross-correlation test is necessary to avoid this wrong classification ofbogus templates as GW signals, detailed in Section 4. Hence GW170104 and GW151226 should befurther studied, based on this test alone[Reason 4c].
False peaks in time domain CCF with bogus templates for L1 for GW151226.
Figure 13. GW151226: Upper Left: Red: Ideal template. Black: Bogus Template. Upper Right: Errorbetween Ideal and Bogus Templates. Lower Left: Normalized CCF in time domain for L1 vs Ideal template.Lower Right: Normalized CCF in time domain for L1 vs Bogus template.
Let us consider the case where a noisy signal roughly resembling the template but generated byfrequency modulation(FM), is observed at L1. This bogus template hb(t) also produces CCF peaks,when correlated with the template, as in the lower right panel of Fig. 13.
8The template for GW151226 is represented by a FM+AM signal h(t) = A(t)∗cos(2πf0t+m(t)) where f0 = 56 Hz.Bogus template is given by hb(t) = Ab(t) ∗ cos(2πf0t+mb(t)) where Ab(t) = A(t) +wa(t),mb(t) = m(t) +wm(t)and wa(t), wm(t) are white gaussian noise.
– 18 –

The upper left panel in Fig. 13 shows the ideal template of GW151226 and the bogus L1 tem-plate. The upper right panel shows the error between the L1 bogus template and the ideal template.The lower left panel in Fig. 13 shows Cross Correlation Function (CCF) done over 1 second du-ration, when correlating L1 with the template of GW151226 and the lower right panel shows CCFpeaks obtained by correlating template vs L1 bogus template added to the detector noise. We can seethat GW151226 shows CCF peaks comparable with CCF peaks corresponding to bogus templatecorrelations.
We can also show high SNR peaks with a bogus H1 template, which is different from a bogusL1 template, as in Fig. 18. This may result in false coincidence.
Given that bogus template can produce comparable correlations with the template, as the ob-served GW151226 signal, this means that we cannot be sure whether the CCF peaks in GW151226were caused by GW signals or bogus template correlations. Hence H1 vs L1 cross-correlation test isnecessary to avoid this wrong classification of bogus templates as GW signals, detailed in Section 4.Hence GW151226 should be further studied, based on this test alone[Reason 4a].
False peaks in time domain CCF with bogus templates for GW170104.
Figure 14. GW170104: Upper Left: Red: Ideal template. Black: Bogus Template. Upper Right: Errorbetween Ideal and Bogus Templates. Lower Left: Normalized CCF in time domain for L1 vs Ideal template.Lower Right: Normalized CCF in time domain for L1 vs Bogus template.
Let us consider the case where a noisy signal roughly resembling the template but generated byfrequency modulation(FM), is observed at L1. This bogus template hb(t) also produces CCF peaks,when correlated with the template, as in the lower right panel of Fig. 14.
The upper left panel in Fig. 14 shows the ideal template of GW170104 and the bogus L1 tem-plate. The upper right panel shows the error between the L1 bogus template and the ideal template.
– 19 –

The lower left panel in Fig. 14 shows Cross Correlation Function (CCF) done over 0.1 second du-ration, when correlating L1 with the template of GW170104 and the lower right panel shows CCFpeaks obtained by correlating template vs L1 bogus template added to the detector noise. We can seethat GW170104 shows CCF peaks comparable with CCF peaks corresponding to bogus templatecorrelations.
We can also show high SNR peaks with a bogus H1 template, which is different from a bogusL1 template, as in Fig. 17. This may result in false coincidence.
Given that bogus template can produce comparable correlations with the template, as the ob-served GW170104 signal, this means that we cannot be sure whether the CCF peaks in GW170104were caused by GW signals or bogus template correlations. Hence H1 vs L1 cross-correlation test isnecessary to avoid this wrong classification of bogus templates as GW signals, detailed in Section 4.Hence GW170104 should be further studied, based on this test alone[Reason 4b].
9 Appendix B
False peaks in LIGO matched filter and time domain CCF due to bogus templates at H1, forGW152226, GW170104.
Figure 15. GW170104: Upper Left: Red: Ideal template. Black: Bogus Template. Upper Right: Errorbetween Ideal and Bogus Templates. Lower Left: LIGO matched filter SNR for H1 vs Ideal template. LowerRight: LIGO matched filter SNR for H1 vs Bogus template.
– 20 –

Figure 16. GW151226: Upper Left: Red: Ideal template. Black: Bogus Template. Upper Right: Errorbetween Ideal and Bogus Templates. Lower Left: LIGO matched filter SNR for H1 vs Ideal template. LowerRight: LIGO matched filter SNR for H1 vs Bogus template.
– 21 –

Figure 17. GW170104: Upper Left: Red: Ideal template. Black: Bogus Template. Upper Right: Errorbetween Ideal and Bogus Templates. Lower Left: Normalized CCF in time domain for H1 vs Ideal template.Lower Right: Normalized CCF in time domain for H1 vs Bogus template.
– 22 –

Figure 18. GW151226: Upper Left: Red: Ideal template. Black: Bogus Template. Upper Right: Errorbetween Ideal and Bogus Templates. Lower Left: Normalized CCF in time domain for H1 vs Ideal template.Lower Right: Normalized CCF in time domain for H1 vs Bogus template.
– 23 –

GW waveforms
Figure 19. Plots of H1 whitened and filtered strain in GW150914, GW151226, GW170104, GW170814 andGW170817.
Figure 20. GW151226 whitened and filtered H1 and L1 strain, and the template
– 24 –

Figure 21. GW170104 whitened and filtered H1 and L1 strain, and the template
Figure 22. GW170814 whitened and filtered H1, L1 , V1 strain
– 25 –

Figure 23. GW170817 whitened and filtered H1, L1 , V1 strain
– 26 –

Why False Alarm Rate calculation is unreliable
GW151226 is observed over a duration of 1 second in the window [t1, t2]. Then LIGO softwaresearches the vicinity for a duration of 10 days before or after the event, say [ta, tb], where ta = t1−(11days) and tb = t1 − (1 day). It is possible that, during observation period [ta, tb], there were nocoincident noise bursts, and measured noise events nb(ρc) was low, and computed false alarm rate is1 in 200,000 years.
Given the non-stationarity of detector noise, it is possible that, only during the presumed GWevent window [t1, t2], there was indeed low amplitude noise burst, as in the top right panel in Fig. 2,causing high reweighted SNR in the matched filter for both H1 and L1 and high detection statisticvalue(DSV). This noise burst can be 1
500 times smaller than the standard deviation of detector noise.There is simply no way we can make an argument that, just because LIGO team observed
no coincident noise bursts in [ta, tb], we cannot expect a coincident noise burst in [t1, t2], becausedetector noise is non-stationary. Even a low-amplitude noise burst with standard deviation 1
500 timessmaller than the standard deviation of detector noise, can cause coincident high SNR in matchedfilter. It is also possible that, during observation period [ta, tb], noise had low mean and did notcause high SNR frequently, while during GW event window [t1, t2],, non-stationary noise could havehad higher mean, causing high SNR in the matched filter. We should include this event [t1, t2],in characterizing detector noise and not pre-suppose that these are valid GW events and then lookin the vicinity only, excluding these events, for detector noise characterization and false alarm ratecomputation.
The false alarm rate computation associated with the 5σ significance, using the expression
F (ρc) = 1 − e−TTb
(1+nb(ρc)), is dependent on the critical parameter nb(ρc), which is empiricallydetermined, by observations over a number of days, near the vicinity of the GW event. This empiricalparameter nb(ρc) is the weakest link in the argument. The above counter-example with coincidentlow amplitude noise bursts, directly rebuts it. The empirical parameter nb(ρc) has no theoreticalbasis and is not a reliable predictor of false alarm rate.
If the computed false alarm rate is 200,000 years, this only means that the average time between2 successive false coincident detections is 200,000 years. This does not mean that, we need to waitfor 200,000 years, following the observation period, to observe a false coincident detection. We couldget the first false coincident detection a few months after the end of the observation period, and thesecond detection a few months later, as well. If we observe the detector noise over a period far largerthan 200,000 years, we would expect coincident detections due to noise, with an average interval of200,000 years.
This is the reason, normalized CCF of H1 vs L1 test is crucial, which will reject this coincidentfalse detection. We can rule out this case of false coincident detection by the crucial new test ofnormalized CCF on H1 vs L1, explained in Section 4.
– 27 –