on the relationship between mass and diameter
TRANSCRIPT

On the relationship between mass and diameter distributions in tree communities
James C. Stegen1 and Ethan P. White2*
1 Department of Ecology and Evolutionary Biology, University of Arizona, Tucson, AZ, 85721
2 Department of Biology and the Ecology Center, Utah State University, Logan, UT, 84322
Running Title: Relating mass and diameter distributions
Keywords: individual size distribution, variable transformation, energetic equivalence, metabolic
theory, light competition, resource partitioning
Article Type: Letter
Abstract word count: 124
Manuscript word count: 2858
Number of references: 52
Figures: 2
Supplemental Appendices: 1
*Correspondence: Ethan P. White, Department of Biology, Utah State University, 5305 Old
Main Hill, Logan, UT, 84322. Phone: 435-797-2097. Fax: 435-797-1575. E-mail:
1

Abstract
It has been suggested that frequency distributions of individual tree masses in natural stands are
characterized by power-law distributions with exponents near -3/4, and that therefore tree
communities exhibit energetic equivalence among size classes. Because the mass of trees is not
measured directly, but estimated from diameter, this supposition is based on the fact that the
observed distribution of tree diameters is approximately characterized by a power-law with an
exponent ≈ -2. Here we show that diameter distributions of this form are not equivalent to mass
distributions with exponents of -3/4, but actually to mass distributions with exponents of -11/8.
We discuss the implications of this result for the metabolic theory of ecology and for
understanding energetic equivalence and the processes structuring tree communities.
Keywords: individual size distribution, size spectrum, variable transformation, energetic
equivalence, metabolic theory, light competition, resource partitioning
2

INTRODUCTION
The idea of energetic equivalence was first suggested by Damuth (1981). Damuth noted that
because the average population density of a species, N, was related its mass, M, raised to the -3/4
power and the metabolic rate of an individual, B, was related to its mass raised to the +3/4 power
the population energy use of a species was invariant with respect to mass (i.e.
3 4 3 4 0Q BN M M M−= µ µ ). This pattern has been dubbed the Energetic Equivalence Rule and
is commonly observed at broad spatial scales for mammals, invertebrates, fish, and trees
(Damuth 1987; Cyr et al. 1997; Enquist et al. 1998; Ernest et al. 2003; White et al. 2007).
It has recently been suggested that a related pattern occurs for individual-size
distributions (ISDs) within forest communities. By assuming that the scaling of the distribution
of plant masses within communities behaves in the same manner as the scaling of plant mass and
density across communities, Enquist and Niklas (2001) suggested that the number of individuals
in a mass class, n, should be proportional to the mass of that class raised to the -3/4 power. If this
assumption is valid, then energetic equivalence occurs among mass classes within tree
communities.
Because diameter, D, not mass, is typically measured in forest communities, Enquist and
Niklas (2001) provided indirect support for energetic equivalence across mass classes by
deriving a prediction for the form of the size distribution in terms of diameter, 3 4 2n M D− −µ µ .
In support of this model, Enquist and Niklas (2001) showed that for many of Alwyn Gentry’s
forest plots (Phillips & Miller 2002) abundance among size classes declines approximately to the
-2 power of diameter (but see White et al. 2008). While the precise form of the empirical
diameter distribution and the value of the exponent have recently been questioned, it does appear
that diameter distributions of many forests can be approximately characterized by this pattern
3

over some range of body sizes (Coomes et al. 2003; Muller-Landau et al. 2006b; White et al.
2008; see also Fig. 2).
This result suggests a roughly equal partitioning of resources, energy flux, and net
primary production among mass and diameter classes within forests and may provide insights
into the processes structuring forest communities (Enquist & Niklas 2001; Enquist 2002). This
pattern has subsequently been used to provide linkages from individual-level energetic
constraints to community structure to whole ecosystem processes, and in turn, advance the
metabolic theory of ecology as a powerful and predictive tool capable of integrating across levels
of biological organization (Enquist et al. 2003; Brown et al. 2004; Kerkhoff & Enquist 2006;
Kerkhoff & Enquist 2007). However, here we show that the derived form of the diameter
distribution is incorrect and discuss the implications of this result for metabolic theory, energetic
equivalence, and the processes structuring tree communities.
RELATING MASS AND DIAMETER DISTRIBUTIONS
Enquist and Niklas (2001) established the predicted form of the diameter distribution by
first assuming that N and n scale with body size in the same manner (i.e. 3 4n M −µ ) and then
substituting the relationship between individual mass and tree diameter, 8 3M Dµ (Niklas 1994;
West et al. 1997; West et al. 1999), into the predicted form of the mass distribution. This yields
( ) 3 43 4 8 3 2n M D D−− −µ µ µ (see also Coomes et al. 2003; West & Brown 2004; Marquet et al.
2005; West & Brown 2005; Muller-Landau et al. 2006b; Woodhouse 2006). However, this
substitution is not a valid approach for transforming between variables when dealing with size
distributions, which, unlike other allometric relationships, are characterized by probability
4

density functions. The problem occurs because changing from mass to diameter not only changes
the position of individual points, but also changes the position of those points relative to one
another and hence the density of those points along the size axis.
The appropriate univariate transformation between two probability density functions fX(x)
and fY(y) where x is related to y by x = h(y) is
( ) ( ) ( )( )Y Xf y h y f h y′= (1)
where ( )h y′ is the derivative of ( )yh with respect to y (e.g., Freund 1971; Mood et al. 1974;
Ross 2006). This is the standard method from calculus for a change of variables in a definite
integral (Thomas & Finney 1996). The derivative accounts for the change in the position of the
points relative to one another. Therefore the predicted diameter distribution for a model where
the mass distribution is characterized by ( ) 3 4Mf M M −µ , and where M and D are related by
8 3M Dµ , is given by
( ) ( ) ( ) 3 45 3 8 3 5 3 8 3 1 3D Mf D D f D D D D
− −µ µ µ
demonstrating that the predicted relationship between abundance and diameter is actually D-1/3,
not D-2. Equivalently we can determine the form of the mass distribution that corresponds to a
diameter distribution with an exponent of -2:
( ) ( ) ( ) 25 8 3 8 5 8 3 8 11 8M Df M M f M M M M
−− − −µ µ µ
suggesting that observed individual size distributions of diameter actually support distributions
of mass with exponents near -11/8, not -3/4. These results were confirmed by both simulations
(Fig. 1) and analyses of empirical data (Fig. 2).
This variable transformation error has also occurred in other areas of ecology. Notably,
May (1986), Peters (1983), and Southwood et al. (2006) did not properly transform between size
5

variables when evaluating the form of species body size distributions. The error is likely a result
of thinking about frequency distributions from the perspective of the binning based approaches
often used to analyze the data. These approaches typically treat frequency distribution data as
bi-variate functional relationships, making it appear that the substitution discussed above is valid.
Avoiding binning based approaches when modeling and analyzing frequency distribution data
may help alleviate confusion regarding the type of size-abundance relationship being studied,
and thus clarify the appropriate approach to transforming between variables.
We have focused on the transformation originally laid out in Enquist and Niklas (2001).
However, the form of both the individual size distribution and the relationship between diameter
and mass are subjects of debate (Niklas 1994; West et al. 1997; West et al. 1999; Enquist &
Niklas 2001; Coomes et al. 2003; Chave et al. 2005; Muller-Landau et al. 2006b; Price et al.
2007). The general approach we take is valid for any proposed form of the individual size
distribution and functional relationship between diameter and mass. The transformation can
generally be expressed as,
( ) ( ) ( )|M Df M P M D f D dD= ∫ . (2)
In concept this general solution makes it possible to incorporate alternative and/or more complex
forms of the component relationships including the incorporation of: 1) error around the
allometric relationships; 2) species level variation in the normalization (e.g., through variation in
wood density; Chave et al. 2005) and exponent of the allometric function relating M to D (Price
et al. 2007); and 3) the use of different distributions and functional relationships (e.g., those in
Chave et al. 2005 and Muller-Landau et al. 2006b). In practice, analytical solutions to the
transformation described in equation (2) may prove more difficult in the presence of these
additional sources of complexity. Preliminary simulation results suggest that variability in the
6

exponent does not affect the transformation (Appendix S1), but that error around the allometric
relationships may have some influence on the results (Appendix S1). Further research will be
necessary to fully understand the implications of these and other complexities for transforming
between different forms of the size distribution.
IMPLICATIONS FOR THE METABOLIC THEORY OF ECOLOGY
Because the observed form of the diameter distribution in tree communities is not
consistent with an individual size distribution of the form ( ) 3 4Mf M M −µ , the published
metabolic theory explanation for the form of the individual size distribution (Enquist & Niklas
2001) is not supported by empirical data. Therefore metabolic theory has yet to provide a
mechanistic explanation for ISDs within forests (see also Torres et al. 2001; Coomes 2006;
Muller-Landau et al. 2006b). In addition, the two studies in animal communities that have
offered support for the predicted -3/4 form of the individual mass distribution (Ackerman et al.
2004; Meehan 2006) did so using incorrect statistical methods (see White et al. 2008 for a
detailed explanation). Specifically, a value of 1 must be subtracted from the exponent when
using logarithmically binned size classes (see Bonnet et al. 2001; Andersen & Beyer 2006; Sims
et al. 2007; White et al. 2008). As a result these studies support an exponent near -7/4, not -3/4.
It has been suggested that these studies should be interpreted as deriving ( ) ( )( )Mf M loglog , and
thus actually predict ( ) 47−∝ MMf M (Reuman et al. in press). Regardless, we are aware of no
data that support an individual size distribution with the ( ) 3 4Mf M M −µ form.
It should be noted, however, that Enquist and Niklas (2001) do provide a simulation
model from which a size distribution characterized by ( ) 2Df D D−µ emerges. Their model
7

follows the succession of spatially explicit forest communities from an initial “seeding” of
propagules to an equilibrium forest structure. Metabolic theory provides the basis for growth
such that partitioning of new biomass into stems, leaves, and reproductive biomass is assumed to
scale with mass as predicted by metabolic theory (West et al. 1999; Enquist et al. 2000; Enquist
& Niklas 2002; Niklas et al. 2003). In addition to purely metabolic constraints, mortality and
growth in this model are also affected by light competition due to light attenuation caused by
overhead canopies (see also Coomes 2006; Muller-Landau et al. 2006a; Coomes & Allen 2007).
The simulated ISDs are well characterized by ( ) 2Df D D−µ (Enquist & Niklas 2001). Similar
results are also seen in more complex simulation models with allometric foundations (Chave
1999). The rough concordance between observed and simulated distributions suggests that the
rules governing biomass partitioning, as predicted by metabolic theory, may have important
influences on the form of the size distribution.
In addition to predicting the form of the individual size distribution, a small branch of
metabolic theory has utilized the presumed form of the mass distribution to make predictions for
the scaling of ecosystem properties such as carbon storage and flux, and whole community
nutrient stocks (Kerkhoff & Enquist 2006). Determining the specific implications of our central
result for this study will require re-derivation of the model and re-analysis of the affected
predictions. While detailed redevelopment is beyond the scope of the current study, it is clear
that within-size-class predictions for any community or ecosystem attribute will be sensitive to
the assumed ISD. In addition, any model for ecosystem processes where the size distribution
plays a meaningful role will be influenced by the use of the incorrect form of the ISD (e.g.,
Kerkhoff & Enquist 2006). The form of the ISD is thus important for understanding how
organismal processes ‘scale-up’ to populations, communities, and ecosystems. In general, our
8

results impact the metabolic theory predictions for the form of the ISD and for community and
ecosystem level properties based on the ISD, but our results have no implications for the network
model itself (West et al. 1997; 1999) or for any predictions of individual- and species-level
properties (e.g. metabolic rate, mortality rate, etc.).
IMPLICATIONS FOR ENERGETIC EQUIVALENCE
Different processes are responsible for generating the individual size distribution and the
species-level size-density relationship (SDR; sensu White et al. 2007), the pattern Damuth
(1981) originally proposed to exhibit energetic equivalence (Jennings et al. 2007; White et al.
2007). These two patterns also take different mathematical forms. The ISD is a frequency
distribution and is thus characterized by a probability density function, while the SDR is a
bi-variate functional relationship. Our results have no implications for the traditional SDR based
energetic equivalence rule because if population-level metabolic rate, Q, is invariant with respect
to body size for one size measure, by definition it is invariant with respect to the other size
measures (since direct substitution is the appropriate way to change variables for the SDR). For
example, given the size dependence of metabolic rate ( 3 4 2B M Dµ µ ), population size must
decline with body size such that 3 4 3 4 0Q BN M M M−µ µ µ and 2 2 0Q BN D D D−µ µ µ
(Enquist et al. 1998).
In contrast, for the individual size distribution only a single measure of size (or a set of
size measures that are related isometrically) can exhibit energetic equivalence. For example,
observed diameter distributions in tree communities are fairly close in many cases to exhibiting
energetic equivalence while mass distributions exhibit a steep decline in energy use with
increasing size class: 2 2 0q Bn D D D−µ µ µ and 3 4 11 8 5 8q Bn M M M− −µ µ µ , where q is
9

energy flux within a size class. More generally, it is a mathematical certainty that within any
community, energy will not be partitioned among size classes in the same manner for different
characterizations of body size when those characterizations are related allometrically (e.g. fish
mass ~ fish length3 or tree mass ~ tree diameter8/3).
The size of a tree can be defined based on various measurements including mass, trunk
diameter, height (H), and crown area (i.e. leaf mass; A). Metabolic theory predicts, and/or
empirical data support, allometric relationships between these measures of size such that
8 3 4 4 3M D H Aµ µ µ (Niklas 1994; West et al. 1997; West et al. 1999; Niklas & Enquist 2001;
Muller-Landau et al. 2006a). Hence, a forest characterized by the ISDs
€
fD(D)∝D−2 and
€
fM(M)∝M−11/8, can also be characterized by the ISDs
€
fH(H)∝H−5/2 and ( ) 3 2Af A A−µ .
Combining these height and crown area ISDs with the dependence of metabolic rate on height (
3B Hµ ) and crown area ( B Aµ ) shows that diameter is the only measure of size for which
energetic equivalence is approximated within forests: 0q Dµ , 5/8q M −µ ,
( ) 3 5 2 1 2Hq Bf H H H H−µ µ µ , and ( ) 3 2 1 2
Aq Bf A AA A− −µ µ µ . This occurs because the
relative position of individuals along the size axis changes when transforming from one size
measure to another. As a result, the number of individuals in a size class is dependent on how
size is characterized, such that the amount of energy fluxed within a size class changes with the
choice of size measure. This remains true regardless of taxon or community type. In contrast the
amount of energy fluxed by a population or through a whole community is not dependent on how
size is characterized because the number of individuals and the fluxes of each individual remain
the same by definition. Thus, energetic equivalence holds across forests (Enquist et al. 1998)
regardless of how size is characterized.
10

IMPLICATIONS FOR PROCESSES STRUCTURING TREE COMMUNITIES
Approximately equal energy use across diameter classes may point to diameter as a
functional attribute of tree morphology critical to resource partitioning among individuals. If
diameter is directly related to resource partitioning, the observation of approximate energetic
equivalence would represent an important clue to understanding how resources are divided
within forests. However, diameter is unlikely to be the most relevant aspect of size given that
canopy area, leaf mass, and tree height are more directly related to light acquisition than is trunk
diameter (see also Lawes et al. 2008). In fact, the observed form of the tree size distribution has
been questioned due to a presumed dominance of light acquisition by larger individuals (Coomes
2006; Muller-Landau et al. 2006b; Coomes & Allen 2007). Dominant resource acquisition by
larger individuals would suggest that tree height, the only measure of size examined here for
which energy flux increases across size classes, is the aspect of size most relevant to resource
partitioning in forests. However, resource acquisition should logically result from a combination
of canopy area (the number of leaves) and tree height (the per leaf resource availability). While
more research is needed to determine how different aspects of tree size influence resource
partitioning within forests (Schwinning & Weiner 1998), some insight is provided by the fact
that realistic diameter distributions emerge from simulation models combining the ecological
impacts of competition for light and stochastic mortality with allometric partitioning of biomass
into growth and reproduction (Chave 1999; Enquist & Niklas 2001). In addition, Hara (1984)
hypothesized that realized ISDs are sensitive to size dependent biomass partitioning. Roughly
equivalent energy flux across diameter classes may thus represent an emergent property of plant
11

communities within which individuals are constrained to follow idealized biomass partitioning
rules.
Exploring the sensitivity of the ISDs predicted by these models to the assumptions of
individual biomass partitioning and light competition will provide a more rigorous evaluation of
the processes leading to observed patterns of resource division among individuals. This will help
determine if patterns of resource partitioning are due to a direct influence of size per se or if they
emerge indirectly through ecological interactions and individual biomass partitioning. In
addition, studying the temporal dynamics of ISDs following disturbance would allow community
assembly to be examined through time from a body size perspective (Kohyama 1993). In
general, understanding the relative influence of, and interactions between, individual biomass
partitioning and competition should help elucidate fundamental processes structuring forested
ecosystems.
CONCLUSIONS
Here we have shown that the distribution of individual tree masses predicted by Enquist
and Niklas (2001), ( ) 3 4Mf M M −µ , is not consistent with the observed form of tree community
diameter distributions, ( ) 2Df D D−µ , and is thus not supported by empirical data. Therefore,
when properly analyzed the current metabolic theory explanation for the form of ISDs in tree
communities is readily rejected. This result also demonstrates that patterns of energy use across
size classes within forests are dependent upon how size is characterized. If measured in terms of
diameter, all size classes flux approximately the same amount of energy whereas energy flux
declines with mass and crown area and increases with height. This implies that energy is not
partitioned due to size per se, but rather due to different functional attributes of different aspects
12

of size. This ‘context’ dependence of energy partitioning occurs because of the allometric
relationships between different aspects of tree size and because individual size distributions are
frequency distributions, not bi-variate functions. The nature of this dependence raises significant
challenges for understanding the relative dominance of different size classes in tree communities.
ACKNOWLEDGMENTS
We are extremely grateful to Molly Stegen and Morgan Ernest for advice and support throughout
the conception and development of this project. Van Savage, Jessica Green, and Tommaso Zillio
kindly took the time to confirm the central result of the paper, and Hélène Morlon introduced us
to the more general form of transformation given in equation (2). Several conversations with
James Brown significantly improved our understanding of our results. The manuscript benefited
from comments from Brian Enquist, Scott Stark, James O’Dwyer, Jessica Green, Tommaso
Zillio, Kenneth Feeley, Christian Mulder, and three anonymous reviewers. The BCI forest
dynamics research project was made possible by National Science Foundation grants to Stephen
P. Hubbell, support from the Center for Tropical Forest Science, the Smithsonian Tropical
Research Institute, the John D. and Catherine T. MacArthur Foundation, the Mellon Foundation,
the Celera Foundation, and numerous private individuals, and through the hard work of over 100
people from 10 countries over the past two decades. The plot project is part the Center for
Tropical Forest Science, a global network of large-scale demographic tree plots. EPW was
supported by an NSF Postdoctoral Fellowship in Biological Informatics (DBI-0532847).
REFERENCES
13
Ackerman J.L., Bellwood D.R. & Brown J.H. (2004). The contribution of small individuals to
density-body size relationships: examination of energetic equivalence in reef fishes.
Oecologia, 139, 568-571.
Andersen K.H. & Beyer J.E. (2006). Asymptotic size determines species abundance in the
marine size spectrum. Am Nat, 168, 54-61.
Bonnet E., Bour O., Odling N.E., Davy P., Main I., Cowie P., et al. (2001). Scaling of fracture
systems in geological media. Reviews of Geophysics, 39, 347-383.
Brown J.H., Gillooly J.F., Allen A.P., Savage V.M. & West G.B. (2004). Toward a metabolic
theory of ecology. Ecology, 85, 1771-1789.
Chave J. (1999). Study of structural, successional and spatial patterns in tropical rain forests
using TROLL, a spatially explicit forest model. Ecol Modell, 124, 233-254.
Chave J., Andalo C., Brown S., Cairns M.A, Chambers J.Q., Eamus D., et al. (2005). Tree
allometry and improved estimation of carbon stocks and balance in tropical forests.
Oecologia, 145, 87-99.
Condit, R. (1998). Tropical Forest Census Plots. Springer-Verlab and R. G. Landes Company,
Berlin, Germany, and Georgetown, Texas.
Coomes D.A. (2006). Challenges to the generality of WBE theory. Trends Ecol Evol, 21,
593-596.
Coomes D.A. & Allen R.B. (2007). Mortality and tree-size distributions in natural mixed-age
forests. J Ecol, 95, 27-40.
Coomes D.A., Duncan R.P., Allen R.B. & Truscott J. (2003). Disturbances prevent stem
size-density distributions in natural forests from following scaling relationships. Ecol Lett, 6,
980-989.
14

Cyr H., Peters R.H. & Downing J.A. (1997). Population density and community size structure:
Comparison of aquatic and terrestrial systems. Oikos, 80, 139-149.
Damuth J. (1981). Population-density and body size in mammals. Nature, 290, 699-700.
Damuth J. (1987). Interspecific allometry of population-density in mammals and other animals -
the independence of body-mass and population energy-use. Biol J Linn Soc, 31, 193-246.
Enquist B.J. (2002). Universal scaling in tree and vascular plant allometry: Toward a general
quantitative theory linking plant form and function from cells to ecosystems. Tree
Physiology, 22, 1045-1064.Enquist B.J., Brown J.H. & West G.B. (1998). Allometric scaling
of plant energetics and population density. Nature, 395, 163-165.
Enquist B.J., Economo E.P., Huxman T.E., Allen A.P., Ignace D.D. & Gillooly J.F. (2003).
Scaling metabolism from organisms to ecosystems. Nature, 423, 639-642.
Enquist B.J. & Niklas K.J. (2001). Invariant scaling relations across tree-dominated
communities. Nature, 410, 655-660.
Enquist B.J. & Niklas K.J. (2002). Global allocation rules for patterns of biomass partitioning
in seed plants. Science, 295, 1517-1520.
Enquist B.J., West G.B. & Brown J.H. (2000). Quarter-power allometric scaling in vascular
plants: Functional basis and ecological consequences. Oxford University Press, New York.
Ernest S.K.M., Enquist B.J., Brown J.H., Charnov E.L., Gillooly J.F., Savage V.M., et al. (2003).
Thermodynamic and metabolic effects on the scaling of production and population energy
use. Ecol Lett, 6, 990-995.
Freund J.E. (1971). Mathematical Statistics. 2nd edn. Prentice-Hall, Englewood Cliffs, New
Jersey.
15

Hara T. (1984). A stochastic model and the moment dynamics of the growth and size distribution
in plant populations. J Theor Biol, 109, 173-190.
Hubbell, S.P., Condit, R., & Foster, R.B. (2005). Barro Colorado Forest Census Plot Data. URL
http://ctfs.si/edu/datasets/bci.
Hubbell S.P., Foster R.B., O’Brien S.T., Harms K.E., Condit R., Wechsler B., Wright S.J., &
Loo de Lao S. (1999). Light gap disturbances, recruitment limitation, and tree diversity in a
neotropical forest. Science, 283, 554-557.
Jennings S., De Oliveira J.A.A. & Warr K.J. (2007). Measurement of body size and abundance
in tests of macroecological and food web theory. J Anim Ecol, 76, 72-82.
Kerkhoff A.J. & Enquist B.J. (2006). Ecosystem allometry: the scaling of nutrient stocks and
primary productivity across plant communities. Ecol Lett, 9, 419-427.
Kerkhoff A.J. & Enquist B.J. (2007). The implications of scaling approaches for understanding
resilience and reorganization in ecosystems. Bioscience, 57, 489-499.
Kohyama T. (1993). Size-structured tree populations in gap-dynamic forests - The forest
architecture hypothesis for the stable coexistence of species. J Ecol 81, 131-143.
Lawes M.J., Griffiths M.E., Midgley J.J., Boudreau S., Eeley H.A.C., & Chapman C.A. (2008).
Tree spacing and area of competitive influence do not scale with tree size in an African rain
forest. J Veg Sci, 19, 729-738.
Marquet P.A., Quinones R.A., Abades S., Labra F., Tognelli M., Arim M., et al. (2005). Scaling
and power-laws in ecological systems. J Exp Biol, 208, 1749-1769.
May R.M. (1986). The search for patterns in the balance of nature: Advances and retreats.
Ecology, 67,1116-1126.
16

Meehan T.D. (2006). Energy use and animal abundance in litter and soil communities. Ecology,
87, 1650-1658.
Mood A.M., Graybill F.A. & Boes D.C. (1974). Introduction to the Theory of Statistics. 3rd edn.
McGaw-Hill, New York.
Muller-Landau H.C., Condit R.S., Chave J., Thomas S.C., Bohlman S.A., Bunyavejchewin S., et
al. (2006a). Testing metabolic ecology theory for allometric scaling of tree size, growth and
mortality in tropical forests. Ecol Lett, 9, 575-588.
Muller-Landau H.C., Condit R.S., Harms K.E., Marks C.O., Thomas S.C., Bunyavejchewin S.,
et al. (2006b). Comparing tropical forest tree size distributions with the predictions of
metabolic ecology and equilibrium models. Ecol Lett, 9, 589-602.
Niklas K.J. (1994). Plant allometry: The scaling of form and process. University of Chicago
Press, Chicago.
Niklas K.J. & Enquist B.J. (2001). Invariant scaling relationships for interspecific plant biomass
production rates and body size. Proc Natl Acad Sci USA, 98, 2922-2927.
Niklas K.J., Midgley J.J. & Enquist B.J. (2003). A general model for mass–growth–density
relations across tree-dominated communities. Evol Ecol Res, 5, 459-468.
Peters R.H. (1983). The ecological implications of body size. Cambridge University Press, New
York, NY.
Phillips O. & Miller J.S. (2002). Global patterns of plant diversity: Alwyn Gentry's forest
transect dataset. Monographs in Systematic Botany from the Missouri Botanical Garden, 89.
Price C.A., Enquist B.J. & Savage V.M. (2007). A general model for allometric covariation in
botanical form and function. Proc Natl Acad Sci USA, 104, 13204-13209.
17

Ross S. (2006). A First Course in Probability. Seventh edn. Pearson Prentice Hall, Upper Saddle
River, New Jersey.
Schwinning, S., & J. Weiner. 1998. Mechanisms determining the degree of size asymmetry in
competition among plants. Oecologia, 113, 447-455.
Sims D.W., Righton D. & Pitchford J.W. (2007). Minimizing errors in identifying Levy flight
behaviour of organisms. J Anim Ecol, 76, 222-229.
Southwood T.R.E., May R.M. & Sugihara G. (2006). Observations on related ecological
exponents. Proc Nat Acad Sci USA, 103, 6931-6933.
Thomas G.B.J. & Finney R.L. (1996). Calculus. Addison-Wesley Publishing Company,
Reading, Massachusetts.
Torres J.L., Sosa V.J., Equihua M. & Torres L. (2001). On the conceptual basis of the
self-thinning rule. Oikos, 95, 544-548.
West G.B. & Brown J.H. (2004). Life's universal scaling laws. Physics Today, 57, 36-42.
West G.B. & Brown J.H. (2005). The origin of allometric scaling laws in biology from genomes
to ecosystems: towards a quantitative unifying theory of biological structure and
organization. J Exp Biol, 208, 1575-1592.
West G.B., Brown J.H. & Enquist B.J. (1997). A general model for the origin of allometric
scaling laws in biology. Science, 276, 122-126.
West G.B., Brown J.H. & Enquist B.J. (1999). A general model for the structure and allometry of
plant vascular systems. Nature, 400, 664-667.
White E.P., Enquist B.J. & Green J.L. (2008). On estimating the exponent of power-law
frequency distributions. Ecology, 89, 905-912.
18

White E.P., Ernest S.K.M., Kerkhoff A.J. & Enquist B.J. (2007). Relationships between body
size and abundance in ecology. Trends Ecol Evol, 22, 323-330.
Woodhouse I.H. (2006). Predicting backscatter-biomass and height-biomass trends using a
macroecology model. IEEE Transactions on Geoscience and Remote Sensing, 44, 871-877.
19

FIGURE LEGENDS
Figure 1. Simulation results confirming the analytical solutions for transformations between
different measures of body size. Random datasets of 500 individuals each were generated from
power-law distributions with the appropriate exponents, a minimum value of 1 and a maximum
value of 10,000. These datasets were treated as either mass data (exponent = -3/4) or diameter
data (exponent = -2). The exponent of each dataset was determined using both maximum
likelihood estimation (solid lines) and normalized logarithmic binning (dashed lines), the values
were converted to the alternate measure of size (diameter or mass) using 8 3M Dµ , and finally
the exponent for the alternate size measure was determined. Distributions of the results of 10,000
of these simulations are presented for (a) Converting from mass (exponent = -3/4; blue lines) to
diameter (red lines; analytical solution for exponent = -1/3) and (b) converting from diameter
(exponent = -2; red lines) to mass (blue lines; analytical solution for exponent = -11/8). The
simulated data clearly replicate the analytical result.
Figure 2. Empirical results confirming the analytical solutions for transformations between
different measures of body size and rejecting the previously assumed distribution:
( ) 3 4Mf M M −µ . Data from the 50ha plot at Barro Colorado Island (Condit 1998; Hubbell et al.
1999; Hubbell et al. 2005) were subdivided into 50 1ha subplots. Diameters (red lines) where
converted to masses (blue lines) using 8 3M Dµ . Power-laws were fit to the data using
maximum likelihood estimation based on the Pareto distribution (solid lines) and the Truncated
Pareto distribution (dotted lines; using the maximum value of diameter or mass for the entire
50ha plot as the maximum attainable value). The mode of the Pareto diameter distribution
exponents is indicated by the solid black line and the predicted value for the mass exponent
based on this observed diameter exponent is indicated by the dashed black line.
20

Figure 1
21
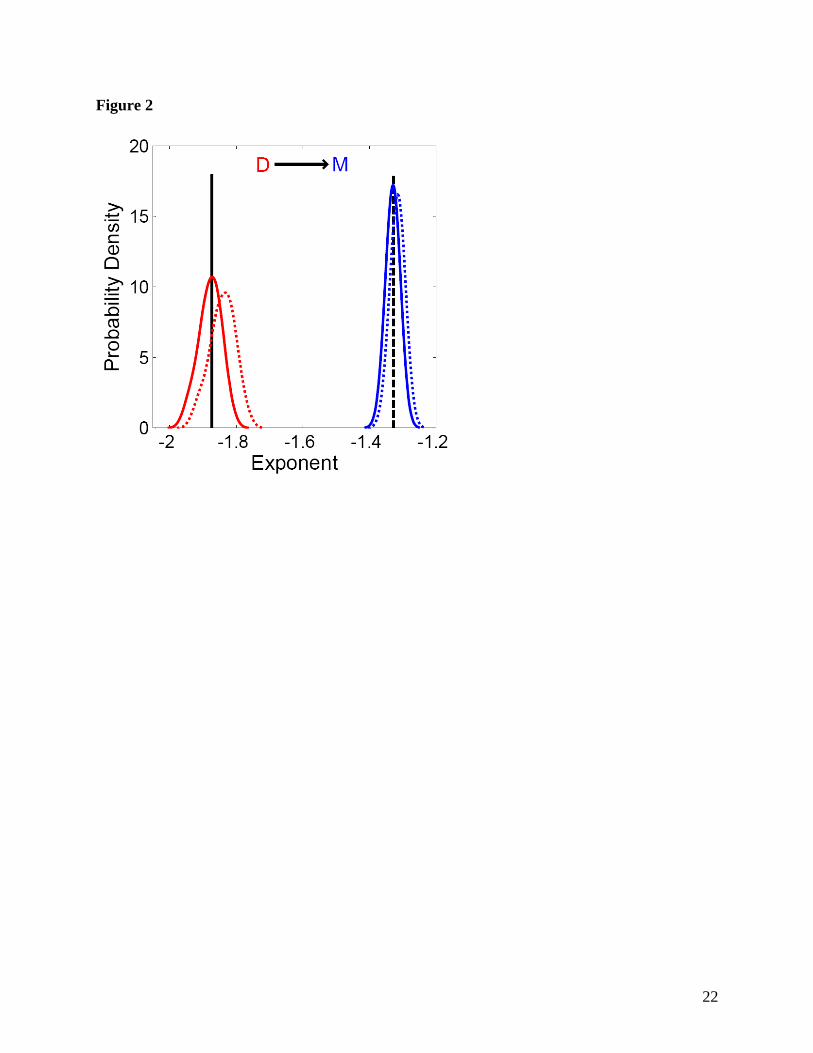
Figure 2
22