on the quality of protein crystals grown under diffusion
TRANSCRIPT

HAL Id: hal-03035041https://hal.archives-ouvertes.fr/hal-03035041
Submitted on 2 Dec 2020
HAL is a multi-disciplinary open accessarchive for the deposit and dissemination of sci-entific research documents, whether they are pub-lished or not. The documents may come fromteaching and research institutions in France orabroad, or from public or private research centers.
L’archive ouverte pluridisciplinaire HAL, estdestinée au dépôt et à la diffusion de documentsscientifiques de niveau recherche, publiés ou non,émanant des établissements d’enseignement et derecherche français ou étrangers, des laboratoirespublics ou privés.
On the Quality of Protein Crystals Grown underDiffusion Mass-transport Controlled Regime (I)
José Gavira, Fermín Otálora, Luis González-Ramírez, Emilio Melero,Alexander van Driessche, Juan Manuel García-Ruíz
To cite this version:José Gavira, Fermín Otálora, Luis González-Ramírez, Emilio Melero, Alexander van Driessche, et al..On the Quality of Protein Crystals Grown under Diffusion Mass-transport Controlled Regime (I).Crystals, MDPI, 2020, 10 (2), pp.68. �10.3390/cryst10020068�. �hal-03035041�

crystals
Article
On the Quality of Protein Crystals Grown underDiffusion Mass-transport Controlled Regime (I)
José A. Gavira 1 , Fermín Otálora 1 , Luis A. González-Ramírez 1 , Emilio Melero 1,Alexander E.S. van Driessche 2 and Juan Manuel García-Ruíz 1,*
1 Laboratorio de Estudios Cristalográficos, Instituto Andaluz de Ciencias de la Tierra (Consejo Superior deInvestigaciones Científicas-Universidad de Granada), Avenida de las Palmeras 4, 18100 Armilla, Granada,Spain; [email protected] (J.A.G.); [email protected] (F.O.); [email protected] (L.A.G.-R.);[email protected] (E.M.)
2 Université Grenoble Alpes, Université Savoie Mont Blanc, CNRS, IRD, IFSTTAR, ISTerre, F-38000 Grenoble,France; [email protected]
* Correspondence: [email protected]
Received: 24 December 2019; Accepted: 22 January 2020; Published: 25 January 2020�����������������
Abstract: It has been previously shown that the diffraction quality of protein crystals strongly dependson mass transport during their growth. In fact, several studies support the idea that the higher thecontribution of the diffusion during mass transport, the better the diffraction quality of the crystals. Inthis work, we have compared the crystal quality of two model (thaumatin and insulin) and two target(HBII and HBII-III) proteins grown by two different methods to reduce/eliminate convective masstransport: crystal growth in agarose gels and crystal growth in solution under microgravity. In bothcases, we used identical counterdiffusion crystallization setups and the same data collection protocols.Additionally, critical parameters such as reactor geometry, stock batches of proteins and otherchemicals, temperature, and duration of the experiments were carefully monitored. The diffractiondatasets have been analyzed using a principal component analysis (PCA) to determine possible trendsin quality indicators. The relevant indicators show that, for the purpose of structural crystallography,there are no obvious differences between crystals grown under reduced convective flow in spaceand convection-free conditions in agarose gel, indicating that the key factor contributing to crystalquality is the reduced convection environment and not how this reduced convection is achieved. Thismeans that the possible detrimental effect on crystal quality due to the incorporation of gel fibers intothe protein crystals is insignificant compared to the positive impact of an optimal convection-freeenvironment provided by gels. Moreover, our results confirm that the counterdiffusion techniqueoptimizes protein crystal quality and validates both environments in order to deliver high qualityprotein crystals, although other considerations, such as protein/gel interactions, must be consideredwhen defining the optimal crystallization setup.
Keywords: protein crystallization; microgravity; agarose; counterdiffusion
1. Introduction
Obtaining crystals of sufficient quality is essential for obtaining good diffraction data and buildingaccurate 3D structural models of both small and macromolecules. It is widely accepted that this isthe main bottleneck in structural biology studies, which results in slowing down the drug designprocess. Many strategies, recalled in this Special Issue, have been assayed not only to obtain initial3D models from X-ray data but also to improve crystal quality, a fundamental requirement in drugdesign. Consequently, it is not surprising that crystallization in space has received much financialsupport from both public space agencies and private companies until the last decade [1]. Since the early
Crystals 2020, 10, 68; doi:10.3390/cryst10020068 www.mdpi.com/journal/crystals

Crystals 2020, 10, 68 2 of 13
protein crystallization space adventure in 1984, many instruments have been tested under microgravityconditions [2–7]. At first, the results were not very conclusive, but interest did not decline, leading to avast amount of research into reduced gravity environments [2–7], most of which reported crystal qualityenhancements and strongly contributed to a better understanding of the nucleation and growth ofprotein crystals [4,8–10]. Although several parameters, such as the isoelectric point and water content,were not considered when analyzing the results, the observed improvement in crystal quality wasexplained on the basis of reduced crystal sedimentation, density-driven convection flows provokingthe formation of depletion zones around growing crystals [11–14], and the reduced incorporationof impurities [4,15,16]. The formation of a stable depletion zone in diffusive setups minimizes andstabilizes the supersaturation at the crystal/solution interface, reducing and making constant thegrowth rate, which kinetically favors the arrangement of molecules at the crystal surface and allowsfor efficient transport of impurities out of it. This is generally accepted as a factor enabling crystalperfection [17–20]. Therefore, it was concluded that the diffusive mass-transport conditions createdduring microgravity experiments are a key factor in obtaining good quality protein crystals [21,22].
This agreed beneficial effect of the diffusive mass-transport regime on crystal quality, togetherwith the economic costs associated with experiments in space, were the driving force when consideringfurther existing ground-based alternatives to mimic this specific mass-transport scenario [23]. Severalapproaches have been proposed to eliminate/reduce gravity-induced convection on Earth [24–30], butone of the most commonly used techniques, due to its ease of implementation, is that of gelling thegrowth media [31–33]. Agarose, a thermo-reversible hydrophilic hydrogel, is the most commonlyused gelling additive due to its frequent use in bio-laboratories and its ease of preparation. Agarosegels behave as a neutral network in which convection is reduced or eliminated (depending onconcentration [34]) and supersaturation at the crystal surface is homogeneous and steady [35]. Inaddition, sedimentation is avoided, favoring three dimensional growth, and impurity incorporation isreduced [36,37], leading to better-diffracting crystals [31,38], even though gel fibers are incorporatedwithin the protein crystal lattice independently of gel and protein nature [39–42]. However, anexhaustive rational comparison between crystals grown in a mass diffusive growth media created bymicrogravity and those grown in gel media on-ground should be carried out in order to validate thisalternative to microgravity diffusive environments. Only on rare occasions have crystals grown undermicrogravity in solution been compared with gel-grown protein crystals from underground gravityconditions [43–45], and only once at two levels of gravity [38]. Among these works, only Evrard andco-workers [44] have presented a systematic study on the crystallization of TIM (triosephosphateisomerase) from solution in microgravity and gel on-ground, concluding that under low gravityconditions crystals were slightly better. However, their experiments did not allow them to pinpoint thereason behind this observation.
We have conclusively shown that counterdiffusion methods produce crystals of higher qualitythan conventional convective crystals (hanging/sitting, drop, batch, etc.) [27], but after more than25 years of investigation, there is still no clear picture of the possible advantages of microgravityconditions over on-ground gel growth in terms of protein crystal quality [4,7,46,47]. This can, in part,be due to the difficulty of controlling microgravity conditions with precision (i.e., G-jitters, residualacceleration, lack of consistent data on microgravity levels during experiments, etc.) or the poor controlof temperature during microgravity experiments. Additionally, sample handling during pre- andpost-flight operations (temperature, vibration, aging, etc.) before X-ray data collection can have a largeimpact on data quality and often varies greatly between experiments.
This work addresses the missing comparison in terms of crystal quality between diffusive crystalgrowth setups, both on-ground and in microgravity. We have compared several X-ray quality indicatorsfor protein crystals (model and target) grown using identical experimental conditions (e.g., protein andreactant batches, crystallization hardware, thermal history, handling, storage, and transportation) intwo different reduced convection environments: microgravity and gels. The microgravity experimentswere run in a small unmanned spacecraft (Foton M3) to ensure the best possible microgravity scenario

Crystals 2020, 10, 68 3 of 13
(very small g-level). Ground experiments were set up at the same time, using the same reactors,chemicals, and procedures. A specific protocol was defined for synchrotron radiation data collectionand analysis to evaluate crystal quality.
2. Materials and Methods
2.1. Crystallization Experiments
For the experiments we selected two model proteins, bovine pancreas insulin and thaumatin fromT. daniellii, purchased as lyophilized powder from Sigma (I5500 and T7638 respectively), and two targetsystems, hemoglobins HBII and HBII-III from L. pectinata [45] kindly provided by the group of Prof.Juan Lopez-Garriga from the University of Puerto Rico at Mayagüez. Thaumatin and insulin weredissolved in MilliQ water. Protein concentration was determined spectrophotometrically at 280 nmprior to setting up the crystallization experiments and after filtration through a 0.45 µm membrane.All other chemicals were of analytical grade and used without further purification.
Experiments were set up to suit the second version of the Granada Crystallization Facility (GCF-2)using two types of reactors, the Granada Crystallization Box-Domino (GCB-D) and the three layercapillaries (3LC), described elsewhere [3]. In short, both the GCB-D and the 3LC reactors exploit thecounterdiffusion technique using a middle layer of gel to control the starting time of the experiments,which eliminates the need for any activation. One of the main features of the new GCF is the activecontrol of the temperature ensuring a set point of 20 ± 0.5 ◦C, not only during the mission but alsoduring transportation. In short, we followed the already described standard procedure in settingup the experiment; i.e., the agarose layer (1.0% w/v) was added to the GCB and allowed to set andcapillaries, loaded with the protein solution and sealed at the top, were punctuated into the gel layer.For equivalent ground experiments, protein solution was mixed with agarose (0.5% w/v) prior toloading the capillaries. The precipitant was then added on top and the GCB sealed. In the case of the3LC experiment, the protein solution was loaded first (with 0.1% agarose for the ground experiments)and the bottom end of the capillary sealed with beeswax. Then, the second layer of agarose was addedwith the help of a Pasteur pipette and allowed to set. Finally, the precipitant solution was poured ontop of the agarose layer and the system sealed with beeswax. Two identical units of the GCF-2 wereprepared on site for the space and ground experiments. The experimental conditions are summarizedin Table 1.
Table 1. Summary of the crystallization conditions. For ground experiments 0.1%–0.3% (w/v) agarosewas added to the protein chamber.
Protein Concentration (mg/mL) Precipitating Agent Buffer Type
Thaumatin 50 2.4 M NaK-tartrate 0.1 M Hepes pH 7.0 GCB
Insulin 30 25% PEG 4000, 0.2 MNaK-tartrate
0.02 M Na Phosphate pH10.5, 0.02 M EDTA 3L
HBII-O2 30 5 M Na Formate pH 5.0 Water 3L
HBII-III-CN 30 5 M Na Formate pH 5.0 Water 3L
2.2. X-ray Data Collection and Analysis
Crystal quality was determined from X-ray diffraction data collected at beam line BM16 of theEuropean synchrotron radiation facility (ESRF). Crystals were extracted from the hydrogel or thecapillary using a cut pipette tip and deposited on a plastic Petri dish. Drops of the recovered precipitantor the precipitant plus cryoprotectant (20% v/v glycerol) were deposited nearby. Selected crystalswere transferred to the cryoprotectant solution and equilibrated for 10 to 20 seconds before beingmounted manually in the goniometer-head and flash-cooled. The data collection protocol was thesame for all crystals as summarized in Table 2. We collected a total of 42 full datasets, 23 in space and

Crystals 2020, 10, 68 4 of 13
19 on-ground. All datasets were integrated, scaled, and merged using Denzo and Scalepack [48] andthe main indicators extracted from the final log files (data are compiled in Tables S1–S4).
Table 2. X-ray data collection protocol.
Protein Dose Mode Rotation Detector-Crystal N◦ Frames Temperature
HBII-O2 Fixed 0.5◦ 183 mm 300 100 KHBII-III-CN Fixed 0.5◦ 196 mm 275 100 K
Insulin Fixed 0.5◦ 124 mm 150 100 KThaumatin Fixed 0.5◦ 120 mm 180 100 K
2.3. Principal Component Analysis
A comprehensive set of data quality indicators, derived from the data reduction and mergingsteps, was selected for statistical quality analysis. These ten indicators, tabulated in Table S1, includethe completeness of the full dataset and the highest resolution shell (Comp, CompH); redundancy(Redund, RedundH); R_merge (Rmerge, RmergeH); intensity over noise (IoSigma, IoSigmaH); B-factor(Bfactor); and mosaic spread (Mosaic). Table S5 also lists the crystal code, the corresponding protein(hb2 = oxy-hemoglobin II, hb23 = cyano-hemoglobin II-III, ins = insulin, th = thaumatin) and a flagindicating if the crystal was grown in space or ground conditions (s = space and g = ground).
Comparison of the quality indicators, because of an inherently different space group, resolutionlimit, etc., is not possible without a normalization of the distribution of indicator values. To obtain azero-centered distribution, the mean of the distribution was first subtracted from each value and thenall values were divided by their standard deviation. This scaling was done for each protein separatelyusing both space and ground indicators to compute the mean and standard deviation. In this way,differences in crystal quality between space and ground crystals can be identified by differences in theindicator distribution while distributions for different proteins are still comparable. Table S2 shows thenormalized data for all crystals used in this study.
3. Results
Among the many relevant parameters to be considered when comparing crystal quality, twoare of paramount importance: microgravity level and temperature, along with the stability of thoseparameters during the growth process. The Granada Crystallization Facility (GCF-2) and the supportingground electronics device (GSE) keep the temperature of the reactors at 20 ◦C with an accuracy of± 0.5 ◦C. Accelerometric data provided by other instruments onboard Foton M3 were also tracked,showing a very low overall g-level, which increased steadily from 0.5 to 5.5 µG (Figure 1). During thewhole mission, the gravity level was always below 8 µG. According to Carotenuto and co-workers [49],at this level of residual gravity buoyancy-driven convection of the fluid can be completely neglected.These data also suggested that low frequency vibrations, correlated in previous studies with themovement of the crystals and the variation of their growth rate [46], were below 10 µg2/Hz in the 1–10Hz range during the whole mission, small enough to be negligible.
Visual inspection of the experiments after landing showed that both the space-grown crystals andtheir on-ground counterparts contain good-looking crystals with no significant differences in terms ofnucleation density, crystal size, or surface defects. Figure 2 shows representative crystals of insulin(model protein) and oxy-hemoglobin II, II-III (target protein) grown both in space and on-ground.

Crystals 2020, 10, 68 5 of 13Crystals 2019, 9 FOR PEER REVIEW 5
Figure 1. Modulus of the apparent gravity (residual acceleration) as a function of the time (0 is the
beginning of the mission). The insert corresponds to the first six hour interval showing the amplitude
and duration of the standard oscillation of the gravity level.
Visual inspection of the experiments after landing showed that both the space-grown crystals and
their on-ground counterparts contain good-looking crystals with no significant differences in terms of
nucleation density, crystal size, or surface defects. Figure 2 shows representative crystals of insulin (model
protein) and oxy-hemoglobin II, II-III (target protein) grown both in space and on-ground.
Figure 1. Modulus of the apparent gravity (residual acceleration) as a function of the time (0 is thebeginning of the mission). The insert corresponds to the first six hour interval showing the amplitudeand duration of the standard oscillation of the gravity level.Crystals 2019, 9 FOR PEER REVIEW 6
Figure 2. Pictures showing crystals of insulin (top, inner = 0.5 mm) and cyano-HbII-III (bottom, inner = 0.7
mm) proteins gown in space (left) and on-ground in agarose gel (right) environments, respectively.
For structural biology studies, the best protein crystals are those producing the better diffraction
data, in order to accurately determine the 3D structural model of the target protein [6,18]. As a rule
of thumb, the quality of a crystal depends on two key factors: the coherent attachment of the
molecules to the crystal lattice and the amount of impurity incorporated in the crystal volume, which
can produce lattice strain [50]. The first factor is directly related to the supersaturation and
supersaturation rate, and a correlation has been found between low supersaturation and better lattice
order [51]. Not only does supersaturation matter, but the steadiness of the supply of molecules during
growth also plays a role in avoiding the formation of zonal defects, such as striations, by maintaining
a constant supply of molecules and a constant impurity ratio. This scenario is broken by convective
mass transport that distorts and/or destroys the depletion zone around growing crystals [6,18]. In
this study, we will compare crystals grown in two scenarios with minimized convection.
The normalized data shown in Table S6 were used to compare space and ground crystals for
each of the ten selected quality indicators. The Tukey [52] five number summaries (minimum, lower-
hinge, median, upper-hinge, maximum) calculated for each indicator are presented in Figure 3 and
listed in Table S7. From this analysis, we can observe that the data collected from crystals grown in
space is better in terms of overall completeness, redundancy at high resolution, and mosaic spread,
but is almost equal to the ground crystal indicators in terms of completeness at high resolution,
overall redundancy, and B factor. On the other hand, crystals grown on-ground are better in terms of
Rmerge and signal over noise ratio, but in all cases the differences are small, always equal to or lower
than 0.5 times the standard deviation. A comparison of the distribution shows that the differences in
all indicators are not statistically significant with p-values higher than 30% for all indicators except
for the mosaic spread (15.7%) indicating larger, but still not significant, differences. The standard
deviation of most of the indicators is smaller for the space-grown crystals than for on-ground. This
observation could be related to a higher homogeneity of the crystal s environment and, therefore,
crystal quality.
Figure 2. Pictures showing crystals of insulin (top, Φinner = 0.5 mm) and cyano-HbII-III (bottom, Φinner
= 0.7 mm) proteins gown in space (left) and on-ground in agarose gel (right) environments, respectively.

Crystals 2020, 10, 68 6 of 13
For structural biology studies, the best protein crystals are those producing the better diffractiondata, in order to accurately determine the 3D structural model of the target protein [6,18]. As a rule ofthumb, the quality of a crystal depends on two key factors: the coherent attachment of the molecules tothe crystal lattice and the amount of impurity incorporated in the crystal volume, which can producelattice strain [50]. The first factor is directly related to the supersaturation and supersaturation rate,and a correlation has been found between low supersaturation and better lattice order [51]. Not onlydoes supersaturation matter, but the steadiness of the supply of molecules during growth also plays arole in avoiding the formation of zonal defects, such as striations, by maintaining a constant supplyof molecules and a constant impurity ratio. This scenario is broken by convective mass transportthat distorts and/or destroys the depletion zone around growing crystals [6,18]. In this study, we willcompare crystals grown in two scenarios with minimized convection.
The normalized data shown in Table S6 were used to compare space and ground crystals for eachof the ten selected quality indicators. The Tukey [52] five number summaries (minimum, lower-hinge,median, upper-hinge, maximum) calculated for each indicator are presented in Figure 3 and listedin Table S7. From this analysis, we can observe that the data collected from crystals grown in spaceis better in terms of overall completeness, redundancy at high resolution, and mosaic spread, butis almost equal to the ground crystal indicators in terms of completeness at high resolution, overallredundancy, and B factor. On the other hand, crystals grown on-ground are better in terms of Rmergeand signal over noise ratio, but in all cases the differences are small, always equal to or lower than0.5 times the standard deviation. A comparison of the distribution shows that the differences in allindicators are not statistically significant with p-values higher than 30% for all indicators except for themosaic spread (15.7%) indicating larger, but still not significant, differences. The standard deviation ofmost of the indicators is smaller for the space-grown crystals than for on-ground. This observationcould be related to a higher homogeneity of the crystal’s environment and, therefore, crystal quality.
Crystals 2019, 9 FOR PEER REVIEW 7
Figure 3. Minimum, lower-hinge, median, upper-hinge, and maximum for each of the ten analyzed
indicators is shown as box plots of the values obtained from the two (space/ground) populations. The
individual values are over-plotted as circles colored according to the protein.
A similar previously reported analysis of ferritin crystals grown in solution on-ground and
under low gravity conditions shows a significant correlation between quality indicators [53].
Therefore, a principal component analysis (PCA) [54,55] was performed to check for any trends in
quality indicators that could be hidden in this multidimensional set of indicators. As shown in Figure
4 (Table S8), the PCA analysis highlights the correlation between different indicators, i.e., 58.3% of
the variance of the dataset can be explained by just two dimensions and up to 76.3% of the variance
is described by adding a third dimension.
Figure 3. Minimum, lower-hinge, median, upper-hinge, and maximum for each of the ten analyzedindicators is shown as box plots of the values obtained from the two (space/ground) populations. Theindividual values are over-plotted as circles colored according to the protein.

Crystals 2020, 10, 68 7 of 13
A similar previously reported analysis of ferritin crystals grown in solution on-ground and underlow gravity conditions shows a significant correlation between quality indicators [53]. Therefore, aprincipal component analysis (PCA) [54,55] was performed to check for any trends in quality indicatorsthat could be hidden in this multidimensional set of indicators. As shown in Figure 4 (Table S8), thePCA analysis highlights the correlation between different indicators, i.e., 58.3% of the variance of thedataset can be explained by just two dimensions and up to 76.3% of the variance is described by addinga third dimension.Crystals 2019, 9 FOR PEER REVIEW 8
Figure 4. Percentage of variance explained by each of the ten dimensions obtained by PCA analysis
of the distributions of quality indicator values.
We can now analyze how much each indicator contributes to each dimension, although for our
purpose, it is enough to consider just the fifth dimension, which already explains more than 90% of
the variance. Figure 5 (Table S9) shows the contribution of each of the ten indicators analyzed in the
direction of the first five dimensions. Dimension 1 is mostly in the direction of redundancy (overall
and high resolution) and intensity over noise (mainly overall) with important contributions of
completeness and R-merge at high resolution. Dimension 2 is relatively aligned with overall R-merge,
completeness, and R-merge at high resolution. B-factor also contributes significantly.
Figure 4. Percentage of variance explained by each of the ten dimensions obtained by PCA analysis ofthe distributions of quality indicator values.
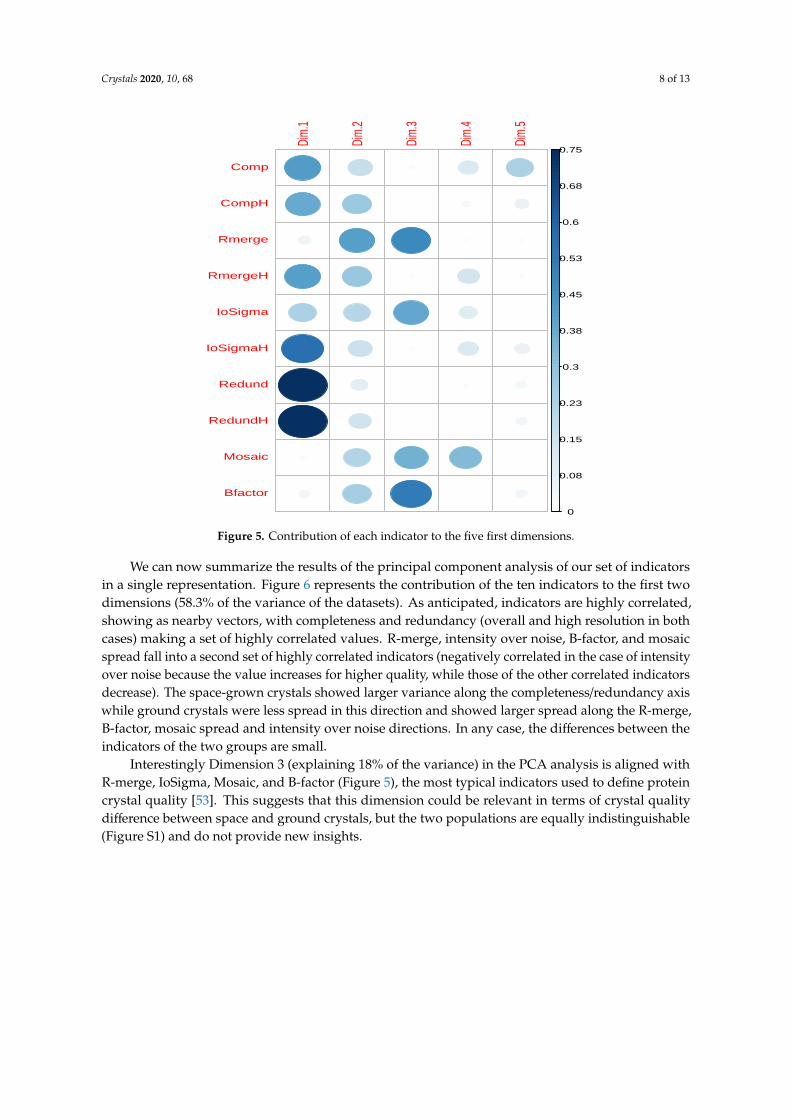
We can now analyze how much each indicator contributes to each dimension, although for ourpurpose, it is enough to consider just the fifth dimension, which already explains more than 90%of the variance. Figure 5 (Table S9) shows the contribution of each of the ten indicators analyzedin the direction of the first five dimensions. Dimension 1 is mostly in the direction of redundancy(overall and high resolution) and intensity over noise (mainly overall) with important contributions ofcompleteness and R-merge at high resolution. Dimension 2 is relatively aligned with overall R-merge,completeness, and R-merge at high resolution. B-factor also contributes significantly.
Crystals 2020, 10, 68 8 of 13Crystals 2019, 9 FOR PEER REVIEW 9
Figure 5. Contribution of each indicator to the five first dimensions.
We can now summarize the results of the principal component analysis of our set of indicators
in a single representation. Figure 6 represents the contribution of the ten indicators to the first two
dimensions (58.3% of the variance of the datasets). As anticipated, indicators are highly correlated,
showing as nearby vectors, with completeness and redundancy (overall and high resolution in both
cases) making a set of highly correlated values. R-merge, intensity over noise, B-factor, and mosaic
spread fall into a second set of highly correlated indicators (negatively correlated in the case of
intensity over noise because the value increases for higher quality, while those of the other correlated
indicators decrease). The space-grown crystals showed larger variance along the
completeness/redundancy axis while ground crystals were less spread in this direction and showed
larger spread along the R-merge, B-factor, mosaic spread and intensity over noise directions. In any
case, the differences between the indicators of the two groups are small.
●
●
●
●
●
●
●
●
●
●
●
●
●
●
●
●
●
●
●
●
●
●
●
●
●
●
●
●
●
●
●
0
0.08
0.15
0.23
0.3
0.38
0.45
0.53
0.6
0.68
0.75
Dim
.1
Dim
.2
Dim
.3
Dim
.4
Dim
.5
Comp
CompH
Rmerge
RmergeH
IoSigma
IoSigmaH
Redund
RedundH
Mosaic
Bfactor
Figure 5. Contribution of each indicator to the five first dimensions.
We can now summarize the results of the principal component analysis of our set of indicatorsin a single representation. Figure 6 represents the contribution of the ten indicators to the first twodimensions (58.3% of the variance of the datasets). As anticipated, indicators are highly correlated,showing as nearby vectors, with completeness and redundancy (overall and high resolution in bothcases) making a set of highly correlated values. R-merge, intensity over noise, B-factor, and mosaicspread fall into a second set of highly correlated indicators (negatively correlated in the case of intensityover noise because the value increases for higher quality, while those of the other correlated indicatorsdecrease). The space-grown crystals showed larger variance along the completeness/redundancy axiswhile ground crystals were less spread in this direction and showed larger spread along the R-merge,B-factor, mosaic spread and intensity over noise directions. In any case, the differences between theindicators of the two groups are small.
Interestingly Dimension 3 (explaining 18% of the variance) in the PCA analysis is aligned withR-merge, IoSigma, Mosaic, and B-factor (Figure 5), the most typical indicators used to define proteincrystal quality [53]. This suggests that this dimension could be relevant in terms of crystal qualitydifference between space and ground crystals, but the two populations are equally indistinguishable(Figure S1) and do not provide new insights.

Crystals 2020, 10, 68 9 of 13Crystals 2019, 9 FOR PEER REVIEW 10
Figure 6. Summary of the PCA analysis on the quality indicators dataset. The plot shows the first and
second dimensions of the analysis. The projected direction of each indicator "axis" is indicated by
arrows. The indicators for all the crystals in the dataset are plotted as blue/yellow circles for
ground/space-grown crystals. The same colors are used to indicate the ellipses encompassing the
representative points within the two groups.
Interestingly Dimension 3 (explaining 18% of the variance) in the PCA analysis is aligned with
R-merge, IoSigma, Mosaic, and B-factor (Figure 5), the most typical indicators used to define protein
crystal quality [53]. This suggests that this dimension could be relevant in terms of crystal quality
difference between space and ground crystals, but the two populations are equally indistinguishable
(Figure S1) and do not provide new insights.
4. Conclusions
The role of microgravity in protein crystal quality was investigated by comparing similar—but
not identical—mass-transport scenarios dominated by diffusion, i.e., space-grown crystals and
crystals grown in gels. Identical counterdiffusion experiments were set up with four proteins keeping
constant and careful monitoring of all critical parameters. The crystals characterized in this study
have been grown either under perfect diffusive mass-transport conditions in gel media or under
reduced convection in space within a crewless rocket, in both cases, at a constant temperature of 20
°C. The high quality of the crystals obtained can be attributed to a) the reduction of convection in the
growth environment and b) the experimental counterdiffusion setup that self-searches for the best
crystallization conditions within the capillary/reactor.
Our detailed X-ray diffraction analysis demonstrates that a) all grown crystals diffract at high
resolution as expected from the counterdiffusion technique; b) in terms of relevance for structural
studies, the crystals grown under microgravity are of similar quality to those grown in gels on Earth.
This result is particularly relevant since the incorporation of the gel fibers into the crystals is expected
to decrease their quality as they reduce diffraction crystal volume and could increase the disorder of
the crystal lattice. Our results show that this reduction of crystal quality, expected due to the
incorporation of the gel fibers, is counterbalanced by the perfect diffusive environment (zero
convection) provided by the porous gel structure.
All in all, our results show that 1) the growth of crystals in gels is an excellent technique for
obtaining protein crystals of the highest quality; 2) the scenario offered by space agencies for the
growth of high-quality protein crystals can be enhanced; 3) when a chemically clean environment is
Comp
CompH
Rmerge
RmergeH
IoSigma
IoSigmaH
Redund
RedundH
Mosaic
Bfactor
−6
−3
0
3
−7.5 −5.0 −2.5 0.0 2.5 5.0
Dim1 (36.1%)
Dim
2 (2
2.2%
)
Ground/Space
ground
space
PCA − Biplot
Figure 6. Summary of the PCA analysis on the quality indicators dataset. The plot shows the firstand second dimensions of the analysis. The projected direction of each indicator “axis” is indicatedby arrows. The indicators for all the crystals in the dataset are plotted as blue/yellow circles forground/space-grown crystals. The same colors are used to indicate the ellipses encompassing therepresentative points within the two groups.
4. Conclusions
The role of microgravity in protein crystal quality was investigated by comparing similar—butnot identical—mass-transport scenarios dominated by diffusion, i.e., space-grown crystals and crystalsgrown in gels. Identical counterdiffusion experiments were set up with four proteins keeping constantand careful monitoring of all critical parameters. The crystals characterized in this study havebeen grown either under perfect diffusive mass-transport conditions in gel media or under reducedconvection in space within a crewless rocket, in both cases, at a constant temperature of 20 ◦C.The high quality of the crystals obtained can be attributed to a) the reduction of convection in thegrowth environment and b) the experimental counterdiffusion setup that self-searches for the bestcrystallization conditions within the capillary/reactor.
Our detailed X-ray diffraction analysis demonstrates that a) all grown crystals diffract at highresolution as expected from the counterdiffusion technique; b) in terms of relevance for structuralstudies, the crystals grown under microgravity are of similar quality to those grown in gels on Earth.This result is particularly relevant since the incorporation of the gel fibers into the crystals is expectedto decrease their quality as they reduce diffraction crystal volume and could increase the disorder of thecrystal lattice. Our results show that this reduction of crystal quality, expected due to the incorporationof the gel fibers, is counterbalanced by the perfect diffusive environment (zero convection) providedby the porous gel structure.
All in all, our results show that 1) the growth of crystals in gels is an excellent technique forobtaining protein crystals of the highest quality; 2) the scenario offered by space agencies for the growthof high-quality protein crystals can be enhanced; 3) when a chemically clean environment is needed,space crystallization is a suitable alternative for the growth of high-quality protein crystals; and 4) thecounterdiffusion technique is particularly well-suited to perform experiments designed to understandprecipitation in space.

Crystals 2020, 10, 68 10 of 13
Supplementary Materials: The following are available online at http://www.mdpi.com/2073-4352/10/2/68/s1,Figure S1: The plot shows the first and third dimensions of the PC analysis. The projected direction of eachindicator “axis” is indicated by arrows. The indicators for all the crystals in the dataset are plotted as blue/yellowcircles for ground/space grown crystals. The same colors are used to indicate the ellipses encompassing therepresentative points within the two groups; Table S1: Resume of data collection and refinement statistics foroxy-hemoglobin II crystals grown in space and on-ground; Table S2: Resume of data collection and refinementstatistics for cyano-hemoglobin II-III crystals grown in space and on-ground; Table S3: Resume of data collectionand refinement statistics of insulin crystals grown in space and on-ground; Table S4: Resume of data collectionand refinement statistics of thaumatin crystals grown in space and on-ground; Table S5: Quality indicators fromdataset processing including the completeness of the full data set and the highest resolution shell (Comp, CompH),redundancy (Redund, RedundH), R_merge (Rmerge, RmergeH), intensity over noise (IoSigma, IoSigmaH), Bfactor (Bfactor) and mosaic spread (Mosaic). The codes identify the proteins (hb2 = oxy-hemoglobin II, hb23 =cyano-hemoglobin II-III, ins = insulin, th = thaumatin) and enviroment (s = space and g = ground). Table S6:Normaliz;ed quality indicators for each dataset; Table S7: Statistics comparing the crystals grown in space andground conditions; Table S8: Percentage of variance explained by each of the ten dimensions obtained by PCAanalysis of the quality indicators; Table T9: Contribution (percent) of each indicator to the five first dimensions.
Author Contributions: J.A.G., F.O., L.A.G.-R., E.M. and J.M.G.-R. designed and set-up the crystallizationexperiments; J.A.G. and L.A.G.-R. performed the X-ray diffraction experiments and data reduction; F.O. did thestatistical analysis of indicators, J.A.G., F.O., A.E.S.v.D., E.M. and J.M.G.-R. wrote the paper. All authors readthe manuscript and provided useful comments. All authors have read and agreed to the published version ofthe manuscript.
Funding: This study was supported by projects ESP2005-23831-E and ESP2007-29071-E (Spanish Ministry ofEducation and Science) and BIO2016-74875-P (JAG) (MINECO), Spain co-funded by the Fondo Europeo deDesarrollo Regional, FEDER funds, European Union.
Acknowledgments: We are really thankful to Carlos Ruiz (RIP), Carlos A. Nieves and Rafael Estremera from thegroup of Juan Lopez Garriga, University of Puerto Rico at Mayagüez, for suppling the two hemoglobin proteinsand for their assistance during data collection at the ESRF. We are very grateful to the European SynchrotronRadiation Facility for provision of synchrotron radiation facilities and we would like to thank BM16 staff forassistance and support during data collection. We also acknowledged the continuous support of the ESA team,Olivier Minster, Antonio Verga, and Philippe DeGieter (ESA, Noordwijk, NL) and the help of the Russian team atthe Integration Hall in Baikonur, Kazakhstan (RKK-Energiya). We would like to thank to Alfonso Garcia-Caballerofor revising the manuscript.
Conflicts of Interest: The authors declare no conflicts of interest.
References
1. Scott, T.J.; Vonortas, N.S. Microgravity protein crystallization for drug development: a bold example ofpublic sector entrepreneurship. J. Tech. Trans. 2019, 1–20. [CrossRef]
2. DeLucas, L.J.; Moore, K.M.; Long, M.M.; Rouleau, R.; Bray, T.; Crysel, W.; Weise, L. Protein crystal growth inspace, past and future. J. Crys. Growth 2002, 237–239, 1646–1650. [CrossRef]
3. Gonzalez-Ramirez, L.A.; Carrera, J.; Gavira, J.A.; Melero-Garcia, E.; Garcia-Ruiz, J.M. Granada CrystallizationFacility-2: A Versatile Platform for Crystallization in Space†. Cryst. Growth Des. 2008, 8, 4324–4329.[CrossRef]
4. Judge, R.A.; Snell, E.H.; van der Woerd, M.J. Extracting trends from two decades of microgravitymacromolecular crystallization history. Acta Cryst. Sec. D 2005, 61, 763–771. [CrossRef] [PubMed]
5. Martirosyan, A.; DeLucas, L.J.; Schmidt, C.; Perbandt, M.; McCombs, D.; Cox, M.; Radka, C.; Betzel, C. Effectof macromolecular mass transport in microgravity protein crystallization. Grav. Space Res. 2019, 7, 33–44.[CrossRef]
6. McPherson, A.; DeLucas, L.J. Microgravity protein crystallization. npj Microgravity 2015, 1. [CrossRef]7. Ruyters, G.; Betzel, C. Protein Crystallization in Space: Early Successes and Drawbacks in the German Space
Life Sciences Program. Biotech. Space 2017, 11–26. [CrossRef]8. Carter, D.C.; Lim, K.; Ho, J.X.; Wright, B.S.; Twigg, P.D.; Miller, T.Y.; Chapman, J.; Keeling, K.; Ruble, J.;
Vekilov, P.G.; et al. Lower dimer impurity incorporation may result in higher perfection of HEWL crystalsgrown in microgravity. J. Cryst. Growth 1999, 196, 623–637. [CrossRef]
9. Ng, J.D.; Lorber, B.; Giegé, R.; Koszelak, S.; Day, J.; Greenwood, A.; McPherson, A. Comparative Analysis ofThaumatin Crystals Grown on Earth and in Microgravity. Acta Cryst. Section D Bio. Cryst. 1997, 53, 724–733.[CrossRef]

Crystals 2020, 10, 68 11 of 13
10. Snell, E.H.; Weisgerber, S.; Helliwell, J.R.; Weckert, E.; Hölzer, K.; Schroer, K. Improvements in lysozymeprotein crystal perfection through microgravity growth. Acta Cryst. Section D Bio. Cryst. 1995, 51, 1099–1102.[CrossRef]
11. McPherson, A.; Greenwood, A.; Day, J. The effect of microgravity on protein crystal growth. Adv. Space Res.1991, 11, 343–356. [CrossRef]
12. McPherson, A.; Malkin, A.J.; Kuznetsov, Y.G.; Koszelak, S.; Wells, M.; Jenkins, G.; Howard, J.; Lawson, G.The effects of microgravity on protein crystallization: evidence for concentration gradients around growingcrystals. J. Cryst. Growth 1999, 196, 572–586. [CrossRef]
13. Otalora, F.; Luisa Novella, M.; Rondon, D.; Garca-Ruiz, J.M. Growth of lysozyme crystals under microgravityconditions in the LMS [STS-78] mission. J. Cryst. Growth 1999, 196, 649–664. [CrossRef]
14. Thomas, B.R.; Chernov, A.A.; Vekilov, P.G.; Carter, D.C. Distribution coefficients of protein impurities inferritin and lysozyme crystals Self-purification in microgravity. J. Cryst. Growth 2000, 211, 149–156. [CrossRef]
15. Lee, C.P.; Chernov, A.A. Solutal convection around growing protein crystals and diffusional purification inSpace. J. Cryst. Growth 2002, 240, 531–544. [CrossRef]
16. Snell, E.H.; Judge, R.A.; Crawford, L.; Forsythe, E.L.; Pusey, M.L.; Sportiello, M.; Todd, P.; Bellamy, H.;Lovelace, J.; Cassanto, J.M.; et al. Investigating the Effect of Impurities on Macromolecule Crystal Growth inMicrogravity. Cryst. Growth Des. 2001, 1, 151–158. [CrossRef]
17. García-Ruiz, J.M.; Otálora, F. Macromolecular Crystals—Growth and Characterization. Cryst. Growth Fund.Tech. 2004, 369–390. [CrossRef]
18. García-Ruiz, J.M.; Otálora, F.; García-Caballero, A. The role of mass transport in protein crystallization. ActaCryst. Sec. F Struc. Bio. Commun. 2016, 72, 96–104. [CrossRef]
19. Lin, H.; Rosenberger, F.; Alexander, J.I.D.; Nadarajah, A. Convective-diffusive transport in protein crystalgrowth. J. Cryst. Growth 1995, 151, 153–162. [CrossRef]
20. Otálora, F.; García-Ruiz, J.M.; Carotenuto, L.; Castagnolo, D.; Novella, M.L.; Chernov, A.A. Lysozyme crystalgrowth kinetics in microgravity. Acta Cryst. Section D Bio. Cryst. 2002, 58, 1681–1689. [CrossRef]
21. Lorber, B. The crystallization of biological macromolecules under microgravity: a way to more accuratethree-dimensional structures? Biochim. Biophy. Acta [BBA] Proteins Proteomics 2002, 1599, 1–8. [CrossRef]
22. Vergara, A.; Lorber, B.; Sauter, C.; Giege, R.; Zagari, A. Lessons from crystals grown in the Advanced ProteinCrystallisation Facility for conventional crystallisation applied to structural biology. Biophys Chem 2005, 118,102–112. [CrossRef] [PubMed]
23. Poodt, P.W.G.; Heijna, M.C.R.; Christianen, P.C.M.; van Enckevort, W.J.P.; de Grip, W.J.; Tsukamoto, K.;Maan, J.C.; Vlieg, E. Using Gradient Magnetic Fields to Suppress Convection during Crystal Growth. Cryst.Growth Des. 2006, 6, 2275–2280. [CrossRef]
24. Carter, D.C.; Rhodes, P.; McRee, D.E.; Tari, L.W.; Dougan, D.R.; Snell, G.; Abola, E.; Stevens, R.C. Reductionin diffuso-convective disturbances in nanovolume protein crystallization experiments. J. Appl. Cryst. 2005,38, 87–90. [CrossRef]
25. Lavalette, D.; Tétreau, C.; Tourbez, M.; Blouquit, Y. Microscopic Viscosity and Rotational Diffusion of Proteinsin a Macromolecular Environment. Biophy. J. 1999, 76, 2744–2751. [CrossRef]
26. Ng, J.D.; Gavira, J.A.; García-Ruíz, J.M. Protein crystallization by capillary counterdiffusion for appliedcrystallographic structure determination. J. Struc. Bio. 2003, 142, 218–231. [CrossRef]
27. Otálora, F.; Gavira, J.A.; Ng, J.D.; García-Ruiz, J.M. Counterdiffusion methods applied to protein crystallization.Progress Biophy. Mol. Bio. 2009, 101, 26–37. [CrossRef]
28. Poodt, P.W.G.; Heijna, M.C.R.; Schouten, A.; Gros, P.; van Enckevort, W.J.P.; Vlieg, E. Simple Geometry forDiffusion Limited Protein Crystal Growth: Harnessing Gravity to Suppress Convection. Cryst. Growth Des.2009, 9, 885–888. [CrossRef]
29. Ramachandran, N.; Leslie, F.W. Using magnetic fields to control convection during proteincrystallization—analysis and validation studies. J. Cryst. Growth 2005, 274, 297–306. [CrossRef]
30. Tagami, M.; Hamai, M.; Mogi, I.; Watanabe, K.; Motokawa, M. Solidification of levitating water in a gradientstrong magnetic field. J. Cryst. Growth 1999, 203, 594–598. [CrossRef]
31. Lorber, B.; Sauter, C.; Theobald-Dietrich, A.; Moreno, A.; Schellenberger, P.; Robert, M.-C.; Capelle, B.;Sanglier, S.; Potier, N.; Giege, R. Crystal growth of proteins, nucleic acids, and viruses in gels. Prog BiophysMol Biol 2009, 101, 13–25. [CrossRef]
Crystals 2020, 10, 68 12 of 13
32. Moreno, A.; Mendoza, M.E. Crystallization in Gels. In Handbook of Crystal Growth, 2nd ed.; Elsevier:Amsterdam, The Netherlands, 2015; pp. 1277–1315.
33. Rizzato, S.; Moret, M.; Merlini, M.; Albinati, A.; Beghi, F. Crystal growth in gelled solution: applications tocoordination polymers. CrystEngComm 2016, 18, 2455–2462. [CrossRef]
34. Garcia-Ruiz, J.M.; Novella, M.L.; Moreno, R.; Gavira, J.A. Agarose as crystallization media for proteins : I:Transport processes. J. Cryst. Growth 2001, 232, 165–172. [CrossRef]
35. Vidal, O.; Robert, M.C.; Boué, F. Gel growth of lysozyme crystals studied by small angle neutron scattering:case of agarose gel, a nucleation promotor. J. Cryst. Growth 1998, 192, 257–270. [CrossRef]
36. Chernov, A.A.; Garcia-Ruiz, J.M.; Thomas, B.R. Visualization of the impurity depletion zone surroundingapoferritin crystals growing in gel with holoferritin dimer impurity. J. Cryst. Growth 2001, 232, 184–187.[CrossRef]
37. Van Driessche, A.E.S.; Otalora, F.; Gavira, J.A.; Sazaki, G. Is Agarose an Impurity or an Impurity Filter? InSitu Observation of the Joint Gel/Impurity Effect on Protein Crystal Growth Kinetics. Cryst. Growth Des.2008, 8, 3623–3629. [CrossRef]
38. Lorber, B.; Sauter, C.; Ng, J.D.; Zhu, D.W.; Giegé, R.; Vidal, O.; Robert, M.C.; Capelle, B. Characterization ofprotein and virus crystals by quasi-planar wave X-ray topography: a comparison between crystals grown insolution and in agarose gel. J. Cryst. Growth 1999, 204, 357–368. [CrossRef]
39. GarcIa-Ruiz, J.M.; Gavira, J.A.; Otálora, F.; Guasch, A.; Coll, M. Reinforced protein crystals. Mater. Res.Bulletin 1998, 33, 1593–1598. [CrossRef]
40. Gavira, J.A.; Conejero-Muriel, M.; Delgado-López, J.M. Seeding from silica-reinforced lysozyme crystals forneutron crystallography. Acta Cryst. Section D Struc. Bio. 2018, D74, 1200–1207. [CrossRef]
41. Gavira, J.A.; Garcia-Ruiz, J.M. Agarose as crystallisation media for proteins II: trapping of gel fibres into thecrystals. Acta Cryst. Section D Bio. Cryst. 2002, 58, 1653–1656. [CrossRef]
42. Gavira, J.A.; Van Driessche, A.E.S.; Garcia-Ruiz, J.-M. Growth of Ultrastable Protein–Silica CompositeCrystals. Cryst. Growth Des. 2013, 13, 2522–2529. [CrossRef]
43. Dong, J.; Boggon, T.J.; Chayen, N.E.; Raftery, J.; Bi, R.-C.; Helliwell, J.R. Bound-solvent structures formicrogravity-, ground control-, gel- and microbatch-grown hen egg-white lysozyme crystals at 1.8 Åresolution. Acta Cryst. Section D Bio. Cryst. 1999, 55, 745–752. [CrossRef] [PubMed]
44. Evrard, C.; Maes, D.; Zegers, I.; Declercq, J.-P.; Vanhee, C.; Martial, J.; Wyns, L.; Weerdt, C.V.D. TIM CrystalsGrown by Capillary Counterdiffusion: Statistical Evidence of Quality Improvement in Microgravity. Cryst.Growth Des. 2007, 7, 2161–2166. [CrossRef]
45. Miller, T.Y.; He, X.-m.; Carter, D.C. A comparison between protein crystals grown with vapor diffusionmethods in microgravity and protein crystals using a gel liquid-liquid diffusion ground-based method. J.Cryst. Growth 1992, 122, 306–309. [CrossRef]
46. Kundrot, C.E.; Judge, R.A.; Pusey, M.L.; Snell, E.H. Microgravity and Macromolecular Crystallography.Cryst. Growth Des. 2001, 1, 87–99. [CrossRef]
47. Snell, E.H.; Helliwell, J.R. Macromolecular crystallization in microgravity. Rep. Prog. Phys 2005, 68, 799–853.[CrossRef]
48. Otwinowski, Z.; Minor, W. Processing of X-ray diffraction data collected in oscillation mode. Methods Enzymol.1997, 276, 307–326.
49. Carotenuto, L.; Cartwright, J.H.E.; Castagnolo, D.; García Ruiz, J.M.; Otálora, F. Theory and simulation ofbuoyancy-driven convection around growing protein crystals in microgravity. Micrograv. Sci. Tech. 2002, 13,14–21. [CrossRef]
50. Caylor, C.L.; Dobrianov, I.; Lemay, S.G.; Kimmer, C.; Kriminski, S.; Finkelstein, K.D.; Zipfel, W.; Webb, W.W.;Thomas, B.R.; Chernov, A.A.; et al. Macromolecular impurities and disorder in protein crystals. Proteins:Struc. Funct. Gene. 1999, 36, 270–281. [CrossRef]
51. Yoshizaki, I.; Sato, T.; Igarashi, N.; Natsuisaka, M.; Tanaka, N.; Komatsu, H.; Yoda, S. Systematic analysis ofsupersaturation and lysozyme crystal quality. Acta Cryst. Sec. D Bio. Cryst. 2001, 57, 1621–1629. [CrossRef]
52. Jones, L.V. The Collected Works of John W. Tukey: Philosophy and Principles of Data Analysis 1965-1986; Taylor &Francis: London, UK, 1987.
53. Maes, D.; Evrard, C.; Gavira, J.A.; Sleutel, M.; Van De Weerdt, C.; Otalora, F.; Garcia-Ruiz, J.M.; Nicolis, G.;Martial, J.; Decanniere, K. Toward a definition of x-ray crystal quality. Cryst. Growth Des. 2008, 8, 4284–4290.[CrossRef]

Crystals 2020, 10, 68 13 of 13
54. Mardia, K.V.; Kent, J.T.; Bibby, J.M. Multivariate Analysis; Academic Press: London, UK, 1979.55. Venables, W.N.; Ripley, D.R. Modern Applied Statistics with S; Springer-Verlag: New York, NY, USA, 2002.
© 2020 by the authors. Licensee MDPI, Basel, Switzerland. This article is an open accessarticle distributed under the terms and conditions of the Creative Commons Attribution(CC BY) license (http://creativecommons.org/licenses/by/4.0/).