on the pore-scale mechanisms leading to brittle and ...borja/pub/ijnamg2015(1).pdf · deformation...
TRANSCRIPT

INTERNATIONAL JOURNAL FOR NUMERICAL AND ANALYTICAL METHODS IN GEOMECHANICSInt. J. Numer. Anal. Meth. Geomech. 2015; 39:1165–1187Published online 16 Febuary 2015 in Wiley Online Library (wileyonlinelibrary.com). DOI: 10.1002/nag.2357
On the pore-scale mechanisms leading to brittle and ductiledeformation behavior of crystalline rocks
Martin Tjioe and Ronaldo I. Borja*,†
Department of Civil and Environmental Engineering, Stanford University, Stanford, CA 94305, U.S.A.
SUMMARY
Deformation mechanisms at the pore scale are responsible for producing large strains in porous rocks.They include cataclastic flow, dislocation creep, dynamic recrystallization, diffusive mass transfer, and grainboundary sliding, among others. In this paper, we focus on two dominant pore-scale mechanisms resultingfrom purely mechanical, isothermal loading: crystal plasticity and microfracturing. We examine the con-tributions of each mechanism to the overall behavior at a scale larger than the grains but smaller than thespecimen, which is commonly referred to as the mesoscale. Crystal plasticity is assumed to occur as dis-locations along the many crystallographic slip planes, whereas microfracturing entails slip and frictionalsliding on microcracks. It is observed that under combined shear and tensile loading, microfracturing gener-ates a softer response compared with crystal plasticity alone, which is attributed to slip weakening where theshear stress drops to a residual level determined by the frictional strength. For compressive loading, how-ever, microfracturing produces a stiffer response than crystal plasticity because of the presence of frictionalresistance on the slip surface. Behaviors under tensile, compressive, and shear loading invariably show thatporosity plays a critical role in the initiation of the deformation mechanisms. Both crystal plasticity andmicrofracturing are observed to initiate at the peripheries of the pores, consistent with results of experimentalstudies. Copyright © 2015 John Wiley & Sons, Ltd.
Received 14 May 2014; Revised 16 December 2014; Accepted 23 December 2014
KEY WORDS: crystal plasticity; deformation mechanisms; finite element; heterogeneity; microfracture
1. INTRODUCTION
The response of porous rocks during mechanical loading is of relevance to many real-world appli-cations. Depletion activities during hydrocarbon extraction may result in inelastic compactionthat gives rise to ground surface subsidence, borehole instability, or triggered seismicity. Carbonsequestration, hydraulic fracturing applied to geothermal reservoirs and shale gas production, andnumerous enhanced hydrocarbon recovery methods that rely on injecting fluids at elevated pressuremay induce seismicity, brittle fractures, and faults [1–19].
An interesting phenomenological behavior of porous rocks lies in their failure mechanism, whichtransitions from brittle faulting to ductile flow. During brittle faulting, a macroscopic stress drop isobserved after the peak stress has been achieved [20], whereas during ductile flow, the stress staysconstant or continues to increase, albeit at a slower rate. Early experimental studies discovered thatthis transition takes place at the stress state when the frictional strength exceedance occurs at thesame time as fracture creation [21, 22]. At low confining pressure, the rock typically fails throughbrittle faulting, but when the confining pressure is increased sufficiently, cataclastic flow occurs, andno stress drop is observed. Further studies have demonstrated that this transition stress state is alsoaffected by the porosity of the rock [24, 25].
*Correspondence to: Ronaldo I. Borja, Department of Civil and Environmental Engineering, Stanford University,Stanford, CA 94305, U.S.A.
†E-mail: [email protected]
Copyright © 2015 John Wiley & Sons, Ltd.

1166 M. TJIOE AND R. I. BORJA
There have been a number of experimental studies investigating the micromechanics of quartzite,limestone, and sandstone. Both micritic and allochemical limestones have demonstrated that cata-clasis is the dominant mechanism [26, 27]. Microcracks have been observed to originate from thepores, with the larger pores driving crack propagation. Cataclastic flow, which results in compactivebehavior, has been observed to be transient, giving way to net dilatancy at a higher strain rate [23,24]. However, experiments reported in the literature do not allow the individual deformation mech-anisms to be isolated, and so the contributions of each mechanism cannot be quantified from thecomplex interaction of different mechanisms.
Discrete element models of rock’s microstructure have been used with some success to modelthe brittle-ductile transition in rocks. These models typically use an assembly of circular disks orspherical particles to represent the microstructure with bonds acting as the cement between theparticles [20, 28–30]. In other cases, sets of discontinuities are explicitly embedded into the rockmatrix [31]. Various different ways to model pore collapse also have been proposed and amongthem, Wang et al. [29] used grain shrinkage to simulate intra-granular cracking and grain crushingprocesses. In these models, porosity is derived based on the spaces generated from the randomassembly of the circular disks or spherical particles.
Various deformation mechanisms govern the microstructural changes in rocks. They include crys-tal plasticity, microcracking, pore collapse, and diffusional mass transfer. In this paper, we focus ontwo dominant pore-scale mechanisms resulting from purely mechanical, isothermal loading: crys-tal plasticity and microfracturing. These deformation mechanisms are interdependent on each other,with crystal plasticity triggering microfracturing and microfracturing triggering more crystal plas-ticity. However, they are herein studied independently in order to determine their overall effect onthe macroscopic behavior of porous rocks. This study is particularly useful for understanding thebehavior of high-porosity rocks, such as limestone, diatomite, and chalk, where the amount of porespace present per unit volume is quite substantial.
The FEM is used to model pore-scale deformation, with voids embedded explicitly into a crys-talline solid matrix to allow investigation of the evolution of deformation and stresses in the solid.Rate-independent crystal plasticity theory is employed, along with a robust ultimate algorithm fortracking the sequence of slip activation in the crystal [32, 33]. Microfracturing is modeled throughthe strong discontinuity approach, where distinct slips are embedded locally within the elements.This approach is particularly appealing because slips due to microcracking can be represented in thesolution without generating additional unknown global degrees of freedom [34–42].
The following notations and symbols are used throughout this work: boldface letters denotetensors and matrices, and subscripted letters denote their scalar components. The summation con-vention is enforced in this paper. We follow the standard engineering mechanics convention in whichcompression takes on a negative sign.
2. CRYSTAL PLASTICITY
Common rocks such as granite, marble, quartzite, calcite, and halite are made up of crystals astheir basic building blocks. It is generally recognized that crystal deformation is responsible forsome brittle microfailure processes in these materials, including the loss of cohesion along grainboundaries and across individual crystals, a process called cataclasis [43]. Crystal deformationmay also be responsible for other mechanical processes such as creep and pressure solution, albeitthe actual mechanism for the latter process is not so well understood. In brittle crystals, such asquartz crystals, dislocation generation and movement are only possible under atmospheric pressureat temperatures above 820ıK [44], but plastic flow is possible at lower temperatures if superim-posed hydrostatic pressure prevents fracture [45]. In calcites, twinning occurs predominantly at lowtemperatures [46]. Deformation twins are also observed at room temperature in hydrostatically com-pacted limestone samples and may become more pervasive under nonhydrostatic loading and higherstresses [27].
Crystal plasticity is used to model irreversible deformation in the mineral grains, which typicallyoccurs near the periphery of the pores as they change shape to accommodate the increased effective
Copyright © 2015 John Wiley & Sons, Ltd. Int. J. Numer. Anal. Meth. Geomech. 2015; 39:1165–1187DOI: 10.1002/nag

PORE-SCALE MECHANISMS IN CRYSTALLINE ROCKS 1167
stress in the solid matrix. An example of crystal plastic deformation is twinning that is observed incalcite grains of limestone specimens near the pore peripheries [48]. Whereas the overall effectivestress may be macroscopically hydrostatic, at the pore-scale level, the solid matrix stresses could befar from being hydrostatic. This is due to irregular shape of the pores and their non-uniform size anddistribution within the solid matrix.
Crystal deformation differs from continuum deformation in that dislocation generally occursalong glide planes where the atom arrangement is densest (see [49] for other factors affecting dis-location). There is a finite number of glide planes in a crystal arrangement; the challenge lies inidentifying which of these glide planes are active. Because there could be more than one activeglide plane for a single crystal at any given time, plastic deformation may be viewed as arising fromcombined activation (although not simultaneously) of slip systems from the set of potentially activesystems. Crystal plasticity deals with multiple active constraints at the grain level representing yieldconditions on glide planes. Some of these constraints are linearly independent, whereas others areredundant. The constraints are represented by multiple yield surfaces intersecting in a non-smoothfashion [50].
Bishop and Hill [51, 52] were among the first investigators to model the plastic behavior ofpolycrystalline materials, but their technique did not address the sequence of slip system activa-tion. Budiansky and Wu [53] and Hutchinson [54] employed a trial and error procedure to identifythe active slip systems in face-centered cubic (f.c.c.) crystals. Several other algorithms for rate-independent crystal plasticity have been proposed in the literature [55–57], but identifying thelinearly independent constraints continues to be a major challenge.
Rate-dependent regularization has been employed by most authors to avoid having to deal withlinearly dependent slip systems [58–60]. In rate-dependent formulation, all systems can activate,and slips can be determined according to the viscosity of the material [61, 62]. However, theresolved shear stress becomes a bounded function when the rate sensitivity becomes small, makingthe set of constitutive equations exceedingly stiff and very difficult to solve [63, 64]. For this rea-son, it may be more expedient to consider an algorithm that is truly dedicated to rate-independentcrystal plasticity.
Borja and Wren [32] presented an algorithm for identifying the independent active constraintsin crystals slipping on glide planes, which Borja and Rahmani [33] subsequently implementedinto a finite element code. Their algorithm considers the incremental strain in the crystal as beingsubdivided into substeps, identifying all constraints activated along the way. They used the word‘ultimate’ for this algorithm to suggest its robust nature in that no potentially active constraint canbe missed by the identification procedure. Later, Borja and Rahmani [65] extended the ultimatealgorithm for rate-independent crystal plasticity to the finite deformation range. In what follows, wefocus on the ultimate algorithm in the infinitesimal range as a means to capture crystal plasticitydeveloping in the solid component of crystalline rocks.
When polycrystalline rocks are subjected to strain, one of the mechanisms of deformation is slid-ing along the weak crystallographic planes. This mechanism can be manifested either as dislocationsor deformation twins [66]. An example of deformation twins in calcite is illustrated schematically inFigure 1. These twins form when the shear stress along the twin plane reaches a certain peak value.Notice a set of twins (in red) with the same orientation developing and intersected by another set oftwins (in white) with a different orientation.
The goal of a crystal plasticity algorithm is to identify the activated slip systems and their corre-sponding slip magnitudes. It is important to distinguish between such plastic deformation and elasticdeformation as the former alleviates crystal stress, whereas the latter leads to an increase in crystalstress. As such, plastic slips affect the constitutive relationship, which links the stress in the crystalbody to its total deformation. An expression of the constitutive equation can be written using thesummation convention as
��ij D ceijkl��
ekl D c
eijkl
���kl ���
p
kl
�; (1)
Copyright © 2015 John Wiley & Sons, Ltd. Int. J. Numer. Anal. Meth. Geomech. 2015; 39:1165–1187DOI: 10.1002/nag

1168 M. TJIOE AND R. I. BORJA
Figure 1. Schematic illustration of calcite twins from the northern Subalpine Chain, France, adapted fromFerrill et al. [47]. Two sets of twins with different orientations are shown intersecting each other.
where ��ij is the overall incremental crystal stress tensor, ceijkl
is the elasticity tensor, which isa function of the elastic moduli, and ��kl is the incremental strain tensor with elastic compo-nent ��e
kland plastic component ��p
kl. Elastic strain in crystals is observed as distortion of the
lattice structure, which goes away when the stress is removed. Plastic strain, on the other hand, isirreversible and arises from slips on the crystallographic planes.
The plastic strain in a crystal is derived from the contribution of slip from each of the slip systems,which is triggered when the shear stress on the plane exceeds the peak value �Y , also known asthe yield stress. In crystals, this yield stress can increase when strengthening occurs because ofdislocations in the crystal structure. In this work, however, we assume that the yield stress remainsconstant (perfect plasticity), that is,
f .ˇ/ D j�ij˛.ˇ/ij j � �
.ˇ/Y D 0; ˇ D 1; 2; :::; N ; (2)
where � .ˇ/Y is the yield stress at glide plane ˇ. To characterize the slip in system ˇ, we need to know
the slip increment�� .ˇ/, the unit vector n.ˇ/ normal to the glide plane, and the slip direction vectorm.ˇ/, as shown in Figure 2. The plastic component of incremental strain tensor can be obtainedfrom the sum of the slips from all the active systems [50, 67], that is,
��p
klDXˇact
�� .ˇ/1
2.m
.ˇ/
kn.ˇ/
lCm
.ˇ/
ln.ˇ/
k/ D
Xˇact
�� .ˇ/˛.ˇ/
kl: (3)
Plastic strain is volume-preserving because slip directions are orthogonal to the glide plane nor-mals. This can be observed from (3) by noting that ��p
kkD 0 because m.ˇ/
kn.ˇ/
kD 0. However, a
rock mass can still change in volume as a result of the elastic deformation of the lattice and, moreimportantly, the expansion or contraction of the pore spaces surrounding a crystal grain.
One major issue in the implementation of crystal plasticity theory lies in the linear dependence ofthe glide planes, which results in a non-unique combination of active constraints. As an illustration,consider an f.c.c. crystal that has eight octahedral planes shown in Figure 3. Each of these planeshas three slip directions, giving rise to 24 potentially active slip systems. However, the incremen-tal plastic strain tensor ��p
klis symmetric with only six independent components. Furthermore, the
Copyright © 2015 John Wiley & Sons, Ltd. Int. J. Numer. Anal. Meth. Geomech. 2015; 39:1165–1187DOI: 10.1002/nag

PORE-SCALE MECHANISMS IN CRYSTALLINE ROCKS 1169
Figure 2. Glide plane ˇ with unit normal n.ˇ/ and slip directionm.ˇ/.
Figure 3. Eight octahedral planes in a face-centered cubic crystal.
constraint that plastic strain is volume-preserving restricts the number of independent componentsto five. This implies that a given plastic strain tensor can be obtained from many possible combi-nations of active slip systems. This is addressed in the computation using the ultimate algorithmmentioned earlier.
The basic premise of the ultimate algorithm is to determine the plastic strain increment ��pkl
asa function of the total strain increment ��kl in such a way that activated slip systems are identi-fied sequentially. To illustrate the algorithm, consider an initial condition in which the shear stressat each glide plane is less than the yield stress so that the initial response is elastic. The incre-mental strain ��kl is then increased linearly until the first slip ˇ1 (primary system) activates.
Copyright © 2015 John Wiley & Sons, Ltd. Int. J. Numer. Anal. Meth. Geomech. 2015; 39:1165–1187DOI: 10.1002/nag

1170 M. TJIOE AND R. I. BORJA
The point when this occurs is denoted by �.ˇ1/��kl . This causes the response to transition fromelastic to elastoplastic, with the elastoplastic response reflecting plastic slip produced by the pri-mary system. The remaining portion of the incremental strain is then applied, while the primarysystem remains active, until a secondary system ˇ2 activates at �.ˇ2/��kl . This causes the responseto transition from having one slip system to having two active slip systems and so on. For each slipsystem not belonging to be previousm active slip systems, the ray �.ˇ/ can be evaluated and used toconstruct the set
‰mC1 D°�.ˇ/ 2 RC
ˇ̌̌ .ˇ/�ij˛
.ˇ/ij � �Y;n D 0
±: (4)
If any of the �.ˇ/ is less than 1, it implies that the next active slip system ˇmC1 is what producesthe smallest element in‰mC1. In the event that linearly dependent slip systems are encountered, theredundant systems are discarded arbitrarily. Thus, for a set of slip systems Jact, where Jact D ¹ˇ 2
¹1; 2; :::; N ºjf .ˇ/ D 0 and �� .ˇ/ � 0º, we can obtain the set of linearly dependent active constraintJ act � Jact. It must be noted that while redundant slip systems may be eliminated arbitrarily, theoverall crystal stress calculated from this procedure is always unique and does not depend on thespecific combination of linearly independent active systems selected.
The input parameters used in the crystal plasticity algorithm describes the mechanical propertiesof the crystal and its geometry. The material parameters include Young’s modulus of elasticityE andPoisson’s ratio �, as well as the initial yield strength �Y , which is assumed to be the same for all slipsystems. The geometry of the crystallographic planes is described by the normal vector n.ˇ/ and slipdirectionm.ˇ/, as well as the Euler angles and , which describe how the crystal reference frameis oriented with respect to the fixed reference frame. As shown in Figure 4, the crystal coordinatesare obtained by a positive (right-hand rule) rotation of about the y-axis followed by a positiverotation of about the ´c-axis. The third Euler angle is zero.
The crystal plasticity algorithm consists of a predictor phase (Box 1) and a corrector phase(Box 2). The flow charts are more elaborate than the conventional plasticity algorithm because ofthe multi-surface nature of the yield condition and the filtering of the yield constraints to remove thelinearly dependent constraints. The algorithm must also accommodate for slip systems that deacti-vate during substepping (Step 3 of Box 2). As noted in [32, 33], the algorithm is unconditionallyconvergent as well as exact for loading imposed as a ramp function.
Figure 4. Euler angles describing the relationship between the crystal reference frame and the fixed referenceframe. The crystal coordinates are obtained by a positive (right-hand rule) rotation of about the y-axis
followed by a positive rotation of about the ´c-axis.
Copyright © 2015 John Wiley & Sons, Ltd. Int. J. Numer. Anal. Meth. Geomech. 2015; 39:1165–1187DOI: 10.1002/nag

PORE-SCALE MECHANISMS IN CRYSTALLINE ROCKS 1171
Box 1. Predictor phase for crystal plasticity algorithmStep 1. Compute the trial stress � trij;nC1 D �ij;n C c
eijkl
��kl .Assemble J tr, the set of active slip systems based on the trial stress,J tr D ¹ˇ j .ˇ/� tr
ij;nC1˛.ˇ/ij � �Y;n > 0º.
Step 2. Check: Is J tr a null set?Yes, response is elastic. Set �ij;nC1 D � trij;nC1 and cijkl D ceijkl .Exit predictor phase.
Step 3. No, response is plastic.Assemble Jact, the set of active slip systems in the current time step,Jact D ¹ˇ j
.ˇ/�ij;n˛.ˇ/ij � �Y;n > 0º.
Call Box 2.Step 4. Update crystal stress and tangent operator for the next time step
�ij;nC1 D �ij;n; cijkl D cep
ijkl.
Box 2. Corrector phase for crystal plasticity algorithm
Step 1. If Jact is a null set, go to Step 5.Step 2. Identify linearly independent slip systems in Jact and store in J act.
Step 3. Compute �� .ˇ/ for each element in J act.Drop the inactive slip systems, indicated by negative �� .ˇ/.
Step 4. Compute cijkl D cep
ijklfor the current J act.
Step 5. Compute �.ˇ/ for all slip systems not in J act. Assemble ‰mC1.Step 6. Is any �.ˇ/ < 1?
Yes, response is plastic. Update:�ij;n �ij;n C �
.ˇmC1/cep
ijkl��kl
��ij ��ij � �.ˇmC1/��ij .
Include ˇmC1 into the set J act.No, response is elastic.
Step 7. If �.ˇmC1/ < 1, go to Step 2.Step 8. Return to Box 1.
3. MICROFRACTURING
Microfracturing involves the formation of fine cracks in the pore scale. A large increase in thestrain results when slip occurs on the crack that is confined to a very small region. Oftentimes, thiscoincides with bifurcation of material response characterized by the loss of uniqueness of the defor-mation mode [68]. Microfractures have been observed to form in close proximity to imperfectionsin porous rocks. Micritic limestone with an initial porosity of 13.4% undergoing hydrostatic com-paction was shown to develop a halo of cataclastic damage surrounding the macropore [26]. Thishalo consists of tiny cracks that form and intersect one another all around the perimeter of the pore.Microcracks also have been observed to develop in triaxially deformed specimens of limestone,propagating from the pores and coalescing to reach lengths much larger than the pore diameter.Hirth and Tullis [24] observed axial microcracks forming at the top and bottom of quartzite poresunder triaxial compression, which became more closely spaced as the differential stress increased.
In this paper, we simulate the process of microfracturing using the strong discontinuity approach.‘Strong discontinuity’ refers to a jump in the displacement field over an idealized surface with zerothickness. This is in contrast to ‘weak discontinuity’ where a kink on the displacement field occurs,resulting in a jump in the strain field. We emphasize that the microfractures addressed in this workpertain to random, discontinuous cracks as motivated by the experimental observations described in
Copyright © 2015 John Wiley & Sons, Ltd. Int. J. Numer. Anal. Meth. Geomech. 2015; 39:1165–1187DOI: 10.1002/nag

1172 M. TJIOE AND R. I. BORJA
the first paragraph of this section and not to a continuous crack that requires a special tracking algo-rithm to delineate its geometry of propagation [69, 70]. We also emphasize the importance of a fullthree-dimensional analysis to accommodate the kinematics of three-dimensional randomly form-ing and discontinuous cracks. The development of the strong discontinuity approach for simulatinglocalized deformation has gained momentum since the mid-1990s because of the shortcoming ofclassical plasticity theory to provide a characteristic length scale needed for predicting the responsebeyond the bifurcation point [71, 72].
We employ the assumed enhanced strain (AES) FEM to improve the performance of the finiteelements in resolving the kinematics of strong discontinuity. The AES method introduces an addi-tional slip degree of freedom within a localizing element. An advantage of the AES approach is thatthe enhancement is carried out on the element level without changing the size of the global sys-tem of equations to solve. Furthermore, it can accommodate random and disconnected cracks andcan smear strain concentrations around the crack tip much better than the extended FEM, whichrequires additional crack tip enhancements to avoid locking around the crack tips [73, 74]. Thepresent work features an enhancement of hexahedral finite elements to accommodate the kinematicsof microfracturing at the pore scale. We note a clear separation of scales in the present work in thatthe AES approach is not used to propagate the microfractures to the next larger scale, but rather, tosimply capture the micromechanics of the underlying overall constitutive law. In other words, themicrofractures are not traced, unlike in all previous works, but instead are simply allowed to emergein highly stressed elements.
To illustrate the capture of microfracturing with the AES approach, we consider a domain B ina two-dimensional setting shown in Figure 5. We can view randomly oriented microfractures asreflecting the slip orientations of the most highly stressed crystals, typically located near the periph-eries of the pores. In the present approach, each damaged element could contain no more than onemicrofracture. The physical microfracture may lie exclusively within the element interior and notnecessarily intersect the element sides, but the smearing process characteristic of the AES approachassumes the crack to extend all the way to the element sides, such as the microfracture that partitionsa finite element into sides A and B in Figure 5. This results in the development of displacementjumps not only on the surface of the microfracture but also on the sides of the neighboring elementsintersected by the microfracture. The kinematics of the microfracture is strictly local to the damagedelement, and the slip degree of freedom is eliminated prior to global assembly by the traditional tech-nique of static condensation [75]. The bulk material outside the microfracture is assumed to undergoelastic unloading, although it is also possible to consider bulk plasticity outside the discontinuityzone [76, 77].
Figure 5. Randomly oriented and disconnected microfractures: each shaded finite element contains no morethan one microfracture. Assumed enhanced strain approach extends the microfracture all the way to the sides
of the element, partitioning the element domain into sides A and B .
Copyright © 2015 John Wiley & Sons, Ltd. Int. J. Numer. Anal. Meth. Geomech. 2015; 39:1165–1187DOI: 10.1002/nag

PORE-SCALE MECHANISMS IN CRYSTALLINE ROCKS 1173
Two questions naturally arise with the proposed approach: (i) what triggers microfracturing, and(ii) how does a microfracture evolve after it has been triggered? In quartz crystals, the stress requiredfor the tensile fracture depends on the geometry of the initiating imperfection. Sharp notches, forexample, require a surface energy of approximately 2 J/m2 to fracture at room temperature [78].Furthermore, quartz shows a propensity to fracture along rhombohedral planes, with the presenceof water reducing the stress required to fracture. Common sedimentary rocks, however, contain notonly quartz but also calcite, dolomite, gypsum, and all the clays. In calcite, many preexisting defectscan initiate a crack, including closed pores, clay mineral precipitates, and steps. Micrographs [79]indicate that the fracture surface in calcite intersects many such defects so that the conventionalGriffith criterion cannot be used because all defects are relevant. Taking all these factors into con-sideration would result in considerable uncertainties in the formulation. Thus, our microfracturingcriterion revolves around the simplified crystal structure described previously, with the simple rulethat microfracturing initiates on any possible slip plane in the crystal that is most stressed.
Once the most stressed (primary) slip system is detected, the normal n and slip direction m ofthe microfracture are defined. In the case of an interface contact, the stress in the element can becalculated as
�eij D ceijkl W
1
V
Z�e
Œ�c;kl � �et .f
h;k ˝ml/
s� d ; (5)
where �c;kl is the conforming strain field, �et is the tangential slip within an element, and f h isan arbitrary smooth blending function. The blending function is used to recover the concentrateddisplacement jump from the conforming displacement field (see Chapter 7 of [50] for details on thisblending function). In the finite element implementation, an eight-point Gauss integration rule isemployed to calculate the volume integral. A constant slip interpolation is used, which implies thatthe tangential slip �et is constant for each enhanced element.
Knowledge of the position of the microfracture within an enhanced hexahedral element isrequired to define the blending function f h. Normal separation n and slip direction m areinsufficient to identify the position of the microfracture. This is illustrated in Figure 6 where three
Figure 6. Enhancement of hexahedral finite elements to accommodate a microfracture: darker planes denoteplanes of microfracture; filled nodes lie on the ‘positive’ side of the microfracture; empty nodes lie on the
‘negative’ side.
Copyright © 2015 John Wiley & Sons, Ltd. Int. J. Numer. Anal. Meth. Geomech. 2015; 39:1165–1187DOI: 10.1002/nag

1174 M. TJIOE AND R. I. BORJA
possible configurations of a microfracture with identical n and m are shown. The position of themicrofracture is assigned arbitrarily to an element because microfractures are discontinuous acrosselement boundaries, and thus, the microfracture edge of one element does not need to be alignedwith that of its neighboring element. In the present simulations, every element assumes configura-tion (b) in Figure 6, where both the ‘positive’ and ‘negative’ sides of the microfracture contain fournodes of the enhanced hexahedral element.
Discontinuous deformation can be used to capture microfracturing of the mineral grains. Whereasthe balance of linear momentum and the bulk constitutive law must be satisfied within a conven-tional finite element interpolating a conforming displacement field, finite elements containing amicrofracture are also required to satisfy an interface constitutive law on the plane of discontinuity.For a porous rock, this interface constitutive law is the cohesive frictional law in which the occur-rence of slip is signified by the resolved shear stress exceeding the combined frictional and cohesiveresistance on the most highly stressed slip system.
The interface constitutive law must account for slip weakening, a process in which the strength ofan intact rock drops to a purely frictional value on the surface of discontinuity. The process involvescombined friction hardening–cohesion softening [50, 80]. The frictional resistance is assumed toincrease linearly from zero at the point of localization to the full value over a characteristic slidingdistance �C, while the cohesion drops linearly to zero over the same characteristic sliding distance.The slip weakening constitutive law can be written in terms of an interface yield function
f et D
²j�ej C �e�e�et =�
C � ce.1 � �et =�C/ D 0; if 0 � j�et j � �
C;
j�ej C �e�e D 0; if j�et j > �C;
(6)
where the superscript ‘e’ pertains to the localizing element, �et is the tangential slip on the discon-tinuity, �e is the coefficient of friction on the interface, �e is the stress normal to the surface ofdiscontinuity (negative under compression), and ce is the cohesion within the localizing element.The initial value of cohesion is equal to the shear stress at the point of localization so that the yieldfunction is equal to zero when slip initiates.
In the event that the interface separates, the normal stress must necessarily drop to zero, and thus,the frictional resistance must also drop to zero. This process is represented in Equation (6) by thevanishing of the second (frictional) term. As a result, the shear stress on the plane goes to zero oncethe cohesion disappears over the characteristic sliding distance. In addition, the fractured elementmust also satisfy the conditions that the second tangential stress component as well as the stresscomponent normal to the plane are zero. This is expressed in the form of the yield conditions f et2and f en as follows:
f et2 D
²j�e2 j � c
e2.1 � �
et2=�
Ct2/ D 0; if 0 � j�et2j � �
Ct2;
j�e2 j D 0; if j�et2j > �Ct2;
(7)
f en D �e D 0 : (8)
Therefore, for any finite element containing a microfracture, we can quantify three types of discon-tinuity: two tangential slips (�et and �et2) and normal separation (�en). Furthermore, the stress in theelement as depicted in Equation (5) must also take into account the two additional discontinuities.
Box 3 shows a summary of the finite element implementation of the AES approach. The firststep checks for the localization condition in the crystals. Once the primary slip system is identifiedwithin an element, the slip normal and slip direction for the crystal are used by the algorithm todetermine the geometry of the microfracture and calculate the amount of microslip on the activeplane of the crystal. By using the same crystal configuration for capturing both ductile deformation
Copyright © 2015 John Wiley & Sons, Ltd. Int. J. Numer. Anal. Meth. Geomech. 2015; 39:1165–1187DOI: 10.1002/nag

PORE-SCALE MECHANISMS IN CRYSTALLINE ROCKS 1175
due to crystal slips and brittle deformation due to microfracturing, we can make a more meaningfulcomparison of the two micromechanisms of deformation.
Box 3. Finite element implementation of the AES approach
Step 1. Check: has the material localized?No, elastic deformation continues.Yes, fracture is initiated. Setne D slip normal of the primary slip systemme D slip orientation of the primary slip system.
Step 2. For every localized element,a. Calculate:- Plastic strain as a function of ne andme;- Balance of linear momentum and interface yield conditions
as a function of displacement and slip unknowns.b. Linearize the equations.
Obtain element stiffness and residual matrices.c. Statically condense slip degrees of freedom.
Obtain new element stiffness and residual matrices.Step 3. Solve the global system of equations. Obtain displacement dofs.Step 4. Obtain slip rate increments for each localized element.Step 5. Repeat Steps 1–5 until convergence is achieved.Step 6. Store converged displacement and slip dofs.
4. SIMULATION RESULTS
We now investigate the pore-scale mechanical responses of a crystalline material with propertiessimilar to those of limestone. It is generally recognized that even at room temperature and pres-sure, both crystal plasticity and microfracturing can dominate the micromechanisms of deformationin limestone. Laboratory experiments involving mechanical deformation of limestone have beenconducted, and instances of crystal plasticity and microfracturing are well documented throughobservations at the pore scale using either optical micrograph in plain transmission light or backscat-tered scanning electron microscope [27, 48]. Table I shows the mechanical properties used in thesimulations. The crystal yield stress is assumed to be constant for all slip systems and is denoted bythe symbol �Y .
The solid matrix microstructure is modeled using the FEM. A cube is used to represent a repre-sentative elementary volume (REV), which, by definition, is larger than the pore scale but smallerthan the specimen scale. We consider two different types of inhomogeneities in the REV, namely,the void distribution and crystal orientation. The voids are modeled explicitly as hollow inclusionswith cubical geometry. This allows us to look more closely into the stress–strain behavior and pat-terns surrounding the voids. Even though voids in reality have more complex geometry than theidealized shape assumed, this simple geometry is capable of capturing not only smooth boundariesbut also sharp edges, which may introduce local stress concentration. The model contains four ran-domly positioned voids with varying sizes, as shown in Figure 7(a), resulting in an overall porosityof 3.8%. The different sizes of the voids allow us to investigate the effect of pore size on fracture and
Table I. Material properties for limestone-like rock.
Parameter Symbol Value
Young’s modulus E 20,000 MPaPoisson’s ratio � 0.30Crystal yield stress �Y 30 MPa
Copyright © 2015 John Wiley & Sons, Ltd. Int. J. Numer. Anal. Meth. Geomech. 2015; 39:1165–1187DOI: 10.1002/nag

1176 M. TJIOE AND R. I. BORJA
Figure 7. Partition of the representative elementary volume into (a) solid material (white region) and air void(gray region) and (b) two crystal groups with Orientation #1 (white region) and Orientation #2 (gray region).
Table II. Euler angles of the crystal groups in degrees.
Orientation
#1 0.0 22.0#2 0.0 0.0
crystal plasticity initiation. Note that the REV represents a specific pore-scale structure and does notnecessarily suggest a recurring microstructure in nature.
Limestone has a complex crystal lattice, being primarily made up of calcite, dolomite, and arago-nite. Both calcite and dolomite have rhombohedral crystal structures, while aragonite has a rhombicstructure [81]. This gives rise to many forms and lattice directions. Because of this complexity, wemake a simplifying assumption in our model that the crystal lattice is made up of f.c.c. crystals.Despite this simplification, we believe that the simulation will still shed light onto the impor-tant micromechanisms of deformation in a polycrystalline rock containing voids and other formsof heterogeneity.
An f.c.c. crystal has eight {1 1 1} octahedral planes. Each of these planes has three h110i slipdirections, resulting in 24 potentially active slip systems. However, only 12 slip systems can activateat any given time because the eight octahedral planes form conjugate pairs where an active planein a pair implies that the other plane in the same pair is inactive. The REV contains two crystalgroups with different crystal orientations. Figure 7(b) illustrates the configurations of the two crystalgroups, whereas Table II summarizes the values of the Euler angles for these two groups.
The REV is a 20 � 20 � 20 �m3 volume partitioned into 18 � 18 � 18 cubical elements. In boththe crystal plasticity and microfracturing simulations, each solid element deforms elastically at thebeginning of the simulation until the yield condition for one of the slip systems is reached, indicatingcrystallographic slip. In crystal plasticity, slips on the crystallographic planes continue as long as theslip system remains active. However, in the microfracturing simulations, slip on the primary systemindicates localization triggering strong discontinuity. Slip weakening then governs the constitutivebehavior on the surface of discontinuity, causing the transition from a cohesive frictional behaviorto a purely frictional behavior (or frictionless behavior in the case of a normal separation). In allthe simulations carried out, the load imposed on the boundary is always driven by a prescribedboundary deformation.
A homogenization procedure is needed to obtain the average behavior at the scale of theREV [82]. There are many different ways to homogenize the stress responses. For a finite ele-ment mesh with uniformly sized cubical finite elements, the stresses can be homogenized simply bycalculating the volume-averaged responses at the integration points, that is,
�ij D1
V
ZV
�eij dV D1
nint
nintXnD1
.�ij /n ; (9)
Copyright © 2015 John Wiley & Sons, Ltd. Int. J. Numer. Anal. Meth. Geomech. 2015; 39:1165–1187DOI: 10.1002/nag

PORE-SCALE MECHANISMS IN CRYSTALLINE ROCKS 1177
where �ij is the overall Cauchy stress tensor, �eij is the stress tensor at each element, .�ij /n is thestress tensor at each integration point, and nint is the total number of integration points in the REV,including the phantom integration points for the void spaces (because the voids are part of the totalvolume). Different invariants of the overall stress, such as the mean normal stress and the von Misesstress, can be calculated readily from the volume-averaged stress tensor.
We consider two different loading conditions, namely, combined shear and extension, and com-bined compression-lateral extension loading. Both crystal plasticity and microfracturing simulationsare conducted for each loading condition. We also consider different crystal orientations to betterunderstand the effect of this parameter on the ensuing micromechanical responses. All integrationpoints are assumed to be initially stress-free.
4.1. Combined shearing and extension
In this simulation, the REV undergoes affine transformation on its six faces, producing shearing andexpansion in the volume. The displacements on the boundaries are incremented linearly at each timestep. The incremental displacements (in nm) applied on the faces of the REV take the form
8<:�ux�uy�u´
9=; D 0:03
8<:.x C 10/C .´C 10/
0
.x C 10/C .´C 10/
9=; nm ; (10)
where x; y; ´ are Cartesian coordinates in microns. Note that the displacement in the y-direction isrestrained, creating a plane strain condition on the x´-plane (Figure 8(a)). This deformation fieldpreserves the planar configuration of all six faces of the volume, even though the deformation fieldin the interior of the volume remains irregular because of microstructural effects. For the microfrac-turing simulation, the characteristic sliding distance �C is assumed to be very small such that slipweakening occurs in one time step.
Figure 9(a) shows cutouts of the REV revealing the inelastic deformation developing in the inte-rior of the volume due to crystal plasticity. A yield zone emanates from a corner of the largervoid and merges with another yield zone emanating from a nearby smaller void. We recall fromEquation (3) that the continuum incremental plastic strain for a crystal is the sum of the contribu-tions from the activated slip systems. The plastic strain contour plotted in Figure 9 is the cumulativeplastic strain
"p D
nstepXnD1
q��
p
kl��
p
kl; (11)
where nstep is the number of load increments over which the plastic strain is accumulated.By comparison, Figure 9(b) and (c) portray the cumulative tangential slip and normal separa-
tion, respectively, generated by the AES approach for the same imposed boundary deformation
Figure 8. Affine deformation of six faces of the representative elementary volume: (a) combined shearingand extension; and (b) vertical compression–lateral extension with net volumetric compression.
Copyright © 2015 John Wiley & Sons, Ltd. Int. J. Numer. Anal. Meth. Geomech. 2015; 39:1165–1187DOI: 10.1002/nag
1178 M. TJIOE AND R. I. BORJA
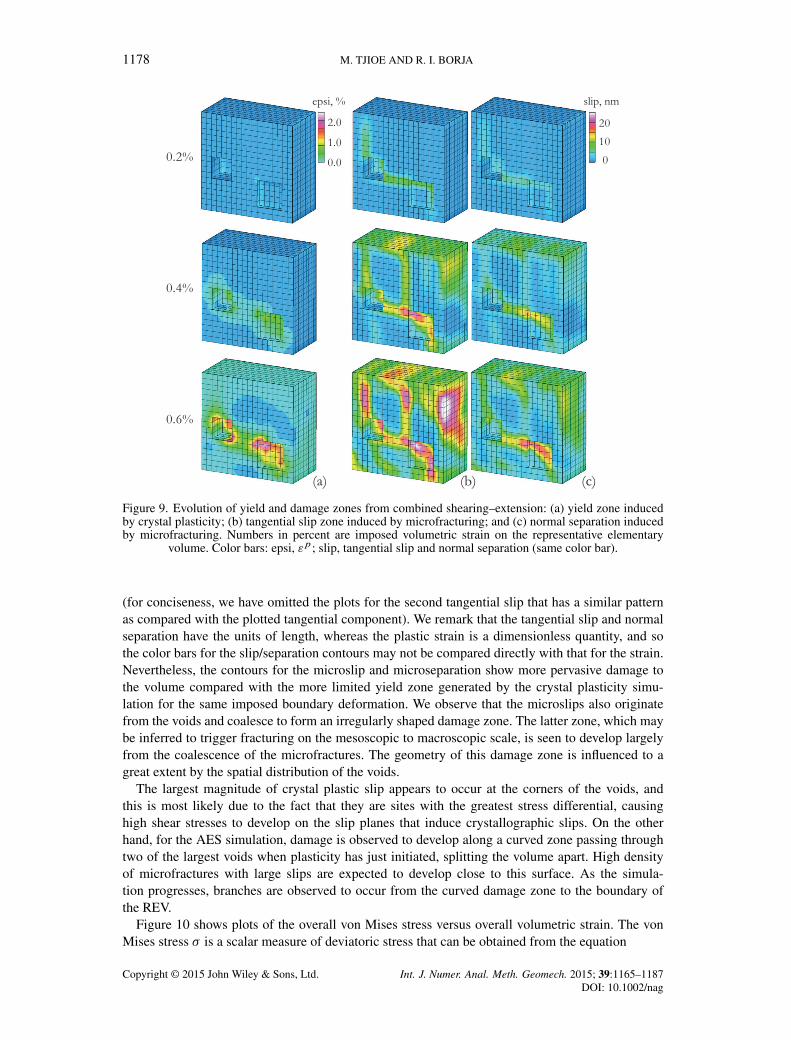
Figure 9. Evolution of yield and damage zones from combined shearing–extension: (a) yield zone inducedby crystal plasticity; (b) tangential slip zone induced by microfracturing; and (c) normal separation inducedby microfracturing. Numbers in percent are imposed volumetric strain on the representative elementary
volume. Color bars: epsi, "p; slip, tangential slip and normal separation (same color bar).
(for conciseness, we have omitted the plots for the second tangential slip that has a similar patternas compared with the plotted tangential component). We remark that the tangential slip and normalseparation have the units of length, whereas the plastic strain is a dimensionless quantity, and sothe color bars for the slip/separation contours may not be compared directly with that for the strain.Nevertheless, the contours for the microslip and microseparation show more pervasive damage tothe volume compared with the more limited yield zone generated by the crystal plasticity simu-lation for the same imposed boundary deformation. We observe that the microslips also originatefrom the voids and coalesce to form an irregularly shaped damage zone. The latter zone, which maybe inferred to trigger fracturing on the mesoscopic to macroscopic scale, is seen to develop largelyfrom the coalescence of the microfractures. The geometry of this damage zone is influenced to agreat extent by the spatial distribution of the voids.
The largest magnitude of crystal plastic slip appears to occur at the corners of the voids, andthis is most likely due to the fact that they are sites with the greatest stress differential, causinghigh shear stresses to develop on the slip planes that induce crystallographic slips. On the otherhand, for the AES simulation, damage is observed to develop along a curved zone passing throughtwo of the largest voids when plasticity has just initiated, splitting the volume apart. High densityof microfractures with large slips are expected to develop close to this surface. As the simula-tion progresses, branches are observed to occur from the curved damage zone to the boundary ofthe REV.
Figure 10 shows plots of the overall von Mises stress versus overall volumetric strain. The vonMises stress � is a scalar measure of deviatoric stress that can be obtained from the equation
Copyright © 2015 John Wiley & Sons, Ltd. Int. J. Numer. Anal. Meth. Geomech. 2015; 39:1165–1187DOI: 10.1002/nag

PORE-SCALE MECHANISMS IN CRYSTALLINE ROCKS 1179
Figure 10. Combined shearing and extension: overall von Mises stress versus overall volumetric straincurves for the representative elementary volume. AES, assumed enhanced strain.
� D
r.�1 � �2/2 C .�2 � �3/2 C .�1 � �3/2
2; (12)
where �1, �2, and �3 are the three principal Cauchy stresses. The overall volumetric strain �vol, onthe other hand, is obtained by taking the sum of the three principal strains, that is,
�vol D �1 C �2 C �3 : (13)
In this example, a deviatoric measure of stress (i.e., the von Mises stress) can be paired with avolumetric measure of strain because of the combined shearing–extension deformation imposed onthe REV.
Figure 10 suggests that the behavior of the REV is elastic prior to the initiation point, as can beobserved from the linear stress–strain response up to a von Mises stress value of around 20 MPa.Once plastic slip initiates, the curve deviates from a straight line. Crystal plasticity produces a moreductile response. The slope of the stress–strain curve decreases as more slip systems activate, thusputting a cap on the value of the von Mises stress, but there is no softening observed. The AESsimulation, on the other hand, produces a more brittle response. The simulation generates slip suchthat the shear stress on the microfracture can only be as high as the frictional resistance generatedfrom the normal compressive stress. However, when a microfracture splits in opening mode, nofrictional resistance can develop. Numerous hexahedral elements experience a splitting mode asa result of the imposed volumetric expansion, thus creating intermittent softening response of theREV. Figure 10 also plots the results of simulations combining crystal plasticity and microfracturing.In this simulation, crystal plasticity is allowed to develop up to a certain critical norm of plasticstrain, after which microfracturing ensues and assumes the geometry and slip direction of the lastactivated slip system. In this simulation, the critical norm of plastic strain used is 0.1%, resulting ina stress–strain response that is intermediate between the fully ductile and fully brittle responses.
4.2. Combined compression–lateral extension
For the second loading condition, we carry out simulations resembling a biaxial compression setting.The displacements (in nm) are incremented linearly with each time step according to the relation
8<:�ux�uy�u´
9=; D
8<:
0:02x
0:02y
�0:10´
9=; nm ; (14)
Copyright © 2015 John Wiley & Sons, Ltd. Int. J. Numer. Anal. Meth. Geomech. 2015; 39:1165–1187DOI: 10.1002/nag
1180 M. TJIOE AND R. I. BORJA
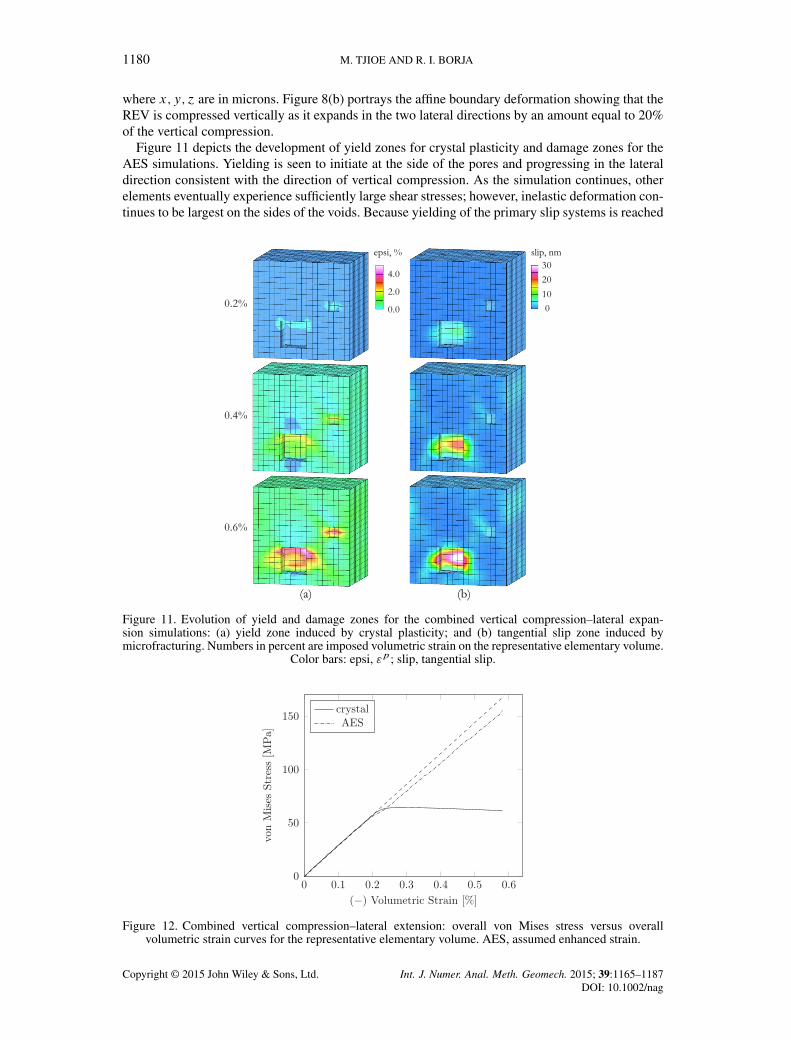
where x; y; ´ are in microns. Figure 8(b) portrays the affine boundary deformation showing that theREV is compressed vertically as it expands in the two lateral directions by an amount equal to 20%of the vertical compression.
Figure 11 depicts the development of yield zones for crystal plasticity and damage zones for theAES simulations. Yielding is seen to initiate at the side of the pores and progressing in the lateraldirection consistent with the direction of vertical compression. As the simulation continues, otherelements eventually experience sufficiently large shear stresses; however, inelastic deformation con-tinues to be largest on the sides of the voids. Because yielding of the primary slip systems is reached
Figure 11. Evolution of yield and damage zones for the combined vertical compression–lateral expan-sion simulations: (a) yield zone induced by crystal plasticity; and (b) tangential slip zone induced bymicrofracturing. Numbers in percent are imposed volumetric strain on the representative elementary volume.
Color bars: epsi, "p; slip, tangential slip.
Figure 12. Combined vertical compression–lateral extension: overall von Mises stress versus overallvolumetric strain curves for the representative elementary volume. AES, assumed enhanced strain.
Copyright © 2015 John Wiley & Sons, Ltd. Int. J. Numer. Anal. Meth. Geomech. 2015; 39:1165–1187DOI: 10.1002/nag
PORE-SCALE MECHANISMS IN CRYSTALLINE ROCKS 1181
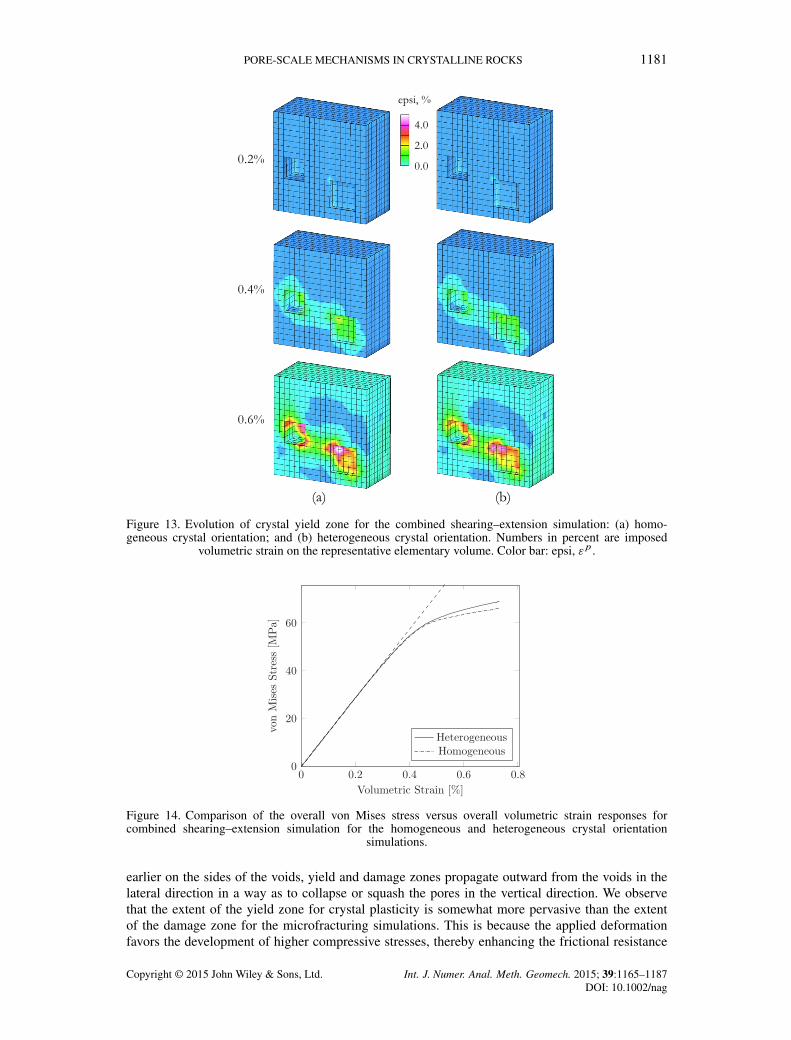
Figure 13. Evolution of crystal yield zone for the combined shearing–extension simulation: (a) homo-geneous crystal orientation; and (b) heterogeneous crystal orientation. Numbers in percent are imposed
volumetric strain on the representative elementary volume. Color bar: epsi, "p .
Figure 14. Comparison of the overall von Mises stress versus overall volumetric strain responses forcombined shearing–extension simulation for the homogeneous and heterogeneous crystal orientation
simulations.
earlier on the sides of the voids, yield and damage zones propagate outward from the voids in thelateral direction in a way as to collapse or squash the pores in the vertical direction. We observethat the extent of the yield zone for crystal plasticity is somewhat more pervasive than the extentof the damage zone for the microfracturing simulations. This is because the applied deformationfavors the development of higher compressive stresses, thereby enhancing the frictional resistance
Copyright © 2015 John Wiley & Sons, Ltd. Int. J. Numer. Anal. Meth. Geomech. 2015; 39:1165–1187DOI: 10.1002/nag

1182 M. TJIOE AND R. I. BORJA
Figure 15. Evolution of tangential microslip for the combined shearing–extension simulation: (a) homo-geneous crystal orientation; and (b) heterogeneous crystal orientation. Numbers in percent are imposed
volumetric strain on the representative elementary volume.
of the rock. This is a stark contrast to the previous example where the development of microcrackswas enhanced by the volume expansion.
Figure 12 compares the overall stress–strain curves for the two micromechanisms of deforma-tion. Plastic slip initiates at a volumetric strain of approximately 0.16%. Beyond this point, the twocurves begin to diverge. For crystal plasticity, the yield strength is dictated by the activated slipsystems so that as more slip systems activate, the von Mises stress eventually reaches a plateau.However, in the AES simulations, the primary slip system transforms into a frictional interface sothat hardening ensues as the normal stress increases. Because the REV experiences a net volumedecrease, larger normal stresses develop on the slip surfaces, causing an increase in the frictionalresistance of the elements. In most of the elements that localized, the increase in normal stresses hasallowed a build-up of shear stresses on the slip surfaces to the point where these interfaces eventuallystopped slipping.
4.3. Impact of crystal orientation
It has long been recognized that crystal orientation can impact the overall stress–strain responses ofcrystalline materials [83]. To look into this aspect further, we repeat the simulations of Section 4.1 byremoving the heterogeneity in crystal orientation and comparing the resulting stress–strain responsesof the REV with those generated from the simulations with two crystal groups. For purposes ofcomparison, the term ‘homogeneous’ in the context of this section pertains to a porous crystallinesolid with uniform Euler angles of D D 0ı; the term ‘heterogeneous’ pertains to the REV withthe two crystal groups defined in Table II. The pore distributions are identical for the homogeneousand heterogeneous simulations.
Copyright © 2015 John Wiley & Sons, Ltd. Int. J. Numer. Anal. Meth. Geomech. 2015; 39:1165–1187DOI: 10.1002/nag

PORE-SCALE MECHANISMS IN CRYSTALLINE ROCKS 1183
Figure 16. Evolution of normal microseparation for the combined shearing–extension simulation: (a) homo-geneous crystal orientation; and (b) heterogeneous crystal orientation. Numbers in percent are imposed
volumetric strain on the representative elementary volume.
Figure 17. Comparison of the overall von Mises stress versus overall volumetric strain responses forcombined compression–lateral extension simulation for the homogeneous and heterogeneous crystal
orientation simulations.
Figure 13 compares the plastic yield zones generated by the homogeneous and heteroge-neous crystal orientation simulations for the same imposed boundary displacements considered inSection 4.1, that is, combined shearing–extension. The general pattern of yielding is nearly thesame, although minor differences can be spotted upon closer examination. These differences trans-late to the next level into a different stress–strain plot. Figure 14 shows the ductile stress–strain
Copyright © 2015 John Wiley & Sons, Ltd. Int. J. Numer. Anal. Meth. Geomech. 2015; 39:1165–1187DOI: 10.1002/nag
1184 M. TJIOE AND R. I. BORJA
responses for the two simulations suggesting that the heterogeneous crystal orientation produces astiffer response. Of course, this is not always true, as noted in [32, 65], inasmuch as the mechanicalresponse of a crystal is known to depend on the direction of loading relative to the crystal orienta-tion. In other words, for the same loading direction, a given crystal orientation could make it eithereasier or harder for the system to slip.
We repeat the simulations, this time using the AES approach to assess how the heterogeneity incrystal orientation could impact the brittle response of a porous material. Figures 15 and 16 showthe evolution of tangential and normal microslip zones, respectively. Although the general patternof damage remains fairly similar for either case, the level of damage, measured in terms of themagnitude of tangential and normal slips, is substantially different. More specifically, the zones ofmost intense tangential slip and most intense normal separation are not the same, implying a morenoticeable impact of crystal orientation on the brittle mode of deformation at the pore scale. Noticein both the tangential and normal separation contours, for example, that the most intense damageis no longer around the periphery of the larger void when the crystal orientation is assumed tobe uniform.
Figure 17 compares the two brittle stress–strain responses, suggesting a softer response for theREV with a uniform crystal orientation. This difference in the responses is not as predictableas the much smoother stress–strain responses resulting from classic crystal plasticity simulations(Figure 14). Because of the ‘noise’ generated by sudden slip weakening when each element isenhanced, the AES approach produces an erratic overall stress–strain response for the REV. It islikely that the higher von Mises stress observed with the heterogeneous crystal orientation simula-tion is due to obstruction of slip by other grains in the neighborhood of the element that developed amicrofracture. However, as noted earlier, the response of a crystal depends on the direction of loadrelative to the crystal orientation, and so, it is possible that for a different imposed load, an oppositetrend could ensue that is different from that shown in Figure 17.
5. CONCLUSIONS
We have considered two dominant micromechanisms of deformation in porous rocks, namely, crys-tal plasticity and microfracturing. Both micromechanisms initiate around the pores and propagateaway from the pores in a way that depends strongly on the degree of brittleness of the material andthe spatial distribution of the pores. The more brittle the material, the greater is the extent of dam-age from tensile loading. The pore-scale modeling conducted in this paper is a mechanistic way ofunderstanding the smaller-scale processes responsible for the nucleation of macroscopic fracturesand for explaining the origin of the fracture toughness of a given porous material.
For the combined shearing–extension simulations, we find that microfracturing produces a softerresponse than crystal plasticity. This is because the tensile stress that develops normal to the fractureplane necessitates the shear stress to be zero on that plane. Therefore, a stress drop is observed in theoverall stress–strain curve. This is not the case with crystal plasticity, however, because the amountof shear stress in each crystallographic plane is bounded by the yield stress, and does not drop to zeroeven when slip systems activate. For quasi-brittle materials, it is expected that the micromechanismsof deformation will involve both ductile and brittle responses, with one type of response conceiv-ably triggering the other. The overall stress–strain behavior is expected to be different when porescollapse and through-going fractures form. In general, these larger-scale processes will necessitatemodeling beyond the range of the REV. Research along this line is underway.
ACKNOWLEDGEMENTS
This material is based upon work supported by the U.S. Department of Energy, Office of Science,Office of Basic Energy Sciences, Geosciences Research Program, under Award Number DE-FG02-03ER15454. The first author is grateful for a Stanford Graduate Fellowship and a John A. BlumeFellowship that provided partial support for his PhD studies at Stanford.
Copyright © 2015 John Wiley & Sons, Ltd. Int. J. Numer. Anal. Meth. Geomech. 2015; 39:1165–1187DOI: 10.1002/nag
PORE-SCALE MECHANISMS IN CRYSTALLINE ROCKS 1185
REFERENCES
1. Abousleiman YN, Hoang SK, Liu C. Anisotropic porothermoelastic solution and hydro-thermal effects on fracturewidth in hydraulic fracturing. International Journal for Numerical and Analytical Methods in Geomechanics 2014;38:493–597.
2. Arson C, Pereira JM. Influence of damage on pore size distribution and permeability of rocks. International Journalfor Numerical and Analytical Methods in Geomechanics 2013; 37:810–831.
3. Catalano E, Chareyre B, Barthélémy E. Pore-scale modeling of fluid-particles interaction and emergingporomechanical effects. International Journal for Numerical and Analytical Methods in Geomechanics 2014;38:51–71.
4. Foster CD, Nejad TM. Embedded discontinuity finite element modeling of fluid flow in fractured porous media. ActaGeotechnica 2013; 8:49–57.
5. Fu P, Johnson SM, Carrigan C. An explicitly coupled hydro-geomechanical model for simulating hydraulic fracturingin arbitrary discrete fracture networks. International Journal for Numerical and Analytical Methods in Geomechanics2013; 37:2278–2300.
6. Ganzer L, Reitenbach V, Pudlo D, Albrecht D, Singhe AT, Awemo KN, Wienand J, Gaupp R. Experimental andnumerical investigations on CO2 injection and enhanced gas recovery effects in Altmark gas field (Central Germany).Acta Geotechnica 2014; 9:39–47.
7. Gatuingt F, Snozzi L, Molinari JF. Numerical determination of the tensile response and the dissipated fracture energyof concrete: role of the mesostructure and influence of the loading rate. International Journal for Numerical andAnalytical Methods in Geomechanics 2013; 37:3112–3130.
8. Giwelli AA, Matsuki K, Sakaguchi K, Kizaki A. Effects of non-uniform traction and specimen height in the directshear test on stress and deformation in a rock fracture. International Journal for Numerical and Analytical Methodsin Geomechanics 37, 2278–2300 2013; 37:2186–2204.
9. Gou Y, Hou Z, Liu H, Zhou L, Were P. Numerical simulation of carbon dioxide injection for enhanced gas recovery(CO2-EGR) in Altmark natural gas field. Acta Geotechnica 2014; 9:49–58.
10. Huang K, Zhang Z, Ghassemi A. Modeling three-dimensional hydraulic fracture propagation using virtual multi-dimensional internal bonds. International Journal for Numerical and Analytical Methods in Geomechanics 2013;37:2021–2038.
11. Jourdain X, Colliat JB, De Sa C, Benboudjema F, Gatuingt F. Upscaling permeability for fractured concrete:meso?macro numerical approach coupled to strong discontinuities. International Journal for Numerical andAnalytical Methods in Geomechanics 2014; 38:536–550.
12. Katsuki D, Gutierrez M, Almrabat A. Stress-dependent elastic wave velocity of microfractured sandstone. Interna-tional Journal for Numerical and Analytical Methods in Geomechanics 2014; 38:441–456.
13. Lamb AR, Gorman GJ, Elsworth D. A fracture mapping and extended finite element scheme for coupled defor-mation and fluid flow in fractured porous media. International Journal for Numerical and Analytical Methods inGeomechanics 2013; 37:2916–2936.
14. Li L, Meng Q, Wang S, Li G, Tang C. A numerical investigation of the hydraulic fracturing behaviour of conglomeratein Glutenite formation. Acta Geotechnica 2013; 8:597–618.
15. Sarris E, Papanastasiou P. Numerical modeling of fluid-driven fractures in cohesive poroelastoplastic continuum.International Journal for Numerical and Analytical Methods in Geomechanics 2013; 37:1822–1846.
16. Vallin V, Pereira JM, Fabbri A, Wong H. Numerical modelling of the hydro-chemo-mechanical behaviour of geoma-terials in the context of CO2 injection. International Journal for Numerical and Analytical Methods in Geomechanics2013; 37:3052–3069.
17. Vu M, Pouya A, Seyedi DM. Theoretical and numerical study of the steady-state flow through finite fractured porousmedia. International Journal for Numerical and Analytical Methods in Geomechanics 2013; 37:221–235.
18. Vu M, Pouya A, Seyedi DM. Modelling of steady-state fluid flow in 3D fractured isotropic porous media: applicationto effective permeability calculation. International Journal for Numerical and Analytical Methods in Geomechanics2013b; 37:2257–2277.
19. Xu T, Xu Q, Tang C, Ranjith PG. The evolution of rock failure with discontinuities due to shear creep. ActaGeotechnica 2013; 8:567–581.
20. Schöpfer MPJ, Childs C, Manzocchi T. Three-dimensional failure envelopes and the brittle-ductile transition. Journalof Geophysical Research: Solid Earth 2013; 118:1378–1392.
21. Byerlee JD. Brittle-ductile transition in rocks. Journal of Geophysical Research 1968; 73:4741–4750.22. Mogi K. Pressure dependence of rock strength and transition from brittle fracture to ductile flow. Bulletin Earthquake
Research Institute Tokyo University 1966; 44:215–232.23. Baud P, Schubnel A, Wong TF. Dilatancy, compaction and failure mode in Solnhofen limestone. Journal of
Geophysical Research 2000; 195:19289–19303.24. Hirth G, Tullis J. The effects of pressure and porosity on the micromechanics of the brittle-ductile transition in
quartzite. Journal of Geophysical Research 1989; 94:17825–17838.25. Zhang J, Wong TF, Davis DM. Micromechanics of pressure-induced grain crushing in porous rocks. Journal of
Geophysical Research 1990; 95:341–352.26. Vajdova V, Zhu W, Chen TMN, Wong TF. Micromechanics of brittle faulting and cataclastic flow in Tavel limestone.
Journal of Structural Geology 2010; 32:1158–1169.
Copyright © 2015 John Wiley & Sons, Ltd. Int. J. Numer. Anal. Meth. Geomech. 2015; 39:1165–1187DOI: 10.1002/nag
1186 M. TJIOE AND R. I. BORJA
27. Vajdova V, Baud P, Wu L, Wong TF. Micromechanics of inelastic compaction in two allochemical limestones.Journal of Structural Geology 2012; 43:100–117.
28. Li X, Hai-Sui Y, Li XS. A virtual experiment technique on the elementary behaviour of granular materials withdiscrete element method. International Journal for Numerical and Analytical Methods in Geomechanics 2013;37:75–96.
29. Wang B, Chen Y, Wong TF. A discrete element model for the development of compaction localization in granularrock. Journal of Geophysical Research 2008; 113:B03202.
30. Wang J, Yan H. On the role of particle breakage in the shear failure behavior of granular soils by DEM. InternationalJournal for Numerical and Analytical Methods in Geomechanics 2013; 37:832–854.
31. Grujovic N, Divac D, Zivkovic M, Slavkovic R, Milivojevic N, Milivojevic V, Rakic D. An inelastic stress integrationalgorithm for a rock mass containing sets of discontinuities. Acta Geotechnica 2013; 8:265–278.
32. Borja RI, Wren JR. Discrete micromechanics of elastoplastic crystals. International Journal for Numerical Methodsin Engineering 1993; 36:3815–3840.
33. Borja RI, Rahmani H. Computational aspects of elasto-plastic deformation in polycrystalline solids. Journal ofApplied Mechanics 2012; 79(031024). DOI: 10.1115/1.4005898.
34. Armero F, Garikipati K. An analysis of strong discontinuities in multiplicative finite strain plasticity and their relationwith the numerical simulation of strain localization in solids. International Journal of Solids and Structures 1996;33:2863–2885.
35. Borja RI, Regueiro RA. Strain localization of frictional materials exhibiting displacement jumps. Computer Methodsin Applied Mechanics and Engineering 2001; 190:2555–2580.
36. Foster CD, Borja RI, Regueiro RA. Embedded strong discontinuity finite elements for fractured geomaterials withvariable friction. International Journal for Numerical Methods in Engineering 2007; 72:549–581.
37. Linder C, Armero F. Finite elements with embedded strong discontinuities for the modeling of failure in solids.International Journal for Numerical Methods in Engineering 2007; 72:1391–1433.
38. Linder C, Rosato D, Miehe C. New finite elements with embedded strong discontinuities for the modeling of failurein electromechanical coupled solids. Computer Methods in Applied Mechanics and Engineering 2011; 200:141–161.
39. Linder C, Raina A. A strong discontinuity approach on multiple levels to model solids at failure. Computer Methodsin Applied Mechanics and Engineering 2013; 253:558–583.
40. Mosler J, Meschke G. 3D modeling of strong discontinuities in elastoplastic solids: fixed and rotating localizationformulations. International Journal for Numerical Methods in Engineering 2013; 5:1553–1576.
41. Oliver X, Huespe AE. Continuum approach to material failure in strong discontinuity settings. Computer Methods inApplied Mechanics and Engineering 2004; 193:3195–3220.
42. Simo JC, Oliver J. A new approach to the analysis and simulation of strain softening in solids. In Fracture andDamage in Quasibrittle Structures, ZP Bažant et al. (ed.). E&FN Spon: London, 1994; 25–39.
43. Price NJ, Cosgrove JW. Analysis of Geological Structures. Cambridge University Press: New York, 1990.44. Baeta RD, Ashbee KHG. Mechanical deformation of quartz. Philosophical Magazine 1970; 22:601–635.45. McLaren AC, Retchford JA. Transmission electron microscope study of the dislocations in plastically deformed
synthetic quartz. Physica Status Solidi(a) 1969; 33:657–658.46. Barber DJ, Wenk HR. Deformation twinning in calcite, dolomite, and other rhombohedral carbonates. Physics and
Chemistry of Minerals 1979; 5:141–165.47. Ferrill DA, Morris AP, Evans MA, Burkhard M, Groshong, RH, Jr, Onasch CM. Calcite twin morphology: a low-
temperature deformation geothermometer. Journal of Structural Geology 2004; 26:1521–1529.48. Mowar S, Zaman M, Stearns DW, Roegiers JC. Micro-mechanisms of pore collapse in limestone. Journal of
Petroleum Science and Engineering 1996; 15:221–235.49. Pouya A. Micro-macro approach for the rock salt behaviour. European Journal of Mechanics - A/Solids 2000;
19:1015–1028.50. Borja RI. Plasticity Modeling and Computation. Springer-Verlag: Berlin, Heidelberg, 2013.51. Bishop JFW, Hill R. A theory of the plastic distortion of a polycrystal aggregate under combined stress. Philosophical
Magazine 1951; 42:414–427.52. Bishop JFW, Hill R. A theoretical derivation of the plastic properties of polycrystalline face-centered metal.
Philosophical Magazine 1951; 42:1298–1307.53. Budiansky B, Wu TT. Theoretical prediction of plastic strains of polycrystals. In Proceedings of the Fourth US
National Congress on Applied Mechanics, Rosenberg RM (ed.). ASME: New York, 1962; 1175–1185.54. Hutchinson JW. Elastic-plastic behavior of polycrystalline metals and composites. Proceedings of the Royal Society
of London A 1970; 319:247–272.55. Anand L, Kothari M. A computational procedure for rate-independent crystal plasticity. Journal of the Mechanics
and Physics of Solids 1996; 44:525–558.56. Miehe C, Schröder J. A comparative study of stress update algorithms for rate-independent and rate-dependent crystal
plasticity. International Journal for Numerical Methods in Engineering 2001; 50:273–298.57. Schröder J, Miehe C. Aspects of computational rate-independent crystal plasticity. Computational Materials Science
1997; 9:168–176.58. Izadbakhsh A, Inal K, Mishra RK. Crystal plasticity based finite element modelling of large strain deformation in
AM30 magnesium alloy. Modelling Sand Simulation in Materials Science and Engineering 2012; 20(035016). DOI:10.1088/0965-0393/20/3/035016.
Copyright © 2015 John Wiley & Sons, Ltd. Int. J. Numer. Anal. Meth. Geomech. 2015; 39:1165–1187DOI: 10.1002/nag

PORE-SCALE MECHANISMS IN CRYSTALLINE ROCKS 1187
59. Ortiz M, Repetto EA, Stainier L. A theory of subgrain dislocation structures. Journal of the Mechanics and Physicsof Solids 2000; 48:2077–2114.
60. Steinmann P, Stein E. On the numerical treatment and analysis of finite deformation ductile single crystal plasticity.Computer Methods in Applied Mechanics and Engineering 1996; 129:235–254.
61. Nemat-Nasser S, Obata M. Rate-dependent finite elastic-plastic deformation of polycrystals. Proceedings of theRoyal Society of London A 1986; 407:343–375.
62. Pan J, Rice JR. Rate sensitivity of plastic flow and implications for yield surface vertices. International Journal ofSolids and Structures 1983; 19:973–987.
63. Dumoulin S, Hopperstad OS, Berstad T. Investigation of integration algorithms for rate-dependent crystal plasticityusing explicit finite element codes. Computational Materials Science 2009; 46:785–799.
64. Ling X, Horstemeyer MF, Potirniche GP. On the numerical implementation of 3D rate-dependent single crystalplasticity formulations. International Journal for Numerical Methods in Engineering 2005; 63:548–568.
65. Borja RI, Rahmani H. Discrete micromechanics of elastoplastic crystals in the finite deformation range. ComputerMethods in Applied Mechanics and Engineering 2014; 275:234–263.
66. Fossen H. Structural Geology Cambridge University Press. New York 2010:205–207.67. Koiter WT. Stress-strain relations, uniqueness and variational theorems for elastic-plastic materials with a singular
yield surface. Quarterly Applied Mathematics 1957; 11:350–354.68. Chambon R, Caillerie D, Viggiani G. Loss of uniqueness and bifurcation vs instability: some remarks. Failure,
Degradation and Instabilities 2004:517–535.69. Linder C, Zhang X. A marching cubes based failure surface propagation concept for three-dimensional finite elements
with non-planar embedded strong discontinuities of higher-order kinematics. International Journal for NumericalMethods in Engineering 2013; 96:339–372.
70. Linder C, Zhang X. Three-dimensional finite elements with embedded strong discontinuities to model failure inelectromechanical coupled materials. Computer Methods in Applied Mechanics and Engineering 2014; 273:143–160.
71. Borja RI. Bifurcation of elastoplastic solids to shear band mode at finite strain. Computer Methods in AppliedMechanics and Engineering 2002; 191:5287–5314.
72. Mohammadnejad T, Khoei AR. Hydro-mechanical modeling of cohesive crack propagation in multiphase porousmedia using the extended finite element method. International Journal for Numerical and Analytical Methods inGeomechanics 2013; 37:1241–1279.
73. Belytschko T, Black T. Elastic crack growth in finite elements with minimal remeshing. International Journal forNumerical Methods in Engineering 1999; 45:601–620.
74. Borja RI. Assumed enhanced strain and the extended finite element methods: a unification of concepts. ComputerMethods in Applied Mechanics and Engineering 2008; 197:2789–2803.
75. Hughes TJR. The Finite Element Method. Prentice-Hall: New Jersey, 1987.76. Duriez J, Darve F, Donzé F-V. Incrementally non-linear plasticity applied to rock joint modeling. International
Journal for Numerical and Analytical Methods in Geomechanics 2013; 37:453–477.77. Liu F, Borja RI. Extended finite element framework for fault rupture dynamics including bulk plasticity. International
Journal for Numerical and Analytical Methods in Geomechanics 2013; 37:3087–3111.78. Ball A, Payne BW. The tensile fracture of quartz crystals. Journal of Materials Science 1976; 11:731–740.79. Doukhan JC, Henry JP, Paquet J. Microstructure and brittle behavior of fine grain calcite (micrite). Journal of
Materials Science 1976; 11:1884–1892.80. Vermeer PA, de Borst R. Non-associated plasticity for soils, concrete and rock. Heron 1984; 29:1–64.81. Oates JAH. Lime and Limestone: Chemistry and Technology, Production and Uses. Wiley-VCH: Weinheim,
Germany, 1998.82. He Z, Caratini G, Dormieux L, Kondo D. Homogenization of anisotropic elastoplastic behaviors of a porous poly-
crystal with interface effects. International Journal for Numerical and Analytical Methods in Geomechanics 2013;37:3213–3236.
83. Schmid E, Boas W. Plasticity of Crystals with Special Reference to Metals, Translation from: Kristallplastizität mitbesonderer Berücksichtigung der Metalle. F.A, Hughes & Co.: London, 1935.
Copyright © 2015 John Wiley & Sons, Ltd. Int. J. Numer. Anal. Meth. Geomech. 2015; 39:1165–1187DOI: 10.1002/nag