on the origin of the hierarchy of color names
TRANSCRIPT

On the origin of the hierarchy of color namesVittorio Loretoa,b, Animesh Mukherjeeb,c, and Francesca Triab,1
aDipartimento di Fisica, Sapienza Universita’ di Roma, Piazzale Aldo Moro 5, 00185 Rome, Italy; bInstitute for Scientific Interchange, Viale Settimio Severo65, 10133 Turin, Italy; and cDepartment of Computer Science and Engineering, Indian Institute of Technology, Kharagpur 721302, India
Edited by Giorgio Parisi, University of Rome, Rome, Italy, and approved February 16, 2012 (received for review August 14, 2011)
One of the fundamental problems in cognitive science is howhumans categorize the visible color spectrum. The empirical evi-dence of the existence of universal or recurrent patterns in colornaming across cultures is paralleled by the observation that colornames begin to be used by individual cultures in a relatively fixedorder. The origin of this hierarchy is largely unexplained. Herewe resort to multiagent simulations, where a population of indivi-duals, subject to a simple perceptual constraint shared by all hu-mans, namely the human Just Noticeable Difference, categorizesand names colors through a purely cultural negotiation in the formof language games. We found that the time needed for a popula-tion to reach consensus on a color name depends on the regionof the visible color spectrum. If color spectrum regions are rankedaccording to this criterion, a hierarchy with [red, (magenta)-red],[violet], [green/yellow], [blue], [orange], and [cyan], appearing inthis order, is recovered, featuring an excellent quantitative agree-ment with the empirical observations of the WCS. Our resultsdemonstrate a clear possible route to the emergence of hierarch-ical color categories, confirming that the theoretical modeling inthis area has now attained the required maturity to make signifi-cant contributions to the ongoing debates concerning languageuniversals.
color hierarchy ∣ complex systems ∣ computational cognitive science ∣statistical physics ∣ category game
Color naming represents a paradigmatic problem in cognitivescience and linguistics (1–3) due to the unique complex inter-
play between perception, conceptualization, and language itfeatures. In addition, color naming constitutes an outstandingexample of the long “nature versus nurture” debate in cognitivescience, namely whether color names are pure arbitrary linguisticconventions (4) (i.e., nurture) or they are coded in some innatehuman feature (i.e., nature) (5). Color naming patterns exhibitstructural regularities across cultures (6–8). Extensive studies in-volving basic color names have been performed in the past thatreveal interesting properties such as the nonrandom distributionof color terms (9) and an optimal partition of the color space bythese terms (10). The data gathered in the World Color Survey(WCS) (11), extending the pioneering work by Berlin and Kay(6), provided evidence for the existence of universals in colorcategorization. Since then, a long line of research (9, 12–16) con-firmed the existence of such universals, although the scientific de-bate is still wide open (17, 18). Recently (19), it has been pointedout how the observed recurrent patterns in language organizationcould be explained as stable engineering solutions reflectingcultural and historical factors (15) as well as the constraints ofhuman cognition. Along this same line, recent findings (16)suggest how a pure cultural negotiation process, with a slight non-language specific bias, can account for the observed regularitiesacross different populations.
One of the most crucial observations related to the universalityof color naming is the existence of basic color names across lan-guages (6). These basic color names are identified (not withoutambiguities) as being monolexemic, highly frequent, and agreedupon by speakers of the same language. A surprising experimen-tal finding about color names is the existence of a hierarchy ofbasic color names which began to be used by individual cultures
in a relatively fixed order (6). According to this observation, basiccolor names can be organized into a coherent hierarchy aroundthe universal focal colors black, white, red, green, yellow, andblue always appearing in this specific order across cultures. Themeaning of this implicational hierarchy is as follows: If a popula-tion has a name for red, it also has a name for black and white(but not vice versa), if it has a name for green, it also has a namefor red (but not vice versa), and so on. It should be remarked thatthe terms black and white appear in this hierarchy with a meaningclose to the general panchromatic English terms dark and light ordull and brilliant rather than equivalent to the specific achromaticterms black and white (we refer to the SI Text for a more detaileddiscussion of the empirical observations). The origin of the ob-served hierarchy is largely unexplained and the aim of this paperis that of providing a first coherent and quantitative explanationof this phenomenon.
Color categorization has been used as a reference problem incomputational studies on symbol grounding where one investi-gates how a population of interacting individuals can developa shared repertoire of categories from scratch (12). It has beenrecently shown how a pure cultural negotiation dynamics, in theform of repeated language games (20–22) called the CategoryGame (CG) (15), can lead to the coevolution of a shared reper-toire of categories and their linguistic labels. The CG considers asimplified representation of the color space consisting in a reduc-tion of the true three-dimensional space to the one-dimensionalhue color wheel, neglecting in this way the saturation and bright-ness dimensions. This abstraction is common in literature (13, 14,23–25) where often a discrete division of the hue dimension hasbeen adopted to represent the visual space. The novelty intro-duced by the CG consists in the introduction of a truly continuousperceptual space (e.g., the visible light spectrum) with no prede-fined category structure. Remarkably, even while the perceptualspace is a continuum (as in colors), the emergent number oflinguistic labels is finite and small (15), as observed in naturallanguages. In addition, though the reduction to the hue colorwheel seems a very crude assumption, it should be remarked thatindividuals simulated in the CG, and endowed with the humanJust Noticeable Difference (JND) function (27, 28), are ableto bootstrap a color categorization whose statistical propertiesturn out to be in very good quantitative agreement with thoseobserved in the WCS data (16). The JND function describes thevariability of the resolution power of human vision with the fre-quency of incident light (Fig. 1). It is remarkable how a weak non-language specific bias common to all human beings, such as thehuman JND, can lead to a qualitative and, most strikingly, quan-titative agreement with the experimental findings of the WCS.Finally the CG features a dynamical behavior characterized bythe persistence of long-lasting metastable states (26). This obser-vation formalizes the intuition that languages change thanks to,
Author contributions: V.L., A.M., and F.T. designed research, performed research,contributed new reagents/analytic tools, analyzed data, and wrote the paper.
The authors declare no conflict of interest.
This article is a PNAS Direct Submission.1To whom correspondence should be addressed. E-mail: [email protected].
This article contains supporting information online at www.pnas.org/lookup/suppl/doi:10.1073/pnas.1113347109/-/DCSupplemental.
www.pnas.org/cgi/doi/10.1073/pnas.1113347109 PNAS Early Edition ∣ 1 of 6
PSYC
HOLO
GICALAND
COGNITIVESC
IENCE
SAPP
LIED
PHYS
ICAL
SCIENCE
S

and notwithstanding, their being the outcome of a collective be-havior.
The central result of this paper is that a clear hierarchy forcolor names is found to naturally emerge, in the framework of theCG (15), through purely cultural negotiations among a popula-tion of coevolving agents, each endowed with the human JNDfunction (27, 28). In particular, a hierarchy emerges that ranksdifferent color names with respect to the time needed for themto get fixed in a population. Those names on which the popula-tion reaches a faster agreement turn out to be the basic colornames, and the order of their emergence reflects the hierarchyfound in ref. 6. This finding immediately provides a cultural de-finition of the basic color names with a degree of explicitness thathas not been achieved so far.
The Hierarchical Category GameThe CG (15) (see Methods) describes the emergence of a hier-archical category structure made of two distinct levels: a basiclayer, responsible for the fine discrimination of the environment(perceptual categories), and a shared linguistic layer that groupstogether perceptions to guarantee communicative success (linguis-tic categories). In the version presented here, the CG is furtherextended to allow for the emergence of a series of shared linguisticlayers each of which could guarantee communicative success inprogressively more complex tasks.
At each time step, a pair of individuals (one will be denoted asthe speaker and the other as the hearer) is randomly selectedfrom the population to play a language game. The speaker has tocommunicate about a scene composed of, say, two objects. Heselects one of these, denoted as the topic, and decides to speakabout it. The ensuing language game allows both players to coe-volve the structure of their categories as well as their form-mean-ing inventories. Although the number of perceptual categories istuned by a parameter of the model that encodes the JND (seeMethods) and can be arbitrarily large, the number of linguisticcategories, in all the emergent layers, turns out to be finite andsmall, as observed in case of color names for natural languages. Ahigher and a more refined linguistic layer is accessed by theagents only if, in a game, both the topic and the object have thesame name. This homonymy generates a “confusion” in differen-tiating between the two, possibly resulting in a failure in commu-nication, also referred to as “failure with name” (see Methods).Note that access to a higher level requires a high consensus in the
adjacent lower level because a significant alignment among theagents is necessary to cause a failure with name. Whereas the firstlayer of linguistic categories (also reported in refs. 15, 16, and 26)can be associated to the emergence of primary color names, thesuccessive layers might be linked to the emergence of complexcolor names when the knowledge of the primary color namesis not enough to achieve a reasonable communicative success(one can think of a linguistic community comprising specializedindividuals, as for instance painters, textile and cosmetic manu-facturers; ref. 29).
DynamicsLet us start our analysis by monitoring the time evolution of thenumber of linguistic categories at the different levels of the hier-archy. Fig. 2 A and B report the average number of perceptualand linguistic categories (at different levels) in the populationwhen the model is informed respectively with the average humanJND (d̄min ¼ 0.0143) and the actual human JND function [i.e.,dminðxÞ as shown in Fig. 1]. For the linguistic categories, tworegimes are clearly identified in all the different levels. Initially,corresponding to a series of uncorrelated games, the averagenumber of linguistic categories per individual (nling) exhibits arapid growth due to the pressure of discrimination (for a detaileddescription of CG, we refer to Methods), followed by a fast dropdue to the onset of consensus and the merging of perceptualcategories. A second regime eventually emerges in all the levels,characterized by a quasi-arrested dynamics. This slow dynamicsis signaled by a “plateau” region, as also observed earlier forlevel 0 in ref. 26. Interestingly, when the human JND functionis adopted, one observes the possibility of the emergence of athird level, although still in its transient phase even after a billiongames per player (level 2 in Fig. 2B), whereas there is no suchsignal with a flat JND. This observation implies that, for an aver-age JND, individuals need just two levels to express a category,for the actual JND, individuals need further levels to achievecommunicative success. It turns out, in fact, that further levelsare typically needed for small values of dmin (i.e., higher resolu-
Fig. 1. The JND function. The wavelength change in a monochromaticstimulus needed to elicit a particular JND in the hue space. For the purposeof the CG, dminðxÞ and topic, respectively, refers to the JND and the mono-chromatic stimulus rescaled within the ½0; 1Þ interval. The blue circles repre-sent the centers of seven regions (to be used later in the article) that can betogether expressed as a vector c with entries c1; c2;…; c7. The specific valuesfor these entries are c ¼ ½0.0301; 0.125; 0.250; 0.465; 0.66015; 0.925; 0.970�.Each entry, in turn, respectively corresponds to a wavelength (nanometer)that can be written (approximately) as [445, 475, 500, 545, 585, 635, 645].
102
103
104
105
106
107
108
t/N
16
32
64
128
Cat
egor
ies
nperc
nling , Level 0
nling , Level 1
102
103
104
105
106
107
108
t/N
16
64
256
Cat
egor
ies
nperc
nling , Level 0
nling , Level 1
nling , Level 2
102
103
104
105
106
107
t/N
0
0.2
0.4
0.6
0.8
1
Mat
ch
Level 0Level 1
102
103
104
105
106
107
t/N
0
0.2
0.4
0.6
0.8
1
Mat
ch
Level 0Level 1
A B
DC
Fig. 2. Emergence of the category structure. (A) The average number of per-ceptual categories as well as the average number of linguistic categories atdifferent levels versus the number of games per player t∕N (where t indicatesthe number of games and N the population size) when JND is set to d̄min.(B) The average number of perceptual categories as well as the average num-ber of linguistic categories at different levels versus t∕N when JND is set todminðxÞ. (C) The evolution of the averagematch in the population at differentlevels when JND is set to d̄min. The average match (see Methods for details) isa measure of the global alignment of the linguistic categories in the wholepopulation. (D) The evolution of the average match in the population atdifferent levels when JND is set to dminðxÞ. Here N ¼ 500 and the results re-present an average over 30 simulation runs.
2 of 6 ∣ www.pnas.org/cgi/doi/10.1073/pnas.1113347109 Loreto et al.

tion power) and the actual JND features large regions below itsaverage value (see SI Text for further discussion on this issue). Inorder to quantify the level of alignment of the linguistic categoriesacross the population, we monitor (Fig. 2 C and D) the emer-gence of the average pairwise match (see Methods) as a functionof time (expressed as games per player) for the different levels.Again we repeated the experiment with the average human JND(d̄min ¼ 0.0143) and the actual human JND function [i.e.,dminðxÞ]. Remarkably, the extent of agreement among the agents(as measured by the match) exceeds 95% in level 0 and 80%in level 1. Note that these results are consistent across differentpopulation sizes as shown in the SI Text.
It is important to remark that the timescales associated withthe CG dynamics represent the times of persistence of a particu-lar category in the population. The emergent asymptotic categor-ization corresponds to a metastable state where global changesare always possible, though progressively less likely as the systemages, which is typically synthesized by saying that the responseproperties of the system depend on its age (26). This perspectiveallows us to reconcile the evidence that languages do continu-ously change still remaining stable enough to be intelligible acrossa population.
Finally, a possible way to relate the different levels of thecategory structure to the process of human learning could be asfollows. “Level 0” typically refers to the early stages of learningwhere a linguistic community attempts to agree upon a set of(basic) color terms needed for successful communication. How-ever, as time goes by, the community would naturally feel theneed of communicating through more complex color terms (e.g.,color of a lipstick or a garment or a car). In the initial stages ofthis phase the community shall almost surely encounter difficul-ties in discriminating and communicating about close shades ornuances of color in a scene (analogous to failure with name);however, a second level of agreement could soon emerge withinthe community, when most of the language speakers are able toresolve and correctly associate higher order color terms to thevarious objects of the scene and this, in turn, is equivalent to“level 1” in the CG framework.
Hierarchy of Fixation TimesWe now focus on the frequency of access to higher levels of lin-guistic categorization as a function of the local value of the JND.To this end, we report in Fig. 3 a scatter plot of the logarithm ofthe time (again expressed as games per player) at which theagents need to access level 1 versus the value of the topic in thatparticular game. The result clearly demonstrates that the agents
need to access the higher level early in regions corresponding tohigh values of dminðxÞ, whereas they access it quite late in regionscorresponding to low values of dminðxÞ. This observation indicatesthat an agreement at level 0 is reached faster in regions with highvalues of dminðxÞ, resulting in more cases of failure with name inthese regions, thereby, forcing the agents to access level 1.
In order to further verify the above observation, we computethe extent of the emergent agreement (i.e., match) at differentregions of the perceptual space in level 0. In Fig. 1, the blue cir-cles indicate the centers ci of seven such regions (i.e., the points ofinflection in the JND function) that we choose to calculate the so-called “regional” agreement. We define a region by the lengthspanning ½ci − dminðciÞ; ci þ dminðciÞ� where dminðciÞ is the y valuecorresponding to the x value ci (see Fig. 1). In Fig. 4 A and B, werespectively show, for N ¼ 500 and 700, the regional agreementfor these seven regions at level 0 (also see the SI Text). The plotsclearly signal that consensus emerges first in regions correspond-ing to high values of dmin (e.g., regions 6 and 7) whereas it occurslater in regions corresponding to very low dmin (e.g., regions 3and 5). Most strikingly, if the regions are arranged according tothe time (i.e., t∕N) to reach a desired level of consensus (say amatch value of 0.1), then they get organized into a hierarchy(Fig. 4 C and D) with [red, (magenta)-red], [violet], [green/yellow], [blue], [orange], and [cyan] (or [cyan] and [orange] asis usually observed for secondary basic color names) appearingin this order. This result is strikingly similar to that reported inref. 6. Further, the data points for the fixation times are observedto obey a simple functional form, Ae−αt, where A and α are non-zero positive constants (gray lines in Fig. 4 C and D). In otherwords, the fixation time for specific primary colors at the popula-tion level diverges logarithmically with the resolution power1∕dmin. Though this specific prediction cannot be checked withthe currently available data, it is reminiscent of the logarithmlaw which is typically associated to human perception. Error barsin Fig. 4 C and D, representing the intrinsic variability of fixation
Fig. 3. Activity for different topics. Scatter plot of the logarithm of the time(expressed as games per player) at which the agents need to access level 1versus the value of the topic in that particular game. The points are coloredin a way that they best represent the corresponding region of the visiblespectrum. The human JND function [i.e., dminðxÞ versus the topic value]and the visible spectrum are given as references. HereN ¼ 500 and the resultsrepresent an average over 30 simulation runs.
102
103
104
105
106
t/N
0
0.2
0.4
0.6
0.8
1
Mat
ch
RedMagenta-RedVioletGreen/YellowBlueOrangeCyan
0 1 2 3 4 5t/N (x 1,000)
10-3
10-2
d min Red (645)
Magenta-Red (635)Violet (445)Green/Yellow (545)Blue (475)Orange (585)Cyan (500)
102
103
104
105
106
t/N
0
0.2
0.4
0.6
0.8
1
Mat
ch
RedMagenta-RedVioletGreen/YellowBlueCyanOrange
0 1 2 3 4 5 6 7t/N (x 1,000)
10-3
10-2
d min Red (645)
Magenta-Red (635)Violet (445)Green/Yellow (545)Blue (475)Cyan (500)Orange (585)
Match = 0.1
Match = 0.1
A
B D
C
Fig. 4. Agreement emergence. Emergence of the agreement in the popu-lation in level 0. Match for (A) N ¼ 500 and (B) N ¼ 700 in the seven regionsmarked in Fig. 1. For better visualization, each curve is plotted in a colorthat best represents the corresponding region in the hue space (see Fig. 1).The time (i.e., t∕N) for (C) N ¼ 500 and (D) N ¼ 700 to reach a desired con-sensus (match ¼ 0.1) versus the value of dmin corresponding to the sevenregions. The results present an average over 60 simulation runs. In boththe plots, the approximate wavelength (nanometer) associated with eachcolored data point is mentioned within the parenthesis. Error bars aredrawn according to the variance of the distribution of consensus times inthe different simulations. The gray lines in both the plots represent a fitof the respective data with an exponential function of the form Ae−αt
(see text for more details).
Loreto et al. PNAS Early Edition ∣ 3 of 6
PSYC
HOLO
GICALAND
COGNITIVESC
IENCE
SAPP
LIED
PHYS
ICAL
SCIENCE
S

times in different simulations, are important to explain the slightfluctuations in the color name hierarchy as observed in the WCSacross different cultures.
It is important to observe how the similarity of the rankingof fixation times obtained in the framework of the CG with thatobserved in the framework of the WCS is not the outcome of apure coincidence. It turns out that only a right choice of JNDfunction, coupled with the language game dynamics, can repro-duce the color hierarchy observed across human languages. In theSI Text, we report the outcomes of two additional experimentsperformed by substituting the human JND with a flat and aninverse JND. In none of these two cases the hierarchy obtainedfrom the WCS could be reproduced.
DiscussionThe two specific exceptions of the observed hierarchy from thatsuggested in ref. 6 are (i) emergence of violet in this hierarchywhich is absent in ref. 6 and (ii) absence of brown in this hierarchywhich appears immediately after blue in ref. 6. This discrepancycan be perhaps explained in the light of the past literature onbasic color names. According to Kay and McDaniel (30), both ofthese color names are secondary basics and can therefore beexpressed as fuzzy combinations of the six focal colors. In orderto understand the presence of violet in the hierarchy, one needsto concentrate on the second stage of the color lexicon evolutionsuggested by Berlin and Kay (6) that marks the emergence of red.The authors themselves note that at this point the name red alsoincludes the other end of the spectrum which is primarily violet.In fact, low-wavelength light (perceptually violet), although beingat the opposite end of the spectrum, is in many cases perceivedas reddish (31) and this is possibly why we see the emergence ofviolet just after red in the hierarchy (see also the SI Text for afurther experiment concerning “red” and “violet”). On the otherhand, brown is not a spectral color itself and usually refers to acombination of the high-wavelength hues: yellow, orange, or red.Therefore, the term brown can cover a wide range of the visiblespectrum mostly inclusive of the different shades of orange and,in particular, is frequently recognized as dark orange (32). Con-sequently, it may be well argued that the emergence of orange inthe hierarchy actually also marks the emergence of brown.
Further, we also note that no evident hierarchy is observed forthe linguistic categories at level 1 (see the SI Text). Because colornames associated to higher linguistic levels are intuitively asso-ciated to nonbasic color names, this observation implies that itis hard to arrange complex color names in a clear hierarchy asfor the basic color names.
Another important point that deserves mention here is that,although in the current work categorization is invariably asso-ciated with naming, nonverbal perceptual learning is equally pos-sible within a population and it has been extensively studied inrefs. 33–36. However, our intention here was to seek a suitableanswer to a long-standing chicken and egg problem in cognitivescience: To name a category, it seems that this category shouldbe already existing and be shared in the population, so how cannaming influence the shape of the emerging category structure?The CG is an attempt to show that coordination in a populationis possible through a purely structural coupling between the ca-tegorization and the naming processes. The emergent patternsallow us to conclude that this coupling is indeed possible and thatthere is at least some role that a language plays to give rise to thecoordination of the perceptually grounded categories. Thus, ourcontribution here is a plausible solution to the chicken and eggproblem through the introduction of a complex interplay betweennaming and category formation.
As a final observation, we remark that the sharpening ofperceived between-category differences and attenuation of per-ceived within-category differences also known as categorical per-ception (CP) (37, 38), and observed in the CG dynamics, could be
an innate property or an outcome of the process of languagelearning. In fact, there is a huge amount of literature in supportof either of these conjectures. The former position can be histori-cally connected to rationalism (39) and is often found either in anexplicit or an implicit way in evolutionary psychology (40–42).Specific to colors, refs. 43 and 44 have tried to seek evidencetoward a genetic coding of color categories by analyzing the colorcategorization behavior of newborn children. On the other hand,in support of the latter position, presence of learning has beendemonstrated through color tests with prelanguage children(45–47) and by means of experiments where individuals from aparticular culture were tasked to learn the color categories of an-other culture (18, 48). However, a majority of researchers agreethat even learning-based induction of CP is “loosely constrainedby the default neural organization,” as has been suggested inref. 18. The CG builds up on this last idea that the assumptionof a minimal neural/physiological substrate (nonspecific to lan-guage) coupled with a complex cultural interaction process canactually cause the emergence of categorization patterns in apopulation of agents. It is important to note here that it is notonly the neural substrate (i.e., JND) but also the complex dyna-mical process of learning of the agents that together lead tothe observed hierarchy. In other words, the strong positive cor-relation between the JND and the hierarchical structure is notstraightforward; in contrast, it is guided by a complex nonlinearchain of interactions.
ConclusionIn this paper, we have shown that a simple negotiation dynamics,driven by a weak nonlanguage specific bias, namely the frequencydependent resolution power of the human eye, is sufficient to guar-antee the emergence of the hierarchy of color names getting soarranged by the times needed for their fixation in a population.The observed hierarchy features an excellent quantitative agree-ment with the empirical observations, confirming that the theore-tical modeling in this area has now attained the required maturityto make significant contributions to the ongoing debates in cogni-tive science. Our approach suggests a possible route to the emer-gence of hierarchical color categories: The color spectrum clearlyexists at a physical level of wavelengths, humans tend to react mostsaliently to certain parts of this spectrum often selecting exemplarsfor them, and finally comes the process of linguistic color naming,which adheres to universal patterns resulting in a neat hierarchyof the form obtained here. These intuitions are of course not anovelty (see for instance ref. 19); however, we provided a theore-tical framework where the origin of the color hierarchy, as well asits quantitative structure, could be explained and reproducedthrough a purely cultural route driven, on its turn, by a nonlan-guage-specific property of human beings.
It should be remarked that, despite the striking universalcharacter of the color hierarchy, fluctuations exist across differentlanguages as for the precise order in which color names got fixedin each language. In the framework of our model, this phenom-enon is naturally explained as a consequence of the unavoidablestochasticity of the underlying cultural negotiation dynamics (15).The error bars in the fixation time of each specific color term inFig. 4 specifically support this picture. Finally, it is important tomention that our results are paving the way for a detailedcomparison with true historical data for each attested language,taking into account for instance phenomena like language contactand multilingualism as well as more language-specific culturalevolution processes.
MethodsThe Category Game. The CG (15) constitutes of a set of N artificial agents in asimulated population with no words or categories at all in the beginning. Asthe game proceeds, the agents are repeatedly tasked with describing differ-ent perceptual stimuli received from their environment (e.g., colors) to oneanother. While doing so, a single stimulus (corresponding to a real value in a
4 of 6 ∣ www.pnas.org/cgi/doi/10.1073/pnas.1113347109 Loreto et al.
continuous perceptual space, e.g., the visible light spectrum) is chosen from aset of multiple such stimuli (named objects) present in the environment and isdenoted as the topic to be described. Each game is played by a pair of agentswhere one of them acts as a speaker, trying to describe the topic by a name,while another acting as a hearer, trying to guess just by listening to the namewhich object the speaker is referring to. The individual agents independentlyinvent words and categories and, based on the success or failure of their com-munications, adjust their own categories and vocabularies to increase thesuccess in communication. A communication is deemed successful if the wordthe speaker used appeared in the hearer’s vocabulary and allowed the hearerto identify the object the speaker meant. Further, the agents are endowedwith a real property of human vision—i.e., the Just Noticeable Difference(Fig. 1)—by virtue of which they are not required to distinguish betweenthose hues that a human eye cannot tell apart. In the following, we presenta brief description of the important components of this model referring thereader to the Supporting Information for a more detailed description accom-panied by a suitable illustration of the individual steps of the game (see theSI Text).
Basic dynamics. The population consists of N artificial agents each of themhaving a one-dimensional continuous perceptual space spanning, withoutany loss of generality, the ½0; 1Þ interval. Categorization simply correspondsto the partitioning of this space into discrete subintervals, which we shall callperceptual categories from now onward. Starting from a blank slate, eachagent progressively develops a dynamical inventory of form-meaning asso-ciations linking categories (meanings) to words (forms). The emerging cate-gories as well as the words associated to them coevolve over time through aseries of simple communication interactions (or “games”).
Choice of individuals for a game. In a game, two individuals are randomly se-lected from the set of N agents. One of them acts as a speaker and the otheras a hearer. Both the speaker and the hearer are presented with a scene ofM ≥ 2* stimuli (objects), where each stimulus corresponds to a real number inthe ½0; 1Þ interval. By definition, no two stimuli appearing in the same scenecan be at a distance closer than dminðxÞ, where x can be either of the two. Thisfunction is the only parameter of the model encoding the finite resolutionpower of any perception or equivalently the human JND (Fig. 1).
Rules of negotiation. One of the objects is randomly denoted as the topic ofthe communication. This information is known only to the speaker. The taskof the speaker is to communicate this information to the hearer using thefollowing rule. The speaker always checks whether the perceptual category(i.e., the subinterval) in which the topic falls is unique for it. If the two stimulifall in the same single perceptual category, then a new boundary is created inthe perceptual space at a location corresponding to the middle of the seg-ment connecting the two stimuli creating two smaller subintervals. A newname is invented for each of these two new perceptual categories. In addi-tion, both of them inherit all the words corresponding to the old category.This process is termed as discrimination. Subsequently, the speaker utters the“most relevant” name for the category corresponding to the topic. The mostrelevant name is either the one used in a previous successful communicationor the newly invented name in case the category has just been created due toa discrimination. For the hearer, there can be the following possibilities:(i) the hearer does not have any category associated with the name, in whichcase the game is a failure, or (ii) more than one categories are associated withthis name in the hearer’s inventory. In this case, the hearer randomly choosesone of them. If the hearer chooses the category linked to the topic, the gameis a success, otherwise it is a failure.
Update of inventories. Depending on the outcome of the game, one or boththe agents update their repertoires. In case of a failure, the hearer adds theword in her repertoire linked to the category corresponding to the topic. Incase of a success, this word becomes the most relevant name for the categorycorresponding to the topic for both agents and they remove all the othercompeting words from their respective repertoires linked with this category.
Dynamical evolution. The dynamical evolution is initially driven by the pres-sure of discrimination, which makes the number of perceptual categories in-crease. At the same time, a synonymy emerges such that many differentwords are used by different agents for some similar categories. This kindof synonymy reaches a peak after which it starts to diminish as in the simple
Naming Game (22). When on average only one word is recognized by thewhole population for each perceptual category, a second phase of the evolu-tion intervenes. During this phase, words expand their reference acrossadjacent perceptual categories, joining these categories to form the so-calledlinguistic categories. The coarsening of these categories features a dynamicarrest analogous to the physical process in which supercooled liquidsapproach the glass transition (26). On this long-lived state, the number oflinguistic categories turns out to be finite and small (15).
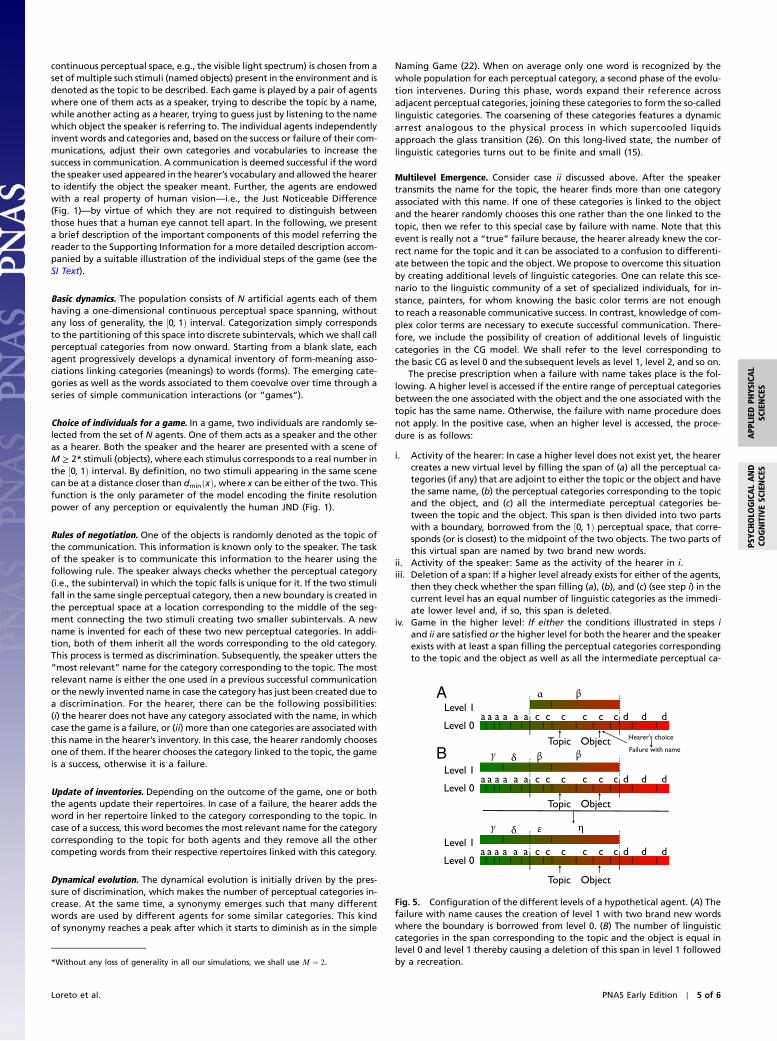
Multilevel Emergence. Consider case ii discussed above. After the speakertransmits the name for the topic, the hearer finds more than one categoryassociated with this name. If one of these categories is linked to the objectand the hearer randomly chooses this one rather than the one linked to thetopic, then we refer to this special case by failure with name. Note that thisevent is really not a “true” failure because, the hearer already knew the cor-rect name for the topic and it can be associated to a confusion to differenti-ate between the topic and the object. We propose to overcome this situationby creating additional levels of linguistic categories. One can relate this sce-nario to the linguistic community of a set of specialized individuals, for in-stance, painters, for whom knowing the basic color terms are not enoughto reach a reasonable communicative success. In contrast, knowledge of com-plex color terms are necessary to execute successful communication. There-fore, we include the possibility of creation of additional levels of linguisticcategories in the CG model. We shall refer to the level corresponding tothe basic CG as level 0 and the subsequent levels as level 1, level 2, and so on.
The precise prescription when a failure with name takes place is the fol-lowing. A higher level is accessed if the entire range of perceptual categoriesbetween the one associated with the object and the one associated with thetopic has the same name. Otherwise, the failure with name procedure doesnot apply. In the positive case, when an higher level is accessed, the proce-dure is as follows:
i. Activity of the hearer: In case a higher level does not exist yet, the hearercreates a new virtual level by filling the span of (a) all the perceptual ca-tegories (if any) that are adjoint to either the topic or the object and havethe same name, (b) the perceptual categories corresponding to the topicand the object, and (c) all the intermediate perceptual categories be-tween the topic and the object. This span is then divided into two partswith a boundary, borrowed from the ½0; 1Þ perceptual space, that corre-sponds (or is closest) to the midpoint of the two objects. The two parts ofthis virtual span are named by two brand new words.
ii. Activity of the speaker: Same as the activity of the hearer in i.iii. Deletion of a span: If a higher level already exists for either of the agents,
then they check whether the span filling (a), (b), and (c) (see step i) in thecurrent level has an equal number of linguistic categories as the immedi-ate lower level and, if so, this span is deleted.
iv. Game in the higher level: If either the conditions illustrated in steps iand ii are satisfied or the higher level for both the hearer and the speakerexists with at least a span filling the perceptual categories correspondingto the topic and the object as well as all the intermediate perceptual ca-
A
B
Fig. 5. Configuration of the different levels of a hypothetical agent. (A) Thefailure with name causes the creation of level 1 with two brand new wordswhere the boundary is borrowed from level 0. (B) The number of linguisticcategories in the span corresponding to the topic and the object is equal inlevel 0 and level 1 thereby causing a deletion of this span in level 1 followedby a recreation.*Without any loss of generality in all our simulations, we shall use M ¼ 2.
Loreto et al. PNAS Early Edition ∣ 5 of 6
PSYC
HOLO
GICALAND
COGNITIVESC
IENCE
SAPP
LIED
PHYS
ICAL
SCIENCE
S
tegories between the topic and the object, then the speaker transmits themost relevant name corresponding to the topic, selecting this name nowfrom the higher level inventory, and the game in this level continues fol-lowing exactly the rules of the basic CG. At the end of the game, in case ofa failure with name in this level, steps i–iv are repeated to create an evenhigher level.
In Fig. 5 A and B, we illustrate one representative example of the processof creation and deletion of spans in the higher level.
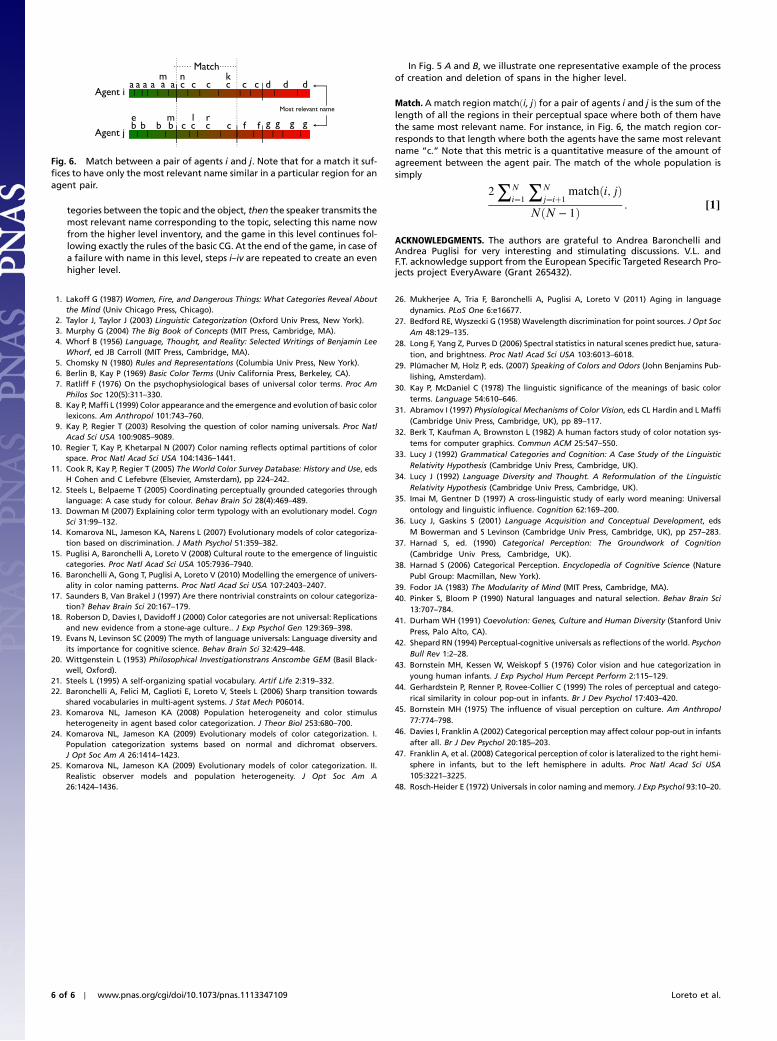
Match. A match region matchði; jÞ for a pair of agents i and j is the sum of thelength of all the regions in their perceptual space where both of them havethe same most relevant name. For instance, in Fig. 6, the match region cor-responds to that length where both the agents have the same most relevantname “c.” Note that this metric is a quantitative measure of the amount ofagreement between the agent pair. The match of the whole population issimply
2∑N
i¼1 ∑N
j¼iþ1matchði; jÞ
NðN − 1Þ : [1]
ACKNOWLEDGMENTS. The authors are grateful to Andrea Baronchelli andAndrea Puglisi for very interesting and stimulating discussions. V.L. andF.T. acknowledge support from the European Specific Targeted Research Pro-jects project EveryAware (Grant 265432).
1. Lakoff G (1987) Women, Fire, and Dangerous Things: What Categories Reveal Aboutthe Mind (Univ Chicago Press, Chicago).
2. Taylor J, Taylor J (2003) Linguistic Categorization (Oxford Univ Press, New York).3. Murphy G (2004) The Big Book of Concepts (MIT Press, Cambridge, MA).4. Whorf B (1956) Language, Thought, and Reality: Selected Writings of Benjamin Lee
Whorf, ed JB Carroll (MIT Press, Cambridge, MA).5. Chomsky N (1980) Rules and Representations (Columbia Univ Press, New York).6. Berlin B, Kay P (1969) Basic Color Terms (Univ California Press, Berkeley, CA).7. Ratliff F (1976) On the psychophysiological bases of universal color terms. Proc Am
Philos Soc 120(5):311–330.8. Kay P, Maffi L (1999) Color appearance and the emergence and evolution of basic color
lexicons. Am Anthropol 101:743–760.9. Kay P, Regier T (2003) Resolving the question of color naming universals. Proc Natl
Acad Sci USA 100:9085–9089.10. Regier T, Kay P, Khetarpal N (2007) Color naming reflects optimal partitions of color
space. Proc Natl Acad Sci USA 104:1436–1441.11. Cook R, Kay P, Regier T (2005) The World Color Survey Database: History and Use, eds
H Cohen and C Lefebvre (Elsevier, Amsterdam), pp 224–242.12. Steels L, Belpaeme T (2005) Coordinating perceptually grounded categories through
language: A case study for colour. Behav Brain Sci 28(4):469–489.13. Dowman M (2007) Explaining color term typology with an evolutionary model. Cogn
Sci 31:99–132.14. Komarova NL, Jameson KA, Narens L (2007) Evolutionary models of color categoriza-
tion based on discrimination. J Math Psychol 51:359–382.15. Puglisi A, Baronchelli A, Loreto V (2008) Cultural route to the emergence of linguistic
categories. Proc Natl Acad Sci USA 105:7936–7940.16. Baronchelli A, Gong T, Puglisi A, Loreto V (2010) Modelling the emergence of univers-
ality in color naming patterns. Proc Natl Acad Sci USA 107:2403–2407.17. Saunders B, Van Brakel J (1997) Are there nontrivial constraints on colour categoriza-
tion? Behav Brain Sci 20:167–179.18. Roberson D, Davies I, Davidoff J (2000) Color categories are not universal: Replications
and new evidence from a stone-age culture.. J Exp Psychol Gen 129:369–398.19. Evans N, Levinson SC (2009) The myth of language universals: Language diversity and
its importance for cognitive science. Behav Brain Sci 32:429–448.20. Wittgenstein L (1953) Philosophical Investigationstrans Anscombe GEM (Basil Black-
well, Oxford).21. Steels L (1995) A self-organizing spatial vocabulary. Artif Life 2:319–332.22. Baronchelli A, Felici M, Caglioti E, Loreto V, Steels L (2006) Sharp transition towards
shared vocabularies in multi-agent systems. J Stat Mech P06014.23. Komarova NL, Jameson KA (2008) Population heterogeneity and color stimulus
heterogeneity in agent based color categorization. J Theor Biol 253:680–700.24. Komarova NL, Jameson KA (2009) Evolutionary models of color categorization. I.
Population categorization systems based on normal and dichromat observers.J Opt Soc Am A 26:1414–1423.
25. Komarova NL, Jameson KA (2009) Evolutionary models of color categorization. II.Realistic observer models and population heterogeneity. J Opt Soc Am A26:1424–1436.
26. Mukherjee A, Tria F, Baronchelli A, Puglisi A, Loreto V (2011) Aging in languagedynamics. PLoS One 6:e16677.
27. Bedford RE, Wyszecki G (1958) Wavelength discrimination for point sources. J Opt SocAm 48:129–135.
28. Long F, Yang Z, Purves D (2006) Spectral statistics in natural scenes predict hue, satura-tion, and brightness. Proc Natl Acad Sci USA 103:6013–6018.
29. Plümacher M, Holz P, eds. (2007) Speaking of Colors and Odors (John Benjamins Pub-lishing, Amsterdam).
30. Kay P, McDaniel C (1978) The linguistic significance of the meanings of basic colorterms. Language 54:610–646.
31. Abramov I (1997) Physiological Mechanisms of Color Vision, eds CL Hardin and L Maffi(Cambridge Univ Press, Cambridge, UK), pp 89–117.
32. Berk T, Kaufman A, Brownston L (1982) A human factors study of color notation sys-tems for computer graphics. Commun ACM 25:547–550.
33. Lucy J (1992) Grammatical Categories and Cognition: A Case Study of the LinguisticRelativity Hypothesis (Cambridge Univ Press, Cambridge, UK).
34. Lucy J (1992) Language Diversity and Thought. A Reformulation of the LinguisticRelativity Hypothesis (Cambridge Univ Press, Cambridge, UK).
35. Imai M, Gentner D (1997) A cross-linguistic study of early word meaning: Universalontology and linguistic influence. Cognition 62:169–200.
36. Lucy J, Gaskins S (2001) Language Acquisition and Conceptual Development, edsM Bowerman and S Levinson (Cambridge Univ Press, Cambridge, UK), pp 257–283.
37. Harnad S, ed. (1990) Categorical Perception: The Groundwork of Cognition(Cambridge Univ Press, Cambridge, UK).
38. Harnad S (2006) Categorical Perception. Encyclopedia of Cognitive Science (NaturePubl Group: Macmillan, New York).
39. Fodor JA (1983) The Modularity of Mind (MIT Press, Cambridge, MA).40. Pinker S, Bloom P (1990) Natural languages and natural selection. Behav Brain Sci
13:707–784.41. Durham WH (1991) Coevolution: Genes, Culture and Human Diversity (Stanford Univ
Press, Palo Alto, CA).42. Shepard RN (1994) Perceptual-cognitive universals as reflections of the world. Psychon
Bull Rev 1:2–28.43. Bornstein MH, Kessen W, Weiskopf S (1976) Color vision and hue categorization in
young human infants. J Exp Psychol Hum Percept Perform 2:115–129.44. Gerhardstein P, Renner P, Rovee-Collier C (1999) The roles of perceptual and catego-
rical similarity in colour pop-out in infants. Br J Dev Psychol 17:403–420.45. Bornstein MH (1975) The influence of visual perception on culture. Am Anthropol
77:774–798.46. Davies I, Franklin A (2002) Categorical perception may affect colour pop-out in infants
after all. Br J Dev Psychol 20:185–203.47. Franklin A, et al. (2008) Categorical perception of color is lateralized to the right hemi-
sphere in infants, but to the left hemisphere in adults. Proc Natl Acad Sci USA105:3221–3225.
48. Rosch-Heider E (1972) Universals in color naming and memory. J Exp Psychol 93:10–20.
Fig. 6. Match between a pair of agents i and j. Note that for a match it suf-fices to have only the most relevant name similar in a particular region for anagent pair.
6 of 6 ∣ www.pnas.org/cgi/doi/10.1073/pnas.1113347109 Loreto et al.

Supporting InformationLoreto et al. 10.1073/pnas.1113347109Experimental Hierarchy of Color NamesBerlin and Kay’s classic study (1) on typological properties of col-or vocabularies established the universal presence of a specialsubset of color names which they called the “basic color names.”These are the most salient and frequently used color words acrossthe majority of the world’s languages. They represent the follow-ing 11 English color names: black, white, red, green, yellow, blue,brown, orange, purple, pink, and gray. Berlin and Kay found thatthese names have prototype properties, which means that there isusually one name that best represents a color, whereas other col-ors that are progressively more dissimilar with this color becomeless good examples for the name. They also found that the num-ber of basic color names range from 2 to 11 across the world’slanguages, of course with exceptions like Russian and Hungarianwhich have 12 basic names. A third and a totally unexpected find-ing by them is that if a language encodes fewer than 11 names,then there are strict limitations on which names it may encode.The typological regularities observed by them can be summarizedby the following implicational hierarchy
white
black
" #< red½ �<
green
yellow
" #< blue½ �< brown½ �<
purple
pink
orange
gray
266664
377775;
where for distinct color names a and b, the expression a < b sig-nifies that a is present in every language where b is present butnot vice versa. Based on the above observation, the authorsfurther theorize that as languages evolve they acquire the newbasic color names in a fixed chronological sequence of the form
Stage I: dark-cool and light-warm.Stage II: red (including all shades of violet).Stage III: either green or yellow.Stage IV: both green and yellow.Stage V: blue.Stage VI: brown.Stage VII: purple, pink, orange, or gray.We stress how stage I of ref. 1 is not referring to the emergence
of the two achromatic colors “black” and “white,” rather it refersto a division of the perceptual space that has nothing to do withthe chromatic properties of light, being based exclusively on thelight intensity. Ratliff writes (2) that the well-known studies ofDani color terms by Heider-Rosch and Olivier (3) “put the ques-tion of psychophysiological bases of the two color terms of stage Iinto better perspective. These terms appear to be panchromatic,more or less equivalent to the general panchromatic Englishterms dark and light or dull and brilliant rather than equivalentto the specific achromatic terms black and white. Although theDani color terms do include chromatic colors, and do have attri-butes of coolness and warmth, the division between them appearsto be based mainly on brightness.”
It is also important to mention here that six languages studiedby Berlin and Kay do not conform to the above presented hier-archy. In some cases this deviation is because there is no basiccolor name that can be consistently identified with certain partsof the visible spectrum. For instance, as has been noted by Dow-man (4), the Kuku-Yalanji (Australia) language has no consistentname for green. Whereas some speakers identify either just greenor both green and blue with kayal, most of them do not use thisname at all for green. Moreover, it should be noted that certainother languages studied by Berlin and Kay appear in a transition
between the evolutionary stages because some speakers (espe-cially younger speakers) are found to use more color names thanthe others (see ref. 4 and the references therein). In the CategoryGame (CG) framework that we propose here, these deviationsfrom the hierarchy can be naturally attributed to the inherent sto-chasticity of the underlying cultural dynamics and the fluctuationsin the fixation times of the color names in the form of error bars(see Fig. 4 C and D of the main text) confirm this picture. At thesame time, this framework is able to spell out the major charac-teristics of this hierarchy (in terms of the mean fixation times ofthe color names) in a remarkable way. In summary, both the uni-versal trends in color naming as well as the possible exceptions tothis universality is explained in this framework.
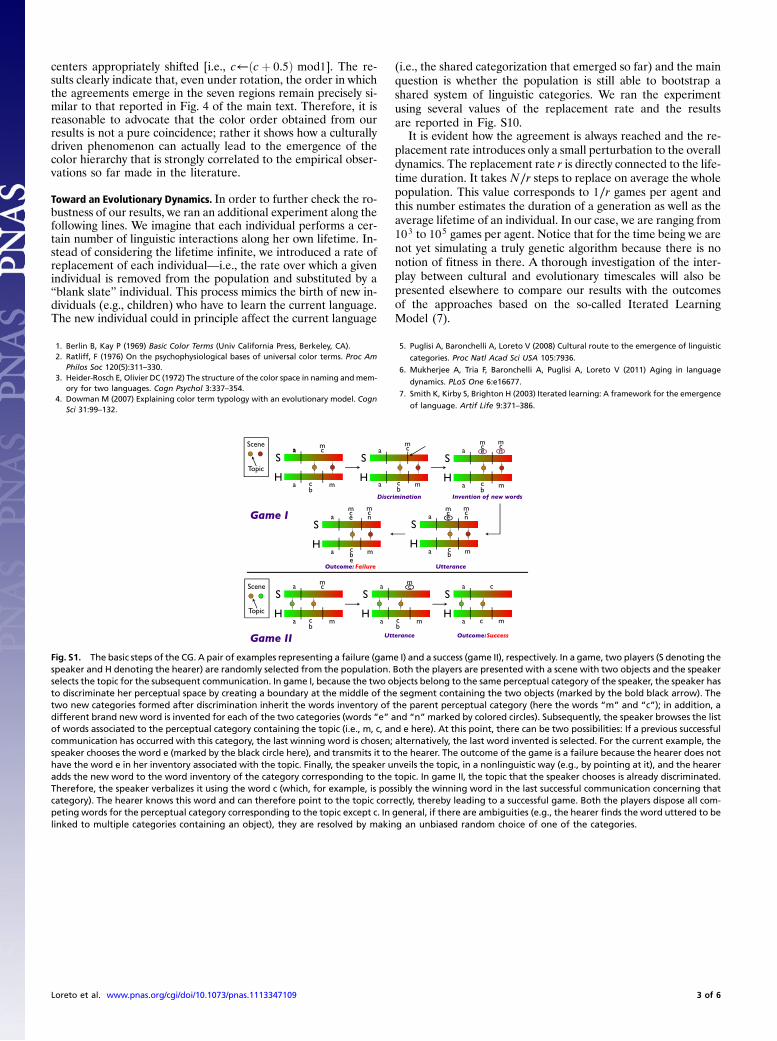
The Category Game model. The basic purpose of the CG model (5)is to examine how a population of interacting individuals candevelop, through a series of language games, a shared form-meaning repertoire from scratch and without any preexistingcategorization. The model involves a set of N artificial agentscommitted to the task of categorizing a single analogical percep-tual channel (e.g., the hue dimension of the color spectrum), eachstimulus being represented as a real-valued number ranging inthe interval ½0; 1Þ. We identify categorization as a partition ofthe ½0; 1Þ interval (representing the perceptual channel of theagents) into discrete subintervals which are denoted as perceptualcategories. Each individual has a dynamical inventory of form-meaning associations linking perceptual categories (meanings)to words (forms), denoting their linguistic counterpart. The per-ceptual categories as well as the words associated to them coe-volve dynamically through a sequence of elementary communica-tion interactions, usually referred to as games. All the players areinitialized with only the trivial ½0; 1Þ perceptual category that hasno name associated to it. In each step, a pair of individuals (oneplaying as speaker and the other as hearer) is randomly selectedfrom the population and presented with a new “scene”—i.e., a setof M ≥ 2 objects (stimuli) where each object is a real number inthe ½0; 1Þ interval. (For simplicity and without any loss of general-ity we assume M ¼ 2.) The speaker discriminates the scene andnames one object (i.e., the topic) and the hearer tries to guess thetopic from the name. A correct guess results in a successful com-munication. Based on the outcomes of the game, the two indivi-duals update their category boundaries and the inventory of theassociated words. A detailed description of the game is providedin Fig. S1.
The perceptive resolution power of the individuals limits theirability to distinguish between the objects in the scene that are tooclose to each other in the perceptual space. In order to take thisfactor into account, no two stimuli appearing in the same scenecan be at a distance closer than dminðxÞ where x can be either ofthe two. This function, usually termed the Just Noticeable Differ-ence (JND), encodes the finite resolution power of human visionby virtue of which the artificial agents are not required to distin-guish between those categories that a human eye cannot differ-entiate (see Fig. 1 in the main text).
Dynamical Properties of the Multilevel Emergence. Evolution of thecategory structure. In the CG dynamics, one can identify two dif-ferent phases. In the first phase, the number of perceptual cate-gories increases due to the pressure of discrimination, and at thesame time many different words are used by different agents fornaming similar perceptual categories. This kind of synonymy isfound to reach a peak and then suddenly drop, as shown in refs. 5
Loreto et al. www.pnas.org/cgi/doi/10.1073/pnas.1113347109 1 of 6

and 6. Subsequently, a second phase begins when most of the per-ceptual categories are associated with only one word (6). At thispoint, words are found to expand their dominion across adjacentperceptual categories. Therefore, sets of contiguous perceptualcategories sharing the same words are formed at the different ex-isting levels, giving raise to a single linguistic category (Fig. S2 Aand B). Consequently, an important outcome is the emergence ofa hierarchical category structure made of a basic layer, responsi-ble for fine discrimination of the environment, and shared linguis-tic layers that groups together perceptions at the different levelsto guarantee communicative success. Remarkably, the number oflinguistic categories in the second phase turns out to be finite andsmall for all the different levels with a very high agreement amongthe agents in the population (Fig. S2 C and D).
Dependence of the levels on dmin. In the multilevel CG, the emer-gence of a higher level is strongly tied to the value of dmin chosen.If dmin is high (see Fig. S3A), then a third level (level 2) neveremerges as a separate entity; in contrast, it mimics the lower level.However, if dmin is low, then a third level is also found to emerge(see Fig. S3B) although still in its transient phase after a billiongames per player. This observation can be intuitively explained:When dmin is low, two objects at the same distance in the ½0; 1Þinterval more likely belong to different perceptual categories. Be-cause the number of linguistic categories does not depend on dmin(which is one of the main results of the CG), the probability ofhaving a “failure with name” and hence of the emergence of mul-tiple levels increases when decreasing dmin. Low dmin allows thenfor a much “fine-grained” categorization of the perceptual space,which is typically the case with specialized linguistic communities(e.g., painters). On the other hand, the timescales for the emer-gence of linguistic categories, at any level of categorization, in-crease while decreasing dmin, which explains why regions ofthe color spectrum corresponding to high dmin are the first tobe named with high consensus in the population.
Fraction of games in the higher level.Here we measure the fractionof games that are being played at level 1 when JND is set to d̄minas well as dminðxÞ (Fig. S4A). Note that the fraction of gamesbeing played in the higher level is proportional to the value ofJND chosen [dminðxÞ can take up much lower values than its aver-age value d̄min]. This result is simply an outcome of the fact that incase of low values of dmin the number of choices for the topic andthe object is much larger, which in turn increases the chances offailure with name eventually resulting in more games beingplayed in the higher level.
Fig. S4B illustrates the number of games played over time slid-ing windows in level 1 in the seven individual regions (see Fig. 1 ofthe main text) expressed as a fraction of the total number ofgames played in these regions in level 1 over the same time win-dow. Once again a clear ordering emerges at the onset of the dy-namics which is in agreement with the results presented in themain text: This fraction is least in the regions correspondingto low dmin (i.e., regions 4 and 6).
Extension. We define extension as the portion of the ½0; 1Þ spacethat already has at least one name in a particular level. Note thatby definition the extension of level 0 is always 1. Fig. S5 A and Breports the average extension in the population versus t∕N whenJND is set to d̄min and dminðxÞ, respectively. Both the results in-dicate that the level 1 is already completely created filling theentire ½0; 1Þ space as soon as t∕N > 104. However, in case wherea third level emerges, it only shows up after roughly a milliongames per player.
Regional agreement.Here we present additional results indicatingthe emergence of the regional agreement besides that already
reported in the main text (Fig. 4 of the main text). In Fig. S6Awe plot the average match in level 0 for the seven differentregions, this time the length of the region being ½ci − d̄min; ciþd̄min�: The length of all seven regions in this case is the sameand therefore independent of dminðxÞ (unlike Fig. 4 of the maintext). One observes even for fixed-length regions a time orderingof the emergent agreement that is fully consistent with the resultpresented in Fig. 4 of the main text. Therefore, it is reasonable toconclude that this effect is independent of the length of the re-gions chosen and is completely determined by the centers (andthe corresponding dmin) of these regions.
Fig. S6B illustrates how the success rate emerges in these sevenfixed-length regions. Note that if the agents are successful in anyof the levels, then the outcome of the game is assumed to be asuccess. Success rate is the fraction of successful games over timesliding windows. This quantity is an alternative measure of theagreement among the agents (more successful games result froma larger agreement) and reflects a very similar time ordering asobserved in Fig. S6A. Fig. S6C shows how the success rateemerges in the seven variable-length regions defined in the maintext for Fig. 4. Once again, a similar time ordering discussed in allthe previous results is observed.
Finally, in Fig. S6D, we plot the emergent match at level 1 inthe seven variable-length regions. Although a high agreement isreached for all the regions, no clear time ordering that could becorrelated to the corresponding dmin is found to emerge, implyingthat it is hard to arrange complex color names in a clear hierar-chy, unlike the basic color names.
Control Experiments. In this section, we show that the similarity ofthe color order obtained from our results to that from the WorldColor Survey (WCS) in not a pure coincidence. As a final checkfor the robustness of our results we perform the following controlexperiments. We consider, in particular, two null situations wherewe endow the agents with: (i) a flat JND (i.e., d̄min ¼ 0.0143),which is the average value of the human JND (as it is projectedon the ½0; 1Þ interval) and (ii) the (properly rescaled) inverse ofthe JND function (Fig. S7).
In both cases, the outcomes of the dynamical evolution have tobe compared with that obtained using the actual human JNDfunction [i.e., dminðxÞ]. Fig. S8 A and B reports the emergenceof agreement (in terms of match) and the fixing times, respec-tively, for the case of flat JND.
Fig. S8 C and D reports the emergence of agreement and thefixing times, respectively, for the case of inverse JND. Impor-tantly, here the fixing times are plotted against the wavelengthvalues of the light corresponding to the seven regions consideredin the main text. Note that, in none of these two cases the hier-archy obtained from the WCS is reproduced. In the case of flatJND, the fixing times for all the seven regions are roughly equal,whereas in the case of inverse JND, the fixing times are nearlyopposite to what we find in case of the actual JND. Thus, theoutcome reported in the manuscript is not a pure coincidenceand only a right choice of JND coupled on top of it with a com-plex dynamical process of nonlinear interactions can reproducethe color hierarchy observed across human languages.
Effects of Rotation of the Stimuli. In order to further establish therobustness of our results, we repeat our experiments, however,with the stimuli now rotated. In particular, the topic values(i.e., x) are given a shift such that x←ðxþ 0.5Þ mod1 (Fig. S9A). Note that this shift brings the regions corresponding to“red” and “violet” at the center and therefore close to each other,while placing regions corresponding to “orange” and “green” atthe two distant ends. For this experiment, the agents are endowedwith this rotated form of the JND function. Fig. S9B shows howthe agreement (i.e., match) emerges in the seven variable-lengthregions defined in the main text for Fig. 4, however, now with the
Loreto et al. www.pnas.org/cgi/doi/10.1073/pnas.1113347109 2 of 6
centers appropriately shifted [i.e., c←ðcþ 0.5Þ mod1]. The re-sults clearly indicate that, even under rotation, the order in whichthe agreements emerge in the seven regions remain precisely si-milar to that reported in Fig. 4 of the main text. Therefore, it isreasonable to advocate that the color order obtained from ourresults is not a pure coincidence; rather it shows how a culturallydriven phenomenon can actually lead to the emergence of thecolor hierarchy that is strongly correlated to the empirical obser-vations so far made in the literature.
Toward an Evolutionary Dynamics. In order to further check the ro-bustness of our results, we ran an additional experiment along thefollowing lines. We imagine that each individual performs a cer-tain number of linguistic interactions along her own lifetime. In-stead of considering the lifetime infinite, we introduced a rate ofreplacement of each individual—i.e., the rate over which a givenindividual is removed from the population and substituted by a“blank slate” individual. This process mimics the birth of new in-dividuals (e.g., children) who have to learn the current language.The new individual could in principle affect the current language
(i.e., the shared categorization that emerged so far) and the mainquestion is whether the population is still able to bootstrap ashared system of linguistic categories. We ran the experimentusing several values of the replacement rate and the resultsare reported in Fig. S10.
It is evident how the agreement is always reached and the re-placement rate introduces only a small perturbation to the overalldynamics. The replacement rate r is directly connected to the life-time duration. It takesN∕r steps to replace on average the wholepopulation. This value corresponds to 1∕r games per agent andthis number estimates the duration of a generation as well as theaverage lifetime of an individual. In our case, we are ranging from103 to 105 games per agent. Notice that for the time being we arenot yet simulating a truly genetic algorithm because there is nonotion of fitness in there. A thorough investigation of the inter-play between cultural and evolutionary timescales will also bepresented elsewhere to compare our results with the outcomesof the approaches based on the so-called Iterated LearningModel (7).
1. Berlin B, Kay P (1969) Basic Color Terms (Univ California Press, Berkeley, CA).2. Ratliff, F (1976) On the psychophysiological bases of universal color terms. Proc Am
Philos Soc 120(5):311–330.3. Heider-Rosch E, Olivier DC (1972) The structure of the color space in naming and mem-
ory for two languages. Cogn Psychol 3:337–354.4. Dowman M (2007) Explaining color term typology with an evolutionary model. Cogn
Sci 31:99–132.
5. Puglisi A, Baronchelli A, Loreto V (2008) Cultural route to the emergence of linguistic
categories. Proc Natl Acad Sci USA 105:7936.
6. Mukherjee A, Tria F, Baronchelli A, Puglisi A, Loreto V (2011) Aging in language
dynamics. PLoS One 6:e16677.
7. Smith K, Kirby S, Brighton H (2003) Iterated learning: A framework for the emergence
of language. Artif Life 9:371–386.
Fig. S1. The basic steps of the CG. A pair of examples representing a failure (game I) and a success (game II), respectively. In a game, two players (S denoting thespeaker and H denoting the hearer) are randomly selected from the population. Both the players are presented with a scene with two objects and the speakerselects the topic for the subsequent communication. In game I, because the two objects belong to the same perceptual category of the speaker, the speaker hasto discriminate her perceptual space by creating a boundary at the middle of the segment containing the two objects (marked by the bold black arrow). Thetwo new categories formed after discrimination inherit the words inventory of the parent perceptual category (here the words “m” and “c”); in addition, adifferent brand new word is invented for each of the two categories (words “e” and “n”marked by colored circles). Subsequently, the speaker browses the listof words associated to the perceptual category containing the topic (i.e., m, c, and e here). At this point, there can be two possibilities: If a previous successfulcommunication has occurred with this category, the last winning word is chosen; alternatively, the last word invented is selected. For the current example, thespeaker chooses the word e (marked by the black circle here), and transmits it to the hearer. The outcome of the game is a failure because the hearer does nothave the word e in her inventory associated with the topic. Finally, the speaker unveils the topic, in a nonlinguistic way (e.g., by pointing at it), and the heareradds the new word to the word inventory of the category corresponding to the topic. In game II, the topic that the speaker chooses is already discriminated.Therefore, the speaker verbalizes it using the word c (which, for example, is possibly the winning word in the last successful communication concerning thatcategory). The hearer knows this word and can therefore point to the topic correctly, thereby leading to a successful game. Both the players dispose all com-peting words for the perceptual category corresponding to the topic except c. In general, if there are ambiguities (e.g., the hearer finds the word uttered to belinked to multiple categories containing an object), they are resolved by making an unbiased random choice of one of the categories.
Loreto et al. www.pnas.org/cgi/doi/10.1073/pnas.1113347109 3 of 6

102
103
104
105
106
107
t/N
0
50
100
Cat
egor
ies
nperc
nling , Level 0
nling , Level 1
102
103
104
105
106
107
t/N
10
100
Cat
egor
ies
nperc
nling , Level 0
nling , Level 1
nling , Level 2
102
103
104
105
106
107
t/N
0
0.2
0.4
0.6
0.8
1
Mat
ch
Level 0Level 1
102
103
104
105
106
107
t/N
0
0.2
0.4
0.6
0.8
1
Mat
ch
Level 0Level 1
(a) (b)
(c) (d)
Fig. S2. Evolution of the category structure. (A) Evolution of the average number of perceptual categories as well as the average number of linguisticcategories at different levels when JND is set to d̄min. (B) Evolution of the average number of perceptual categories as well as the average number of linguisticcategories at different levels when JND is set to dminðxÞ. (C) The average match in the population at different levels versus t∕N when JND is set to d̄min. (D) Theaverage match in the population at different levels versus t∕N when JND is set to dminðxÞ. Solid lines show results for N ¼ 300 and broken lines show results forN ¼ 700. All the results are averaged over 30 simulation runs.
102
103
104
105
106
107
t/N
8
16
32
Cat
egor
ies nperc
nling , Level 0
nling , Level 1
102
103
104
105
106
107
108
t/N
16
64
256C
ateg
orie
snperc
nling , Level 0
nling , Level 1
nling , Level 2
(a) (b)
Fig. S3. Dependence of the higher levels on dmin. Evolution of the average number of perceptual categories as well as the average number of linguisticcategories at different levels when JND is set to (A) dmin ¼ 0.05 and (B) dmin ¼ 0.005. The results are shown for N ¼ 500 and are averaged over 30 simulationruns.
102
103
104
105
106
107
t/N
0
0.01
0.02
0.03
0.04
0.05
Frac
tion
of g
ames
in L
evel
1
dmin
dmin
(x)
103
104
105
106
t/N0
0.2
0.4
0.6
0.8
1
Frac
tion
of g
ames
in L
evel
1
RedMagenta-RedVioletGreen/YellowBlueOrangeCyan
(a) (b)
Fig. S4. The fraction of games played by the agents in level 1. (A) The fraction of the total number of games being played in level 1 versus t∕N when the valueof JND is set to d̄min as well as dminðxÞ. (B) The number of games played over time sliding windows in level 1 in the seven individual regions expressed as afraction of the total number of games played in these regions in level 1 over the same time window. Here N ¼ 500 and the results present an average over 30simulation runs for A and 80 simulation runs for B.
102
103
104
105
106
107
108
t/N
0
0.2
0.4
0.6
0.8
1
Ext
ensi
on
Level 1
102
103
104
105
106
107
108
t/N
0
0.2
0.4
0.6
0.8
1
Ext
ensi
on
Level 1Level 2
(a) (b)
Fig. S5. The average extension versus t∕N at different levels. (A) JND is set to d̄min. (B) JND is set to dminðxÞ as in Fig. 1 of the main text. Here N ¼ 500 and theresults present an average over 30 simulation runs.
Loreto et al. www.pnas.org/cgi/doi/10.1073/pnas.1113347109 4 of 6

102
103
104
105
106
t/N
0
0.2
0.4
0.6
0.8
1
Mat
ch
RedMagenta-RedVioletGreen/YellowBlueOrangeCyan
102
103
104
105
106
t/N
0
0.2
0.4
0.6
0.8
1
Succ
ess
Rat
e
RedVioletMagenta-RedGreen/YellowBlueOrangeCyan
102
103
104
105
106
t/N
0
0.2
0.4
0.6
0.8
1
Mat
ch
1264357
102
103
104
105
106
t/N
0
0.2
0.4
0.6
0.8
1
Succ
ess
Rat
e
RedVioletMagenta-RedGreen/YellowBlueOrangeCyan
(a) (b)
(c) (d)
Fig. S6. Emergence of regional agreement. (A) Match at level 0 in the seven fixed-length regions. (B) Success rate in the seven fixed-length regions. (C) Successrate in the seven variable-length regions. (D) Match at level 1 in the seven variable-length regions. Here N ¼ 500 and the results present an average over30 simulation runs.
0 0.2 0.4 0.6 0.8 1
x (Topic)
0
0.01
0.02
0.03
0.04
Inve
rse
JND
Fig. S7. The (properly rescaled) inverse JND function. The function shows the inverse of the actual human JND calculated by first taking 1∕dminðxÞ, thennormalizing these values by maxx ½1∕dminðxÞ�, and finally multiplying the normalized values with maxx ½dminðxÞ�, which confines the values in the same rangeas the actual JND.
102
103
104
105
106
t/N
0
0.20.40.60.8
1
Mat
ch
1723456
102
103
104
105
106
t/N
0
0.2
0.40.6
0.81
Mat
ch
3521746
10 15 20 25 30t/N (x 100)
400
500
600
700
Wav
elen
gth
(nm
)
1 2 3 4 5 6t/N (x 1,000)
400
500
600
700
Wav
elen
gth
(nm
)
(a) (b)
Match = 0.1
Match = 0.1
(c) (d)
Fig. S8. Agreement emergence. Emergence of the agreement in the population in level 0 where the agents are endowed with (A) a flat JND and (C) an inverseJND. The population size N ¼ 500. The time (i.e., t∕N) for the agents to reach a desired consensus (match ¼ 0.1) versus the value of the wavelength corre-sponding to the seven regions when they are endowed with (B) a flat JND and (D) an inverse JND. All the results are averaged over 30 simulation runs.
Loreto et al. www.pnas.org/cgi/doi/10.1073/pnas.1113347109 5 of 6

0 0.2 0.4 0.6 0.8 1(x+0.5) mod 1 (Rotated Topic)
0
0.01
0.02
0.03
0.04
d min
( x)
102
103
104
105
106
t/N
0
0.2
0.4
0.6
0.8
1
Mat
ch
RedVioletMagenta-RedGreen/YellowBlueCyanOrange
)b()a(
Fig. S9. Effect of rotating the stimuli. (A) The JND function when the topic values are given a rotation of the form x←ðx þ 0.5Þ mod1. (B) Emergence of theagreement in the population in level 0 where the agents are endowed with the rotated JND function. The population size N ¼ 500. All the results are averagedover 45 simulation runs.
102
103
104
105
106
t/N
0
0.2
0.4
0.6
0.8
1
Mat
ch r = 10-3
r = 5 × 10⁻⁴
r = 10-4
r = 5 × 10⁻⁵
r = 10-5
Fig. S10. Emergence of the agreement in the population in level 0. We report the overall match for N ¼ 300 for different values of the replacement rater ¼ 10−3; 5·10−4; 10−4; 5·10−5; 10−5. All the results are averaged over 30 simulation runs.
Loreto et al. www.pnas.org/cgi/doi/10.1073/pnas.1113347109 6 of 6