on the origin and evolution of rna editing in metazoans · 57 the central dogma of molecular...
TRANSCRIPT

On the origin and evolution of RNA editing in metazoans 1
Qiye Li1,2,19*, Pei Zhang1,3,19, Ji Li2,4, Hao Yu1, Xiaoyu Zhan1, Yuanzhen Zhu1,5, Qunfei Guo1,6, 2
Huishuang Tan1,7, Nina Lundholm8, Lydia Garcia8, Michael D. Martin9,10, Meritxell Antó 3
Subirats11, Yi-Hsien Su12, Iñaki Ruiz-Trillo11,13,14, Mark Q. Martindale15, Jr-Kai Yu12,16, M. 4
Thomas P. Gilbert9,17, Guojie Zhang1,2,3,18* 5
6 1 BGI-Shenzhen, Shenzhen 518083, China 7 2 State Key Laboratory of Genetic Resources and Evolution, Kunming Institute of Zoology, 8
Chinese Academy of Sciences, Kunming 650223, China 9 3 Section for Ecology and Evolution, Department of Biology, University of Copenhagen, DK-10
2100 Copenhagen, Denmark 11 4 China National Genebank, BGI-Shenzhen, Shenzhen 518120, China 12 5 School of Basic Medicine, Qingdao University, Qingdao 266071, China 13 6 College of Life Science and Technology, Huazhong University of Science and Technology, 14
Wuhan 430074, China 15 7 Center for Informational Biology, University of Electronic Science and Technology of China, 16
Chengdu 611731, China 17 8 Natural History Museum of Denmark, University of Copenhagen, Copenhagen 1350, 18
Denmark 19 9 Department of Natural History, NTNU University Museum, Norwegian University of Science 20
and Technology (NTNU), NO-7491 Trondheim, Norway 21 10 Center for Theoretical Evolutionary Genomics, Dept. of Integrative Biology, University of 22
California Berkeley, Berkeley, California 94720, USA 23 11 Institute of Evolutionary Biology, UPF-CSIC Barcelona, 08003 Barcelona, Spain 24 12 Institute of Cellular and Organismic Biology, Academia Sinica, 11529 Taipei, Taiwan 25 13 ICREA, Passeig Lluís Companys 23, 08010 Barcelona, Catalonia, Spain 26 14 Departament de Genètica, Microbiologia i Estadística, Facultat de Bilogia, Universitat de 27
Barcelona (UB), Barcelona 08028, Spain 28 15 The Whitney Laboratory for Marine Bioscience, University of Florida, St. Augustine, FL 29
32080, USA 30 16 Marine Research Station, Institute of Cellular and Organismic Biology, Academia Sinica, 31
26242 Yilan, Taiwan 32
author/funder. All rights reserved. No reuse allowed without permission. The copyright holder for this preprint (which was not peer-reviewed) is the. https://doi.org/10.1101/2020.01.19.911685doi: bioRxiv preprint
17 Section for Evolutionary Genomics, The GLOBE Institute, University of Copenhagen, 33
Copenhagen 1352, Denmark 34 18 Center for Excellence in Animal Evolution and Genetics, Chinese Academy of Sciences, 35
650223, Kunming, China 36 19 These authors contributed equally 37 * Correspondence: [email protected] (Q.L.) and [email protected] (G.Z.). 38
39
40
Abstract 41
Extensive adenosine-to-inosine (A-to-I) editing of nuclear-transcribed RNAs is the hallmark 42
of metazoan transcriptional regulation, and is fundamental to numerous biochemical processes. 43
Here we explore the origin and evolution of this regulatory innovation, by quantifying its 44
prevalence in 22 species that represent all major transitions in metazoan evolution. We provide 45
substantial evidence that extensive RNA editing emerged in the common ancestor of extant 46
metazoans. We find the frequency of RNA editing varies across taxa in a manner independent 47
of metazoan complexity. Nevertheless, cis-acting features that guide A-to-I editing are under 48
strong constraint across all metazoans. RNA editing seems to preserve an ancient mechanism 49
for suppressing the more recently evolved repetitive elements, and is generally nonadaptive in 50
protein-coding regions across metazoans, except for Drosophila and cephalopods. Interestingly, 51
RNA editing preferentially target genes involved in neurotransmission, cellular 52
communication and cytoskeleton, and recodes identical amino acid positions in several 53
conserved genes across diverse taxa, emphasizing broad roles of RNA editing in cellular 54
functions during metazoan evolution that have been previously underappreciated. 55
author/funder. All rights reserved. No reuse allowed without permission. The copyright holder for this preprint (which was not peer-reviewed) is the. https://doi.org/10.1101/2020.01.19.911685doi: bioRxiv preprint
Introduction 56
The central dogma of molecular biology emphasizes how genetic information passes faithfully 57
from DNA, to RNA, to proteins. However, this dogma has been challenged by the phenomenon 58
of RNA editing — a post/co-transcriptional-processing mechanism that can alter RNA 59
sequences by insertion, deletion or substitution of specific nucleotides, thus producing 60
transcripts that are not directly encoded in the genome 1. In metazoans, the most prevalent form 61
of RNA editing is the deamination of adenosine (A) to inosine (I), which is catalyzed by a 62
family of adenosine deaminases acting on RNA (ADARs) 2,3. As inosine is recognized in vivo 63
as guanosine by ribosomes and other molecular machinery, RNA editing can affect almost all 64
aspects of cellular RNA functions, from changing mRNA coding potential by altering codons 65
or splicing patterns, to regulating the cellular fate of mRNA by editing its microRNA (miRNA) 66
binding sites 4-6. RNA editing is particularly pervasive in neural systems, where it has been 67
shown to modulate neural development processes 7,8, neural network plasticity 9,10 and 68
organismal adaptation to environmental changes 11-13. Defects in RNA editing machinery have 69
been linked to a variety of neurological diseases, autoimmune disorders and cancers 14-18. 70
Although recent high-throughput sequencing-based analyses have identified a surprisingly 71
large number of RNA-editing sites in different metazoans, including humans 19-23, mice 24,25, 72
Caenorhabditis elegans 26, fruit flies 27-30, ants 31, bumblebees 32 and cephalopods 33,34, 73
conclusions about the evolutionary patterns of this phenomenon are inconsistent. For example, 74
while almost all human RNA-editing sites occur in Alu repeat elements 20,21, editing in 75
Drosophila primarily targets exonic (particularly coding) regions 27,28. Additionally, while 76
recoding RNA editing, which leads to nonsynonymous substitutions in protein-coding 77
sequences, is abundant and affects around half of the protein-coding genes in coleoid 78
cephalopods 33,34, it is relatively rare in mammals and insects 21,24,28,31,32. Furthermore, while 79
recoding editing in humans is generally nonadaptive 35, it is typically adaptive in Drosophila 80
and cephalopods 28,34. More importantly, although the ADAR gene family is considered to have 81
originated in the common ancestor of extant metazoans 36, the functional activity of ADARs in 82
catalyzing RNA editing in most metazoan lineages actually remains unknown, especially in 83
those earliest branching lineages like Ctenophora and Porifera. 84
In summary, many fundamental questions about the nature of metazoan RNA editing remain 85
to be investigated, including: When did RNA editing emerge during metazoan evolution? Are 86
there conserved sequence features that underly RNA editing in all metazoans? What genes and 87
genomic elements are the primary targets of metazoan RNA editing? How does the prevalence 88
author/funder. All rights reserved. No reuse allowed without permission. The copyright holder for this preprint (which was not peer-reviewed) is the. https://doi.org/10.1101/2020.01.19.911685doi: bioRxiv preprint

of recoding editing vary by lineage, and does it generally provide adaptive amino acid changes 89
in metazoans? Addressing these questions requires the characterization of RNA editomes 90
across the diversity of metazoans and their closest unicellular relatives, thus we systematically 91
investigated the prevalence and characteristics of RNA editing in 22 lineages that encompass 92
the key transitions in metazoan evolution. 93
94
Results 95
Profiling the RNA editomes across the phylogeny of metazoans. 96
We performed both DNA-seq and strand-specific RNA-seq for 18 species, including 14 97
metazoans and 4 unicellular eukaryotes closely related to animals. 14 out of these 18 species 98
have not been subjected to transcriptome-wide RNA editing investigation previously (Fig. 1a). 99
For each species, two to three (mostly three) biological replicates were sequenced, yielding 100
3.27 Tbp (tera base pairs) sequencing data in total, with the average DNA and RNA coverage 101
achieving 75X (ranging 15-345X) and 45X (ranging 10-162X) respectively for each biological 102
replicate after alignment (Supplementary Table 1). Together with published sequencing data 103
from C. elegans 26, ant 31, octopus 37 and human 22 (Supplementary Table 1), we were able to 104
profile and compare the RNA editomes of 22 species, which represent nearly all the major 105
phyla of extant metazoans, including the earliest-branching lineages Ctenophora, Porifera and 106
Placozoa, as well as their closest unicellular relatives Choanoflagellatea, Filasterea and 107
Ichthyosporea (Fig. 1a). These data thus provide the first opportunity to phylogenetically 108
investigate the prevalence of RNA editing within Holozoa, the clade that includes animals and 109
their closest single-celled relatives 38. 110
Given that some RNA-editing sites tend to appear in clusters, while others remain isolated, we 111
adopted two complementary methods to identify the RNA editomes for each species. Briefly, 112
we first employed RES-Scanner 39 to identify RNA-editing sites by comparing the matching 113
DNA- and RNA-seq data from the same sample. This method has high accuracy when 114
searching for RNA-editing sites that are isolated or not heavily clustered. We next performed 115
hyper-editing detection 40, using the RNA reads that failed to align by RES-Scanner, in order 116
to capture the hyper-edited reads and the clusters of editing sites they harbored. The results of 117
RES-Scanner and hyper-editing detection were combined to yield the RNA editome of each 118
sample (Supplementary Table 2). We have compiled the whole pipeline as an easy-to-use 119
software package named RES-Scanner2, which is applicable to transcriptome-wide 120
author/funder. All rights reserved. No reuse allowed without permission. The copyright holder for this preprint (which was not peer-reviewed) is the. https://doi.org/10.1101/2020.01.19.911685doi: bioRxiv preprint

identification of RNA-editing sites in any species with matching DNA- and RNA-seq data (see 121
Methods for details). 122
123
Extensive RNA editing emerged in the last common ancestor of modern metazoans 124
accompanied by the origin of ADARs. 125
We detected very few putative RNA-editing sites (ranging 23-304) in the four unicellular 126
holozoans (Fig. 1b and Supplementary Table 2). No dominant type of nucleotide substitution 127
was observed (Fig. 1c), and the frequency of each type of nucleotide substitution was close to 128
that of genetic polymorphism (Supplementary Fig. 1a), implying that RNA-editing sites 129
detected in these species likely represent noise. In contrast thousands, to hundreds of thousands, 130
of RNA-editing sites were identified in almost all the sampled metazoans, including the 131
earliest-branching Ctenophora and Porifera, with the vast majority (>90%) consisting of A-to-132
G substitutions (i.e. A-to-I editing; Fig. 1b,c). The only exception was Trichoplax adhaerens, 133
a morphology-simplified metazoan belonging to Placozoa (a sister group to Cnidaria and 134
Bilateria) 41. Concordantly, we confirmed the existence of ADAR-like genes in all the sampled 135
species except T. adhaerens and the unicellular taxa (Fig. 1a and Supplementary Table 3; See 136
Methods). Our results thus provide direct evidence that extensive editing of nuclear-transcribed 137
RNAs first emerged in the last common ancestor of modern metazoans, alongside the 138
appearance of ADAR-mediated A-to-I editing, which is pervasively preserved in most extant 139
animal lineages. We also highlight that our detection methods do not depend on any prior 140
knowledge about the dominate type of RNA editing in any species studied (see Methods), thus, 141
our results also imply that RNA editing in any manner other than A-to-I, is either extremely 142
rare, or non-existent, in the animal kingdom. 143
We next calculated the occurrence rate of RNA editing per genome by counting the number of 144
RNA-editing sites per million transcribed genomic sites (i.e. sites with RNA depth ≥ 2X). Our 145
results indicate that the octopus exhibits the highest, and Drosophila the lowest, number and 146
occurrence rate among the sampled taxa that have the RNA-editing machinery. Surprisingly, 147
the occurrence rates in the ctenophore Mnemiopsis leidyi and sponge Amphimedon 148
queenslandica are higher than that of all sampled cnidarians and many bilaterians (Fig. 1b), 149
while humans are among the species with lowest rates (Fig. 1b). Similar patterns were obtained 150
if we weighted each editing site with its editing level, or if we only considered A-to-I editing 151
(Supplementary Fig. 1b-e). These results suggest that the global level of RNA editing has 152
author/funder. All rights reserved. No reuse allowed without permission. The copyright holder for this preprint (which was not peer-reviewed) is the. https://doi.org/10.1101/2020.01.19.911685doi: bioRxiv preprint

changed considerably during the diversification of metazoan, and does not increase directly 153
alongside organismal complexity. 154
155
The A-to-I editing associated sequence features are under strong constraint in metazoans. 156
Consistent with the double-stranded RNA (dsRNA) binding property of ADAR enzymes 2,6, 157
we observed that A-to-I editing sites in all the sampled metazoans with ADARs were 158
preferentially located in potential dsRNA regions that could form by intramolecular folding of 159
pre-mRNA. Specifically, we found on average that 37% (ranging 6% to 86%) of the editing 160
sites target regions that show a reverse-complement alignment within their upstream or 161
downstream sequences, which is significantly higher than the expected levels of ~1% 162
calculated from randomly selected transcribed adenosines (Fig. 2a; See methods). These results 163
confirm that a stable dsRNA structure is critical for establishing A-to-I editing in vivo across 164
metazoans 42, and further reveal that intramolecular folding of pre-mRNA is a major way to 165
form dsRNA substrates for A-to-I editing in most species. 166
Intermolecular hybridization of sense and antisense transcripts is another potential mechanism 167
to form dsRNA 43, but its role in inducing A-to-I editing is thought to be negligible in mammals 168 44. Taking advantage of the strand information provided by strand-specific RNA-seq, we found 169
that the proportions of editing sites that were located in regions containing transcription signals 170
on both strands (mean 17%, ranging 3% to 64%) were significantly higher than the expected 171
levels (mean 8%, ranging 3% to 32%) in 8 out of the 17 metazoans with ADARs (Fig. 2b; See 172
methods). In particular, while for most species there are generally many more editing sites 173
found in potential dsRNA regions formed by intramolecular folding, the ctenophore M. leidyi 174
and sea squirt Ciona savignyi showed a reverse tendency, with higher proportions of editing 175
sites found in regions with transcription signals in both strands (Fig. 2c). This implies that 176
intermolecular hybridization of sense and antisense transcripts likely represents an important 177
means for forming dsRNA substrates for A-to-I editing, in at least some taxa. This conclusion 178
is further supported by the significantly higher-than-expected proportion of A-to-I editing sites 179
locating in regions targeted by RNA editing on both strands in many species (Supplementary 180
Fig. 2a,c). 181
With regards to the genomic distribution of A-to-I editing, we found on average 81% (ranging 182
41% to 97%) of the metazoan editing sites were clustered, which is significantly higher than 183
the expected levels of less than l% (Fig. 2d). The median distances between any two adjacent 184
editing sites were mostly around 5 nt (ranging 4 to 81 nt; Supplementary Table 4). Furthermore, 185
author/funder. All rights reserved. No reuse allowed without permission. The copyright holder for this preprint (which was not peer-reviewed) is the. https://doi.org/10.1101/2020.01.19.911685doi: bioRxiv preprint

editing levels of the clustered editing sites were generally higher than those of isolated sites, 186
except in Hydra vulgaris, Drosophila, C. savignyi and humans (Supplementary Fig. 2b). A 187
typical metazoan editing cluster (i.e. a region with ≥ 3 A-to-I editing sites and the distance of 188
two adjacent sites ≤ 30 nt) was ~50 nt in length, and harbored 9 A-to-I editing sites, and we 189
estimated that up to 52% of the adenosines within a cluster were targeted by RNA editing 190
(Supplementary Table 4). Taken together, our results indicate that the majority of metazoan A-191
to-I editing sites are organized in dense clusters, within RNA regions that can form stable 192
dsRNA structures. 193
Since ADARs recognize dsRNA when exerting A-to-I editing, we then asked what primary 194
sequence motifs guide ADARs to preferentially edit certain adenosines rather than others in 195
their dsRNA substrates. By comparing the surrounding sequence context of edited adenosine 196
sites to neighboring unedited adenosine sites (i.e. unedited adenosines with RNA depth ≥ 2X 197
and within ± 50 nt of the edited adenosines), we observed clear and conserved nucleotide 198
preferences for the positions that are directly 5’ and 3’ adjacent to the edited adenosines (i.e. 199
the -1 and +1 positions). Specifically, the 5’ adjacent position strongly favored uridine and 200
adenosine, but disfavored guanosine across all metazoans, and to a lesser extent, cytosine was 201
also disfavored (Fig. 2e and Supplementary Fig. 3). In contrast, the nucleotide preference for 202
the 3’ adjacent position is relatively weaker, and less conserved, with guanosine being favored 203
and uridine being disfavored in most species (Fig. 2e and Supplementary Fig. 3). This implies 204
that the 5’ adjacent position has the most influential and a conserved role on determining 205
whether an adenosine will be edited. Concordantly, we found the nucleotide triplets of UAG 206
and AAG, with the edited adenosines in the center, to be the most likely edited triplets, while 207
GAU was the least likely edited triplet in metazoans (Fig. 2f). 208
Interestingly, C. elegans also displayed a strong sequence preference for the 5’ second nearest 209
(-2) position of the edited adenosines that is not observed in other metazoans, with uridine 210
being strongly favored and adenosine being strongly disfavored (Fig. 2e and Supplementary 211
Fig. 3). We speculate that this C. elegans specific motif adjustment is associated with the high 212
sequence divergence of the C. elegans ADARs against other metazoan ADARs, as 213
phylogenetic analyses separate both the C. elegans ADR-1 and ADR-2 from other metazoans 214
(Supplementary Fig. 2d), and both C. elegans ADR-1 and ADR-2 show high nonsynonymous 215
substitution rates (dN) against ADARs from other metazoans (Supplementary Fig. 2e). 216
217
author/funder. All rights reserved. No reuse allowed without permission. The copyright holder for this preprint (which was not peer-reviewed) is the. https://doi.org/10.1101/2020.01.19.911685doi: bioRxiv preprint

Evolutionarily young repetitive elements are the primary targets of metazoan RNA 218
editing. 219
In all metazoans sampled except for the two fruit flies and sea squirt, repetitive elements 220
including transposons and tandem repeats were the major targets of A-to-I editing, and 221
harbored on average 83% (ranging 73% to 95%) of the editing sites (Fig. 3a). This suggests 222
that extensive editing of repeat-containing transcripts is the ancestral and predominant feature 223
for metazoan RNA editing, probably because these regions are more likely to hybridize with 224
nearby oppositely oriented repeats, creating the dsRNA structures suitable for ADARs binding 225
(Supplementary Fig. 4c). It is noteworthy that, even for those sites on pre-mRNA (i.e. exon + 226
intron) of protein-coding genes, especially those outside coding regions, the majority (>70%) 227
were also associated with repetitive elements (Supplementary Fig. 4d). This implies that most 228
editable sites on protein-coding genes were actually introduced by the invasion of repetitive 229
elements into gene regions. 230
Given that the total lengths of the different genomic elements vary greatly within each genome, 231
we next calculated the A-to-I editing density for each type of genomic element, by counting 232
the number of editing sites per million of transcribed adenosine sites (i.e. RNA depth ≥ 2X). 233
After this normalization, we observed that the editing densities of protein-coding gene-related 234
elements (i.e. 5’-UTR, CDS, intron and 3’-UTR) were close to the whole genome average level 235
in all metazoans (Fig. 3b). However, editing densities generally increased from 5’ to 3’ of 236
mRNA transcripts, with 3’ UTR being relatively more favored by A-to-I editing than 5’-UTR 237
and CDS (Fig. 3c), consistent with previous observation in Drosophila 27,28. In contrast, the 238
editing densities of repetitive elements, especially DNA transposons, short interspersed nuclear 239
elements (SINEs), long interspersed nuclear elements (LINEs) or Helitrons depending on 240
species, were significantly higher than the whole genome average. This further supports the 241
hypothesis that repetitive elements are the most favorable targets of A-to-I editing in metazoans. 242
Similar results were obtained even if we weighted each editing site with its editing level 243
(Supplementary Fig. 4e,f). Moreover, we observed negative correlations between the 244
divergence rates and the editing densities of repetitive elements in most species (Fig. 3d and 245
Supplementary Fig. 4g), suggesting that A-to-I editing preferentially targets evolutionarily 246
young repetitive elements that likely only relatively recently invaded the genome of each 247
species. Given that hyper-edited dsRNAs can be degraded by endonuclease V 45, RNA editing 248
may therefore serve as a guardian mechanism to avoid the overactivation of repetitive elements 249
in metazoans. 250
author/funder. All rights reserved. No reuse allowed without permission. The copyright holder for this preprint (which was not peer-reviewed) is the. https://doi.org/10.1101/2020.01.19.911685doi: bioRxiv preprint
251
Recoding RNA editing is rare and generally nonadaptive in metazoans. 252
The phenomenon of recoding editing has gained considerable research interest, as it can result 253
in nonsynonymous substitutions in protein-coding sequences, and thus has the potential to 254
increase proteome diversity by introducing novel protein isoforms 3,6. We observed that the 255
number of recoding sites varied greatly across species, with the octopus having an 256
overwhelming higher number (29,464) than all other species (median 850). In general, the 257
proportion of recoding sites among all A-to-I editing sites was low, ranging from less than 1% 258
to 7% in the majority of metazoans, with only 1% to 5% of all expressed protein-coding genes 259
being recoded. However, the proportions of recoding sites in the fruit flies and the sea squirt 260
were prominently high, reaching 33% (711/2,149), 30% (641/2,165) and 14% (850/6,254) in 261
D. melanogaster, D. simulans and C. savignyi, respectively (Fig. 4a). This may possibly be due 262
to the reduced proportion of editing sites in repetitive elements for these species (see Fig. 3a 263
and Supplementary Fig. 4c,d). 264
We next examined the effect of natural selection on recoding sites. It has been previously 265
reported that nonsynonymous editing is generally adaptive in fruit flies and cephalopods 28-30,34. 266
If this is so, one would expect that, in relation to synonymous editing, which is expected to be 267
neutral, the frequency of nonsynonymous editing (ƒn) calculated as the number of A-to-I 268
editing sites causing nonsynonymous changes against all potential nonsynonymous adenosine 269
sites if A is replaced with G, is higher than that of synonymous editing (ƒs) (see Methods). 270
When considering all recoding sites together, we observed that the frequencies of 271
nonsynonymous editing were either close to, or significantly lower than, synonymous editing 272
in all species (Fig. 4b). This therefore argues against the adaptive hypothesis, and suggests that 273
the recoding editing events observed in coding regions of most metazoans are generally neutral 274
or deleterious, consistent with previous reports in humans 35. Consistently, editing levels of A-275
to-I sites in coding regions were generally lower than the genome average and other types of 276
genomic elements (Fig. 4c), implying that editing of coding regions tends to be suppressed. 277
However, when we divided the recoding sites of each species into lowly (editing level < 0.2) 278
and highly (editing level ≥ 0.2) edited groups, we found that the frequencies of nonsynonymous 279
editing in fruit flies and octopus became significantly higher than synonymous editing in the 280
highly edited group (Fig. 4b). This demonstrates a relatively larger portion of adaptive recoding 281
sites exists in these two lineages than in other metazoans. 282
author/funder. All rights reserved. No reuse allowed without permission. The copyright holder for this preprint (which was not peer-reviewed) is the. https://doi.org/10.1101/2020.01.19.911685doi: bioRxiv preprint

If recoding editing is generally nonadaptive, one would also expect that nonsynonymous 283
editing is depleted from evolutionarily conserved genes which are less tolerant to mutations. 284
We thus divided the genes of each species into three groups according to the degree of 285
evolutionary conservation (see Methods). Group I and II comprise genes that have orthologs 286
in closely-related species, but with relatively low and high dN/dS ratios, representing the most 287
and moderately conserved groups, respectively. Group III comprises all the remaining genes, 288
that cannot find orthologs, and represents the least conserved group. As expected, the genes 289
subjected to recoding editing were generally enriched in the least conserved groups in most 290
metazoans (Fig. 4d), suggesting that recoding editing tends to be purged from the 291
evolutionarily conserved genes in most metazoans. Nevertheless, an inverse tendency can be 292
observed in the fruit flies and octopus, probably due to the relatively larger portions of adaptive 293
recoding sites in these species. This also implies that adaptive recoding editing more likely 294
emerged in the evolutionarily conserved genes, which benefit from increasing protein diversity 295
without introducing DNA mutation in these genes. 296
297
RNA editing preferentially affects cellular communication and cytoskeleton related genes 298
To uncover the functional preference of genes targeted by A-to-I editing in metazoans, we 299
conducted gene ontology (GO) based functional enrichment analysis for the RNA-recoded 300
genes (i.e. genes with at least one recoding site of which the average editing level across 301
samples > 0.1 or shared by at least two samples) in each species. Consistent with previous 302
observations in mammals 7,9, insects 28,29,31 and cephalopods 33,34, we found that 303
neurotransmission-related functions such as ion transmembrane transport, synaptic 304
transmission and gated channel activity were significantly enriched in diverse species including 305
human, zebrafish, acorn worm, Drosophila, ant and octopus (Fig. 5a), confirming the important 306
role of RNA editing in modulating neural function in bilaterians. Representative examples are 307
the voltage-gated K+ channels, that show the same recoding events on two highly conserved 308
amino acid residues within the ion transport domain among Drosophila, ant, octopus and even 309
human (Fig. 5b and Supplementary Table 5), and the glutamate ionotropic receptors in 310
vertebrates (Supplementary Fig. 5a and Supplementary Table 5). Interestingly, although a 311
nervous system is absent in the sponge 46, functional categories related to cellular 312
communication, signal transduction and response to stimulus were significantly enriched in 313
this early-branching and morphologically simple metazoan. Given that neurotransmission is 314
also part of the cell communication and signal transduction processes which mediate cellular 315
response to internal and external stimulus 47, these results imply that RNA editing might have 316
author/funder. All rights reserved. No reuse allowed without permission. The copyright holder for this preprint (which was not peer-reviewed) is the. https://doi.org/10.1101/2020.01.19.911685doi: bioRxiv preprint

been adopted to modulate the molecular pathways of stimulus response during the early stage 317
of metazoan evolution. 318
However, it is unexpected that significant enrichment of cytoskeleton-related functions such 319
as cytoskeletal protein binding, actin cytoskeleton organization and motor activity, was 320
frequently observed in diverse bilaterians (Fig. 5a). Recoding editing of genes involved in 321
cytoskeleton-related functions has been only rarely reported previously 33,34. The only well-322
documented cases so far are the actin crosslinking proteins filamin α (FLNA) and filamin β 323
(FLNB), of which a conserved Q-to-R recoding event occur at the same position of both 324
proteins in mammals 48. Our data not only confirms that recoding editing of FLNA or FLNB 325
occurs in humans, but also detects recoding events in sea urchin (FLNB), Drosophila (FLNA), 326
and acorn worm (FLNA). Other representative examples comprise the cilia and flagella 327
associated protein 100 (CFAP100) which contains a S-to-G recoding event shared by oyster 328
and acorn worm (Fig. 5c and Supplementary Table 5), and fascin (an actin filament-bundling 329
protein) which has a Q-to-R recoding event shared by octopus, sea urchin and lancelet 330
(Supplementary Fig. 5b and Supplementary Table 5). The repeated emergence of same 331
recoding editing in the cytoskeleton-related genes in different lineages emphasizes an 332
important, but previously unappreciated, role of RNA editing in regulating cytoskeleton-333
related functions in metazoans. 334
335
Discussion 336
The phenomenon of RNA editing has been reported previously across a diverse range of 337
eukaryotes including metazoans, protists, fungi and plants, and to affect different types of RNA 338 1,49. However, while in most eukaryotes it is exclusively limited to mitochondrial or chloroplast 339
RNA, the extensive editing of nuclear-transcribed mRNA is phylogenetically rare, and 340
restricted to metazoans and some filamentous ascomycetes in which it originated through 341
independent mechanisms 3,50. In this study, we present the first direct evidence that this method 342
for extensive alteration of nuclear DNA-encoded genetic information was adopted alongside 343
the origin of ADARs by the last common ancestor of extant metazoans ca 800 million years ago 344 51, following its divergence from unicellular choanoflagellates. This raises the possibility that 345
ADAR-meditated RNA editing is an ancient regulatory process that was fundamental for initial 346
metazoan evolution. The evolutionary maintenance of ADAR-meditated RNA editing in 347
almost all extant metazoan lineages also emphasizes its essentiality in metazoan biology. 348
author/funder. All rights reserved. No reuse allowed without permission. The copyright holder for this preprint (which was not peer-reviewed) is the. https://doi.org/10.1101/2020.01.19.911685doi: bioRxiv preprint

Consistent with the evolutionary constraint of ADARs, we show that the nucleotide sequence 349
and structural features surrounding A-to-I editing sites, including the strong favor of 350
uridine/adenosine and disfavor of guanosine in the adjacent 5’ positions, and the tendency of 351
the underlying sequences to form dsRNA structures, are under strong constraint across the 352
animal kingdom, from the earliest branching ctenophore and sponge to human. These findings 353
might be valuable for ADAR-based RNA engineering, such as the recently reported RESTORE 354
and LEAPER approaches, which can recruit endogenous ADAR to specific transcripts for site-355
directed RNA editing in human cells 52,53, as these conserved features imply that the approaches 356
developed based on one species (usually human) may well be easily applicable to other 357
metazoan species with ADARs. 358
It is now generally acknowledged that the complexity of transcriptional regulation coincides 359
with organismal complexity 54. RNA editing and alternative splicing have long been proposed 360
to serve as important co/post-transcriptional regulatory mechanisms for increasing 361
transcriptome diversity 3,55. However, while alternative splicing has been demonstrated to be 362
strongly associated with organismal complexity 56, we do not observe such a relationship 363
between the extent of global RNA-editing and organismal complexity in metazoans. Together 364
with our observations that in metazoans A-to-I editing preferentially targets evolutionary 365
young repetitive elements, and that recoding events in protein-coding sequences are generally 366
neutral or slightly deleterious, these findings question the ancestral role of A-to-I RNA editing 367
as a transcriptome or proteome diversifier in metazoans. Recent ADAR1-knockout studies in 368
human cells and mice indicated that ADAR1-mediated A-to-I editing of endogenous dsRNAs 369
formed by inverted repeats, plays a key role in preventing cellular sensing of endogenous 370
dsRNA as nonself (e.g. viral RNA), thus avoiding autoinflammation 18,57. This suggests that 371
the avoidance of aberrant immune responses triggered by the accumulation of endogenous 372
dsRNA represents the primary driving force for preserving the extensive A-to-I editing in most 373
metazoan lineages. Alternatively, given that most editing sites are only edited at low to 374
moderate levels in all the species examined, and thus might not be sufficient to unwind dsRNAs 375
to avoid immune response, we hypothesize that metazoans may benefit from the maintenance 376
of mild single-nucleotide mutations in the RNA pool, as these mutations can provide plentiful 377
transcript variants that might help metazoans cope with unpredictable future conditions in their 378
life. 379
Our extensive survey across the phylogeny of metazoans also emphasizes that Drosophila and 380
cephalopods, whose RNA editomes harbor relatively high proportions of adaptive recoding 381
author/funder. All rights reserved. No reuse allowed without permission. The copyright holder for this preprint (which was not peer-reviewed) is the. https://doi.org/10.1101/2020.01.19.911685doi: bioRxiv preprint

events subject to positive selection, are actually evolutionary exceptions in the animal kingdom. 382
The abundant recoding editing in cephalopods has been demonstrated to emerge in the ancestor 383
of coleoids after splitting from nautiloids, with the expansion of the cephalopod RNA editomes 384 34. In contrast, we find that the Drosophila RNA editomes have been greatly contracted in 385
comparison to most metazoans, while a considerable portion of recoding events is maintained 386
by natural selection. When this Drosophila pattern emerged during the evolution of insects 387
remains unknown. At least, the fact that more ‘classic’ RNA editomes, in which the majority 388
of sites targeting repetitive elements and rare recoding editing, are observed in ants and recently 389
in bumble bees 32, indicates that this Drosophila pattern must emerge after the divergence of 390
Diptera and Hymenoptera ca 345 million years ago 58. 391
RNA editing has been long acknowledged to regulate neural functions, affecting genes 392
encoding ion channels and neuroreceptors 7,9,10, consistent with the results of our functional 393
enrichment analysis of recoded genes in diverse species. Thus what is most surprising about 394
our observations is the over-representative of recoded genes encoding cytoskeleton-related 395
functions in diverse species, implying that post-transcriptional diversification of cytoskeleton-396
related genes via RNA editing might be an important way through which to increase cellular 397
complexity during the evolution of metazoans. In particular, in some cases, we find exactly the 398
same positions are edited and cause the same amino acid changes in evolutionarily conserved 399
residues in distantly related species. The cytoskeleton is an interconnected network of 400
filamentous polymers and regulatory proteins, which carries out broad functions including 401
spatially organizing the contents of the cell, connecting the cell physically and biochemically 402
to the external environment and generating coordinated forces that enable the cell to move and 403
change shape 59. It will be necessary for future studies to ascertain which aspect of 404
cytoskeleton-related functions RNA editing regulate. 405
In summary, our study provides the first large-scale and unbiased transcriptome-wide 406
investigation of RNA editing across the phylogeny of metazoans. These resources are valuable 407
for our understanding of the biological role and evolutionary principle of RNA editing in the 408
animal kingdom. 409
410
Methods 411
Sample collection 412
To rule out that false positives resulted from genetic variation during RNA-editing site 413
identification, matching DNA and RNA sequences generated from the same 414
author/funder. All rights reserved. No reuse allowed without permission. The copyright holder for this preprint (which was not peer-reviewed) is the. https://doi.org/10.1101/2020.01.19.911685doi: bioRxiv preprint

individual/specimen are the ideal data for use in RNA editing studies 39,60. Thus, for the 415
metazoan species with sufficient body mass, both genomic DNA and total RNA were extracted 416
from the same individual, after grinding of the tissue/whole organism in liquid nitrogen. Two 417
to three individuals were collected as biological replicates. These species included the comb 418
jelly Mnemiopsis leidyi (three whole adults), the sponge Amphimedon queenslandica (three 419
biopsies from three adults), the sea anemone Nematostella vectensis (three whole adults), the 420
sea hare Aplysia californica (three whole juveniles), the oyster Crassostrea gigas (three whole 421
adults after removing shells), the sea urchin Strongylocentrotus purpuratus (three pairs of 422
gonad and non-gonad tissues dissected from one female and two male adults; non-gonad tissues 423
comprised the digestive, water vascular, and nervous systems), the acorn worm Ptychodera 424
flava (three whole adults), the lancelet Branchiostoma belcheri (three whole adults), the sea 425
squirt Ciona savignyi (two whole adults) and the zebrafish Danio rerio (three whole adults). 426
For metazoan species from which a single individual is not sufficient to allow the simultaneous 427
extraction of sufficient DNA and RNA for sequencing library construction, 10-15 individuals 428
with similar genetic background were pooled together, then both genomic DNA and total RNA 429
were extracted from the same pool of organisms after the whole pool was ground in liquid 430
nitrogen. These included the hydra Hydra vulgaris (10 adults per pool, two pools to serve as 431
biological replicates), the fruit fly Drosophila melanogaster (15 male adults per pool, two 432
pools), and Drosophila simulans (15 male adults per pool, two pools). 433
For the unicellular species and tiny metazoan species, biomass was first increased by the 434
propagation of a single colony with the same genetic background, then both genomic DNA and 435
total RNA were extracted from the same culture of organisms. These included the 436
ichthyosporean Sphaeroforma arctica (three cultures to serve as biological replicates), the 437
filasterean Capsaspora owczarzaki (three cultures), the choanoflagellate Salpingoeca rosetta 438
(three cultures) and Monosiga brevicollis (three cultures), and the metazoan Trichoplax 439
adhaerens (three cultures). 440
All the species were either collected from conventionally grown lab conditions, or obtained 441
from the wild. With the exception of the sea hare samples which were purchased from the 442
National Resource for Aplysia, University of Miami, 4600 Rickenbacker Causeway, Miami, 443
FL 33149, samples of all the other species were kindly provided by researchers who have 444
worked on corresponding species for years. The strain identifier (if applicable), geographical 445
origin and providers of each species were listed in Supplementary Table 1. 446
author/funder. All rights reserved. No reuse allowed without permission. The copyright holder for this preprint (which was not peer-reviewed) is the. https://doi.org/10.1101/2020.01.19.911685doi: bioRxiv preprint
Genomic DNA of all species was extracted with the phenol/chloroform/isopentanol (25:24:1) 447
protocol. The integrity of the DNA samples was assayed by agarose gel electrophoresis 448
(concentration: 1 %; voltage: 150 V; Time: 40 min) before DNA-seq library construction. Total 449
RNA of all species except the choanoflagellates was extracted using TRIzol Reagent according 450
to manufacturer's protocol (Invitrogen, CA, USA). Total RNA of the choanoflagellates S. 451
rosetta and M. brevicollis was extracted using the RNAqueous Kit (Ambion, CA, USA). The 452
quality of the RNA samples was assayed by the Agilent 2100 Bioanalyzer (Thermo Fisher 453
Scientific, MA, USA) before RNA-seq library construction. In summary, a total of 53 DNA 454
and 53 RNA samples were obtained in this study. After quality control before library 455
construction, two out of the three RNA samples of M. brevicollis and one out of the three RNA 456
samples of N. vectensis were discarded due to poor RNA integrity (RIN < 6). 457
458
Library construction and sequencing 459
The strand-specific RNA-seq libraries for all the RNA samples were prepared using the TruSeq 460
Stranded mRNA LT Sample Prep kit (RS-122-2101, Illumina) with 1 µg total RNA as input, 461
then sequenced on the Illumina HiSeq 4000 platform using the PE100 chemistry, according to 462
the manufacturer’s instructions (Illumina, San Diego, CA, USA). 463
The genomic DNA samples were either sequenced on an Illumina HiSeq 4000 or a BGISEQ-464
500RS platform. The Illumina HiSeq and BGISEQ-500 platforms have been proved to generate 465
data with comparable quality and show high concordance for calling single nucleotide variants 466
by multiple independent studies 61-63. For the Illumina DNA libraries, 1 μg genomic DNA per 467
sample was fragmented by a Covaris ultrasonicator, followed by end repair, 3′-end addition of 468
dATP and adapter ligation. The ligated fragments were then size selected at 300 bp on an 469
agarose gel and amplified by 10 cycles of PCR. The amplified libraries were purified using the 470
AxyPrep Mag PCR Clean-Up Kit (Axygen, MA, USA) then sequenced on the Illumina HiSeq 471
4000 platform using the PE100 chemistry according to the manufacturer’s instructions 472
(Illumina, San Diego, CA, USA). The BGISEQ DNA sequencing libraries were prepared using 473
the MGIEasy DNA Library Prep Kit (V1.1, MGI Tech) with 1 μg genomic DNA as input, and 474
sequenced on the BGISEQ-500RS platform using the PE100 chemistry according to the 475
manufacturer’s instructions (MGI Tech Co., Ltd., Shenzhen, China). Details about the 476
sequencing platform and data production for each sample were presented in Supplementary 477
Table 1. 478
479
author/funder. All rights reserved. No reuse allowed without permission. The copyright holder for this preprint (which was not peer-reviewed) is the. https://doi.org/10.1101/2020.01.19.911685doi: bioRxiv preprint

Identification of RNA-editing sites 480
(i) Quality control for raw sequencing data 481
All the DNA- and RNA-seq reads were first submitted to SOAPnuke (v1.5.6) 64 for quality 482
control by removal of adapter-contaminated reads and low-quality reads before subsequent 483
analyses with parameters -G -l 20 -q 0.2 -E 60 -5 1 -Q 2. 484
(ii) Adjustment of reference genome with DNA-seq data 485
Given that many samples were collected from wild animals, which have high levels of 486
heterozygosity, or were from strains which are genetically different from those used for 487
assembling the reference genomes, we employed Pilon (v1.21) 65 to adjust the reference 488
genome of each species using the DNA-seq data from different samples separately, generating 489
sample-specific reference genomes for each species before RNA-editing site identification. 490
Specifically, DNA sequence reads from each sample of a species were first aligned to the 491
published reference genome using BWA-MEM (v0.7.15) 66 with default parameters. Then, 492
genome adjustment was performed by Pilon with default parameters except that --fix snps was 493
set, using the original reference genome FASTA and the DNA BAM files as input. It is 494
noteworthy that we only adjusted SNPs in the reference genomes in order to ensure that the 495
adjusted genomes from different samples of the same species have the same length and the 496
same coordinate system. The version and source of the original reference genome for each 497
species were listed in Supplementary Table 1. 498
(iii) Identification of RNA-editing sites with RES-Scanner 499
RNA-editing sites from each sample were first identified by RES-Scanner (v20160713), a 500
software package that was designed to identify transcriptome-wide RNA-editing sites with 501
matching DNA- and RNA-seq data from the same individual or specimen 39. Briefly, RES-502
Scanner invoked BWA-ALN (v0.7.15) 67 to align the DNA and RNA reads that passed quality 503
control to the adjusted reference genome of each species, followed by filtering low-quality 504
alignments, calling homozygous genotype from DNA data, and identifying candidate RNA-505
editing sites from RNA data by ruling out false-positives resulted from genetic variants and 506
sequencing or alignment errors. In general, default parameters were used for the whole pipeline, 507
except that the mapping quality cutoff was set to 5 for DNA alignment (default 20) and the 508
numbers of bases masked at the 5’- and 3’-end of a DNA read was set to 0 (default 6). This 509
was done as we found that lowering these requirements for the DNA data could yield RNA-510
editing sites with higher accuracy in many species, manifesting as the higher proportions of A-511
to-I editing sites out of all identified editing sites. 512
author/funder. All rights reserved. No reuse allowed without permission. The copyright holder for this preprint (which was not peer-reviewed) is the. https://doi.org/10.1101/2020.01.19.911685doi: bioRxiv preprint
(vi) Identification of hyper-editing sites 513
Given that A-to-I editing sites tend to occur in clusters, the heavily edited RNA reads 514
(commonly called hyper-edited reads) which contain many of the same type of substitutions in 515
relation to the reference genome, often fail to be aligned during normal alignment process. In 516
order to capture these hyper-edited reads and the clusters of editing sites they harbor, we next 517
performed hyper-editing detection for each sample following a scheme originally proposed by 518
Porath et al 40. 519
We first collected the RNA read pairs that could not be aligned to the adjusted reference 520
genome or that had mapping quality < 20 from the RNA BAM files generated by the RES-521
Scanner pipeline as described above. We then removed the read pairs for which one or both 522
reads contained more than 10% of Ns along their lengths, or had particularly large (>60%) or 523
small (<10%) percentage of a single-type nucleotide as recommended by Porath et al 40. Next, 524
we adopted a “three-letter” alignment strategy to align these potential hyper-edited reads, in 525
order to overcome the excess mismatches in relation to the reference genome. For example, to 526
align the RNA reads with many A-to-I editing sites (i.e. many A-to-G mismatches), all Ts in 527
the first read of a read pair were transformed to Cs, and all the As in the second read of a read 528
pair were transformed to Gs. This is because, for read pairs generated from the dUTP-based 529
strand-specific RNA-seq libraries, the second read is from the original RNA strand/template 530
while the first read is from the opposite strand 68. In the meantime, two versions of the reference 531
genome were created, of which the first version was named the positive reference, with all As 532
transformed to Gs, and the second version was named the negative reference, with all Ts 533
transformed to Cs. 534
Next, the transformed read pairs were aligned to both the positive and negative references by 535
BWA-ALN with parameters -n 0.02 -o 0, yielding the positive and negative alignments, 536
respectively. Then, we filtered both alignments by removing read pairs that were not aligned 537
to the reference genome concordantly, and the reads within concordantly aligned pairs that had 538
mapping score < 20. In addition, for positive alignment, we further required that the first read 539
in a pair was the reverse complement of the reference genome, while the second read was 540
aligned to reference genome directly; for negative alignment, we required that the first read in 541
a read pair was directly aligned to reference genome, while the second read was the reverse 542
complement of the reference genome. 543
After the strict quality control for the BWA alignments, we converted the transformed reads to 544
their original sequences, followed by trimming the first and last 10 bases of each read in the 545
author/funder. All rights reserved. No reuse allowed without permission. The copyright holder for this preprint (which was not peer-reviewed) is the. https://doi.org/10.1101/2020.01.19.911685doi: bioRxiv preprint

alignments. Then we identified hyper-edited reads by requiring the mismatch rate of a trimmed 546
read to be > 5%, and the proportion of the expected mismatches (i.e. A-to-G substitution in this 547
example) against all mismatches to be > 60% as recommended by Porath et al 40. Finally, BAM 548
files of hyper-edited RNA reads were submitted to RES-Scanner to extract potential editing 549
sites together with the matching DNA BMA files generated in the previous step. RES-Scanner 550
was run with default parameters in general, except that the mapping quality cutoff was set to 5 551
for DNA alignment, the numbers of bases masked at the 5’- and 3’-end of a read were set to 0 552
for both DNA and RNA reads, the minimum number of RNA reads supporting editing was set 553
to 2 (default 3), and the minimum editing level was set to 0 (default 0.05). 554
The above hyper-editing detection method was undertaken for all of the 12 possible 555
substitution types of RNA editing in each sample of a species, and the results from all the 12 556
substitution types were combined together by discarding those sites that presented different 557
editing types in any single genomic position. 558
(v) Combing the results of RES-Scanner and hyper-editing detection 559
To generate the representative RNA-editing sites for a species, and to improve the 560
identification of editing sites in each sample, we combined the editing sites identified by RES-561
Scanner (step iii) and hyper-editing detection (step vi) in each sample, to obtain a 562
comprehensive map of potentially editable positions in the reference genome of each species. 563
If a genomic position was identified as an editing site in both methods, we respectively added 564
the numbers of RNA reads supporting editing, and the number supporting non-editing as 565
generated by these two methods. We then retrieved the missed editing sites in each sample in 566
these editable positions using the criteria of at least one RNA read supporting editing and the 567
false discovery rate (FDR) 69 adjusted p value for this site to be resulted from sequencing error 568
< 0.01. Specifically, statistical tests were performed based on the binomial distribution B(k, n, 569
p), where p was set to be the maximal probability of an RNA base to be a sequencing error (i.e. 570
0.1% here as we only used RNA bases with Phred quality score ≥ 30), n was equal to the total 571
read depth of a given candidate editing site, and k denoted the number of reads supporting 572
editing. We also used the DNA-seq data from multiple samples to further remove false-573
positives resulted from genetic variants, by discarding those editing sites for which the genomic 574
DNA showing the same type of substitution as RNA editing (i.e. the frequency of edited base 575
versus the total number of bases covering this position > 0.1) in any one of the multiple DNA 576
samples. RNA-editing sites that displayed different editing types in different samples of a 577
species were also discarded. 578
author/funder. All rights reserved. No reuse allowed without permission. The copyright holder for this preprint (which was not peer-reviewed) is the. https://doi.org/10.1101/2020.01.19.911685doi: bioRxiv preprint

We have updated the software package RES-Scanner we previously established for RNA-579
editing site scanning by compiling above steps (step i to v). This RES-Scanner2 now can also 580
identify hyper-editing sites. It works from raw sequencing reads and is applicable to RNA-581
editing site detection in any species with matching DNA- and RNA-seq data. 582
583
RNA-editing sites for additional metazoan species 584
To increase the phylogenetic coverage of the investigated species, we collected the matching 585
DNA-seq and strand-specific RNA-seq data from the nematode Caenorhabditis elegans 586
(pooled whole organisms collected from three larval stages and two adult stages) 26, the leaf-587
cutting ant Acromyrmex echinatior (three pooled head samples of the small worker caste 588
collected from three colonies, respectively) 31, the octopus Octopus bimaculoides (four neural 589
tissue samples including faxial nerve cord, optic lobe, subesophageal ganglia and 590
supraesophageal ganglia) 37 and human (three brain samples from three male adults, 591
respectively) 22. The SRA accession numbers and statistics of the downloaded sequencing data 592
were presented in Supplementary Table 1. RNA-editing sites in each of the four species were 593
identified using the same procedure (step i to v) as described above. 594
595
Refining the ORFs and annotating UTRs for protein-coding genes 596
Protein-coding genes (GFF/GTF and corresponding cds/pep FASTA files) were downloaded 597
from public databases along with the reference genomes, of which the sources were presented 598
in Supplementary Table 1. The correctness of the open-reading frames (ORFs) in the GFF/GTF 599
files were checked for all the protein-coding genes, with the defective ORFs such as those that 600
were not the integer multiple of 3 in length or not exactly matching the protein sequences 601
presented in the downloaded pep FASTA files being carefully corrected by in-house scripts. 602
Then the transcript model with the longest ORF was chosen as the representative model for a 603
locus if multiple transcript models were annotated in this locus. 604
5’- and 3’-UTRs for the representative ORFs were annotated using the RNA-seq data used in 605
this study, for all the species except for human. Briefly, RNA-seq reads that passed quality 606
control as described above were first aligned to the reference genome of each species by 607
HISAT2 (v2.1.0) 70, with default parameters except setting --rf, followed by removing those 608
reads that could be mapped to multiple positions of the genome. Then, transcribed regions with 609
continual RNA depth ≥ 5X were extended from the 5’- and 3’-end of each representative ORF 610
to serve as initial 5’- and 3’-UTRs, respectively. Next, an iterative process was used to further 611
author/funder. All rights reserved. No reuse allowed without permission. The copyright holder for this preprint (which was not peer-reviewed) is the. https://doi.org/10.1101/2020.01.19.911685doi: bioRxiv preprint

recruit the upstream or downstream transcribed regions that were apart from, but linked by ≥ 5 612
junction reads to previously defined UTRs. If a gene had different 5’- or 3’-UTRs annotated in 613
different samples, the longest one was chosen as the representative 5’- or 3’-UTR for this gene. 614
615
Gene expression quantification and transcript assembly with RNA-seq data 616
HISAT2 alignments generated in the above analysis were used to quantify gene expression 617
levels for the refined representative gene models in each species. Only the RNA-seq reads that 618
were aligned to one position of the reference genome, and that overlapped with annotated exons 619
were kept for expression quantification. Gene expression levels were measured by RPKM 620
(reads per kilobase per million mapped exonic reads), and the RPKM values in all the 621
sequenced samples from the same species were adjusted by a scaling normalization method 622
based on TMM (trimmed mean of M values) to normalize the sequencing bias among samples 623 71. We also assembled transcripts for each species with StringTie (v1.3.4d) 72 with default 624
parameters using the HISAT2 alignments as input. These transcript models were regarded as 625
one kind of reference models during the manual annotation of ADAR genes as described below. 626
627
Annotation of ADAR genes in each species 628
ADAR protein sequences of Nematostella vectensis (XP_001642062.1 and XP_001629615.1), 629
Drosophila melanogaster (NP_569940.2), Caenorhabditis elegans (NP_492153.2 and 630
NP_498594.1), Crassostrea gigas (EKC20855.1 and EKC32699.1), Strongylocentrotus 631
purpuratus (XP_011680614.1 and XP_781832.1), Ciona intestinalis (XP_002128212.1), 632
Danio rerio (NP_571671.2, NP_571685.2, XP_021334693.1 and XP_686426.5) and Homo 633
sapiens (XP_024305442.1, NP_056648.1 and NP_061172.1) collected from NCBI were used 634
as queries to search for ADAR genes in reference genomes of all the 22 species by TBLASTN 635
(blast-2.2.23) 73 with parameters -F F -e 1e-5, followed by the determination of gene structure 636
and protein sequences in the target species with GeneWise (wise2.2.0) 74. The predicted 637
proteins were then aligned to the NCBI nr database to confirm whether they were ADARs. 638
Next, we manually compared the gene models in the putative ADAR loci resulted from 639
homologous predictions, transcript assemblies by StringTie and the published gene set of each 640
species, and we chose the models with the longest ORFs as the representative models. Domain 641
organizations of the manually confirmed ADAR proteins were predicted using the CD-Search 642
tool in NCBI (CDD v3.17; https://www.ncbi.nlm.nih.gov/Structure/cdd/wrpsb.cgi) and Pfam 643
(release-32.0; https://pfam.xfam.org) with default settings, and only ADARs with at least one 644
author/funder. All rights reserved. No reuse allowed without permission. The copyright holder for this preprint (which was not peer-reviewed) is the. https://doi.org/10.1101/2020.01.19.911685doi: bioRxiv preprint

dsRNA binding domain (dsRBDs) and one adenosine-deaminase domain (AD) were regarded 645
as potential ADAR genes. Of note, ADAD genes, which usually contain one or more dsRBDs 646
and one AD, were also identified as potential ADARs by our criteria, but they could be 647
distinguished from ADARs according to phylogenetic analysis (see below). The information of 648
ADAR genes annotated in each species, including the coding nucleotide sequences, protein 649
sequences, domain annotations and editing sites are presented in Supplementary Table 3. 650
Phylogenetic analysis of all the potential ADARs identified above, were performed with the 651
AD peptide sequences (ca 324 amino acids in length) using MEGA7 with the neighbor-joining 652
method 75. We did not perform phylogenetic analysis whit the dsRBDs, as the lengths of the 653
dsRBDs were generally very short (ca 40 to 60 amino acids) and the copy number of dsRBDs 654
varied among ADARs both within and between species. The peptide sequences of ADs used 655
for phylogenetic analysis were aligned using ClustalW as implemented in MEGA7. Reliability 656
of the trees was estimated using 1,000 bootstrap replications (Supplementary Fig. 2d). To 657
further estimate the divergence between any two potential ADARs, we calculated the 658
nonsynonymous substitution rates (dN) for any pair of potential ADARs using PAML (v4.9i) 659 76 with the Yang & Nielsen (2000) method 77, according to the codon alignment of the ADs 660
(Supplementary Fig. 2e). 661
662
Identification of editing sites locating in potential dsRNA regions 663
The dsRNA regions formed by two potential mechanisms, intramolecular folding of pre-664
mRNA and intermolecular hybridization of sense-antisense transcripts, were tested for the 665
enrichment of A-to-I editing sites. 666
For the mechanism of intramolecular folding, we extracted a 401 nt sequence centered on each 667
A-to-I editing site, then searched this query sequence against a 4001 nt sequence centered on 668
corresponding A-to-I editing site using BLASTN (v2.2.26) with parameters -F F -e 1e-2. Then 669
an A-to-I editing site was identified as locating in a dsRNA region formed by intramolecular 670
folding, if a reverse-complement alignment was detected with identity ≥ 80%, the aligned 671
length was ≥ 50 nt, and the aligned region of the query sequence spanned the edited adenosine. 672
For the mechanism of intermolecular hybridization of sense-antisense transcripts, we examined 673
the RNA coverage of a 101 nt region centered on each A-to-I editing site, and searched for the 674
regions with RNA depth ≥ 2X along >50% of the region length, on both strands. 675
To estimate the expected ratio of A-to-I editing sites that occurred in dsRNA regions formed 676
by the above two different mechanisms in each sample, we randomly selected an adenosine 677
author/funder. All rights reserved. No reuse allowed without permission. The copyright holder for this preprint (which was not peer-reviewed) is the. https://doi.org/10.1101/2020.01.19.911685doi: bioRxiv preprint

site with comparable RNA depth (i.e. within ± 20% of the editing site) for each editing site in 678
a sample, and performed the same analyses for these control adenosine sites. The significance 679
levels for the difference between the observed and expected ratios were examined by two-tailed 680
paired t-tests in each species. 681
682
Definition of clustered and isolated editing sites 683
For each sample of a species, we considered a genomic region containing ≥ 3 A-to-I editing 684
sites, of which the distance for two adjacent sites was ≤ 30 nt, as an RNA-editing cluster. The 685
genomic locations of the first and last editing sites in a cluster were assigned as the start and 686
end genomic positions of this cluster. A-to-I editing sites located in the defined editing clusters 687
were regarded as clustered editing sites, and those outside editing clusters were regarded as 688
isolated editing sites. To estimate the expected ratio of A-to-I editing sites occurring in clusters 689
in each sample, we randomly selected an adenosine site with comparable RNA depth (i.e. 690
within ± 20% of the editing site) for each editing site in a sample, and calculated the ratio of 691
these control adenosine sites occurring in clusters. The significance levels for the difference 692
between the observed and expected ratios were examined by two-tailed paired t-tests in each 693
species. 694
695
Analysis of the neighboring nucleotide preference for A-to-I editing 696
The Two Sample Logo software (v1.21) 78 was used to analyze the neighboring nucleotide 697
preference of A-to-I editing sites with parameters -K N -T binomial -C nucleo_weblogo -y. 698
Specifically, for each species, the eleven-nucleotide sequences with the edited adenosines in 699
the center were used as the foreground dataset, while the eleven-nucleotide sequences centered 700
by the transcribed (RNA depth ≥ 2X) but unedited adenosines locating within ± 50 nt of the 701
edited adenosines, were used as the background dataset for Two Sample Logo analysis. 702
Nucleotides were plotted using the size of the nucleotide that was proportional to the difference 703
between the foreground and background datasets. 704
705
Annotation of repetitive elements 706
Considering that the repetitive elements of many species investigated in this study are either 707
not well annotated and/or not publicly available, we re-annotated the repetitive elements of all 708
the sampled species except human using the same strategy. Repetitive elements of the human 709
genome (GRCh38/hg38) have been well annotated and thus were downloaded from UCSC 710
directly. 711
author/funder. All rights reserved. No reuse allowed without permission. The copyright holder for this preprint (which was not peer-reviewed) is the. https://doi.org/10.1101/2020.01.19.911685doi: bioRxiv preprint

Repetitive elements in the genome assembly of other sampled species were identified by 712
homology searches against known repeat databases and de novo predictions as previously 713
described 79. Briefly, we carried out homology searches for known repetitive elements in each 714
genome assembly by screening the Repbase-derived RepeatMasker libraries with 715
RepeatMasker (v4.0.6; setting -nolow -no_is -norna -engine ncbi) 80 and the transposable 716
element protein database with RepeatProteinMask (an application within the RepeatMasker 717
package; setting -noLowSimple -pvalue 0.0001 -engine ncbi). For de novo prediction, 718
RepeatModeler (v1.0.8) 81 was executed on the genome assembly to build a de novo repeat 719
library for each species, respectively. Then RepeatMasker was employed to align the genome 720
sequences to the de novo library for identifying repetitive elements. We also searched each 721
genome assembly for tandem repeats using Tandem Repeats Finder (v4.07) 82 with parameters 722
Match=2 Mismatch=7 Delta=7 PM=80 PI=10 Minscore=50 MaxPeriod=2000. To confirm 723
the reliability of our annotations, we compared our repeat annotation results of the fruit fly 724
Drosophila melanogaster and the zebrafish Danio rerio with those downloaded from UCSC 725
and observed good consistency (Supplementary Fig. 3a,b). 726
727
Calculation of RNA-editing density for different genomic elements 728
To compare the probability of different genomic elements targeted by A-to-I editing, including 729
the protein-coding genes related elements (5’-UTR, CDS, intron and 3’-UTR) and the repeat-730
associated elements (SINE, LINE, LTR, DNA transposon, Helitron, tandem repeat and other 731
unclassified repeat loci), we calculated the A-to-I editing density for each type of genomic 732
element by counting the number of A-to-I editing sites located in this element type, out of the 733
total number of transcribed adenosines (RNA depth ≥ 2X) from this element type. The editing 734
density of each element type was first calculated for each sample of a species separately, then 735
the mean editing density across samples was calculated as the representative value for a species. 736
When calculating the editing-level-weighted editing densities for each element type, an editing 737
site with for example an editing level of 0.1, would be regarded as 0.1 editing site instead of 1 738
editing site, when counting the number of editing sites for an element type. Only editing sites 739
and transcribed adenosines with RNA depth ≥ 10X were used in the weighted analysis. 740
741
Analysis of relationship between repeat divergence and editing density 742
The divergence rates of repetitive elements in each species were estimated by RepeatMasker, 743
by comparing the repeat sequences to the ancestral consensus sequences identified by 744
author/funder. All rights reserved. No reuse allowed without permission. The copyright holder for this preprint (which was not peer-reviewed) is the. https://doi.org/10.1101/2020.01.19.911685doi: bioRxiv preprint

RepeatModeler during the repeat annotation process as described above. Only the transcribed 745
repeat loci with no less than 50 nucleotides covered by ≥ 2 RNA reads were used for this 746
analysis. The transcribed repeat loci were first sorted according to divergence rate from the 747
lowest to the highest (i.e. the youngest to oldest), then divided into 10 equal bins with the same 748
transcribed repeat loci in each bin. Next the editing density for each bin was calculated, as the 749
number of A-to-I editing sites located in repeat loci belonging to this bin, divided by the total 750
number of transcribed adenosines (RNA depth ≥ 2X) from the repeat loci in this bin. The 751
editing density of each bin was first calculated for each sample of a species separately, then the 752
mean editing density across samples was calculated as the representative value for a species. 753
The relationships between repeat divergence rate and editing density in all species were 754
displayed by a heatmap as presented in Fig. 3d. 755
756
Estimating the potentials of repeat and non-repeat regions to form dsRNA 757
The potential of repeat and non-repeat genomic regions to form dsRNA was approximatively 758
measured as the ratios of repeat and non-repeat derived genomic sites locating in regions that 759
could find a reverse-complement alignment in nearby regions. Briefly, we randomly selected 760
100,000 sites from the genomic regions annotated as repeat and non-repeat, respectively. Then, 761
we extracted a 401 nt sequence centered on each randomly selected site and searched this query 762
sequence against a 4001 nt sequence centered on the corresponding repeat or non-repeat 763
genomic site using BLASTN (v2.2.26) with parameters -F F -e 1e-2. Then a repeat or non-764
repeat derived genomic site was regarded as locating in a potential dsRNA region formed by 765
intramolecular folding, if a reverse-complement alignment was detected with identity ≥ 80%, 766
aligned length ≥ 50 nt, and the aligned region of the query sequence spanned this randomly 767
selected site. The ratio of such sites against all randomly selected sites was calculated to 768
represent the potential of repeat or non-repeat regions to form dsRNA in a species, and the 769
same process was iterated for 100 times to estimate the distribution (see Supplementary Fig. 770
4c). 771
772
Analyzing the adaptive potential of recoding editing 773
Recoding editing sites were identified as the sites where the editing events could cause 774
nonsynonymous changes in protein-coding regions. Given that the numbers of recoding sites 775
were generally small in most species, for the evolutionary analysis of recoding editing, 776
recoding sites from different samples of a species were first combined according to their 777
author/funder. All rights reserved. No reuse allowed without permission. The copyright holder for this preprint (which was not peer-reviewed) is the. https://doi.org/10.1101/2020.01.19.911685doi: bioRxiv preprint

genomic locations. The editing level of a combined recoding site was measured as the mean 778
editing level across samples with RNA coverage ≥ 10X in this position. 779
To examine the adaptive potential of recoding editing in a species, we compared the frequency 780
of nonsynonymous editing (ƒn) to the frequency of nonsynonymous editing (ƒs) as previously 781
described 35. Specifically, ƒn was calculated as the number of A-to-I editing sites causing 782
nonsynonymous changes (n), divided by the number of potential nonsynonymous adenosine 783
sites (RNA depth ≥ 2X in at least one sample) if A is replaced with G (N) from the genes with 784
≥ 1 editing site in their coding regions. ƒs was calculated as the number of A-to-I editing sites 785
causing synonymous changes (s), divided by the number of potential synonymous adenosine 786
sites (RNA depth ≥ 2X in at least one sample) if A is replaced with G (S) from the same set of 787
genes. If recoding editing is generally adaptive in a species, one would expect that ƒn is 788
significantly larger than ƒs in this species. The significance level for the difference between ƒn 789
and ƒs in a species was assessed by a two-tailed Fisher's exact test using the values of n, N, s 790
and S from this species. 791
To compare the adaptive potential for recoding sites with different editing levels, the same 792
analyses were performed for recoding sites with relatively high (≥ 0.2) and low (< 0.2) editing 793
levels separately, using the sites with RNA depth ≥ 10X and the genes with one or more editing 794
sites achieving this RNA depth in their coding regions. 795
796
Analyzing the evolutionary conservation of recoded genes 797
Recoded genes were defined as the protein-coding genes with at least one recoding site. To 798
evaluate the evolutionary conservation of the recoded genes in the seventeen species with 799
reliable A-to-I editing (the target species), we identified the orthologous gene of each recoded 800
gene in a closely-related species with a publicly available reference genome (the related 801
species), and calculated the dN/dS ratio (i.e. the ratio of the number of nonsynonymous 802
substitutions per nonsynonymous site (dN) to the number of synonymous substitutions per 803
synonymous site (dS)) for each orthologous pair. The closely-related species chosen for each 804
target species is presented in Supplementary Table 6. 805
Briefly, all the protein sequences from each target species were first aligned to its related 806
species genome using TBLASTN (blast-2.2.26) with parameters -F F -e 1e-5, followed by 807
chaining the syntenic blocks and picking one candidate locus for each target-species protein 808
with the highest TBLASTN bit score by in-house scripts. Then the genomic sequences of 809
author/funder. All rights reserved. No reuse allowed without permission. The copyright holder for this preprint (which was not peer-reviewed) is the. https://doi.org/10.1101/2020.01.19.911685doi: bioRxiv preprint

these candidate loci together with 2 kb flanking sequences, were extracted from the related-810
species genome and submitted to GeneWise (wise-2.4.1) to determine the protein sequences 811
by aligning the target-species proteins to these related-species genomic sequences. The 812
related-species proteins were then aligned back to all the protein sequences of the target 813
species using BLASTP (blast-2.2.26) with parameters -F F -e 1e-5, and only those hitting the 814
expected proteins in the target species with the highest BLASTP bit score were identified as 815
orthologous proteins in related species. Next, the protein sequences of each orthologous pair 816
were aligned using MAFFT (v6.923) 83 with parameters --maxiterate 1000 –localpair, 817
followed by the replacement of the amino acids by their corresponding codons for each species. 818
The orthologous pairs of which the MAFFT alignments with invalid sites (i.e. presented as “-” 819
in one of the two aligned sequences) exceeding 50% of the alignment length were discarded. 820
Then the dN/dS ratio for each qualified orthologous pair was calculated using PAML (v4.9i) 76 821
with the Yang & Nielsen (2000) method 77. 822
Finally, the genes of each target species were divided into three groups according to the degree 823
of evolutionary conservation, and the observed/expected number of recoded genes among 824
different groups was calculated. Specifically, group I was comprised of genes with orthologs 825
in closely-related species and dN/dS ratios lower than the median value among all orthologous 826
pairs, representing the most conserved group; Group II was comprised of genes with orthologs 827
in closely-related species with dN/dS ratios higher than the median value among all orthologous 828
pairs, representing the moderately conserved group; Group III was comprised of all the 829
remaining genes that cannot find orthologs in closely-related species, representing the least 830
conserved group. The expected probability of a gene being recoded in a species was estimated 831
as the number of recoded genes out of all transcribed protein-coding genes (RPKM > 1 in at 832
least one sample) in this species, and the expected number of recoded genes in each 833
conservation group was calculated as the number of genes in this group multiplied by the 834
expected probability of a gene being recoded. The significance level for the difference between 835
observed and expected numbers in each conservation group was estimated by a two-tailed 836
binomial test. 837
838
Functional annotation and enrichment analysis of recoded genes 839
GO annotations for the protein-coding genes were downloaded from Ensembl (Caenorhabditis 840
elegans, Ciona savignyi, Danio rerio and Homo sapiens) or Ensembl Metazoa (Mnemiopsis 841
leidyi, Amphimedon queenslandica, Drosophila melanogaster, Drosophila simulans, 842
author/funder. All rights reserved. No reuse allowed without permission. The copyright holder for this preprint (which was not peer-reviewed) is the. https://doi.org/10.1101/2020.01.19.911685doi: bioRxiv preprint

Crassostrea gigas, Octopus bimaculoides, Nematostella vectensis and Strongylocentrotus 843
purpuratus) via the BioMart function. For Hydra vulgaris, Aplysia californica, Acromyrmex 844
echinatior, Ptychodera flava and Branchiostoma belcheri that do not have publicly available 845
GO annotations, we first aligned all the proteins of these species to the UniProt database 846
(release-2019_04) using BLASTP (blast-2.2.26) with parameters -F F -e 1e-5. Then the best 847
hit of each query gene was retained based on its BLASTP bit score, and the GO annotations 848
of this best hit was assigned to the query gene. 849
GO enrichment analysis was conducted for genes with at least one recoding site of which the 850
mean editing level across samples > 0.1, or the editing event shared by at least two samples, in 851
order to reduce the influence of nonadaptive recoding sites that are likely the by-products of 852
promiscuous ADAR activity. Hypergeometric tests were employed to examine whether the 853
recoded genes of a species was enriched in a specific GO term in relation to background genes 854
as previously described 31, by comparing the number of recoded genes annotated to this GO 855
term, the number of recoded genes not annotated to this GO term, the number of background 856
genes (i.e. the protein-coding genes with RPKM > 1 in at least one sample after excluding the 857
recoded genes in the species) annotated to this GO term, and the number of background genes 858
not annotated to this GO term. P-values were adjusted for multiple testing by applying FDR 69, 859
and the GO terms with adjusted p-values < 0.05 in at least three species (Note: GO terms shared 860
by D. melanogaster and D. simulans were only counted once here) were considered as the 861
general functional categories preferred by metazoan recoding editing. 862
863
Identification of conserved recoding events shared by multiple species 864
To identify recoding events shared by two or more species, we first identified the orthologous 865
groups of genes (i.e. gene families) from the seventeen metazoan species with reliable RNA 866
editing using OrthoFinder (v2.2.7) 84 with default parameters. For the gene families that 867
contained recoded genes from multiple species, we aligned the protein sequences of the 868
recoded genes using MUSCLE (v3.8.31) 85 with parameter -maxiters 1000 and filtered poorly 869
aligned positions using Gblocks (v0.91b) 86. Next recoding events occurring in the same 870
position in the alignments and causing the same amino acid changes among at least two species 871
were identified as conserved recoding events. Recoding events only shared by D. melanogaster 872
and D. simulans were removed. Only recoding sites in which the mean editing levels were no 873
less than 0.1 across samples of a species, or were shared by at least two samples, were used in 874
author/funder. All rights reserved. No reuse allowed without permission. The copyright holder for this preprint (which was not peer-reviewed) is the. https://doi.org/10.1101/2020.01.19.911685doi: bioRxiv preprint

this analysis. The complete list of recoding events shared by multiple species was presented in 875
Supplementary Table 5. 876
877
Data and code availability 878
The raw sequencing reads generated in this study are deposited in NCBI under the BioProject 879
accession PRJNA557895 and are also deposited in the CNGB Nucleotide Sequence Archive 880
(CNSA) with accession number CNP0000504 (https://db.cngb.org/cnsa/). RNA-editing sites, 881
refined gene annotations and repeat annotations used in this study are deposited in the figshare 882
repository under the link https://doi.org/10.6084/m9.figshare.10050437. Codes are available 883
upon request. 884
885
Acknowledgements 886
We are grateful to Nicole King (University of California, Berkeley, USA) for providing the 887
frozen stocks of S. rosetta and M. brevicollis and the protocols for starting and maintaining the 888
cultures, Bernard Degnan and Kathrein E. Roper (University of Queensland, Australia) for 889
providing the biopsies of A. queenslandica, Leo W. Buss (Yale University, USA) for providing 890
the starter culture of T. adhaerens and the protocol for maintaining the culture, Robert E. Steele 891
(University of California, Irvine, USA) for providing the H. vulgaris samples, Ulrich Technau 892
(University of Vienna, Austria) for providing the N. vectensis samples, Xiaotong Wang 893
(Ludong University, China) for providing the C. gigas samples, Qi Zhou (Zhejiang University, 894
China) for providing the D. melanogaster and D. simulans samples, Bo Dong (Ocean 895
University of China) for providing the C. savignyi samples, and Changwei Shao for providing 896
the D. rerio samples. This work was supported by the National Natural Science Foundation of 897
China (No. 31501057), the Science, Technology and Innovation Commission of Shenzhen 898
Municipality (No. JCYJ20170817150239127 and JCYJ20170817150721687), the Strategic 899
Priority Research Program of Chinese Academy of Sciences (No. XDB31020000 and 900
XDB13000000), a Lundbeck Foundation Grant (R190-2014-2827) and a Carlsberg Foundation 901
grant (No. CF16-0663) to G.Z., and a European Research Council Consolidator Grant (ERC-902
2012-Co -616960) to I.R.-T. 903
904
Author Contributions 905
Q.L. and G.Z. conceived the study; M.T.P.G. and Q.L. coordinated the sample collection from 906
different labs around the world; N.L. and L.G. conducted lab work for the culture and collection 907
author/funder. All rights reserved. No reuse allowed without permission. The copyright holder for this preprint (which was not peer-reviewed) is the. https://doi.org/10.1101/2020.01.19.911685doi: bioRxiv preprint

of T. adhaerens samples; M.D.M. conducted lab work for the culture and DNA/RNA extraction 908
of S. rosetta and M. brevicollis; M.A.S. and I.R.-T. conducted lab work for the culture and 909
DNA/RNA extraction of S. arctica and C. owczarzaki; M.Q.M. collected the M. leidyi samples 910
and performed DNA/RNA extraction; Y.-H.S. and J.-K.Y. collected the S. purpuratus, P. flava 911
and B. belcheri samples and performed dissection for S. purpuratus; X.Z. managed library 912
construction and sequencing of all species; P.Z., J.L., H.Y., Y.Z., Q.G., H.T. and X.Z. 913
performed bioinformatic analyses under the supervision of Q.L.; G.Z., N.L., I.R.-T., M.Q.M. 914
and J.-K.Y. contributed reagents and materials; Q.L. and G.Z. wrote the manuscript with the 915
inputs from all authors. All authors read and approved the final manuscript. 916
917
Competing interests 918
The authors declare no competing interests. 919
920
References 921
1 Gott, J. M. & Emeson, R. B. Functions and mechanisms of RNA editing. Annual review 922 of genetics 34, 499-531, doi:10.1146/annurev.genet.34.1.499 (2000). 923
2 Nishikura, K. Functions and regulation of RNA editing by ADAR deaminases. Annual 924 review of biochemistry 79, 321-349, doi:10.1146/annurev-biochem-060208-105251 925 (2010). 926
3 Eisenberg, E. & Levanon, E. Y. A-to-I RNA editing - immune protector and 927 transcriptome diversifier. Nature reviews. Genetics 19, 473-490, doi:10.1038/s41576-928 018-0006-1 (2018). 929
4 Nishikura, K. Editor meets silencer: crosstalk between RNA editing and RNA 930 interference. Nat Rev Mol Cell Biol 7, 919-931, doi:10.1038/nrm2061 (2006). 931
5 Rieder, L. E. & Reenan, R. A. The intricate relationship between RNA structure, editing, 932 and splicing. Semin Cell Dev Biol 23, 281-288, doi:10.1016/j.semcdb.2011.11.004 933 (2012). 934
6 Nishikura, K. A-to-I editing of coding and non-coding RNAs by ADARs. Nat Rev Mol 935 Cell Biol 17, 83-96, doi:10.1038/nrm.2015.4 (2016). 936
7 Behm, M. & Ohman, M. RNA Editing: A Contributor to Neuronal Dynamics in the 937 Mammalian Brain. Trends in genetics : TIG 32, 165-175, doi:10.1016/j.tig.2015.12.005 938 (2016). 939
8 Hwang, T. et al. Dynamic regulation of RNA editing in human brain development and 940 disease. Nature neuroscience 19, 1093-1099, doi:10.1038/nn.4337 (2016). 941
author/funder. All rights reserved. No reuse allowed without permission. The copyright holder for this preprint (which was not peer-reviewed) is the. https://doi.org/10.1101/2020.01.19.911685doi: bioRxiv preprint
9 Jepson, J. E. & Reenan, R. A. RNA editing in regulating gene expression in the brain. 942 Biochimica et biophysica acta 1779, 459-470, doi:10.1016/j.bbagrm.2007.11.009 943 (2008). 944
10 Li, J. B. & Church, G. M. Deciphering the functions and regulation of brain-enriched 945 A-to-I RNA editing. Nature neuroscience 16, 1518-1522, doi:10.1038/nn.3539 (2013). 946
11 Garrett, S. & Rosenthal, J. J. RNA editing underlies temperature adaptation in K+ 947 channels from polar octopuses. Science 335, 848-851, doi:10.1126/science.1212795 948 (2012). 949
12 Rieder, L. E. et al. Dynamic response of RNA editing to temperature in Drosophila. 950 BMC biology 13, 1, doi:10.1186/s12915-014-0111-3 (2015). 951
13 Buchumenski, I. et al. Dynamic hyper-editing underlies temperature adaptation in 952 Drosophila. PLoS genetics 13, e1006931, doi:10.1371/journal.pgen.1006931 (2017). 953
14 Zipeto, M. A., Jiang, Q., Melese, E. & Jamieson, C. H. RNA rewriting, recoding, and 954 rewiring in human disease. Trends Mol Med 21, 549-559, 955 doi:10.1016/j.molmed.2015.07.001 (2015). 956
15 Ben-Aroya, S. & Levanon, E. Y. A-to-I RNA Editing: An Overlooked Source of Cancer 957 Mutations. Cancer Cell 33, 789-790, doi:10.1016/j.ccell.2018.04.006 (2018). 958
16 Maas, S., Kawahara, Y., Tamburro, K. M. & Nishikura, K. A-to-I RNA editing and 959 human disease. RNA biology 3, 1-9 (2006). 960
17 Rice, G. I. et al. Mutations in ADAR1 cause Aicardi-Goutieres syndrome associated 961 with a type I interferon signature. Nat Genet 44, 1243-1248, doi:10.1038/ng.2414 962 (2012). 963
18 Chung, H. et al. Human ADAR1 Prevents Endogenous RNA from Triggering 964 Translational Shutdown. Cell 172, 811-824 e814, doi:10.1016/j.cell.2017.12.038 965 (2018). 966
19 Peng, Z. et al. Comprehensive analysis of RNA-Seq data reveals extensive RNA editing 967 in a human transcriptome. Nature biotechnology 30, 253-260, doi:10.1038/nbt.2122 968 (2012). 969
20 Bazak, L. et al. A-to-I RNA editing occurs at over a hundred million genomic sites, 970 located in a majority of human genes. Genome research, gr. 164749.164113 (2013). 971
21 Ramaswami, G. et al. Identifying RNA editing sites using RNA sequencing data alone. 972 Nature methods 10, 128-132 (2013). 973
22 Picardi, E. et al. Profiling RNA editing in human tissues: towards the inosinome Atlas. 974 Sci Rep 5, 14941, doi:10.1038/srep14941 (2015). 975
23 Bahn, J. H. et al. Accurate identification of A-to-I RNA editing in human by 976 transcriptome sequencing. Genome Res 22, 142-150, doi:10.1101/gr.124107.111 977 (2012). 978
author/funder. All rights reserved. No reuse allowed without permission. The copyright holder for this preprint (which was not peer-reviewed) is the. https://doi.org/10.1101/2020.01.19.911685doi: bioRxiv preprint
24 Danecek, P. et al. High levels of RNA-editing site conservation amongst 15 laboratory 979 mouse strains. Genome Biol 13, 26, doi:10.1186/gb-2012-13-4-r26 (2012). 980
25 Tan, M. H. et al. Dynamic landscape and regulation of RNA editing in mammals. 981 Nature 550, 249-254, doi:10.1038/nature24041 (2017). 982
26 Zhao, H. Q. et al. Profiling the RNA editomes of wild-type C. elegans and ADAR 983 mutants. Genome Res 25, 66-75, doi:10.1101/gr.176107.114 (2015). 984
27 St Laurent, G. et al. Genome-wide analysis of A-to-I RNA editing by single-molecule 985 sequencing in Drosophila. Nature structural & molecular biology 20, 1333-1339, 986 doi:10.1038/nsmb.2675 (2013). 987
28 Duan, Y., Dou, S., Luo, S., Zhang, H. & Lu, J. Adaptation of A-to-I RNA editing in 988 Drosophila. PLoS genetics 13, e1006648, doi:10.1371/journal.pgen.1006648 (2017). 989
29 Yu, Y. et al. The Landscape of A-to-I RNA Editome Is Shaped by Both Positive and 990 Purifying Selection. PLoS genetics 12, e1006191, doi:10.1371/journal.pgen.1006191 991 (2016). 992
30 Zhang, R., Deng, P., Jacobson, D. & Li, J. B. Evolutionary analysis reveals regulatory 993 and functional landscape of coding and non-coding RNA editing. PLoS genetics 13, 994 e1006563, doi:10.1371/journal.pgen.1006563 (2017). 995
31 Li, Q. et al. Caste-specific RNA editomes in the leaf-cutting ant Acromyrmex echinatior. 996 Nat Commun 5, 4943, doi:10.1038/ncomms5943 (2014). 997
32 Porath, H. T. et al. RNA editing is abundant and correlates with task performance in a 998 social bumblebee. Nature communications 10, 1605 (2019). 999
33 Alon, S. et al. The majority of transcripts in the squid nervous system are extensively 1000 recoded by A-to-I RNA editing. eLife 4, doi:10.7554/eLife.05198 (2015). 1001
34 Liscovitch-Brauer, N. et al. Trade-off between Transcriptome Plasticity and Genome 1002 Evolution in Cephalopods. Cell 169, 191-202 e111, doi:10.1016/j.cell.2017.03.025 1003 (2017). 1004
35 Xu, G. & Zhang, J. Human coding RNA editing is generally nonadaptive. Proceedings 1005 of the National Academy of Sciences of the United States of America 111, 3769-3774, 1006 doi:10.1073/pnas.1321745111 (2014). 1007
36 Grice, L. F. & Degnan, B. M. The origin of the ADAR gene family and animal RNA 1008 editing. BMC evolutionary biology 15, 4, doi:10.1186/s12862-015-0279-3 (2015). 1009
37 Albertin, C. B. et al. The octopus genome and the evolution of cephalopod neural and 1010 morphological novelties. Nature 524, 220-224, doi:10.1038/nature14668 (2015). 1011
38 Lang, B. F., O'Kelly, C., Nerad, T., Gray, M. W. & Burger, G. The closest unicellular 1012 relatives of animals. Curr Biol 12, 1773-1778 (2002). 1013
39 Wang, Z. et al. RES-Scanner: a software package for genome-wide identification of 1014 RNA-editing sites. Gigascience 5, 37, doi:10.1186/s13742-016-0143-4 (2016). 1015
author/funder. All rights reserved. No reuse allowed without permission. The copyright holder for this preprint (which was not peer-reviewed) is the. https://doi.org/10.1101/2020.01.19.911685doi: bioRxiv preprint

40 Porath, H. T., Carmi, S. & Levanon, E. Y. A genome-wide map of hyper-edited RNA 1016 reveals numerous new sites. Nat Commun 5, 4726, doi:10.1038/ncomms5726 (2014). 1017
41 Srivastava, M. et al. The Trichoplax genome and the nature of placozoans. Nature 454, 1018 955-960, doi:10.1038/nature07191 (2008). 1019
42 Porath, H. T., Knisbacher, B. A., Eisenberg, E. & Levanon, E. Y. Massive A-to-I RNA 1020 editing is common across the Metazoa and correlates with dsRNA abundance. Genome 1021 Biol 18, 185, doi:10.1186/s13059-017-1315-y (2017). 1022
43 Carmichael, G. G. Antisense starts making more sense. Nature biotechnology 21, 371-1023 372, doi:10.1038/nbt0403-371 (2003). 1024
44 Neeman, Y., Dahary, D., Levanon, E. Y., Sorek, R. & Eisenberg, E. Is there any sense 1025 in antisense editing? Trends in genetics : TIG 21, 544-547, 1026 doi:10.1016/j.tig.2005.08.005 (2005). 1027
45 Morita, Y. et al. Human endonuclease V is a ribonuclease specific for inosine-1028 containing RNA. Nat Commun 4, 2273, doi:10.1038/ncomms3273 (2013). 1029
46 Mah, J. L. & Leys, S. P. Think like a sponge: The genetic signal of sensory cells in 1030 sponges. Dev Biol 431, 93-100, doi:10.1016/j.ydbio.2017.06.012 (2017). 1031
47 Marks, F., Klingmüller, U. & Müller-Decker, K. Cellular signal processing: an 1032 introduction to the molecular mechanisms of signal transduction. (Garland Science, 1033 2008). 1034
48 Stulic, M. & Jantsch, M. F. Spatio-temporal profiling of Filamin A RNA-editing reveals 1035 ADAR preferences and high editing levels outside neuronal tissues. RNA biology 10, 1036 1611-1617, doi:10.4161/rna.26216 (2013). 1037
49 Gray, M. W. Evolutionary origin of RNA editing. Biochemistry 51, 5235-5242, 1038 doi:10.1021/bi300419r (2012). 1039
50 Bian, Z., Ni, Y., Xu, J. R. & Liu, H. A-to-I mRNA editing in fungi: occurrence, function, 1040 and evolution. Cell Mol Life Sci 76, 329-340, doi:10.1007/s00018-018-2936-3 (2019). 1041
51 Erwin, D. H. et al. The Cambrian conundrum: early divergence and later ecological 1042 success in the early history of animals. Science 334, 1091-1097, 1043 doi:10.1126/science.1206375 (2011). 1044
52 Merkle, T. et al. Precise RNA editing by recruiting endogenous ADARs with antisense 1045 oligonucleotides. Nature biotechnology 37, 133-138, doi:10.1038/s41587-019-0013-6 1046 (2019). 1047
53 Qu, L. et al. Programmable RNA editing by recruiting endogenous ADAR using 1048 engineered RNAs. Nature biotechnology, doi:10.1038/s41587-019-0178-z (2019). 1049
54 Levine, M. & Tjian, R. Transcription regulation and animal diversity. Nature 424, 147-1050 151, doi:10.1038/nature01763 (2003). 1051
author/funder. All rights reserved. No reuse allowed without permission. The copyright holder for this preprint (which was not peer-reviewed) is the. https://doi.org/10.1101/2020.01.19.911685doi: bioRxiv preprint

55 Chen, M. & Manley, J. L. Mechanisms of alternative splicing regulation: insights from 1052 molecular and genomics approaches. Nat Rev Mol Cell Biol 10, 741-754, 1053 doi:10.1038/nrm2777 (2009). 1054
56 Chen, L., Bush, S. J., Tovar-Corona, J. M., Castillo-Morales, A. & Urrutia, A. O. 1055 Correcting for differential transcript coverage reveals a strong relationship between 1056 alternative splicing and organism complexity. Mol Biol Evol 31, 1402-1413, 1057 doi:10.1093/molbev/msu083 (2014). 1058
57 Liddicoat, B. J. et al. RNA editing by ADAR1 prevents MDA5 sensing of endogenous 1059 dsRNA as nonself. Science 349, 1115-1120, doi:10.1126/science.aac7049 (2015). 1060
58 Misof, B. et al. Phylogenomics resolves the timing and pattern of insect evolution. 1061 Science 346, 763-767, doi:10.1126/science.1257570 (2014). 1062
59 Fletcher, D. A. & Mullins, R. D. Cell mechanics and the cytoskeleton. Nature 463, 485-1063 492, doi:10.1038/nature08908 (2010). 1064
60 Ramaswami, G. et al. Accurate identification of human Alu and non-Alu RNA editing 1065 sites. Nat Methods 9, 579-581, doi:10.1038/nmeth.1982 (2012). 1066
61 Chen, J., Li, X., Zhong, H., Meng, Y. & Du, H. Systematic comparison of germline 1067 variant calling pipelines cross multiple next-generation sequencers. Sci Rep 9, 9345, 1068 doi:10.1038/s41598-019-45835-3 (2019). 1069
62 Patch, A. M. et al. Germline and somatic variant identification using BGISEQ-500 and 1070 HiSeq X Ten whole genome sequencing. PloS one 13, e0190264, 1071 doi:10.1371/journal.pone.0190264 (2018). 1072
63 Mak, S. S. T. et al. Comparative performance of the BGISEQ-500 vs Illumina 1073 HiSeq2500 sequencing platforms for palaeogenomic sequencing. Gigascience 6, 1-13, 1074 doi:10.1093/gigascience/gix049 (2017). 1075
64 Chen, Y. et al. SOAPnuke: a MapReduce acceleration-supported software for 1076 integrated quality control and preprocessing of high-throughput sequencing data. 1077 Gigascience 7, 1-6, doi:10.1093/gigascience/gix120 (2018). 1078
65 Walker, B. J. et al. Pilon: an integrated tool for comprehensive microbial variant 1079 detection and genome assembly improvement. PloS one 9, e112963, 1080 doi:10.1371/journal.pone.0112963 (2014). 1081
66 Li, H. Aligning sequence reads, clone sequences and assembly contigs with BWA-1082 MEM. arXiv preprint arXiv:1303.3997 (2013). 1083
67 Li, H. & Durbin, R. Fast and accurate short read alignment with Burrows-Wheeler 1084 transform. Bioinformatics 25, 1754-1760, doi:10.1093/bioinformatics/btp324 (2009). 1085
68 Parkhomchuk, D. et al. Transcriptome analysis by strand-specific sequencing of 1086 complementary DNA. Nucleic acids research 37, e123, doi:10.1093/nar/gkp596 (2009). 1087
author/funder. All rights reserved. No reuse allowed without permission. The copyright holder for this preprint (which was not peer-reviewed) is the. https://doi.org/10.1101/2020.01.19.911685doi: bioRxiv preprint

69 Benjamini, Y., Drai, D., Elmer, G., Kafkafi, N. & Golani, I. Controlling the false 1088 discovery rate in behavior genetics research. Behavioural brain research 125, 279-284 1089 (2001). 1090
70 Kim, D., Langmead, B. & Salzberg, S. L. HISAT: a fast spliced aligner with low 1091 memory requirements. Nat Methods 12, 357-360, doi:10.1038/nmeth.3317 (2015). 1092
71 Robinson, M. D. & Oshlack, A. A scaling normalization method for differential 1093 expression analysis of RNA-seq data. Genome Biol 11, R25, doi:10.1186/gb-2010-11-1094 3-r25 (2010). 1095
72 Pertea, M. et al. StringTie enables improved reconstruction of a transcriptome from 1096 RNA-seq reads. Nature biotechnology 33, 290-295, doi:10.1038/nbt.3122 (2015). 1097
73 Altschul, S. F., Gish, W., Miller, W., Myers, E. W. & Lipman, D. J. Basic local 1098 alignment search tool. Journal of molecular biology 215, 403-410, doi:10.1016/S0022-1099 2836(05)80360-2 (1990). 1100
74 Birney, E., Clamp, M. & Durbin, R. GeneWise and Genomewise. Genome Res 14, 988-1101 995, doi:10.1101/gr.1865504 (2004). 1102
75 Kumar, S., Stecher, G. & Tamura, K. MEGA7: Molecular Evolutionary Genetics 1103 Analysis Version 7.0 for Bigger Datasets. Mol Biol Evol 33, 1870-1874, 1104 doi:10.1093/molbev/msw054 (2016). 1105
76 Yang, Z. PAML 4: phylogenetic analysis by maximum likelihood. Mol Biol Evol 24, 1106 1586-1591, doi:10.1093/molbev/msm088 (2007). 1107
77 Yang, Z. & Nielsen, R. Estimating synonymous and nonsynonymous substitution rates 1108 under realistic evolutionary models. Mol Biol Evol 17, 32-43, 1109 doi:10.1093/oxfordjournals.molbev.a026236 (2000). 1110
78 Vacic, V., Iakoucheva, L. M. & Radivojac, P. Two Sample Logo: a graphical 1111 representation of the differences between two sets of sequence alignments. 1112 Bioinformatics 22, 1536-1537, doi:10.1093/bioinformatics/btl151 (2006). 1113
79 Cai, H. et al. A draft genome assembly of the solar-powered sea slug Elysia chlorotica. 1114 Sci Data 6, 190022, doi:10.1038/sdata.2019.22 (2019). 1115
80 Smit, A. F., Hubley, R. & Green, P. Available fom http://www.repeatmasker.org. (26 1116 July 2018 date last accessed). 1117
81 Smit, A. & Hubley, R. Available fom http://www.repeatmasker.org/RepeatModeler/. 1118 (26 July 2018 date last accessed). 1119
82 Benson, G. Tandem repeats finder: a program to analyze DNA sequences. Nucleic acids 1120 research 27, 573-580 (1999). 1121
83 Katoh, K., Misawa, K., Kuma, K. & Miyata, T. MAFFT: a novel method for rapid 1122 multiple sequence alignment based on fast Fourier transform. Nucleic acids research 1123 30, 3059-3066, doi:10.1093/nar/gkf436 (2002). 1124
author/funder. All rights reserved. No reuse allowed without permission. The copyright holder for this preprint (which was not peer-reviewed) is the. https://doi.org/10.1101/2020.01.19.911685doi: bioRxiv preprint

84 Emms, D. M. & Kelly, S. OrthoFinder: solving fundamental biases in whole genome 1125 comparisons dramatically improves orthogroup inference accuracy. Genome Biol 16, 1126 157, doi:10.1186/s13059-015-0721-2 (2015). 1127
85 Edgar, R. C. MUSCLE: multiple sequence alignment with high accuracy and high 1128 throughput. Nucleic acids research 32, 1792-1797, doi:10.1093/nar/gkh340 (2004). 1129
86 Castresana, J. Selection of conserved blocks from multiple alignments for their use in 1130 phylogenetic analysis. Mol Biol Evol 17, 540-552, 1131 doi:10.1093/oxfordjournals.molbev.a026334 (2000). 1132
87 Laumer, C. E. et al. Revisiting metazoan phylogeny with genomic sampling of all phyla. 1133 Proceedings. Biological sciences / The Royal Society 286, 20190831, 1134 doi:10.1098/rspb.2019.0831 (2019). 1135
88 Ryan, J. F. et al. The genome of the ctenophore Mnemiopsis leidyi and its implications 1136 for cell type evolution. Science 342, 1242592, doi:10.1126/science.1242592 (2013). 1137
89 Simion, P. et al. A Large and Consistent Phylogenomic Dataset Supports Sponges as 1138 the Sister Group to All Other Animals. Curr Biol 27, 958-967, 1139 doi:10.1016/j.cub.2017.02.031 (2017). 1140
1141 1142
author/funder. All rights reserved. No reuse allowed without permission. The copyright holder for this preprint (which was not peer-reviewed) is the. https://doi.org/10.1101/2020.01.19.911685doi: bioRxiv preprint
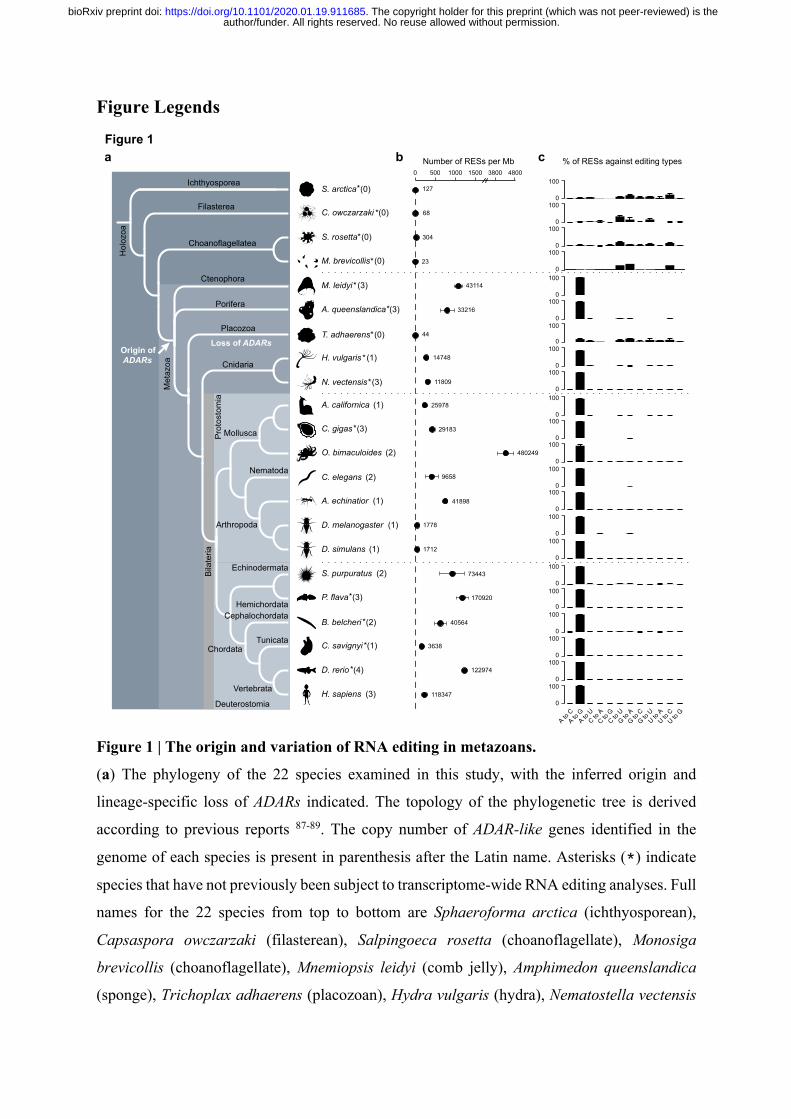
Figure Legends
Figure 1 | The origin and variation of RNA editing in metazoans.
(a) The phylogeny of the 22 species examined in this study, with the inferred origin and
lineage-specific loss of ADARs indicated. The topology of the phylogenetic tree is derived
according to previous reports 87-89. The copy number of ADAR-like genes identified in the
genome of each species is present in parenthesis after the Latin name. Asterisks (*) indicate
species that have not previously been subject to transcriptome-wide RNA editing analyses. Full
names for the 22 species from top to bottom are Sphaeroforma arctica (ichthyosporean),
Capsaspora owczarzaki (filasterean), Salpingoeca rosetta (choanoflagellate), Monosiga
brevicollis (choanoflagellate), Mnemiopsis leidyi (comb jelly), Amphimedon queenslandica
(sponge), Trichoplax adhaerens (placozoan), Hydra vulgaris (hydra), Nematostella vectensis
Hol
ozoa
Met
azoa
Placozoa
Porifera
Ctenophora
Cnidaria
Deuterostomia
TunicataChordata
Vertebrata
Echinodermata
Prot
osto
mia
Nematoda
H. sapiens
D. rerio
C. savignyi
B. belcheri
P. flava
S. purpuratus
D. melanogaster
A. echinatior
C. elegans
O. bimaculoides
C. gigas
A. californica
N. vectensis
H. vulgaris
T. adhaerens
A. queenslandica
M. leidyi
M. brevicollis
S. rosetta
C. owczarzaki
S. arctica
Choanoflagellatea
Filasterea
Ichthyosporea
D. simulans
Bila
teria
Cephalochordata
Arthropoda
Mollusca
Origin ofADARs
Loss of ADARs
Number of RESs per Mb
127
68
304
23
43114
33216
44
14748
11809
25978
29183
480249
9658
41898
1778
1712
73443
170920
40564
3638
122974
118347
% of RESs against editing types
(0)
(0)
(0)
(0)
(3)
(3)
(0)
(1)
(3)
(1)
(3)
(2)
(2)
(1)
(1)
(1)
(2)
(3)
(2)
(1)
(4)
(3)
A to CA to
GA to
UC to
AC to
GC to
UG to
AG to
CG to
UU to
AU to
CU to
G
0
100
0
100
0
100
0
100
0
100
0
100
0
100
0
100
0
100
0
100
0
100
0
100
0
100
0
100
0
100
0
100
0
100
0
100
0
100
0
100
0
100
0
100
*
*
*
*
*
*
*
*
*
*
*
*
*
*
a b c
Hemichordata
0 500 1000 1500 3800 4800
Figure 1
author/funder. All rights reserved. No reuse allowed without permission. The copyright holder for this preprint (which was not peer-reviewed) is the. https://doi.org/10.1101/2020.01.19.911685doi: bioRxiv preprint
(sea anemone), Aplysia californica (sea hare), Crassostrea gigas (oyster), Octopus
bimaculoides (octopus), Caenorhabditis elegans (roundworm), Acromyrmex echinatior (ant),
Drosophila melanogaster (fruit fly), Drosophila simulans (fruit fly), Strongylocentrotus
purpuratus (sea urchin), Ptychodera flava (acorn worm), Branchiostoma belcheri (lancelet),
Ciona savignyi (sea squirt), Danio rerio (zebrafish) and Homo sapiens (human). (b) The
occurrence rate of RNA editing in each species, which was measured as the number of RNA-
editing sites per million transcribed genomic sites (RNA depth ≥ 2X). The mean number of
editing sites identified in each species is presented on the right of each dot. (c) Percentage of
editing sites across the 12 possible types of nucleotide substitutions. Error bars in panels b and
c represent s.d. across samples.
author/funder. All rights reserved. No reuse allowed without permission. The copyright holder for this preprint (which was not peer-reviewed) is the. https://doi.org/10.1101/2020.01.19.911685doi: bioRxiv preprint

Figure 2 | The structure and sequence preferences of A-to-I editing in metazoans.
(a) Percentage of A-to-I editing sites locating in dsRNA regions potentially formed by
intramolecular folding of pre-mRNA, measured as the proportion of sites locating in a region
(± 200 nt centered on the edited adenosine) that shows a reverse-complement alignment
(identity ≥ 80% and aligned length ≥ 50 nt) within its flanking sequences (± 2 knt centered on
the edited adenosine). Control sites were randomly selected transcribed adenosines with the
same number and comparable RNA depth of the A-to-I editing sites in each sample of each
species (see Methods for details). (b) Percentage of A-to-I editing sites locating in dsRNA
regions potentially formed by intermolecular hybridization of sense-antisense transcripts,
measured as the proportion of sites locating in a region (± 50 nt centered on the edited
adenosine) with transcription signal (RNA depth ≥ 2X along >50% of the region) in the both
strands. Control sites were the same set of adenosine sites used in panel a. (c) Percentage of A-
0 25 50 75 100% of sites in cluster
d
*****
********
*****
****
******
******
****
******
Control sitesA-to-I sites
0 25 50 75% of sites in dsRNA
Control sitesA-to-I sites
M. lei.A. que.H. vul.
N. vec.
C. ele.
D. mel.D. sim.
A. ech.
C. gig.A. cal.
O. bim.
P. fla.S. pur.
B. bel.C. sav.D. rer.
H. sap.
a
***
****
******
******
******
***
**
***
**
*
**
0 20 40 60% of sites in dsRNA
b
***
**
**
*
*
*
*
*
Control sitesA-to-I sites
Sense
Antisense
M. lei.A. que.H. vul.N. vec.
C. ele.
D. mel.D. sim.
A. ech.
C. gig.A. cal.
O. bim.
P. fla.S. pur.
B. bel.C. sav.D. rer.
H. sap.
I I I I Ie
0
c
25 50 75% of sites in dsRNA
By sense-antisense pairing
By both mechanisms
By intramolecular folding
M. lei.A. que.H. vul.N. vec.
C. ele.
D. mel.D. sim.
A. ech.
C. gig.A. cal.
O. bim.
P. fla.S. pur.
B. bel.C. sav.D. rer.
H. sap.
Arthropoda
Nematoda
Mollusca
Deuterostomia
Cnidaria
(A. ech, D. mel, D. sim)
(A. cal, C. gig, O. bim)
(S. pur, P. fla, B. bel, C. sav, D. rer, H. sap)
(C. ele)
Porifera
Ctenophora
(H. vul, N. vec)
(A. que)
(M. lei)
M. lei.A. que.H. vul.
N. vec.
C. ele.
D. mel.D. sim.
A. ech.
C. gig.A. cal.
O. bim.
P. fla.S. pur.
B. bel.C. sav.D. rer.
H. sap.
GAUGACGAACAUGAGCACCAACAGAAUAACUAUAAAUACUAAAAGUAG
í� í� í� 0 1 2Log (Frequency among edited As/
Frequency among unedited As)
f
2
UAU
GG
AG
C
GC
AU
A
UAU
GG
AAC
GA
CU
A
U
CUA
UGG
AG
AC
GA
UU
C
UAU
AG
G
A
AGAC
GC
UU
CU
AU G
AAG
AG
AC
G UC
U
U
CUA
GA
C
AGG
CCU
U
CUU
AAA
G
AG
AC
GC
UC
U
Figure 2
author/funder. All rights reserved. No reuse allowed without permission. The copyright holder for this preprint (which was not peer-reviewed) is the. https://doi.org/10.1101/2020.01.19.911685doi: bioRxiv preprint

to-I editing sites locating in dsRNA regions, either potentially formed by intramolecular
folding of pre-mRNA, or by intermolecular hybridization of sense-antisense transcripts or by
both mechanisms. (d) Percentage of A-to-I editing sites occurring in clusters. A cluster contains
≥ 3 A-to-I editing sites of which the distance for two adjacent sites ≤ 30 nt. Control sites were
the same set of adenosine sites used in panel a. (e) Neighboring nucleotide preference of the
edited adenosines in comparison to the unedited transcribed adenosines within ± 50 nt of the
edited adenosines. For the lineages with more than one representative species, the same number
of editing sites were randomly selected according to the species with the lowest number of
editing sites in this lineage. Nucleotides were plotted using the size of the nucleotide that was
proportional to the difference between the edited and unedited datasets, with the upper part
presenting enriched nucleotides in the edited dataset and lower part presenting depleted
nucleotides. (f) The relative frequency of the 16 nucleotide triplets with adenosine in the center
subject to A-to-I editing, measured as the frequency of a triplet observed among all edited
adenosines against the frequency of this triplet observed among all neighboring unedited
adenosines within ± 50 nt of the edited adenosines. Boxplot shows the distribution across the
17 metazoans with ADARs, and nucleotide triplets are ordered according to highest median
value across species to the lowest. Error bars in panels a, b and d represent s.d. across samples,
and asterisks indicate significance levels estimated by two-tailed paired t-tests with “*”
representing p < 0.05, “**” < 0.01 and “***” < 0.001.
author/funder. All rights reserved. No reuse allowed without permission. The copyright holder for this preprint (which was not peer-reviewed) is the. https://doi.org/10.1101/2020.01.19.911685doi: bioRxiv preprint

Figure 3 | The primary genomic targets of metazoan A-to-I editing.
(a) The proportion of A-to-I editing sites versus total A-to-I editing sites in different genomic
regions. Genic regions include untranslated regions (5’-UTR and 3’UTR), CDS and intron of
all protein-coding genes. Repeats include transposons and tandem repeats annotated for each
species in this study (see Methods). (b) Comparison of A-to-I editing density across different
genomic elements in each species. Editing density of an element was calculated as the number
of A-to-I editing sites locating in this element divided by the number of transcribed adenosines
(RNA depth ≥ 2X) in this element. (c) Comparison of editing density across 5’-UTR, CDS and
3’-UTR. Note the different scales used between panel b and c in order to show the difference
of editing density among genic elements. (d) The negative correlation between the sequence
divergence and editing density of repetitive elements.
0 25 50 75 100
Other genomic regionsNon-repeat genic regions
Repeats inside genic regionsRepeats outside genic regions
M. lei.A. que.H. vul.N. vec.
C. ele.
D. mel.D. sim.
A. ech.
C. gig.A. cal.
O. bim.
P. fla.S. pur.
B. bel.C. sav.D. rer.
H. sap.
% of A-to-I sites in different regions
a b c d
Whole geom
e
Gene body
5'-UTR
CD
S
Intron
3'-UTR
Repeat
LINE
SINE
LTR
DN
A
Helitron
Tandem
Others
í�í�í�0123
Editi
ng d
ensi
ty (Z
-sco
re)
RepeatGene body
M. lei.A. que.H. vul.N. vec.
C. ele.
D. mel.D. sim.
A. ech.
C. gig.A. cal.
O. bim.
P. fla.S. pur.
B. bel.C. sav.D. rer.
H. sap.5'-U
TR
CD
S
3'-UTR
í�
��
0
���
1
Editi
ng d
ensi
ty (Z
-sco
re)
M. lei.A. que.H. vul.·N. vec.
C. ele.
D. mel.D. sim.
A. ech.
C. gig.A. cal.
O. bim.
P. fla.S. pur.
B. bel.C. sav.D. rer.
H. sap.
Editi
ng d
ensi
ty (Z
-sco
re)
lowest (young) -> highest (ancient)Repeat divergence
í�
í�
0
1
2M. lei.A. que.H. vul.N. vec.
C. ele.
D. mel.D. sim.
A. ech.
C. gig.A. cal.
O. bim.
P. fla.S. pur.
B. bel.C. sav.D. rer.
H. sap.
Figure 3
author/funder. All rights reserved. No reuse allowed without permission. The copyright holder for this preprint (which was not peer-reviewed) is the. https://doi.org/10.1101/2020.01.19.911685doi: bioRxiv preprint
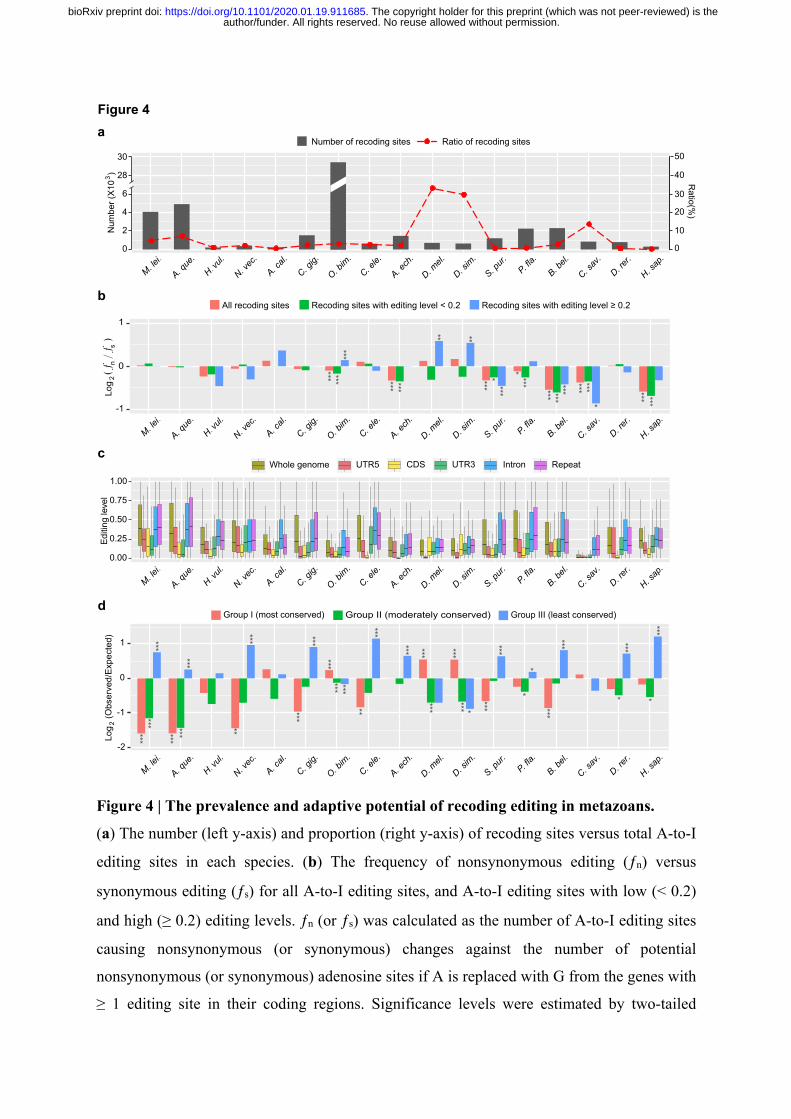
Figure 4 | The prevalence and adaptive potential of recoding editing in metazoans.
(a) The number (left y-axis) and proportion (right y-axis) of recoding sites versus total A-to-I
editing sites in each species. (b) The frequency of nonsynonymous editing (ƒn) versus
synonymous editing (ƒs) for all A-to-I editing sites, and A-to-I editing sites with low (< 0.2)
and high (≥ 0.2) editing levels. ƒn (or ƒs) was calculated as the number of A-to-I editing sites
causing nonsynonymous (or synonymous) changes against the number of potential
nonsynonymous (or synonymous) adenosine sites if A is replaced with G from the genes with
≥ 1 editing site in their coding regions. Significance levels were estimated by two-tailed
0
2
4
6
0
10
20
30
Ratio(%
)
40
50
28
30
Num
ber (
X10
)3
aNumber of recoding sites Ratio of recoding sitesƽ
ƽƽ
ƽ ƽ ƽƽ ƽ ƽ ƽ
ƽƽ
ƽ ƽƽ
ƽ
ƽ ƽƽ
ƽ
M.lei.
A.que.
H. vul.
N.vec.
C.ele.
D.mel.
D.sim.
A.ech.
C.gig.
A.cal.
O.bim.
P.fla.
S.pur.
B.bel.
C.sav.
D.rer.
H.sap.
Log
(O
bser
ved/
Expe
cted
)
-1
0
1
dGroup I (most conserved) Group II (moderately conserved) Group III (least conserved)
0.00
0.25
0.50
0.75
1.00
Editi
ng le
vel
Whole genome UTR5 CDS UTR3 Intron Repeatc
-2***
***
***
******
***
**
***
***
***
***
*** ***
**
****** ***
***
***
*** ****
***
*
*
***
*** ***
***
* *
All recoding sites Recoding sites with editing level < 0.2 5HFRGLQJ�VLWHV�ZLWK�HGLWLQJ�OHYHO������
Log
-1
0
1
*** ***
***
*** ****** ***
*** *** ******
****** *** ****
** **
**
b
2( ƒ
/ ƒ
)n
s 2
M.lei.
A.que.
H. vul.
N.vec.
C.ele.
D.mel.
D.sim.
A.ech.
C.gig.
A.cal.
O.bim.
P.fla.
S.pur.
B.bel.
C.sav.
D.rer.
H.sap.
M.lei.
A.que.
H. vul.
N.vec.
C.ele.
D.mel.
D.sim.
A.ech.
C.gig.
A.cal.
O.bim.
P.fla.
S.pur.
B.bel.
C.sav.
D.rer.
H.sap.
M.lei.
A.que.
H. vul.
N.vec.
C.ele.
D.mel.
D.sim.
A.ech.
C.gig.
A.cal.
O.bim.
P.fla.
S.pur.
B.bel.
C.sav.
D.rer.
H.sap.
Figure 4
author/funder. All rights reserved. No reuse allowed without permission. The copyright holder for this preprint (which was not peer-reviewed) is the. https://doi.org/10.1101/2020.01.19.911685doi: bioRxiv preprint
Fisher's exact tests. (c) The comparison of editing levels of A-to-I editing sites in different
genomic elements. For each editing site in a species, the mean editing level across samples
with RNA depth ≥ 10X was calculated and used in this analysis. (d) The observed/expected
number of genes subject to recoding editing among genes with different conservation levels.
The expected probability of a gene being recoded in a species was estimated as the number of
recoded genes (i.e. genes with ≥ 1 recoding site) out of all transcribed protein-coding genes
(i.e. RPKM > 1 in at least one sample) in this species, and the expected number of recoded
genes in each conservation group was calculated as the number of genes in this group
multiplied by the expected probability of a gene being recoded. Significance levels were
estimated by two-tailed binomial tests. Asterisks in panels b and d indicate the significance
levels with “*” representing p < 0.05, “**” < 0.01 and “***” < 0.001.
author/funder. All rights reserved. No reuse allowed without permission. The copyright holder for this preprint (which was not peer-reviewed) is the. https://doi.org/10.1101/2020.01.19.911685doi: bioRxiv preprint

Figure 5 | Functional preference of recoding editing in metazoans.
(a) Functional categories that are enriched by recoded genes in no less than three species
(Hypergeometric test adjusted p < 0.05). Only genes with at least one recoding site of which
the average editing level across samples > 0.1 or shared by at least two samples in each species
were used for the functional enrichment analysis (see Methods for details). (b) An example
showing the convergent evolution of recoding editing in the voltage-gated K+ (Kv) channels
among Drosophila, ant, octopus and human. The upper part shows the classic structure of the
Kv channel within the cell membrane that contains six membrane-spanning domains (S1–S6).
Yellow dots indicate the locations of recoding sites. The middle part shows the multiple
sequence alignment of the region containing the four recoding sites, with recoding sites
Number
ƽ
ƽ
ƽƽ
25
50
75
100
2.5
5.0
7.5
10.0 -Log (P value)
M. lei.A. que.H. vul.N. vec.
C. ele.
D. mel.D. sim.
A. ech.
C. gig.A. cal.
O. bim.
P. fla.S. pur.
B. bel.C. sav.D. rer.H. sap.
10
a
b c
0.00
0.25
0.50
0.75
1.00
D. sim. D. mel.D. sim.
T->AD. mel. A. ech.
Y->CO. bim. D. sim.
T->AD. mel. D. sim. D. mel. A. ech.
I->VO. bim. H. sap.
(i) (ii) (iv)(iii)
H. sapiens Kv1.1
D. rerio Kv1.1
B. belcheri Kv1.1
D. melanogaster Shaker
H. sapiens Kv2.1
D. rerio Kv2.1
C. savignyi Kv2
B. belcheri Kv2
D. melanogaster Shab
D. simulans Shab
O. bimaculoides Kv2
C. gigas Kv2
A. californica Kv2
N. vectensis Kv - like
M. leidyi Kv -
FSSIPDAFWWAVVSMTTVGYGDMYPVTIGGKIVGSLCAIAGVLTIALPVPVIVSNFSSIPDAFWWAVVSMTTVGYGDMVPVTIGGKIVGSLCAIAGVLTIALPVPVIVSNFTSIPDAFWWALVTMTTVGYGDMYPQTVGGKLVGSLCAIAGVLTIALPVPVIVSNFKSIPDAFWWAVVTMTTVGYGDMTPVGVWGKIVGSLCAIAGVLTIALPVPVIVSNFKSIPASFWWATITMTTVGYGDIYPKTLLGKIVGGLCCIAGVLVIALPIPIIVNNFKSIPASFWWATITMTTVGYGDIYPKTLLGKIVGGLCCIAGVLVIALPIPIIVNNFSSIPASFWWATITMTTVGYGDISPTTLLGKLVGGICCVTGVLVIALPIPIIVNNFKSIPEAFWWASITMTTVGYGDIYPTTLLGKIVGSLCCVCGVLVIALPIPIIVNNFVSIPETFWWAGITMTTVGYGDIYPTTALGKVIGTVCCICGVLVIALPIPIIVNNFVSIPETFWWAGITMTTVGYGDIYPTTALGKVIGTVCCICGVLVIALPIPIIVNNFISIPETFWWAGITMTTVGYGDIYPTTPLGKVIGSVCCICGVLVIALPIPIIVNNYVSIPETFWWAAITMTTVGYGDIYPTTILGKVVGGVCCICGVLVIALPIPIIVNNFKSIPETFWWAAITMTTVGYGDIYPMTTPGRLVGAVCCICGVLVIALPIPIIVNNYKSIPETFWWAAITMTTVGYGDIYPKTVLGKVVGSVCCICGVLVIALPIPIIVNNFKSIPEAFWWSIITMTTVGYGDVYPVTPLGKLVGSLCCISGIIFIALPIPTIVSNFMSILDGFWWAVITMTTVGYGDDVPQSNWGKIVGGMCAVSGVLMIALPVPVIVSN
NH2 COOH
BTB_2
S1 S2 S3 S4 S5 S6
ii
iv
iiii
Editi
ng le
vel
(i) (ii) (iii) (iv)
C. gig.
S->G
C. gig.
N->S P. fla.
K->R
P. fla.
K->R
P. fla.
E->G
P. fla.
Editi
ng le
vel
DUF4200 SMC_prok_B
DKLLESLNCKVLDVYRHCTGTQQEANLGTVQMLTIIEHQLDELLENQDVGQSE-QKVVEVYRKCIG-DCESSLGTLQMLTIIEHQLDELLENDRMLDSLNKKVAEVYRQCVG-ENESNLGTLQMLAVIEHQLDDLLECDKMLASLGRKVREVYGHCIG-ESREGMETMEMLAAIEKKLIELLDNEKMLASLSKKVLEVYRHCIG-ENDSNLGTLQMLTVIEHQLDDLLECDKMLASLNKKVLEVYRRCIG-ANEANLGTLQMLTVIEHQLDDLLECEKMLAVLGEKVEEVYRACIG-ENRSNFNVLQMLMAIEHQLEELLDNDKTFDTLSRKVEEVTHCCVG-ETEANLSTLQMLMAIEEKLGELLENEKMLQSLNKKVEEVYRACIG-DNEANISTLQMLTNIENRLEELFEIEAMLAQLDKKVEDVYRNCIG-DNEANISTLQMLTNIENRLEELFEQEAMLDTLNNKVEEVYANCIG-DNEANISTLQMLTNIENKLEELFESQKMLDSLNSRVEEVTRSCIG-DNEANISTLQMLTNIENRLEELFEMEKMLAALNKKVEEVYRNCIG-DNEANISTLQMLTNIENRLEELFEQEAMLSTLDKKVADVYNKCIG-GNEAAVSTLQMLTAIEGRMEELFEEEKMLELLNEKVEEVYRSCIG-DNEANISTLQMLTNIENRLEELFEH--ELGRLDDKVSEVYRACIG-QNEAGISTLQMLTNIENKVEELLEA
H. sapiens M. domestica O. anatinus G. gallus C. porosus A. carolinensis X. laevis D. rerio B. belcheri P. flava S. purpuratus C. gigas N. vectensis A. queenslandica M. leidyi M. brevicollis
(i,ii)(iii) (iv)(v)
(i) (ii) (iii) (iv) (v)
0.00
0.25
0.50
0.75
1.00
Extracellular
Intracellular
ƽ ƽ
ƽƽ ƽƽ ƽ ƽ ƽ ƽƽƽ ƽƽƽ ƽƽƽ ƽƽ ƽƽ ƽƽ ƽ ƽƽ ƽƽ ƽƽ
ƽ ƽ ƽƽ ƽƽ ƽƽƽ ƽ ƽ
ƽƽ ƽƽ
ƽ ƽ ƽƽƽ ƽƽ ƽ
ƽƽ ƽƽ
ƽ
ƽƽƽ ƽ ƽ ƽƽƽ ƽƽ ƽƽ ƽƽƽ ƽƽ ƽ ƽ ƽƽ
ƽ ƽƽ ƽƽ
ƽƽƽ ƽƽ ƽƽ ƽ ƽ ƽƽ ƽƽ ƽ
ƽƽ ƽƽƽ ƽƽƽ ƽƽ ƽ ƽƽ ƽ ƽƽ
ƽ ƽƽ ƽƽ ƽ
Nervous system CytoskeletonCell communications/Signal transduction Others
Ion ch
anne
l acti
vity
Ion tra
nsmem
brane
trans
port
/LJDQGíJDWHG�LRQ�FKDQQHO�DFWLYLW\
VROWDJHíJDWHG�FDWLRQ�FKDQQHO�DFWLYLW\
Passiv
e tran
smem
brane
trans
porte
r acti
vity
Potass
ium io
n tran
smem
brane
trans
port
Synap
tic m
embra
ne
Postsy
napti
c mem
brane
Synap
tic tra
nsmiss
ion
Glutam
ate re
cepto
r sign
aling
pathw
ay
Cellula
r resp
onse
to st
imulu
s
Cell co
mmunica
tion
Signal
trans
ducti
on
Intrac
ellula
r sign
al tra
nsdu
ction
Signali
ng re
cepto
r acti
vity
Transm
embra
ne si
gnali
ng re
cepto
r acti
vity
Cytosk
eleton
Myofila
ment
Cytosk
eletal
prote
in bin
ding
Actin b
inding
Actin f
ilamen
t bind
ing
Actin c
ytosk
eleton
orga
nizati
on
Muscle
syste
m proc
ess
Motor a
ctivit
y
Ion bi
nding
Protein
bind
ing
Cell pe
riphe
ry
Plasma m
embra
ne
Regula
tion o
f pho
spho
rus m
etabo
lic pro
cess
A. echinatior Shab
like
Figure 5
author/funder. All rights reserved. No reuse allowed without permission. The copyright holder for this preprint (which was not peer-reviewed) is the. https://doi.org/10.1101/2020.01.19.911685doi: bioRxiv preprint

identified in each species highlighted by red color and the conserved recoding events shared
across phyla highlighted by gray shadow. The lower part shows the editing levels of the
recoding events in each species. (c) An example showing the convergent evolution of a
recoding editing event in the same amino acid residue of the cytoskeleton-related gene
CFAP100 between the oyster C. gigas and acorn worm P. flava. The upper part shows the
domain organization of the oyster CFAP100 protein (XP_011420958.1) annotated by the
Conserved Domain Database (CDD) of NCBI. The middle and lower part are similar with
panel b. Error bars in panels b and c represent s.d. across samples.
author/funder. All rights reserved. No reuse allowed without permission. The copyright holder for this preprint (which was not peer-reviewed) is the. https://doi.org/10.1101/2020.01.19.911685doi: bioRxiv preprint

Supplementary Figure 1 | The origin and variation of RNA editing in metazoans. (a) The frequency of each type of nucleotide substitution among all potential RNA-editing sites (RESs) and genetic single nucleotide variants (SNVs) identified in the five species without ADARs. The types of nucleotide substitutions for RESs and SNVs were both inferred according to the genotypes present in the plus strand of the reference genome in this analysis. That is, an A-to-G RES from the minus strand of the reference genome was regarded as a T-to-C substitution, while substitution types of RESs from the plus strand remained unchanged. The RESs and SNVs from different samples of the same species were first combined according to their genomic locations, respectively, before the frequency calculation. (b) The phylogeny of the 22 species examined in this study. The topology of the phylogenetic tree is derived according to previous reports 1,2. (c) The occurrence rate of A-to-I editing in each species, which was calculated as the number of A-to-I sites divided by the number of transcribed adenosine sites (RNA depth ≥ 2X) then multiplied by one million. (d) The editing-level-weighted occurrence rate of RNA editing in each species, which was calculated as the summed editing level for all RNA-editing sites with RNA depth ≥ 10X divided by the number of transcribed genomic sites with RNA depth ≥ 10X then multiplied by one million. (e) The editing-level-weighted occurrence rate of A-to-I editing in each species, which was calculated as the summed editing level for all A-to-I sites with RNA depth ≥ 10X divided by the number of transcribed adenosine sites with RNA depth ≥ 10X then multiplied by one million. Error bars in panels c, d and e represent s.d. across samples.
Capsaspora owczarzaki Monosiga brevicollis Sphaeroforma arctica Salpingoeca rosetta Trichoplax adhaerens
SNVs Editing sites
148 23 265 519 120No. of RESs:
H. sap.
D. rer.
C. sav.
B. bel.
P. fla.
S. pur.
D. mel.
A. ech.
C. ele.
O. bim.
C. gig.
A. cal.
N. vec.
H. vul.
T. adh.
A. que.
M. lei.
M. bre.
S. ros.
C. owc.
S. arc.
D. sim.
Number of A-to-I sites per million transcribed As
0 175 350 525 1500 1800
Weighted number of RESs Weighted number of A-to-I sites per million transcribed Asper million transcribed sites
0 1500 3000 4500 11500 0 600 1200 1800 4200 520014500
a
b
113847 17160 156836 104379 838857No. of SNVs:
c d e
10.00%20.00%30.00%40.00%
A to TA to C
A to G
T to A
T to C
T to GC to A
C to T
C to G
G to A
G to T
G to C
10.00%20.00%30.00%40.00%
A to TA to C
A to G
T to A
T to C
T to GC to A
C to T
C to G
G to A
G to T
G to C
10.00%15.00%20.00%25.00%
A to TA to C
A to G
T to A
T to C
T to GC to A
C to T
C to G
G to A
G to T
G to C
5.00%10.00%15.00%20.00%
A to TA to C
A to G
T to A
T to C
T to GC to A
C to T
C to G
G to A
G to T
G to C
10.00%15.00%20.00%25.00%
A to TA to C
A to G
T to A
T to C
T to GC to A
C to T
C to G
G to A
G to T
G to C
author/funder. All rights reserved. No reuse allowed without permission. The copyright holder for this preprint (which was not peer-reviewed) is the. https://doi.org/10.1101/2020.01.19.911685doi: bioRxiv preprint
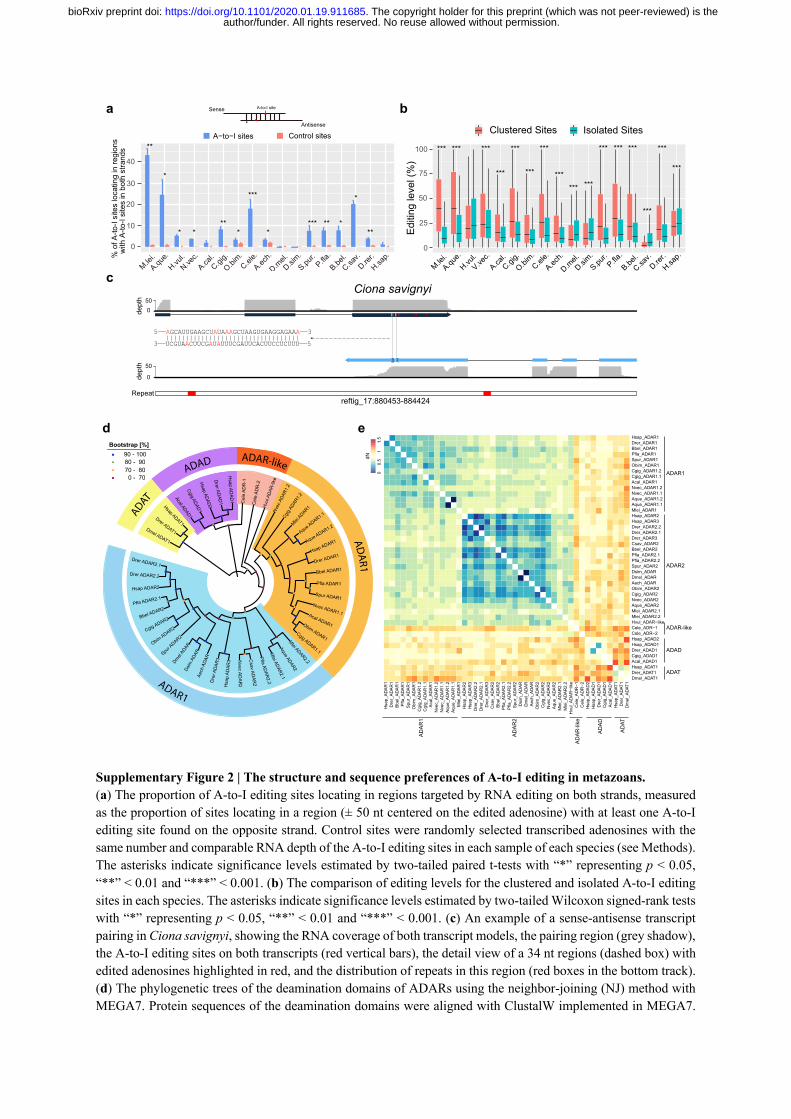
Supplementary Figure 2 | The structure and sequence preferences of A-to-I editing in metazoans. (a) The proportion of A-to-I editing sites locating in regions targeted by RNA editing on both strands, measured as the proportion of sites locating in a region (± 50 nt centered on the edited adenosine) with at least one A-to-I editing site found on the opposite strand. Control sites were randomly selected transcribed adenosines with the same number and comparable RNA depth of the A-to-I editing sites in each sample of each species (see Methods). The asterisks indicate significance levels estimated by two-tailed paired t-tests with “*” representing p < 0.05, “**” < 0.01 and “***” < 0.001. (b) The comparison of editing levels for the clustered and isolated A-to-I editing sites in each species. The asterisks indicate significance levels estimated by two-tailed Wilcoxon signed-rank tests with “*” representing p < 0.05, “**” < 0.01 and “***” < 0.001. (c) An example of a sense-antisense transcript pairing in Ciona savignyi, showing the RNA coverage of both transcript models, the pairing region (grey shadow), the A-to-I editing sites on both transcripts (red vertical bars), the detail view of a 34 nt regions (dashed box) with edited adenosines highlighted in red, and the distribution of repeats in this region (red boxes in the bottom track). (d) The phylogenetic trees of the deamination domains of ADARs using the neighbor-joining (NJ) method with MEGA7. Protein sequences of the deamination domains were aligned with ClustalW implemented in MEGA7.
A-to-I siteSense
Antisense
ADAT
ADAD ADAR-like A
DA
R1
ADAR1
5——AGCAUUGAAGCUAUAAAGCUAAGUGAAGGAGAAA——3 ||||||||||||||||||||||||||||||||||3——UCGUAACUUCGAUAUUUCGAUUCACUUCCUCUUU——5
reftig_17:880453-884424Repeat
dept
hde
pth
050
50
0
Ciona savignyi
d
0
10
20
30
40
M.lei.A.qu
e.
H.vul.N.ve
c.
A.cal.C.gi
g.
O.bim.
C.ele.
A.ech.
D.mel.D.si
m.
S.pur.
P.fla.
B.bel.C.sa
v.D.re
r.H.sa
p.
$íWRí,�VLWHV Control sites
H.sap.
*** *** *** *** *** *** *** *** ***
*** ******
***
0
25
50
75
100
Ed
itin
g l
H.sap.
D.rer.
C.sav.
B.bel.
P.fla.
S.pur.
D.sim.
D.mel.
A.ech.
C.ele.
O.bim.
C.gig.
A.cal.
V.vec.
H.vul.
A.que.
M.lei.
Clustered Sites Isolated Sites
***
******
c
% o
f A-to
-I si
tes
loca
ting
in re
gion
s
with
A-to
-I si
tes
in b
oth
stra
nds
Editi
ng le
vel (
%)
**
*
* ***
*
***
* *** ** *
*
**
a b
e
00.
51
1.5
Bootstrap [%] 90 - 100 80 - 90 70 - 80 0 - 70
dN
Obim ADAR1
Dmel AD
AR
Hsap ADAR1
Drer AD
AD1
Dre
r AD
AR3
Dsim
ADA
R
Spur ADAR1
Cel
e AD
R-2
Dmel ADAT1
Hsap AD
AD1
Aque ADAR1.2
Hvul
ADA
R-lik
e
Spur A
DAR2
Aque ADAR1.1
Drer ADAR2.1
Acal ADAD1Nvec ADAR1.1
Bbel ADAR2Pfla ADAR2.1
Mlei ADAR1
Drer ADAR1
Cel
e AD
R-1
Cgig A
DAR1.2
Csav AD
AR2
Obim ADAR2
Mlei ADAR2.2
Cgig ADAR2
Bbel ADAR1
Hsap ADAR2
Drer ADAT1Pfla AD
AR2.2
Mlei ADAR2.1
Cgig ADAD1 Nvec
ADA
R1.2
Hsap ADAT1
Nvec AD
AR2
Hsap ADAD2
Cgig ADAR1.1
Aque ADAR2
Aech
ADA
R
Pfla ADAR1
Drer ADAR2.2
Hsa
p AD
AR3
Acal ADAR1
Dmel_ADAT1Drer_ADAT1Hsap_ADAT1Acal_ADAD1Cgig_ADAD1Drer_ADAD1Hsap_ADAD1Hsap_ADAD2&HOHB$'5í�&HOHB$'5í�Hvul_AD$5íOLkeMlei_ADAR2.2Mlei_ADAR2.1Aque_ADAR2Nvec_ADAR2Cgig_ADAR2Obim_ADAR2Aech_ADARDmel_ADARDsim_ADARSpur_ADAR2Pfla_ADAR2.2Pfla_ADAR2.1Bbel_ADAR2Csav_ADAR2Drer_ADAR3Drer_ADAR2.1Drer_ADAR2.2Hsap_ADAR3Hsap_ADAR2Mlei_ADAR1Aque_ADAR1.1Aque_ADAR1.2Nvec_ADAR1.1Nvec_ADAR1.2Acal_ADAR1Cgig_ADAR1.1Cgig_ADAR1.2Obim_ADAR1Spur_ADAR1Pfla_ADAR1Bbel_ADAR1Drer_ADAR1Hsap_ADAR1
ADAR1
ADAR2
ADAR-like
ADAD
ADAT
ADAR
1
ADAR
2
ADAR
-like
ADAD
ADAT
Dm
el_A
DAT1
Dre
r_AD
AT1
Hsa
p_AD
AT1
Acal
_AD
AD1
Cgi
g_AD
AD1
Dre
r_AD
AD1
Hsa
p_AD
AD1
Hsa
p_AD
AD2
&HOHB$'
5í�
&HOHB$'
5í�
Hvu
l_AD
$5íOLk
eM
lei_
ADAR
2.2
Mle
i_AD
AR2.
1Aq
ue_A
DAR
2N
vec_
ADAR
2C
gig_
ADAR
2O
bim
_AD
AR2
Aech
_AD
ARD
mel
_ADA
RD
sim
_AD
ARSp
ur_A
DAR
2Pf
la_A
DAR
2.2
Pfla
_ADA
R2.
1Bb
el_A
DAR
2C
sav_
ADAR
2D
rer_
ADAR
3D
rer_
ADAR
2.1
Dre
r_AD
AR2.
2H
sap_
ADAR
3H
sap_
ADAR
2M
lei_
ADAR
1Aq
ue_A
DAR
1.1
Aque
_ADA
R1.
2N
vec_
ADAR
1.1
Nve
c_AD
AR1.
2Ac
al_A
DAR
1C
gig_
ADAR
1.1
Cgi
g_AD
AR1.
2O
bim
_ADA
R1
Spur
_AD
AR1
Pfla
_ADA
R1
Bbel
_ADA
R1
Dre
r_AD
AR1
Hsa
p_AD
AR1
author/funder. All rights reserved. No reuse allowed without permission. The copyright holder for this preprint (which was not peer-reviewed) is the. https://doi.org/10.1101/2020.01.19.911685doi: bioRxiv preprint
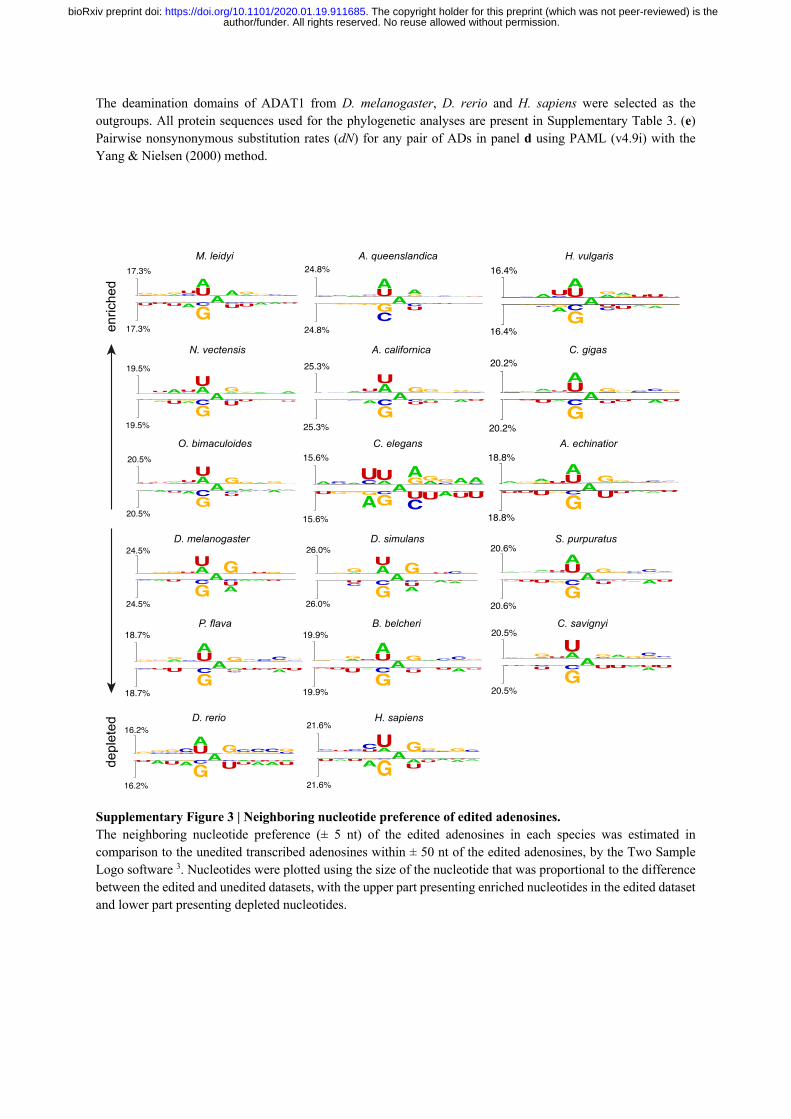
The deamination domains of ADAT1 from D. melanogaster, D. rerio and H. sapiens were selected as the outgroups. All protein sequences used for the phylogenetic analyses are present in Supplementary Table 3. (e) Pairwise nonsynonymous substitution rates (dN) for any pair of ADs in panel d using PAML (v4.9i) with the Yang & Nielsen (2000) method.
Supplementary Figure 3 | Neighboring nucleotide preference of edited adenosines. The neighboring nucleotide preference (± 5 nt) of the edited adenosines in each species was estimated in comparison to the unedited transcribed adenosines within ± 50 nt of the edited adenosines, by the Two Sample Logo software 3. Nucleotides were plotted using the size of the nucleotide that was proportional to the difference between the edited and unedited datasets, with the upper part presenting enriched nucleotides in the edited dataset and lower part presenting depleted nucleotides.
D. rerio
P. flava
D. melanogaster
O. bimaculoides
N. vectensis
M. leidyi
H. sapiens
B. belcheri
C. elegans
A. californica
D. simulans
A. queenslandica
C. savignyi
S. purpuratus
A. echinatior
C. gigas
H. vulgaris17.3%
$
**$*&88$
$$*8*&&� � � � � $� � � � �
17.3%
888*
$&
*&
8&
8$$8
enriched
depleted
24.8%
&&$8&8$
*$&&$$8� � � � � $� � � � �
24.8%
*$
****&
&888
16.4%
&$&88$
$**$888� � � � � $� � � � �
16.4%
**
&*
$&
*8&&
8$*
$*
19.5%
8$&8$8
$*$
*
$ $� � � � � $� � � � �
19.5%
&*$
&
8*$&
*&
88* *
8
25.3%
*&&$&8$8
***&
*&
*� � � � � $� � � � �
25.3%
$
&
$&
*&8$8
$
$8
20.2%
**&*$&
88$
*$
&
*
&&*� � � � � $� � � � �
20.2%
&
88$&
*&
888
$8
20.5%
*8&
8$*&
8$8
**$*&� � � � � $� � � � �
20.5%
$$&
8$&*
$
&8
&8
$*&8
$$
15.6%
$8&$&8$8 *
$$*&**
$&$� � � � � $� � � � �
15.6%
8***
$&
* 8&8$
&
88
18.8%
$**$88
$$
*$
*8*
&*
&
� � � � � $� � � � �
18.8%
888$
*&
*&
88$8
$8
24.5%
**8$8 * 8*� � � � � $� � � � �
24.5%
&$8 &
*&
8$$$8
26.0%
*$* $
8 **8&*� � � � � $� � � � �
26.0%
8& &
*&
8$
$8$
20.6%
$$
&
$
&
88$
**8
&*
&$� � � � � $� � � � �
20.6%
888*&
*$
&
88$$8
18.7%
$
*$&*
&$*&8$
*&
$&*&&*� � � � � $� � � � �
18.7%
&88 &
*$
8&
888$8
19.9%
**$*8
&8$
*$$
&*
&*� � � � � $� � � � �
19.9%
&
888*
$&
*&
88$8
20.5%
$*$*8$8
&**
$8
**&*
&� � � � � $� � � � �
20.5%
8&&
8$
&
*88
&
$8$8
16.2%
&
*&*&*8&8$
**&*&*&&*
� � � � � $� � � � �
16.2%
8$8*
$&
*&
8$
88
$8
$$
8
21.6%
*&*
8*
&8&$8 *&*&**&� � � � � $� � � � �
21.6%
$
8&
$$
8*
$&
*$8$
8$8$$
author/funder. All rights reserved. No reuse allowed without permission. The copyright holder for this preprint (which was not peer-reviewed) is the. https://doi.org/10.1101/2020.01.19.911685doi: bioRxiv preprint
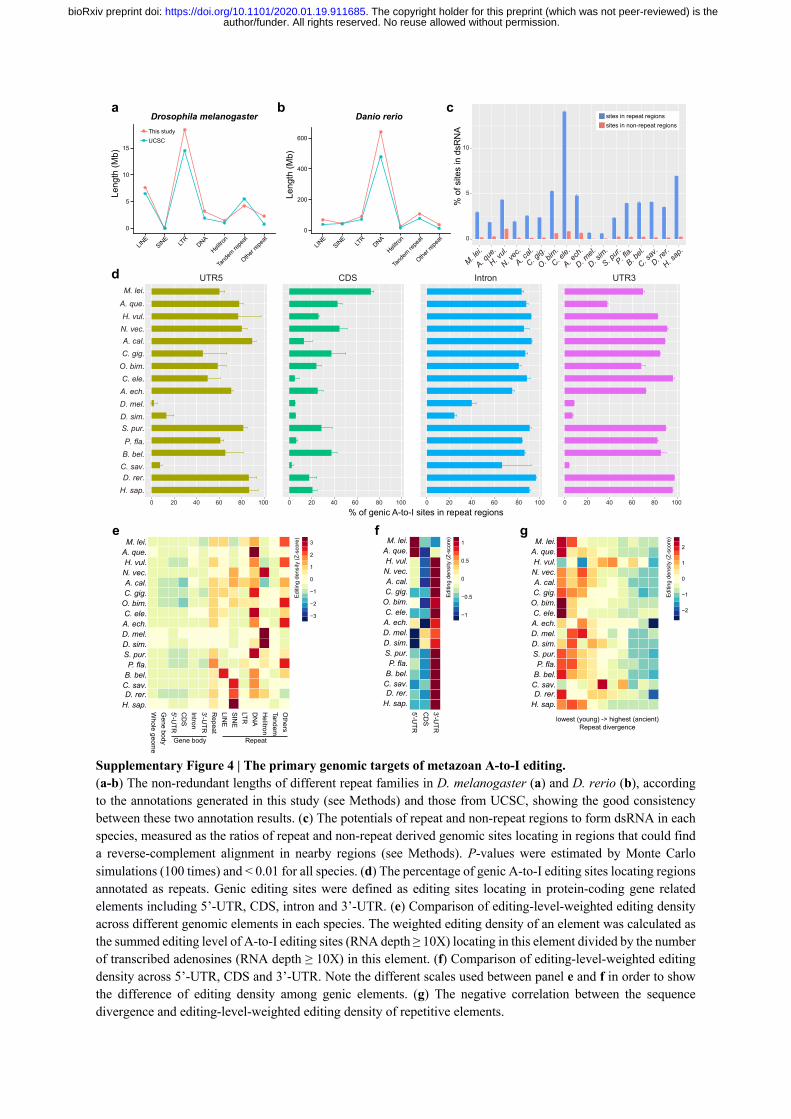
Supplementary Figure 4 | The primary genomic targets of metazoan A-to-I editing. (a-b) The non-redundant lengths of different repeat families in D. melanogaster (a) and D. rerio (b), according to the annotations generated in this study (see Methods) and those from UCSC, showing the good consistency between these two annotation results. (c) The potentials of repeat and non-repeat regions to form dsRNA in each species, measured as the ratios of repeat and non-repeat derived genomic sites locating in regions that could find a reverse-complement alignment in nearby regions (see Methods). P-values were estimated by Monte Carlo simulations (100 times) and < 0.01 for all species. (d) The percentage of genic A-to-I editing sites locating regions annotated as repeats. Genic editing sites were defined as editing sites locating in protein-coding gene related elements including 5’-UTR, CDS, intron and 3’-UTR. (e) Comparison of editing-level-weighted editing density across different genomic elements in each species. The weighted editing density of an element was calculated as the summed editing level of A-to-I editing sites (RNA depth ≥ 10X) locating in this element divided by the number of transcribed adenosines (RNA depth ≥ 10X) in this element. (f) Comparison of editing-level-weighted editing density across 5’-UTR, CDS and 3’-UTR. Note the different scales used between panel e and f in order to show the difference of editing density among genic elements. (g) The negative correlation between the sequence divergence and editing-level-weighted editing density of repetitive elements.
0
5
10
15
LINE
SINE
LTR
DNA
Helitro
n
Tand
em re
peat
Other re
peat
Leng
th (M
b)
This studyUCSC
Drosophila melanogaster
0
200
400
600
LINE
SINE
LTR
DNA
Helitro
n
Tand
em re
peat
Other re
peat
Leng
th (M
b)
Danio rerio
0
5
10
M. lei.
A. que
.
H. vul.
N. vec
.
A. cal.
C. gig.
O. bim
.
C. ele.
A. ech
.
D. mel.
D. sim
.
S. pur.P. fl
a.
B. bel.
C. sav
.
D. rer.
H. sap
.
% o
f site
s in
dsR
NA
UTR5 CDS Intron UTR3
20 40 60 80 100 0 20 40 60 80 100 0 20 40 60 80 100 0 20 40 60 80
sites in repeat regionssites in non-repeat regions
H. sap.D. rer.
C. sav.B. bel.P. fla.
S. pur.D. sim.D. mel.A. ech.C. ele.
O. bim.C. gig.A. cal.
N. vec.H. vul.
A. que.
M. lei.
% of genic A-to-I sites in repeat regions0
a b c
d
100
Whole geom
eG
ene body5'-U
TRC
DS
Intron3'-U
TRR
epeatLIN
ESIN
ELTRD
NA
Helitron
TandemO
thers
Editi
ng d
ensi
ty (Z
-sco
re)
RepeatGene body
M. lei.A. que.H. vul.N. vec.
C. ele.
D. mel.D. sim.
A. ech.
C. gig.A. cal.
O. bim.
P. fla.S. pur.
B. bel.C. sav.D. rer.
H. sap.
e f
5'-UTR
CD
S3'-U
TR
Editi
ng d
ensi
ty (Z
-sco
re)M. lei.
A. que.H. vul.N. vec.
C. ele.
D. mel.D. sim.
A. ech.
C. gig.A. cal.
O. bim.
P. fla.S. pur.
B. bel.C. sav.D. rer.
H. sap.
g
Editi
ng d
ensi
ty (Z
-sco
re)
lowest (young) -> highest (ancient)Repeat divergence
M. lei.A. que.H. vul.N. vec.
C. ele.
D. mel.D. sim.
A. ech.
C. gig.A. cal.
O. bim.
P. fla.S. pur.
B. bel.C. sav.D. rer.
H. sap.
í�
í�
í�
0
1
2
3
í�
��
0
���
1
í�
í�
0
1
2
author/funder. All rights reserved. No reuse allowed without permission. The copyright holder for this preprint (which was not peer-reviewed) is the. https://doi.org/10.1101/2020.01.19.911685doi: bioRxiv preprint

Supplementary Figure 5 | Functional preference of recoding editing in metazoans. (a) The convergent evolution of two recoding editing events in the glutamate ionotropic receptors in human and zebrafish. The upper part shows the domain organization of the human GRIA2 protein (NP_001077088.1) annotated by the Conserved Domain Database (CDD) of NCBI. The middle part shows the multiple sequence alignments of the two regions containing the shared recoding sites. Recoding sites were highlighted by red color and the positions of conserved recoding events were highlighted by gray shadow. The lower part shows the editing levels of the recoding events in each species. (b) The convergent evolution of a recoding editing event in fascin (an actin filament-bundling protein), which was shared by the octopus O. bimaculoides, the sea urchin S. purpuratus and the lancelet B. belcheri. The upper part shows the domain organization of lancelet fascin-like protein (XP_019642030.1) annotated by the CDD of NCBI. The middle and lower part are the same as panel a. Error bars in panels a and b represent s.d. across samples.
0.00
0.25
0.50
0.75
1.00
D. rer.GRIA2A
H. sap.GRIA2
H. sap.GRIK1
H. sap.GRIK2
Q->R(i)
D. rer.GRIA2B
H. sap.GRIA2
D. rer.GRIA3B
H. sap.GRIA3
H. sap.GRIA4
R->E(ii)
NSLWFSLGAFMQQGCDISPRS NSLWFSLGAFMQQGCDISPRS NSLWFSLGAFM QGCDISPRS NSLWFSLGAFM QGCDISPRS NSLWFSLGAFMRQGCDISPRS NSLWFSLGAFMQQGCDISPRS NSLWFSLGAFMQQGCDISPRS NSLWFSLGAFMQQGCDISPRS NSLWFSLGAFMQQGCDFTPRS NSFWFGVGALM QGSELMPKA NSLWFGVAALMRQGSELMPKA NSFWFGVGALM QGSELMPKA NSFWFGVGALMQQGSELMPKA
GYGIATPKGSALRNPVNLAVLKL GYGIATPKGSPLRNPVNLAVLKL GYGIATPKGSSL TPVNLAVLKL GYGIATPKGSALRNAVNLAVLKL GYGIATPKGSSL NAVNLAVLKL GYGVATPKGSAL TPVNLAVLKL GYGVATPKGSAL NAVNLAVLKL GYGVATPKGSSL TPVNLAVLKL GYGVATPKGSQLRTPVNLAVLKL GYGVGTPIGSPYRDKITIAILQL GYGVGTPIGSPYRDKVTIAILQL GYGVGTPMGSPYRDKITIAILQL GYGIATPKGSPLRNPVNLAVLKL
ANF_receptor Lig_chanLig_chan-Glu_bd
(i) (ii)
RN
A ed
iting
leve
l
Q R
Q
Q
Q
R
RR
R
H. sapiens GRIA1 D. rerio GRIA1A H. sapiens GRIA2 D. rerio GRIA2A D. rerio GRIA2B H. sapiens GRIA3 D. rerio GRIA3B H. sapiens GRIA4 D. rerio GRIA4A H. sapiens GRIK1 D. rerio GRIK1A H. sapiens GRIK2 D. rerio GRIK2
a b
(i)
0.0
0.2
0.4
0.6
S. pur. B. bel.
Q->RO. bim.
(i)R
NA
editi
ng le
vel
Fascin Fascin Fascin Fascin
H. sapiens D. rerio B. belcheri P. flava S. purpuratus D. simulans D. melanogaster A. echinatior O. bimaculoides C. gigas N. vectensis A. queenslandica M. brevicollis
ERGRLAIRAR-SGKYLRGGASGLLRADADAPAGTALWE SDGRWALQSEPYLRYFGGSEE-YLSCFAQTIGESELWA EHSKFCIRAP-NDKYLRGE NGQFRATGTEVNKETLWE QQSKLCIRAP-NGKLLKGEQSGLFKANGEDVAPDTLFE ELSKFAIRAESNGMLIKGE SGLFTANGSEVSKDTLWE EPTRICIRSQ-QGKYLGATKNGAFKLLDDGTDSATQWE EPTRICIRSQ-QGKYLGATKNGAFKLLDDGTDSATQWE EPSRICIKCV-DGRYLTAGKNGALRLGESDYESATKWE GQSMFTVKAP-DGSFLKGE NGIFKATGKEVNASTLWE GNSKLTIKAP-NGNLLKTEQNGLFKATGTEVNASTL-- ERRNYLCIKAKNGAYLRGQQNGVFNANGKSIAKDSLWE AHTRMCIVAP-NGKCIQSAQNGDFKPVADDVTPATLWE QLSKALIKHKESGKYIIGEQNGGFKANGDREETNTLWE
Q
Q
Q
author/funder. All rights reserved. No reuse allowed without permission. The copyright holder for this preprint (which was not peer-reviewed) is the. https://doi.org/10.1101/2020.01.19.911685doi: bioRxiv preprint

Supplementary References 1 Laumer, C. E. et al. Revisiting metazoan phylogeny with genomic sampling of all phyla. Proceedings.
Biological sciences / The Royal Society 286, 20190831, doi:10.1098/rspb.2019.0831 (2019).
2 Ryan, J. F. et al. The genome of the ctenophore Mnemiopsis leidyi and its implications for cell type evolution. Science 342, 1242592, doi:10.1126/science.1242592 (2013).
3 Vacic, V., Iakoucheva, L. M. & Radivojac, P. Two Sample Logo: a graphical representation of the differences between two sets of sequence alignments. Bioinformatics 22, 1536-1537, doi:10.1093/bioinformatics/btl151 (2006).
author/funder. All rights reserved. No reuse allowed without permission. The copyright holder for this preprint (which was not peer-reviewed) is the. https://doi.org/10.1101/2020.01.19.911685doi: bioRxiv preprint