on the optimization of the fluidized bed particulate coating process
TRANSCRIPT

On the Optimization of the Fluidized BedParticulate Coating Process
Savini Maronga
Department of Chemical Engineering and TechnologyRoyal Institute of Technology
Stockholm, 1998
Ph.D. ThesisAKADEMISK AVHANDLING
som med tillstånd av Kungliga Tekniska Högskolan i Stockholm framlägges till offentliggranskning för avläggande av teknologie doktorsexamen onsdagen den 2 december 1998, kl. 10.00 i
Kollegiesalen, Valhallavägen 79, KTH, Stockholm. Avhandlingen försvaras på engelska.
TRITA-KET R97ISSN 1104-3466
ISRN KTH/KET/R--97--SE

©Savini Maronga
Department of Chemical Engineering and TechnologyRoyal Institute of Technology,100 44 Stockholm,Sweden.
ISSN 1104-3466KTH HögskoletryckerietStockholm 1998

Maronga S.: On the optimization of the fluidized bed particulate coating process(1998). Department of Chemical Engineering and Technology, RoyalInstitute of Technology, Stockholm, Sweden.
Abstract Different aspects that influence the fluidized bed particulate coating process havebeen investigated. An easy to use procedure for creating temperature and humidityprofiles for the gas inside the bed was developed. The procedure involves measuringa limited number of points inside the bed and using these points generate more datapoints used for the creation of the profiles. The profiles revealed that different partsof the bed have a different involvement in the coating process. Apart from showingthe hydrodynamic conditions inside the bed, the profiles can be used to optimize thesize of the bed, to map the net migration of particles and to set the spraying ratelimits.
The three-domain representation of the bed was used to model the coating process.The model showed that large beds and the existence of stagnant region within the bedwiden the coating distribution. Increasing the rate of transfer to the spraying domainor increasing the overall mixing of the bed will have the opposite effect of narrowingthe coating distribution. The unequal transfer between domains can be used tomanipulate the coating distribution. The combination of bed size, different rates oftransfer between domains, size of spraying domain and the rate of spraying can beused to obtain particles that are coated to a particular distribution.
The mechanism and kinetics of growth in a top spraying process were determined bycoating two poly-distributed seed particles with a cellulose under different operatingconditions. The resulting particle distribution reveals that not all particles in the bedare equally coated. For the top spraying process, smaller particles capture morecoating than larger particles. A narrowing of the seed distribution was found toincrease the chance of coating the large particles. The results also confirmed thatparticles are coated only after visiting the spraying region, which is small comparedto the rest of the bed. A growth model developed using the experimental resultsintroduces a segregation factor which represent the probability of different particlesizes being coated. For the top spraying coating of lactose particle with a cellulose,the segregation factor was found to be an exponential decaying function of theparticle weight.
Keywords: granulation, coating, surface layering, segregation, coating uniformity,temperature profile, humidity profile, growth kinetics, particle coating.

To Andrew(Justin) and Annette

Acknowledgments
This work has been carried out at the Department of Chemical Engineering and
Technology, Royal Institute of Technology, Stockholm, Sweden.
I wish to express my sincere gratitude to my supervisor, Dr. Piotr Wnukowski for
his invaluable discussions, guidance, encouragement and support throughout this
work.
I would also like to thank Professor Fredrik Setterwall, Head of the Department of
Chemical Engineering and Technology for accepting me as a graduate student and for
all the support that contributed to my studying at KTH.
Furthermore I would like to thank:
- Personnel at the department for all their support and for being such good
friends. The little chats, jokes and smiles really helped.
- Erik and Tomas for modifying and fixing the pilot plant.
- Astra for supplying some of the materials used in the experiments.
- University of Dar-es-Salaam for all the support that contributed to my study.
- All those who in one way or another helped me in this work.
The financial support from the Norwegian Agency for International Development
(NORAD) is greatly appreciated.
Finally I would like to thank my family and friends for their support and
understanding. Most of all my wife Hedwiga, son Andrew and daughter Annette for
their support, patience , encouragement and all the joy that they bring into my life.

Preface
This thesis is based on the following papers, referred to by their Roman
numerals I-IV:
I Maronga S.J. and Wnukowski P., Establishing Temperature Profiles in
Fluidized Bed Particulate Coating, Powder Technol., 94, 1997, 181-185.
II Maronga S.J. and Wnukowski P., The Use of Humidity and Temperature
Profiles in Optimizing the Size of Fluidized Bed in a Coating Process,
Chem. Eng. Proc., in Press, 1998.
III Maronga S.J. and Wnukowski P., Modelling of the Three-Domain
Fluidized Bed Particulate Coating Process, Chem. Engng. Sci., 52, 1997,
2915-2925.
IV Maronga S.J. and Wnukowski P., Growth Kinetics in a Top Spraying
Fluidized Bed Particulate Coating, (submitted for publication).
The papers are appended at the end of this thesis.

Table of Contents
1. Introduction ................................................................. 11.1 Definition of terms ............................................................ 21.2 Fluid-bed particulate coating ................................................. 41.3 Scope and objective of this work ............................................ 7
2. Literature review ............................................................. 82.1 Feed particle size .............................................................. 82.2 Nozzle position ............................................................... 92.3 Coating solution ............................................................... 102.4 Coating thickness and uniformity ........................................... 112.5 Particle circulation ............................................................. 122.6 Temperature and humidity distributions ..................................... 132.7 Mechanism and kinetics of growth .......................................... 14
3. Temperature and humidity profiles ..................................... 163.1 Establishing the profiles ..................................................... 163.2 Experimental set-up .......................................................... 163.3 Data processing ............................................................... 203.4 Temperature and humidity characteristics ................................. 233.5 Coating zones and size optimization ........................................ 27
4. Modelling the process ...................................................... 294.1 Conceptual model ............................................................. 294.2 Numerical simulation ......................................................... 324.3 Coating distribution .......................................................... 334.4 Mixing and unequal transfer ................................................. 35
5. Kinetics of growth ......................................................... 385.1 Mechanism of growth ........................................................ 385.2 Coating measurement and uniformity ...................................... 39 5.3 Growth model and kinetics .................................................. 405.4 Coating experiment ........................................................... 425.5 Rate of growth ................................................................. 475.6 Improved growth model ...................................................... 50
6. General discussions ........................................................ 57
7. Conclusions ................................................................... 60
8. Notations ....................................................................... 62
9. References ..................................................................... 64

1
1. Introduction
Particles of different sizes are used in various applications in areas like
pharmaceuticals, agriculture, waste-water treatment, plastics, power, mining and a
host of other chemical processing industries. In many cases, these particles are of
different sizes, shapes and compositions that make their use difficult or less efficient.
To improve their functionality, a number of properties in the particles can be
modified. Properties like flow, size, dustiness, strength, appearance and rate of
dissolution can be changed depending on the agent used and on the need for the
modifications.
One way of increasing particle usefulness is by controlling the availability of
particular ingredient from within it in such a way that the ingredient is made available
at a certain rate and for a certain duration. This is the cornerstone of the so-called
‘controlled-release’ or ‘delayed-release’ particles. These particles are used in a
number of applications including pharmaceutical and agricultural, and are produced
by coating the original particles using another material in order to control the release
of the useful ingredients from within the particle. Useful applications for the
controlled-release particles include drugs products where the time for effective
therapeutic dose from a single administration can be extended. Coated drugs can also
be test-masked to improve patient compliance or targeted to a specific area of the
body so as to protect other tissues (Jacobs and Mason, 1993). The use of controlled-
release fertilizers and pesticides as well as coated seeds can decrease environmental
damage by lowering the number of field applications and reducing the runoff to the
groundwater system (Liu and Litster, (1993), Conceicao-Filho et al (1998), Nienow
(1995)). Other applications include controlled-release viscous breakers for oil well
stimulation, agglomerations of carbon black, coloring of tablets, carbonless carbon
paper and the making of detergents.
There are several ways that can be employed to modify the surface of particles or
make particles intended for controlled release applications. The equipment that can be
used are those which involve the agitation of the particles; for example pans, mixers,
fluid beds and centrifuges. Of these, the spray coating in a rotating pan and in a fluid
bed are the most widely used in the production of coated particles. In the rotating
pan, particles to be coated are set in motion by rotating a drum or a pan and the
coating solution is then sprayed onto the particles. Often, hot gas is supplied to the
pan to dry the particles. Although this method has been in use for a long time and

2
despite several improvements, the rotating pan has a low reproducibility and is
suitable for producing particles that do not require high coating uniformity. Most
recent improvement efforts are focused on the fluidization of particles inside the drum
(Litster and Sarwono, 1996).
On the other hand, fluid-bed processes are known to be able to handle a wide range
of particle sizes and shapes, and they can produce highly uniform coatings. There are
different types of fluid-bed processes and their common feature is the bottom
supplied gas which results in particles being suspended in a liquid-like state.
Particles are then coated by spraying with a solution or melt containing the coating
material. The solution may be sprayed in a number of ways, including from the top
(top spraying), from the bottom of the bed near the distributor plate (bottom
spraying) or from nozzles submerged inside the bed.
A number of design modifications on the conventional fluidized bed have been
adopted to improve the coating process while taking advantage of the good mixing
and high heat transfer offered by the fluidized bed system. The earlier design
modifications were introduced by Würster in the 1950’s and its main features are as
shown in figure 1.1. It has an inner tube known as a draft tube which is used for the
purpose of improving the circulation inside the bed. Another widely used design is
that of Glatt which employs a cone at the centre of the distributor plate to increase
particle circulation. In a recent bid to improve the process, the Kugelcoater design
has been introduced with features like vertical centre shaft, multiple nozzles and
inclined perforated slots instead of a conventional distributor plate.
1.1 Definition of terms
In the field of particle processing, several terms are used differently and
interchangeably by different authors. Terms like agglomeration and granulation are a
good example. Some authors, like Sherington and Oliver (1981), refer to
agglomeration as a part of the granulation processes involving agitation in contrast to
granulation by compaction, drop formation or heat bonding. Whereas others, like
Ennis and Litster (1997) and Orr (1966), treat granulation as an agglomeration by
agitation in contrast to agglomeration by compression and by heating e.g. sintering.
In order to avoid confusion, I have tried to refrain from using the term granulation
and, where it or a derivative is used, more specific information is supplied alongside.
Some other terms that requires clarifications are;

3
Figure 1.1 Würster coating chamber (Lehmann and Dreher, 1981)
Fluidized Bed Coating
Fluidized bed coating is a process that takes place inside a fluidized bed whereby a
coat is introduced to cover the intended object in order to protect it or modify its
behavior.
Particulate coating is a form of fluidized bed coating involving the coating of solid
particles inside the bed. In the process, a layer is deposited onto the surface of
fluidized solid particles by spraying with a solution of the coating material. The
fluidizing gas is also use to dry the deposited solution to form a coat on the surface of
the particle.
There is another process that is sometimes also referred to as fluidized bed coating,
which involves building up a protective coating around metals especially those used
in appliances, electrical, power distribution, pipelines etc. (Gutfinger and Chen,
1969). The object to be protected is preheated and then immersed in a fluidized bed
containing a polymer powder resin. The temperature of the object is maintained above
4
the softening or melting point of the resin. The resin particles melt onto the heated
surface and thus create a protective coating covering the object.
This study deals exclusively with particulate fluidized bed coating. Therefore the
terms particulate coating, fluid-bed coating or merely coating, as far as this study is
concerned, mean fluidized bed particulate coating.
Agglomeration
Agglomeration is said to have occurred if two or more particles are held together to
form a larger particle. Inter-particle forces such as solidifying liquid bridges, liquid
binding and molecular binding are among those responsible for the formation of
agglomerates. The term twin-growth agglomeration refers to the joining together of
two particles of similar size to form a larger particle. In the pharmaceutical industry,
if smaller particles are captured by a bigger particle, then snow-ball granulation is
said to have taken place. The term agglomeration as used in this study, is limited to
the situation where small particles come together to form a larger particle.
1.2 Fluid-bed particulate coating
Fluid-beds encompass the conventional fluidized beds, spouted beds, spouted-
fluid beds and their derivatives. In the process involving a fluid-bed, particles are
suspended in a fluid-like state using gas introduced at the bottom of the bed. The gas
is normally preheated before it is pumped to the bed where it acts as both heat and
momentum carrier. The coating material is sprayed directly into or onto the particles
depending on the position of the spraying nozzle.
There are a number of possible processes that can take place inside the bed
depending on the bed’s conditions, seed particle characteristics and the coating
material used. The phenomena summarized in Figure 1.2 are based on possible
mechanisms as suggested by Nienow (1995) and by Cherif et al (1996). Once the
coating solution is atomized in the nozzle, the resulting droplets can be successful or
unsuccessful in reaching and attaching themselves to a particle surface. The coating
solution that does not attach itself to a particle is spray dried and may be elutriated out
of the bed if it is light or remain in the bed if it is sufficiently heavier. The fines that
remain in the bed can be joined with other spray-dried fines resulting in fines
agglomeration or they can be captured by larger particles resulting in ‘snow ball’
growth.

5
When an atomized coating solution successfully collides with particles, it wets their
surfaces. Depending on the conditions inside the bed, wetted particles may collide
and form liquid bridges between them or they can be dried resulting in a layered
growth. If there is excessive wetting, many particles will form bridges between them,
thus joining together to form large wet clumps which will lead to the defluidization of
the bed in a phenomenon known as wet quenching (Nienow and Rowe, 1985). In
the case of moderately wetted particles, a number of solid particles will remain joined
together when their liquid bridges are dried. The continuing existence of these solid
bridges will depend on their strength. If the adhesive force is strong and the solid
bridges join together many particles, then these particles will remain joined and the
bed will eventually collapse as it can not fluidize these large particles. This
phenomenon is also known as dry quenching. At the same time, if the adhesive force
is strong but the solid bridges joins together only a few particles, the process will
continue and the resulting product will be a few particles joined together to form
larger particles (i.e. agglomeration). On the other hand, if the adhesive forces are
weak, the dried solid bridges will break leaving some coating on the surface of the
particles. This will eventually lead to coated particles.

6
Atomization
Wetted Particles
Wetting
Dried Fines
SprayDrying
Excessive Wetting
Elutriation Fines tothe Bed
Liquid bridge
Captured Fines
FinesAgglomerationSnow Balling
Light Heavy ParticleCollision
LayeredGrowth
WetDefluidization
Weak
DryingBridges
Dried Solid Bridges
Coated ParticlesAgglomeration
Weak adhesion forces (Fragmentation)
Strong adhesion(Few Particles)
Strong adhesion(Many Particles)
Dry Defluidization
Drying
Wetted
Figure 1.2 Possible phenomena taking place during fluidized bed coatingprocess (based on Nienow (1995) and Cherif et al (1996)).
The challenge in achieving a successful coating process is to ensure that the sprayed
coating material reaches the particles to be coated without excessive wetting.
Furthermore, one has to ensure that the liquid bridges formed by colliding wet
particles will break upon drying thus allowing the coating material to remain on the
surfaces of individual particles. This has to be done inside the bed in the presence of
all three phases as time heat, mass and momentum transfers are taking place at the
same time.

7
1.3 Scope and objective of this work
Until recently, the development and operations involving particle processing with
the possible exception of crystallization, has been considered ‘an art’. The absence
of strong engineering foundations has made comparison between similar processes
almost impossible. This has led to inefficient and sometimes costly development,
scale-up and operations of many granulation processes (Nienow and Rowe (1985),
Ennis (1996)). This work is aimed, in part, at achieving a general and specific
understanding of what takes place inside the bed during a fluidized bed coating
process.
The objective of this work includes the establishment of simple and effective
methods of measuring temperature and humidity profiles inside the bed during the
coating process. The profiles are the reflections of when and where heat and mass
are transferred during the process and are expected to provide a picture of the
thermodynamic conditions inside the bed (Paper I and II). The procedure is then
applied to the process involving lactose and glass-beads particles to reveal how
different parts of the bed are involved in the coating process and how the
information unveiled by the profile can be used to optimize the size of the bed (paper
II).
A model is developed for the fluidized bed coating process based on the existence of
distinct zones in different parts of the bed. The model is used to determine the effects
of particle mixing and bed size on the distribution of the coated particles (paper III).
In paper IV, the experimental results are used to determine the growth kinetics of
lactose particles that were coated inside a fluidized bed. From the resulting coating
distribution, a model for the growth kinetics is developed and the effect of seed
coating distribution on the kinetics are investigated.

8
2. Literature review
In this chapter, relevant work by other researchers is reviewed. The review looks
into some of the parameters which affects the type and rate of growth in fluidized bed
coating process. These parameters have later been studied in detail in the work
reported in thesis. This by no means covers all the important parameters that affect
the coating process.
2.1 Feed particle size
Most particles except those which are cohesive or those which have very large
densities, can be fluidized in a bed. Geldart’s classification of particles (Geldart,
1973) is a good guidance in deciding the suitability of seed particle for coating. The
Geldart C particles are unsuitable for coating. They are not only difficult to fluidize,
but also very easy to agglomerate. The Geldart A and B particles fluidize well and are
ideal to coat in a conventional fluidized bed systems. Large particles which fall in the
Geldart D grouping are difficult to fluidize and it is therefore customary to use
spouted or spout fluid-bed in the coating of particles with diameter greater than 1.5
mm. Among researchers who used the spouted bed, they include Kucharski and
Kmiec (1989) who coated 7-12 mm diameter tablets and Choi and Meisen (1997)
who coated urea particles of about 2 mm. Litster and Sarwono (1996) used a
fluidized drum granulator to coat particles ranging between 1.5 and 8 mm in
diameter.
Lehmann and Dreher (1981) found that it was possible to deposit a film of 10-20 µm
thick on particles with a diameter of 10µm-10mm. They deduced that smaller
particles with a diameter less than 100µm have a greater tendency to agglomerate,
that those between 100 and 800µm are the best for coating and that those above 1
mm, although they can easily be coated, have a tendency to damage their edges
because of collisions caused by their weight. They also showed that particles with the
same chemical composition but from different sources gave products with different
layer distributions despite using the same equipment, coating material and physical
conditions. The small particles’ tendency to agglomerate easily is also supported by
results obtained by Saleh et al (1998). Smith and Nienow (1983) support the view
that size influences the type of growth and that even under similar physical and
hydrodynamic conditions smaller particles are more likely to agglomerate than larger
particles.

9
It must be noted therefore that, if the seed particle size distribution is not controlled
i.e. if they differ a lot in size, competition between agglomeration and layered growth
is likely to take place. Smaller particle will first attach themselves to one another and
to larger particles and layered growth is then likely to follow. Depending on seed
distribution and bed design, there is also a chance of a preferential coating (Iley,
1991). If such growth is to be avoided, the deviation in initial particle size must be as
small as economically possible.
2.2 Nozzle position
Atomization of the coating solution provides an ideal solution to the problem of
introducing the solution to the bed. It solves the problem of local wet quenching
which may be a result of excessive wetting of particles by large coating droplets
(Nienow and Rowe, 1985). In the coating of fine particles, where the problem of
agglomeration is acute, Tsutsumi et al (1995) propose the use of supercritical fluid
solution. Hüttlin (1997) have developed a three-component spray nozzle to create a
stabilizing microclimate around the spray.
The position of the spray nozzle in a fluidized bed depends on the construction of
the equipment, on the material to be processed and on the desired product. A variety
of nozzle positions have been adopted in particle granulation, resulting in different
products. Nienow and Rowe (1985) have summarized studies on the position of
nozzle during the coating process. Other studies have looked into the effect of nozzle
position on the size of agglomerates produced (Shaefer and Worts (1977), Davies
and Gloor (1971) and Whitehead (1981)). Recently, a study by Edredge and Drawn
(1998) suggested that the number of nozzles is not an important factor in determining
the coating rate coefficient.
The nozzle may be positioned above the bed (top spraying), inside the bed
(submerged spraying) or at the bottom next to the distributor plate (bottom spraying).
If the bottom spraying is employed in a fluidized bed, there is an increasing danger of
defluidization by wet quenching. Therefore, the bottom spraying design is normally
modified to move particles through the spraying zone as quickly as possible. This is
accomplished in a variety of ways, including the use of a draft tube and unequal
fluidization in the Würster design as well as using spouting gas in a spouted fluid-
bed (Becher and Schlünder, 1995). Recent developments allow the use of multiple
nozzles bottom spraying (Hüttlin, 1997).

10
The top spraying can easily be accompanied by excessive spray-drying and
elutriation of the coating material. This will mean that the coating process runs at low
efficiency and longer than expected. However, this may be preferable to the
increased danger of wet quenching associated with submerged or bottom nozzle
spraying (Nienow, 1995). As reported by Wnukowski (1989), it is possible to
recover the spray-dried suspension and re-use it for coating. The particle wettability
and coat drying are different for different materials. Therefore, bearing in mind the
danger posed by wet quenching, some cases will favor the use of top spraying
despite some of the disadvantages mentioned.
2.3 Coating solution
In the early days of fluidized bed and pans coating processes, organic solvents were
used in the preparation of coating solutions. They allowed fast coating at relatively
low fluidization gas rates and temperatures, but their use has declined because of the
stringent regulations on industrial hygiene, the working environments and safety
measures required during their use. There has been an increasing use of aqueous
solutions to replace the organic solvents, and these require higher fluidizing air
capacities and heating systems. The concentration of the coating solution is limited to
the range where the solution remains sprayable.
A typical coating solution is made up of a polymer, plasticizer, solvent and in some
cases pigment. Only a proper combination of these four components will achieve a
coating solution with a desired property. For example, although a higher solution
concentration may lead to a faster coating deposition, the concentration is limited to a
range where the solution remain sprayable and easy to dry. There have been several
studies on the characteristics of the coating formed with different combinations of
ingredients. Lehmann and Dreher (1981) showed that, even under similar physical
conditions, the change in size and/or concentration of the coating material will
produce coatings of different sizes and different characteristics. Early work by
Schaefer and Worts (1978) and later studies by Smith and Nienow (1983) showed
the effect of amount and concentration of the coating solution on the final product.
Most of the studies in this area, including those of Horváth and Ormós (1989a),
Laicher et al (1993) and Link and Schlünder (1997), have concluded that the quality
and quantity of the coating solution affects the characteristics of the final product.

11
In some applications, a hot melt is used instead of the usual coating solution. In
such cases, the atomizing gas must be heated to a temperature close to that of the
melt and the feed line to the nozzle insulated to avoid solidification of the melt. A
number of modifications have to be made to make the normal bed suitable for using a
melt as a coating material (Juzwiakowski et al, 1990; Choi and Meisen, 1997).
2.4 Coating thickness and uniformity
For coated particles to be suitable in a sustained release application, the quality of
the coating must be strictly controlled. This is done by establishing the optimum
operating conditions for a particular coating material and seed particle. An ability to
monitor the thickness and uniformity of the coating between particles and within an
individual particle is essential in assessing the suitability of any set of process
conditions. Although there are a number of ways to measure the particle size
distribution (PSD), many of these procedures may not be useful for determining
uniformity of the coating deposited on the original particles.
Most of the studies have used indirect methods to measure the amount of coating
material on the particles. Davies and Gloor (1971), Smith and Nienow (1983b),
Cherif et al (1996) and Ichikawa and Fukumari (1996) used a sieve analysis to
measure PSD before and after coating. The average increase in size was assumed to
represent the coating thickness. Weiss and Meisen (1983) measured the amount of
sulphur in coated particles using uv-spectrometry and considered the average result to
be representative for all particles. Thiel and Nguyen (1984) used a microscope to
measure the coating amount by watching tablets as they disintegrate in an acid
medium. Horváth and Ormós (1989a), Kurchaski and Kmiec (1989) and Kage et al
(1996) used the increase in weight to measure the average coating thickness. While
Laicher et al (1993) used a sample dissolution test, Choi and Meisen (1997) used
three different methods at the same time; weight measurement for average coating
content, refractometry for a particle coating content and a refractometer in a
dissolution test for average coating thickness. Wnukowski (1989) measured the
coating by splitting into halves a number of coated particles and measuring
individually the thickness of the coating layer.
Only a few studies address the problem of coating uniformity between particles and
none of these explore the question of uniformity within individual particles. Iley
(1991), during the coating of poly-distributed particles in a fluidized bed, established

12
that larger particles capture more coating than smaller particles. In another study,
Thiel and Sberna (1986) calculated the coating uniformity from samples of
microcapsulated particles. Horváth and Ormós (1989b) measured an average coating
thickness on urea particles by using a dissolution test of a small sample and Oliveira
(1998) obtained the uniformity by weighing 20 individual particles. In a sense, the
measure of coating uniformity within an individual particle is very difficult to monitor
and barring a technology development in the area, the problem is likely to remain
unsolved.
2.5 Particle circulation
The movements of particles have a profound effect on the heat and mass transfer of
the particles to be coated on a fluidized bed. Several studies have been conducted on
the movement of particles in a fluidized bed and on similar equipment (i.e. spouted-
bed and spout fluidized-bed) and have shown that particle mixing in these devices is
better than in most other equipments. Several workers, including Heil (1985) and
Choi and Meisen (1997), have indicated that flow in spouted-beds and spout
fluidized-beds can be divided into two regions, one being the ‘active’ fountain region
where the liquid spraying takes place and the other encompassing the rest of the
bed where particles are well mixed.
The first design of a commercial fluidized-bed coating equipment by Würster had an
inner cylinder (also known as draft tube) to enhance the particle movement within the
bed. The spray nozzle is placed at the bottom centre of the distributor plate so that the
movement of the coated particles is in the same direction as the fluidizing gas. The
assembly resulted in a draft movement of particles which improved particle
circulation but reduced the overall mixing. Other designs like Glatt used a cone at the
centre of the distributor plate to improve particle circulation (Lehmann and Dreher,
1981). There is also a rotary tangential spray coater which employs a variable speed
disc and a slit instead of a conventional distributor plate to induce particle circulation
(Jones, 1988).
Apart from the good mixing, a number of studies have shown that there is a
circulation of particles within a fluidized bed. Whitehead (1985), Van Deemter
(1985) and Kunii and Levenspiel (1985) summarize the vertical and horizontal
migration of particles. Recently, Stein et al (1997) used the positron emission to track
particles and they confirmed the presence of migration within the bed and suggested

13
how the fluidization velocity influences the rate of migration. Sherony (1981)
employed the circulation pattern of a twin-compartment together with the differential
population balance method developed by Hulburt and Katz (1964) to obtain the
residence time distribution of particles on the active region. Wnukowski (1989) used
the two-compartment model to simulate batch and continuous particle coating in a
fluidized bed. He found that the size of the active region is small, merely a few per
cent of the entire particle population.
Several studies have shown the importance of flow to and around the active zone
on the whole process of particle coating (Horváth and Ormós (1989b), Becher and
Schlünder (1998), Choi and Meisen (1997) . Wnukowski and Setterwall (1989)
concluded that for a more uniform coating the active zone needs to be large, rate of
mixing must be high and the coating spraying rate should be kept as low as
technologically and/or economically possible. These recommendations are supported
by the practice in pharmaceutical industries where beds are short with an operational
cycles of several hours. Hüttlin (1997) have developed the ‘turbo jet drive’ which
uses slanted plates instead of a conventional distributor plate to induce triagonal
particle movement leading to a better circulation and mixing.
2.6 Temperature and humidity distributions
In fluidized bed coating, both heat and mass transfer must take place for the particles
to be coated. As explained by Reay and Baker (1985), Muroyama and Fan (1985),
Agrawal and Ziegler (1966) and Kunii and Levenspiel (1991), the temperature and
humidity readings are indicators of these transfers. The type, quality and thickness of
any coating is determined by, among other factors, the temperature and humidity in
the spraying region and in the rest of the bed (Nienow and Rowe, (1985), Davies
and Gloor (1971) and Laicher et al (1993)).
The effect of temperature distribution on the formation of the granules, and
especially in the production of agglomerates, has been studied. Using a Glatt
fluidized bed granulator, Schaefer and Worts (1978) investigated the effects of
temperature and humidity of inlet gas on the size of the agglomerates formed. They
concluded that there was an inverse proportionality between the size of the
agglomerates and difference between the inlet dry bulb temperature and the outlet wet
bulb temperature. They found that a similar particle size can be obtained by keeping
the heat transfer driving force constant.

14
Davies and Gloor (1971) revealed that a very high fluidization temperature results in
little or no particle growth while a very low fluidization temperature is likely to
course defluidization by wet quenching. More recently, during the coating of dragée
seeds with a polymer in a fluidized bed, Horváth and Ormós (1989a) found that
different fluidizing gas temperatures may lead to layers with different characteristics
even when the same coating material is used. Becher and Schlünder (1998), in the
process of coating using a spouted fluid-bed, have established that the gas
temperature is crucial in obtaining a high throughput and lowering incidents of
agglomeration.
There have been few studies on how the temperature is distributed inside the bed
during the coating process. One study by Nienow and Rowe (1985) has shown that,
when a submerged nozzle is used, the sprayed liquid will evaporate in the region
close to the atomizer. The most noticeable contribution is that of Smith and Nienow
(1983) who used high-speed x-ray cine-photography to construct the diametrical
plane temperature profile for a submerged nozzle. In another study, Wnukowski
(1989) used glass-beads which were top sprayed with water. He identified three
distinct temperature regions, one near the distributor plate, another at the top near the
nozzle and the third, comprising the bulk of the bed, sandwiched between the two
regions. He established that there is intensive heat transfer between the entering gas
and the particles in the region next to the distributor plate. Apart from that region and
the spraying region, little heat is transferred in the remainder of the bed. There has
been a slower development in establishing the humidity distribution inside the bed.
2.7 Mechanism and kinetics of growth
A knowledge of the mechanism of growth can be used in estimating the rate and size
of the coating under given process conditions. Several workers have developed the
mechanism for fluidized and spouted beds. Their conclusions differ depending on the
assumptions and approach used in developing the models. One of the existing
models is that developed by Smith and Nienow (1983) based on the assumption that
the coating material is evenly distributed over the entire population of particles.
However, the particle distribution results obtained by Kucharski and Kmiec (1989)
show that the layered growth per unit time in a spouted bed is not uniform for all
particles. Lehmann and Dreher (1981) reported results for coating tablets which
show that the size distribution of the final product does not resemble that of the seed
particles as is expected if the growth were uniform.

15
Smith and Nienow (1983) developed a growth mechanism in a fluidized bed and
they concluded that all particle growth start with agglomeration. Then, if the bonds
holding the particles together are not strong enough, they break down and,
depending on the extent of breaking, the result will be bed-quenching, agglomerates
or layered growth. Similar growth mechanisms were suggested by Cherif et al
(1996) and by Link and Schlünder (1997). Wnukowski (1989) employed the two-
compartment model of particle movement to develop a growth mechanism for
particles coated in a fluidized-bed. He showed that by analysing the region around
the atomizing device, one can derive a basic equation governing the liquid deposition
and, together with the system residence time distribution, develop a mechanism for
the growth. He concluded that, for a batch system, the coating mass is normally
distributed and the variance is a linear function of time. For a continuous system with
selective classification, the coating mass is close to a exponential distribution. Iley
(1991) and Saleh et al (1998) found that different particle sizes capture different
amounts of coating and that the degree of porosity in seed particles will affect the
quality of the coating.

16
3. Temperature and humidity profiles
In this chapter, the contents of paper I and paper II are summarized and, where
necessary, additional information is supplied to complement them. Paper I explains
the need and the procedure for establishing gas temperature and humidity profiles in a
fluid bed coating system. Paper II employs what was developed in paper I to obtain ,
detailed information on the temperature and humidity profiles in terms of their
position, shape, size and characteristics for a top spraying fluidized bed process. The
two types of particles used in the experiments, lactose and glass-beads, were chosen
because of their difference in terms of size, distribution and surface characteristics.
3.1 Establishing the profiles
The ability to measure and to monitor the gas humidity and temperature profiles
provides an important tool for the design and operation of any fluid-bed coating
system. A number of studies have been carried out mainly dealing with the
temperature distribution inside the bed. Smith and Nienow (1982) used a high-speed
x-ray cine-photography to obtain the temperature profile for a nozzle submerged in
the bed, and they showed how the temperature profiles change with increasing
fluidization velocity. One of the results they obtained is reproduced in figure 3.1.
Another study whose graph is reproduced as figure 3.2 is that by Wnukowski
(1989), who observed three distinct temperature regions in the top spraying of a
fluidized bed containing glass-beads particles. He established that there was an
intensive heat transfer next to the distributor plate, with heat being transferred from
the entering gas to the particles. He also found that no heat or mass was transferred
in the middle region of the bed (represented in figure 3.2 by a horizontal part of the
lines). In the spraying region, the gas temperature decreases as one moves towards
the spray nozzle.
3.2 Experimental Setup
The experiments were carried out in a pilot plant with a capacity of up to 10 kg and
capable of both batch and continuous operation. All experiments were batch and
operated in an open cycle mode. The fluidizing region of the bed was half-conical,
half-cylindrical, with the conical part placed at the bottom close to the distributor
plate.

17
Figure 3.1 Diametrical plane isotherms of a bed of 270 µm glass particles
sprayed with menthol at a rate of 2.1*10-4 kg/s (from Smith and Nienow, 1982)
Figure 3.2 Temperature profiles recorded under different experimental
conditions (from Wnukowski, 1989). (Solid lines correspond to the
center of the bed and dashed lines correspond to points near the wall).

18
The diameter of the conical part of the bed was 0.225m at the bottom and 0.3m at the
top. To provide an even air distribution, the distributor plate was made up of two
stainless steel punched plates one on top of the other and a stainless steel wire mesh
(w=0.325 mm) at the top. Each of the steel plates was 1 mm thick and had 1 mm
rectangular spaced punched holes. The effective fluidized bed height can be varied
up to 0.4m by adjusting the position of the spray nozzle. The experimental set-up is
shown in figure 3.3.
Compressed air (3.75 bar)
Nitrogen (2 bar)
Fan Heater
Sampler
Cyclone
Hopper
Hygrometer
Air
Water
Probe
Nozzle
Moist Air
DigitalThermometer
Figure 3.3 Schematic diagram of the experimental layout
Two types of seed particle, lactose and glass-beads, were used for the experiment.
The lactose seeds were predominantly spherical with a diameter of about 1 mm and a
density of 1525 kg/m3, while the glass-beads had a diameter of about 0.5 mm and a
density of 2600 kg/m3. In each experiment, a 4 kg batch of seed particles was
introduced through the hopper to the bed and fluidized using hot air at about 63°C for
lactose and 66°C for glass-beads. The lactose particles were fluidized at a range
between 3Umf and 4Umf while the glass-beads were fluidized between 7Umf and
10Umf. For the lactose particles, a spray nozzle was placed 300 mm above the

19
distributor plate, while for the glass-beads, the nozzle was located 270 mm above the
plate. In both cases, the nozzle (Schlick 940 form 7-1) was placed 90 mm above the
height reached by fluidized particles. Water (20-22°C) was supplied at a rate of 0.9
cm3/sec and was pressurized using nitrogen at 2 bars. The water was piped to the
nozzle where compressed air at 3.75 bar was used to atomize it, and it was sprayed
at the centre axis on the surface of the fluidized bed in a full cone covering 40°.
The air temperature and humidity in different parts of the bed was measured using a
specially designed probe. The probe was introduced from the top with an off-centre
axis of rotation so that its horizontal path included the centre axis of the bed (Figure
3.4). The probe, which could be moved vertically on the whole operating range of
the bed, was made of steel tube, bent and closed in one end with a hole facing
downwards near the end. As shown in detail in Figure 3.5, the probe hole was
covered with a steel or nylon mesh which allowed the gas to pass but not the
particles. Inside the tubing and close to the opening, the gas temperature was
measured using a Cr-Al thermocouple connected to a digital thermometer (Doric
450). The end of the thermocouple was suspended using a poor conducting material.
Probe's Axis of Rotation
Probe's Path
Figure 3.4 Position and path of the probe

20
Hygrometer
to thermometer
Thermocouple
Suspender
Wire
Mesh
Gas to the
Fluidising Gas
Figure 3.5 Cross section design of the probe.
A small amount of gas was tapped from the point of measurement and passed
through the tube to a hygrometer (Testo 601), where its percentage humidity and
temperature were measured.
For each of the selected distances from the distributor plate, fifteen readings were
obtained starting from the centre axis of the bed towards the wall. In those areas of
the bed where fluctuations in temperature and humidity were detected, both the
minimum and the maximum readings were recorded. The probe was then lowered or
raised and another set of readings was obtained. This procedure can be used in any
fluid bed system, provided that the probe can reach different parts of the bed without
any major interference on the spraying. A probe itself ought to be small in diameter
but with enough passageway to allow gas to be tapped for the humidity measurement
in the hygrometer. At the same time, the probe must be strong enough to avoid
wobbling during measurement. It is also possible to connect the hygrometer and
thermometer to a data acquisition system.
3.3 Data processing
The processing of the measured data into informative and easy to read graphs is an
important step in understanding the thermodynamics inside the bed. Once the coating
system is well understood, the proper design and optimization of the process can take

21
place. The procedure for obtaining the profiles is explained in detail in paper I where
the average values are used for those points where fluctuations in temperature and
humidity were recorded. A typical isotherm graph for a top spraying system is
shown in figure 4 of paper I. A more instructive profile is obtained by combining the
isotherm contour graph with the color maps. In the making of colormaps, different
temperatures are assigned different colors covering the entire measurement range.
However, the software that was employed to construct the colormaps (MATLAB)
shows each point in the raw data matrix as a rectangular color plot. The resulting
profile is of a poor quality and does not provide a clear picture of the conditions
inside the bed. A typical result for a color profile from raw data points is shown in
figure 3.6
120 100 60 0 60 100 120
170
180
190
200
210
Radial Distance (mm)
Dis
tanc
e fr
om th
e D
istr
ibut
or P
late
(m
m)
Figure 3.6 Temperature colormap from raw data for the upper part of the
bed for the lactose-water system when U-Umf=0.874 m/s and
liquid spraying rate of 0.9*10-6 m3/s.
The extra points essential for colour profiling are generated by interpolation of the
adjacent measured values. Different colours or shades of gray are assigned to specific

22
values within the measurement range. A colour or gray profile for temperature and
humidity can then be obtained. The assignment is done using a built-in MATLAB
function - pcolor. For profiles of better quality, extra points are generated for each
adjacent pair of measured points. These extra points are calculated as the average of
the two adjacent values, and they thus provide almost twice as many points for each
generation circle. The procedure for generating extra points is as follows:
Consider x sets of temperature data measured at a specific distance from the
distributor plate, each with y points. The matrix M of the measured values will be
y times x in size.
M =
1,1t 1,2t L 1,yt2,1t L L 2,ytM M M M
x,1t L L x,yt
Extra points are first generated horizontally;
2i−1,yt = i,yt for i=1 to i=x
2i,yt = i,yt + i+1,yt2
for i=1 to i=x-1
and then vertically in order to maintain the ‘relative’ shape of the bed,
i,2 j−1t = i,yt for j=1 to j=y
i,2 jt = i,yt + i,y+1t2
for j=1 to j=y-1
The coating process is assumed to be a symmetrical system. The profiles for the
whole diametrical cross section were therefore obtained by producing a mirror image
of the measured half and joining the two halves. The contours are then superimposed
onto the colours or gray profiles to obtain the complete profiles. It is also possible to
involve more of the surrounding measured points in the generation of extra points. If
large enough number of points are measured, the process of generating extra points

23
will not effect the isotherms. Figure 3.7 shows the contours of a temperature profile
before and after the generation of extra points. They are similar in all aspects except
for the few sharp corners that are smoothened by the generation process.
The heat source and sinks revealed by the profiles can be shown using isotherms
superimposed with the gradient arrows, as shown in figure 3.8. The gradient arrows
points away from the heat source towards the heat sink and the size of each arrow is
proportional to temperature gradient of the point it represent. Regions with short
arrows have fairly constant temperatures. Similar procedures can be used to obtain
the humidity profiles.
120 100 60 0 170
180
190
200
210Unprocessed Data
Distance from the Center (mm)
Distan
ce fro
m the
Distr
ibutor
Plate
(mm)
0 60 100 120170
180
190
200
210Processed Data
Distance from the Center (mm)
Distan
ce fro
m the
Distr
ibutor
Plate
(mm)
Figure 3.7 Comparison of isotherms constructed from
unprocessed and processed data.
3.4 Temperature and humidity characteristics
The characteristics of temperature and humidity profiles inside a top spraying
fluidized bed was also investigated. The procedures explained above were applied to
lactose and glass-beads particles and their profiles were obtained under different bed
conditions. The bed was found to have a low temperature region covering the top
surface and extending inwards towards the distributor plate. The low temperature
regions for both lactose and glass-beads form one of two shapes, a bell-shaped
profile or a funnel-shaped profile. A number of typical bell-shaped and funnel-
shaped profiles are presented in paper II. A typical bell-shaped temperature profile is
shown in figure 2 of paper II and an example for a funnel-shaped profile is shown in
figure 3 of the same paper. One of the interesting findings from the profiles is the

24
existence of pockets of low gas temperature that are not joined to the rest of the low
temperature region. The areas in the upper part of the bed received most attention
because that is where the spraying of coating and most of the drying takes place.
0 60 100 120170
180
190
200
210
Radial Distance (mm)
Dis
tanc
e fr
om th
e D
istr
ibut
or P
late
(m
m)
Figure 3.8 Temperature gradients showing heat source and sinks.
The region covered by the high gas humidity is the same region that is covered by
the low gas temperature. This is to be expected, because heat is transferred from the
gas phase to evaporate the solution on the surface of the particles and this leads to a
decrease in gas temperature and an increase in its humidity. Although they both
occupy the same bed region, the shape of the high humidity region does not always
follow the shape of the corresponding low temperature region. This can be seen in
figure 3.9 which shows the humidity profile for a lactose/water system. The profile
can be compared with the corresponding temperature profile shown in figure 3.10
Regions close to the surface are characterized by sharper temperature and humidity
gradients than to the rest of the bed. These gradients indicate the regions where most
of the heat and mass are transferred. The exact depth reached by the profiles depends
on the operating conditions of the bed. At the same time, once the bed settles to form

25
120 100 60 0 60 100 120110
120
130
140
150
160
170
Radial Distance (mm)
Dis
tanc
e fr
om th
e D
istr
ibut
or P
late
(m
m)
Gas Humidity
[g/kg air]
5
6
7
8
9
10
11
11.5
12
Figure 3.9 Humidity profile for a potion of the bed in lactose/water system
when U-Umf=1.02 m/s. The values are in g/kg air.
120 100 60 0 60 100 120110
120
130
140
150
160
170
Radial Distance (mm)
Dis
tanc
e fr
om th
e D
istr
ibut
or P
late
(m
m)
53
54
55
56
57
58
59
Figure 3.10 Temperature profile for a potion of the bed in lactose/water system
when U-Umf=1.02 m/s. The values are in °C.

26
one of the two profiles, an increase in fluidization velocity will not alter the profile.
Instead, what is likely to happen is that the profile is shifted upwards, resulting in an
increase in the temperature and humidity gradient near the surface.
Both temperature and humidity profiles show that pockets of low temperature and
high humidity are created deep inside the bed. These pockets are located in the
regions not reached by the spray solution and are surrounded by areas of high
temperature and low humidity. A number of graphs in paper II shows the existence
of these pockets in both lactose/water and glass-beads/water systems. Around these
pockets are areas with the largest temperature and humidity fluctuations. A typical
temperature fluctuation which is a difference between local maximum and local
minimum is shown in figure 3.11.
120 100 60 0 60 100 120140
150
160
170
180
190
200
210
Radial Distance (mm)
Dis
tanc
e fr
om th
e D
istr
ibut
or P
late
(m
m) 3.5
3.0
2.0
1.5
1.0
0.5
0
Temper atur eFl ac tuat i ons
[°C]
Figure 3.11 A typical example of the intensity of temperature fluctuation sin a lactose/water system.
A region of maximum gas temperature is formed in the bed outside the region next to
the distributor plate. This region is located below the area with pockets of low gas
temperature and their associated fluctuations. Apart from areas next to the distributor
plate, the gas temperature in this region is the highest in the bed. Below this area the
27
gas temperature is stable i.e. it does not fluctuate as does the gas temperature in areas
above it. When the bed forms a bell-shaped gas temperature profile, the region of
maximum gas temperature created is thick and confined around the center axis of the
bed. When a funnel-shaped temperature profile is formed, however, the region of
maximum gas temperature becomes thin and extends radially to areas close to the
wall. The graphs in paper II show the shape and position of this region.
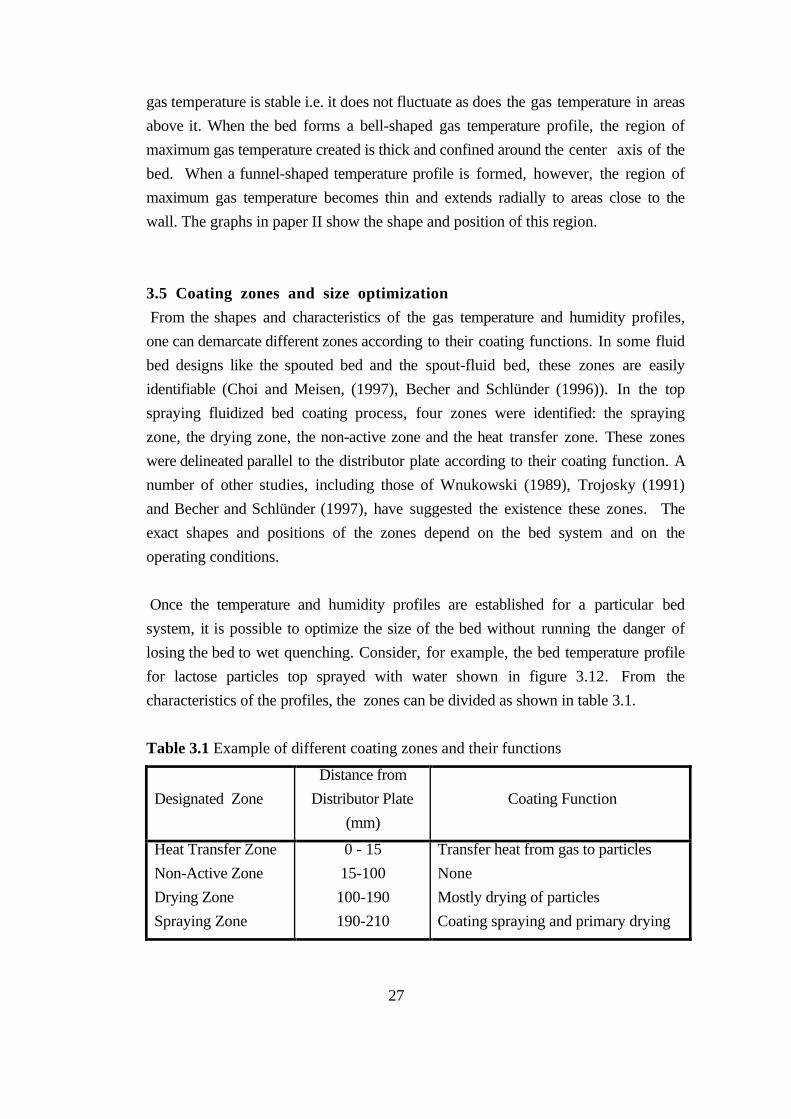
3.5 Coating zones and size optimization
From the shapes and characteristics of the gas temperature and humidity profiles,
one can demarcate different zones according to their coating functions. In some fluid
bed designs like the spouted bed and the spout-fluid bed, these zones are easily
identifiable (Choi and Meisen, (1997), Becher and Schlünder (1996)). In the top
spraying fluidized bed coating process, four zones were identified: the spraying
zone, the drying zone, the non-active zone and the heat transfer zone. These zones
were delineated parallel to the distributor plate according to their coating function. A
number of other studies, including those of Wnukowski (1989), Trojosky (1991)
and Becher and Schlünder (1997), have suggested the existence these zones. The
exact shapes and positions of the zones depend on the bed system and on the
operating conditions.
Once the temperature and humidity profiles are established for a particular bed
system, it is possible to optimize the size of the bed without running the danger of
losing the bed to wet quenching. Consider, for example, the bed temperature profile
for lactose particles top sprayed with water shown in figure 3.12. From the
characteristics of the profiles, the zones can be divided as shown in table 3.1.
Table 3.1 Example of different coating zones and their functions
Designated Zone
Distance from
Distributor Plate
(mm)
Coating Function
Heat Transfer Zone
Non-Active Zone
Drying Zone
Spraying Zone
0 - 15
15-100
100-190
190-210
Transfer heat from gas to particles
None
Mostly drying of particles
Coating spraying and primary drying

28
In figure 3.12 and table 3.1 it can be seen that almost one third of the bed is ‘wasted’
as far as the coating process is concerned. Therefore, the coating operation can be
improved by decreasing the size of the bed. If all other variables are maintained
(including the distance from the nozzle to the bed surface), the decrease in bed size
will decrease the size of the non-active domain, and this will in turn increase the rate
of coating. It may not be possible or desirable to get rid of the entire non-active
domain, but a large portion of it may be removed without any negative effect on the
coating process.
120 100 60 0 60 100 120 0
30
60
90
120
150
180
210
Radial Distance (mm)
Dis
tanc
e fr
om th
e D
istr
ibut
or P
late
(m
m)
52
53
54
55
56
57
58
59
60
61
Figure 3.12 Diametrical plane gas temperature profile for the entire bed in a
lactose/water system when U-Umf=1.02 m/s, inlet air temperature
of 62°C and top sprayed with water (20 °C) at a rate of 0.9 cm3/s.

29
4. Modelling the process
This chapter presents a summary of the modelling of the fluid bed coating
process. The model is based on the surface renewal concept applied to the bed to give
a population balance equation for the coated particles. In the model, the bed is
divided to three compartments, based on their coating functions, from which the
effects of bed size, unequal mixing and the presence of stagnant regions are
assessed. Different combinations of bed size and transfer between the regions were
employed during the modelling. The details of the model is presented in paper III.
4.1 Conceptual model
The model uses a surface renewal concept as defined by Dackwerts (1951) to
explain the fluid bed coating process. The concept is based on the principal that a
transport occurs at a stagnant interface which can be separated from bulk of the
turbulent mass. Sherony (1981) employed the concept together with the statistical
mechanical model developed by Hulburt and Katz (1964) to determine the residence
time of particles in a coating region and hence a coating distribution. Since the
coating mass deposited on the particles is proportional to the time they spend in the
spraying region, a population mass distribution for the coating can be developed. In
their study, Wnukowski and Setterwall (1989) developed population balance
equations (PBE) based on the concept by dividing the bed into two compartments,
one being the feed zone where particles are sprayed with coating and the other the
bulk of the bed where particles are dried and mixed. They were able to obtain
consistent results for the coating population balance equations.
A study of the top spraying fluidized bed (Wnukowski, 1989) reveals that the size
of the spray region is small, only a few per cent of the entire bed volume. The
existence of a small spraying region is supported by a study by Choi and Meisen
(1997) in which particles were coated in a bottom spraying spouted bed. Becher and
Schlünder (1997) investigated the gas and particle motion and how they influence the
moisture distribution in a spout-fluid bed. They also found that the depth reached by
the spray within the ‘wetting region’ is small. Therefore, the spraying region can be
considered as a distinct region within the bed where particles become coated if and
only if they visit it.
The macro-circulation of particles within the bed can occur naturally as backmixing
or by design where the bed is constructed or operated to create such a circulation. In

30
the conventional fluidized bed, particles migrate both vertically and horizontally
(Potter (1971), Van Deemter (1985), Whitehead (1981), Kunii and Levenspiel
(1991)). During the upward and downward movements, particles are exchanged
between the streams resulting in a migration between different zones. While some
particle circulation occurs naturally, other circulation happens by design. In a spouted
bed, the circulation occurs when particles are forced upwards through the annulus
by the spouting gas ( Kmiec (1980), Choi and Meisen (1998)). The operation of a
spout fluid bed is also aimed at causing particle migration inside the bed between the
two clearly identifiable coating regions (Becher and Schlünder, 1997). The normal
fluidized bed can also be modified to enhance particle circulation with little effect on
the high heat and mass transfer character of the bed. The use of a draft tube in the
Würster design, partial blockage of the distributor plate in some Glatt designs, and
angular introduction of fluidized gas as in the Hüttlin design, are all aimed at
enhancing particle circulation. In all these examples, the size difference between the
different regions and the migrations between them can be manipulated so that the rate
of transfer between them is different.
From these studies, the movements of particles in the bed and the results explained in
§3.5, the bed can divided into three regions (domains) with respect to their coating
functions. The three domains are;
G - Active spraying domain : where coating is deposited on the particles
F - Active drying domain : where drying of the coating takes place
E - Non active domain : which is not involved in the coating process
The bed can be graphically represented as shown in figure 4.1. With the assumptions
listed in paper III, the material balance for the domain will give the following set of
population balance equations;
∂f∂t
= aβα
g + b1 − β
e − (a + b)β(1 − α)
f (4.1)
∂g∂t
+ rβα
∂g∂w
= aβ(1 − α)
f − aβα
g (4.2)

31
∂e∂t
= bβ(1 − α)
f − b1 − β
e (4.3)
aa
bb
r
β(1−α)
1−β
βα
F
E
G
Figure 4.1 Graphical representation of the model
Introducing a dimensionless time variable τ and a dimensionless coating variable x
and constants A, B, C, and D, the following equations are obtained:
∂g∂τ
+ ∂g∂x
= Af − Cg (4.4)
∂f∂τ
= Cg + Be − f (4.5)
∂e∂τ
= Df − Be (4.6)
where;α is the proportion of the active region involved in coating
β is the proportion of the bed involved in coating
τ is the dimensionless time variable based on the residence time in F
x is the dimensionless coating variable
a is the rate of exchange between domains F and G

32
b is the rate of exchange between domains F and E
e is the fraction of the population with weight w±dw/2 in domain E
f is the fraction of the population with weight w±dw/2 in domain F
g is the fraction of the population with weight w±dw/2 in domain G
r is the rate of spraying
Equations (4.4) - (4.6) are coupled parabolic partial differential equations and they
are solved numerically. Applying the method of characteristics together with the
trapezoidal rule, the following results were obtained;
g(τ + 1,x + 1) = 12 + Z∆C
(2 − Z∆C)g(τ,x) + AZ∆f(τ + 1,x + 1) + AZ∆f(τ,x)[ ] (4.7)
e(τ + 1,x + 1) = 12 + ∆B
(2 − ∆B)e(τ,x + 1) + D∆f(τ + 1,x + 1) + D∆f(τ,x + 1)[ ] (4.8)
f(τ + 1,x + 1) = 12 + ∆
2 − ∆( )f(τ,x + 1) + C∆g(τ + 1,x + 1)[+B∆e(τ + 1,x + 1) + C∆g(τ,x + 1) + B∆e(τ,x + 1)]
(4.9)
where ∆ is the unit increment in dimensionless time
and the constant Z is defined as Z = 1 + 12C
(4.10)
4.2 Numerical simulation
The numerical method was used to simulate how the coating distribution varies with
process time under different bed conditions. Normal statistical equations were used
to determine the dimensionless mean coating weight and the coating variance. The
size of the active spraying domain was fixed at 10% of the entire bed volume,
whereas the size of the non-active domain E was varied between 1% and 40% of the
bed volume. The rates of transfer between domains were also varied and the effects
of these changes on the coating distribution were investigated. The increment ∆=1/3
and ∆=1 were used for both dimensionless time and dimensionless coating weight.
The coating distribution was assessed for different process times between τ=10 and
τ=360.

33
Since the dimensionless time is based on the residence time in domain F, a variable
which changes with the domain size and the rate of transfer to or from it, then a basis
condition was chosen from which all set-ups can be properly compared. The basis
condition was for domains G, F and E to be equal to 0.1, 0.7 and 0.2 respectively,
while the basis rate of transfer between domains was set at 0.01. The comparison
was made by first obtaining the dimensional time for the basis conditions to permit
the calculation of the dimensionless time to be used to simulate the coating under
different bed conditions. The consistence in process time was checked using the
value of the mean coating weight. The coating distributions are then compared in
terms of relative variance (R.V.) using the equation :
R.V. = variance for a certain bed condition/ variance for the basis condition
4.3 Coating distribution
The coating distribution in the bed depends upon the size of different domains and
on the rate of transfer between them. For a short process time, the distribution in one
end at τ=τmax remains ‘open’ representing a fraction of the bed that has not been
coated. As shown in figure 4.2, the number of uncoated particles decrease
exponentially with increasing process time until all particles are coated to one extent
or another. The size of the spraying domain and the rate of transfer to and from it will
determine the rate of disappearance of uncoated particles. When the rate of transfer to
and from the non-active domain is higher than the rate of transfer to the active
spraying domain, the process will take longer to get rid of all uncoated particles.
With long process times, the coating deposited will be normally distributed
irrespective of the sizes and the rates of transfer between the domains. Those factors
will decide how fast the normal distribution will be attained. The effects of different
bed sizes and the change in rates of transfer are assessed by comparing the variance
of the coating distribution under different bed conditions.

34
10.0
8.336.67
5.003.33
1.67 0
10.0
8.33
6.67
5.00
3.33
1.67
0 0
0.2
0.4
0.6
0.8
1
Dimensionless WeightDimensionless Time
Fra
ctio
n o
f th
e B
ed
Figure 4.2 Coating Distribution for short process time τ=10 and a step
size ∆=1/3 with equal rate of transfer between domains and basis conditions .
Care must be taken to minimize the errors introduced by the choice of the step size ∆
used for the numerical simulation. The use of a large step size can lead to misleading
results especially with regard to the coating variance for a short process time. As can
be seen in figure 4.3 (a), when τ=20 an increase in the size of the non-active domain
E leads to a decrease in relative variance for all four step sizes. This is the opposite of
what is expected in a real coating process. For intermediate process times, the real
effect of the choice of step size becomes obvious. In Figure 4.3 (b), the variance
decrease with an increase in the non-active domain E when ∆=1, but the opposite
occurs when ∆=0.25. For a long process time, the effect of the step size is less
pronounced. Thus, for reliable results, a small step size must be used. The smallness
of ∆ is to be limited only by the practical significance of the step chosen.

35
0
0.5
1
1.5
2
Re
lativ
e V
ari
an
ce
0 0.1 0.2 0.3 0.4 0.5
Size of Domain E
τ=20
∆=0.25
∆=0.333
∆=0.5
∆=1
(a)
0.7
0.8
0.9
1
1.1
1.2
1.3
Rel
ativ
e V
aria
nce
0 0.1 0.2 0.3 0.4 0.5
Size of Domain E
τ=60
∆=0.25
∆=0.333
∆=0.5
∆=1
(b)
Figure 4.3 The effect of step size (∆) on the coating variance for(a)-a short process time, (b)-an intermediate process time.
4.4 Mixing and unequal transfer
The model reveals that high mixing rates produce a coating with a narrow
distribution. However, the damage to the particle caused by higher fluidization
velocities together with spray drying of the coating material limit the rate mixing to
lower values. When the rate of transfer to the spraying domain is sufficiently high,

36
the effects of the size of the non-active domain on the coating distribution becomes
less significant (figure 7 of paper III). Therefore for a narrow coating distribution,
the possibility of increasing the size of the spraying domain while avoiding the
danger of wet quenching ought to be explored.
The effect of unequal transfer between domains shows that an increase in the rate
of transfer between any of the domains will narrow the coating distribution. As
shown in Figure 4.4, the relative variance of the coating decreases with any increase
in the transfer between domains. The results also shows that an increase in the rate of
transfer to the active spraying domain will result in a narrower coating distribution
than the same increase in the rate of transfer to the non-active domain. This trend
holds for the entire range of the non-active domain investigated. For a given rate of
transfer between domains, an increase in the size of non-active domain will also
slightly increase the variance of the coating distribution. All the observations are
based on the assumptions that particles are well mixed within all domains.
0.01
0.100.20
0.300.40
1/5
1/3
1
3/1
5/10.2
0.4
0.6
0.8
1
1.2
Rel
ativ
e V
aria
nce
a/b Size of Domain E
Figure 4.4 Variance of the coating distribution as it changes with a/b and withthe size of non-active domain for dimensionless time τ =360 and increment ∆=1.

37
The results obtained using the model indicate that the ideal fluid bed coating process
is one with a large spraying domain supported by a vigorous mixing and a moderate
rate of transfer to a small non-active domain. A bed with such a design will produce
particles with a narrow coating distribution in the shortest possible time. In practical
applications these favorable conditions are limited by the ability of the gas to dry the
sprayed particles and by the problems of attrition, elutriation and surface damage
associated with high fluidization velocities. The conventional fluidized bed system
falls short of being an ideal coating bed because the spraying domain is small and
cannot easily be enlarged. Furthermore, it is not easy to manipulate the transfers
between domains or to increase the rates of mixing without damaging the particles or
spray-drying the coating solution. With the Würster design, the presence of a draft
tube makes the transfer between domains easy to manipulate, but the size of the
spraying domain can not be increased without the danger of bed collapse by wet-
quenching. The use of multiple nozzles in a Glatt design can increase the size of the
spraying domain provided that the bed can dry the particles. The Glatt design has an
inherent setback in that it is not possible to manipulate the rates of transfer between
the domains. The relatively new Kugelcoater from Hüttlin has multiple nozzles,
which increases the size of the spraying domain and it uses inclined slots for a
distributor plate which increases the particle mixing and circulation. With the
spraying zone spread over a large area and the triagonal particle movements, the
transfer between domains is high even at a low fluidization velocity. In all the above
designs, the combination of different domain sizes and the transfer between them,
can be employed to produce particles coated to a particular distribution.
38
5. Kinetics of growth
This chapter summarizes the mechanisms and kinetics of particle coating for a top
spraying fluidized bed process. It explains how and when particles are coated and the
mechanisms involved in the process. The methods employed in measuring and
assessing the coating on the particle surfaces are examined and their suitability in
monitoring the coating uniformity is assessed. A model is presented to explain the
difference in kinetics of growth observed in the experimental results and in the
existing models. The effect of particle size distribution on the coating process is
determined and compared with other studies. This chapter summarizes and expands
the material presented in paper IV.
5.1 Mechanism of growth.
Coating takes place when a coating material in the form of a solution, suspension
or melt is sprayed onto particle surface and subsequently dried. Inside the bed, the
drying is accomplished by the fluidizing gas together with the heat stored in the
particles. For a particle to be coated, the coating material must be deposited on its
surface before the solvent is evaporated from the coating solution or before the
temperature is drops below the melting point. The spraying takes place in the vicinity
of the nozzle and only the particles that are within the range of the spray can receive
a coating. After being sprayed, particles move to other parts of the bed where the
spray solidifies further to form a permanent coat on the particle surface.
Essentially, the same mechanism takes place in all fluid bed coating systems (i.e.
fluidized bed, spouted bed, spouted fluid bed) and in other coating systems like the
fluidized drum granulator (Litster and Sarwono, 1996). A number of competing
mechanisms may take place alongside the coating process, as detailed in § 1.2. Even
when the bed is operated so that other competing phenomena are minimized, the
particles will be coated if and only if they are sprayed with coating material. This was
found to be the case in spouted beds ( Choi and Meisen (1997), Oliveira (1998)), in
different types of fluidized beds (Norring Christensen and Bertelsen (1997), Link
and Schlünder (1997), Horváth and Ormós (1989a)), in spout fluid bed (Becher and
Schlünder (1998)) as well as in other coating processes like the rotary fluid bed
coater (Jones, 1988)) and the fluidized drum granulator.

39
5.2 Coating measurement and uniformity
A number of different methods can be employed to measure the coating material
deposited on seed particles. These includes sieve analysis of a sample (Smith and
Nienow (1983), Litster and Sarwono (1996) and Saleh et al (1998)), dissolution of
coated particle (Choi and Meisen, (1997), Kage et al (1996) and Tahara et al (1993)),
weighing of a sample (Laicher et al (1994), Horváth and Ormós (1989a)), weighing
individual particles ( Oliveira (1998), Wnukowski (1989)), release tests (Iley (1991)
and Laicher et al (1993)) and counting particles of different colours (Eldrege and
Drown (1998)). Most of these methods can provide a reliable result in terms of
coating distribution if a sufficiently large sample is measured and if the seed particles
are monodistributed. However, in most practical problems particles to be coated are
polydistributed. Unless there is a large increase in particle size due to coating, say
50% of the seed size, most of these methods cannot accurately measure the coating
distribution in the particles. This problem was pointed out in a number of studies,
including that of Smith and Nienow (1983) who elucidate that the growth rate they
obtained from sieve analysis is an average for the sample and does not represent
coating on an individual particle. Similarly, Weiss and Meisen (1983) explained that
a dissolution result from a sample does not represent the result for an individual
particle or for a narrow portion of that sample.
The processes which deals with the measurement of individual particles are the
only ones with the potential to reveal how the coating distribution changes with the
population during the coating process. A study by Paine (1993) showed that, in
order to obtain a reliable result representing the entire population, a critical number of
individual measurements must be made. The variance of the measured variable is
used to determine the actual number of individual particle measurements that will
ensure reliability. In most cases involving polydistributed particles, the critical
number of particles to be measured is of the order of several hundreds, which makes
the whole measuring exercise tedious and time-consuming.
For coated particles to be functional in a controlled release application, their coating
must be uniformly distributed. The uniformity must be attained within individual
particles where coating on one side of a particles must be ‘equal’ to coating on the
other parts of the particle. At the same time, coating uniformity among particles must
be maintained. A failure to achieve coating uniformity among particles and within
individual particles will render the particles unsuitable for controlled-release

40
applications. Even when the coating is intended only to modify the characteristics of
the particles, the coating material must be deposited on the entire surface of the
particles.
Few studies have looked into the problem of coating uniformity among particles.
Iley (1991) in the process of coating polydistributed particles in a bottom spray
Würster fluidized bed found that large particles captured more coating than their
smaller counterparts. Another study by Jozwiakowski et al (1990) dissolved 10
samples each of a single particle and measured their coating weight with a standard
deviation value as a measure of uniformity. A study by Thiel and Sberna (1986) used
50 samples of coated particles to determine the uniformity of the contents. They used
the coefficient of variance and coefficient of skewness for the mean coating content to
determine the coating uniformity. So far, little has been done in the measurement of
coating uniformity within an individual particle.
5.3 Growth model and kinetics
As explained earlier, particles are coated if and only if they visit the spraying region
of the bed. The number of times and the duration for which a particle visits the region
will determine the amount of coating that will be deposited on it. A number of studies
have concluded that the size of the spraying zone in a fluid bed system is small
(Wnukowski (1989), Choi and Meisen (1997) and Becher and Schlünder (1998)).
Therefore, it will take time for all particles to be coated. Since most of the seed
particles are polydistributed, the as yet unanswered question is whether or not all
particles have an equal chance of visiting the spraying zone. Experimental results by
Iley (1991) suggest that, in a bottom spraying process, large particles have more
chances to visit the coating zone, since they end up with more coating than other
particles. Furthermore, since the spraying region is small compared to the rest of the
bed, there is a need to determine what guides the chance of each particle size to be
coated.
The number of visits to the spraying zone is the basis for the existing kinetics
models of Sherony (1981), Wnukowski and Setterwall (1989) and Choi and Meisen
(1997). These models are based on the assumption that particles inside the bed are
perfectly mixed and that each has the same chance of being coated. The experimental
results of Iley (1981) and the existence of uncoated particles even after a long process

41
time (Choi and Meisen (1997)) indicates that the well-mixed equal-chance
assumption needs to be modified.
In one of the earlier layered growth models, Smith and Nienow (1983) assumed that
the coating material is concentrically and equally deposited around a core particle.
Other assumptions used were that there is no attrition, elutriation or break-up and that
all particles are spherical and homogeneous and grow only by coating deposition.
The cross section of an ideal coated particle with a coating thickness, z, can thus be
represented in figure 5.1, ρp being the core particle density and ρc the coating
density.
Z
d
Figure 5.1 Graphical representation of ideally coated particle
If one randomly measures the weight of N particles before they are coated, then a
PDF for the seed particles can be developed. The mean particle weight for the seed
particles will be;
Mean Particle Weight =i i
i j
i k
n wN
.=
=
∑(5.1)
where ni = number of particles weighing wi
and j and k are the weights of the smallest and largest particles respectively

42
If particles are uniformly coated as depicted in figure 5.1, then the weight of the
coated particles is given by:
ci i
c i i
w wd dz
= ++( ) −( )πρ 2
6
3 3
(5.2)
from which the mean particle weight and other distribution characteristics of the
coated particles can be calculated.
Mean Weight of Coated Particle =i ci
i j
i k
n wN
.=
=
∑ (5.3)
The skewness of the particle weight distribution is calculated from
γ = 3
2
32
mm
(5.4)
where m2 is the second moment
and m3 is the third moment
5.4 Coating experiment
The validity of the equal coating thickness model was assessed by coating seed
particles of a known distribution and then measuring the change in distribution with
time. White neutral lactose particles were used for the coating experiment. They were
mostly spherical particles with an equivalent diameter range of 0.957-1.311 mm and
a density of 1525 kg/m3. Two different seed sizes were used in order to find out how
the seed distribution affects the coating of particles. The first seed distribution went
through a 1.25 mm sieve and was retained on a 0.85 mm sieve, whereas, the second
distribution went through a 1.25 mm sieve and was retained on a 1.00 mm sieve.
The seed’s weight distribution is shown in figure 5.2.

43
0
5
10
15
20
25
% (
n/n)
Par
ticle
s
0 .7 0.8 0.9 1 1.1 1.2 1.3 1.4 1.5 1.6 1.7 1.8
Particle Weight (mg)
Seed II
Seed I
Figure 5.2 Particles seed distribution for seed I and seed II.
The particles were coated in the top spraying fluidized bed pilot plant at the Royal
Institute of Technology, Stockholm, the details of which are given in paper I. In each
experiment, a batch of 4 kg of seed particles was coated using 2.5%(w/w)
hydroxypropyl methylcellulose (HPMC) under different spraying rates and different
fluidization velocities. The details of the coating experiments are given in paper IV
and summarized in table 5.1. In each experiment, samples were withdrawn from the
bed using a sampler at a regular intervals. From each sample about 700 particles were
individually weighed and the overall distribution calculated. From the variances of
the seed and coated particle distributions, the number of particles measured was
deemed large enough to give a reliable representation of the whole batch (Paine,
1993). Other distribution characteristics such as mean particle weight, variance and
skewness were calculated using normal statistical equations.

44
Table5.1. Experimental parameters in the coating of lactose with 2.5% (w/w)
HPMC
Distribution after coating
After coating the two seed distributions at different spraying rates and with different
fluidization velocities, the PDFs for the coated particles show that the coating was not
uniformly deposited to all particles. In general small particles received more coating
material than their larger counterparts allowing them to migrate from lower weight
sizes to higher weight sizes. Furthermore, the number of particles immigrating to the
next weight sizes changed gradually over time confirming that the size of the
spraying zone is small. The changes in distribution for different particle sizes are
summarized in table 5.2 for seed I and table 5.3 for seed II.
Table 5.2 Distribution change for different sizes during the coating of seed I.
Particle Size
(mg)
Short Term Change
(fraction)
Long Term Trend
(fraction)
0.7 - 0.9
1.0
1.1
1.2
1.3 - 1.5
1.6
1.7 - 1.8
Gradual decrease
Fluctuation
Fluctuation
Fluctuation
Increase
No change
No change
Decrease
Decrease
No change
Slight Increase
Increase
Slight Increase
No change
Seed Type Excess Gas
Velocity (m/s)
Spraying Rate
(ml/s)
Nozzle Height
(mm)
Expt. 2
Expt. 3
Expt. 4
Expt. 5
Expt. 6
Expt. 8
I
I
Expt. 3
I
II
II
1.014
1.014
1.014
0.595
0.595
0.595
0.334
0.758
0.758
0.758
0.758
1.386
300
300
300
250
250
250

45
Table 5.3 Distribution change for different sizes during the coating of seed II.
Particle Size
(mg)
Short Term Change
(fraction)
Long Term Trend
(fraction)
0.8 - 1.1
1.2
1.3
1.4 - 1.6
1.7 - 1.8
1.9 - 2.0
Decrease
Fluctuation
Fluctuation
Increase
No change
-
Decrease
No change
Increase
Increase
Very small increase
Start to appear
As can be seen in figure 5.3 for Expt. 2 and other results given in paper IV, during
the coating of seed I, the number of small particles (0.7-0.9 mg) gradually decreased
in the early part of the experiment and the long term trend is for these particles to
decrease in number. In the same seed distribution, particles weighing 1.0-1.2 mg
show fluctuations in number in the early part of the coating process. When the
coating process goes on for long, the 1.0 mg particles decrease, the 1.1 mg particles
remains about the same and the 1.2 mg particles show a slight increase in number.
There is clearly a trend towards increasing numbers of particles weighing 1.3 to 1.5
mg during the whole process time. The number of particles weighing 1.6 mg did not
change in the early part of the process but in the long term a slight increase in their
number was observed. Large particles (1.7 and 1.8 mg) did not register any
significant change in number during the entire coating process.
For seed II particles, the general trend was similar to that for seed I, where small
particles decreased in number while the intermediate particles showed an increase in
number. With seed II, there is a shift upwards for the particle sizes whose number
fraction decreases. As can be seen in figure 5.4, the number of particles weighing
0.8-1.1 mg decreased during the entire process. Also, for short process times, the
fluctuation in number was limited to particles weighing 1.2 and 1.3 mg, whereas for
long process time there were no change in fraction of the 1.2 mg particles but
increase in the 1.3 mg particles. Particles weighing 1.4-1.6 mg increase in number
during the entire coating process.

46
0
5
10
15
20
25
% (
n/n)
Par
ticle
0 25 50 75 100
Coating Time (min)
1.2 mg
1.1 mg
1.0 mg
0.9 mg
0.8 mg
0.7 mg
Particle Weight
(a)
0
5
10
15
20
% (
n/n)
Par
ticle
s
0 25 50 75 100
Coating Time (min)
1.8 mg
1.7 mg
1.6 mg
1.5 mg
1.4 mg
1.3 mg
Particle Weight
(b)
Figure 5.3 Particle Weight distribution for seed I particles coated under Expt. 2
conditions (a)-particles weighing 0.7-1.2 mg (b)-particles weighing 1.3-1.8 mg.

47
However, unlike in seed I, after a long process times involving seed II there was a
very small increase in the number of large particles (1.7-1.8 mg), and the appearance
of few larger particles (1.9 and 2.0 mg) which were not present at the beginning of
the experiment. It is important to note that the short term trends for the middle of the
range particle size (i.e. 1.0-1.3 mg for seed I, 1.2-1.4 mg for seed II) may change
slightly with changes in beds operating parameters, but the overall trend will remain
the same.
5.5 Rate of growth.
The experimental results were used to determine how the mean particle size evolved
with time under different coating conditions. For a short process time, both seed
distributions show that, the growth rate can be fitted to a straight line (paper IV). For
a long process time, however, two distinct growth rates were identified. Particles
were found to grow faster in the early part of the process before settling to a lower
rate in the later part of the coating process. When a higher spraying rate was used,
the particle growth rate was also higher. Figure 5.5 shows how the particle weights
changes with process time for the two seed sizes. The changeover from one rate to
another happens between 100 min to 200 min of coating depending on the seed
distribution and on the spraying rate. Figure 5.6 shows how the mean coating
weight changed with time under Expt. 5 conditions for seed I. The measured points
cannot be fitted to a single straight line, while at the same time the number of points
are not sufficient to clearly identify two distinct growth rates.
The existence of preferential coating for small particles is reflected in the overall
particle distribution. The two distribution characteristics that were calculated from
coated particles are variance and skewness. For the seed I, whose distribution is
wider, there was a rapid decrease in variance in the early part of the process after
which the variance started to fluctuate. The variance for the seed II distribution
fluctuated right from the beginning and there was a general increasing trend for the
variance when the spraying rate was high. The increase in variance for seed II after a
long process time, reflects the creation of large particles that were not present at the
beginning of the coating process. There was also a decrease in skewness for seed I in
the early part of the coating process followed by relatively stable values later in the
process. This decrease in skewness and variance for particles of seed I, reflects the
decrease and even disappearance of smaller particles.

48
0
5
10
15
20
25
30
% (
n/n)
Par
ticle
s
0 25 50 75 100
Coating Time (min)
1.3 mg
1.2 mg
1.1 mg
1.0 mg
0.9 mg
0.8 mg
Particle Weight
(a)
0
5
10
15
20
% (
n/n)
Par
ticle
s
0 25 50 75 100
Coating Time (min)
1.9 mg
1.8 mg
1.7 mg
1.6 mg
1.5 mg
1.4 mg
Particle Weight
(b)
Figure 5.4 Particle weight distribution for seed II particles coated under Expt. 6
conditions (a)-particles weighing 0.8-1.3 mg (b)-particles weighing 1.4-2.0 mg

49
Figure 5.5 The particle growth rates for long process time, Expt. 3+4 for seed I
and Expt. 8 for seed II showing the two distinct growth rates.
11.2
11.4
11.6
11.8
12
12.2
Mea
n P
artic
le W
eigh
t (10
E4
g)
0 50 100 150 200 250
Coating Time (min)
Mean
Figure 5.6 Mean particle weight for seed I particles coated under
Expt. 5 conditions with insufficient points to show the two growth rates.

50
The variance and skewness do not significantly increase again since no new large
particles size is created outside the original seed size distribution. The decrease in
skewness for seed I also reflects the shift towards a normal distribution as particles
below the mean are coated and migrate to above-average sizes. This self correcting
characteristic is discussed in detail in paper IV.
5.6 Improved Growth Model
The existing growth models including that of Smith and Nienow (1983) are based
on the assumption that all particles are equally coated. However, in all our
experiments, this assumption could not be supported by the results. For the equal
coating assumption to be true, largest particles due to their large surface area will be
the first to migrate to the next higher weight level before small particles can do so.
Figure 5.7 shows the coating thickness required for each particle size to migrate to
the next weight size. The graph shows that if all particles are equally coated, then
there will be a skewed growth migration of particles to the next weight levels starting
with the largest particles. This will result in an increase in distribution variance, but
all our experimental results suggests that the opposite is happening. Small particles
are the ones which capture more coating and are the first to migrate to the next weight
levels. At the same time the preferential coating of large particles was observed
during the bottom spaying coating experiment of Iley (1991). Therefore, a more
robust model that will explain the observed coating characteristics is required.
Since particles are coated only by visiting the spraying zone, we suggest the
introduction of a new factor which will account for the frequency at which each
particle size visits this region. The number of visits will decide how much coating
each particle will receive and therefore its chance of migrating to the next particle
size.
In the development of this model, the following assumptions are made;
- there is no elutriation or break-up of particles.
- the rate of attrition and spray drying is constant.
- all particles are spherical and grow only by deposition of coating.
- all particles reaching the spraying zone are equally exposed to the spray.

51
0.01
0.015
0.02
0.025
0.03
Co
atin
g t
hic
kne
ss (
mm
)
0 .6 0.8 1 1.2 1.4 1.6 1.8 2
Particle Weight (mg)
Coating thickness (mm)
Figure 5.7 Coating thickness required for particles of different weights
to migrate to the next weight size
Particles of equal density but wide size distribution can segregate inside a fluidized
bed, with the heavier particles concentrating at the bottom and the lighter particles at
the top (Nienow and Chiba, 1985). Thus, a new factor called the segregation factor
(fs) is introduced. The factor will account for the coating preference of small particles
in a top spraying process, although the preference is expected to shift to large
particles in the bottom spraying process.
For the top spraying process with has a preferential coating of small particles, the
segregation factor is defined as;
s i if wK f( ) . ( )= (5.5)
where K= constant which including variables like spraying rate,
fluidization velocity and bed size.
f(wi) = an exponential decaying function of particle weight wi .

52
The exponential decaying function was chosen because the experimental results
indicates that there was a rapid decrease in the number of small particles despite their
small proportion. At the same time, the fraction of larger particles remains almost
unchanged. In the process involving bottom spraying, e.g. the Würster fluidized
bed, the function f(w) is expected to increase with increasing particle size. The exact
nature of the function can be obtained from the experimental data.
After dimensionless time τ, a time required to deposit an average coating material
for a particle to move to the next weight level, the particle distribution will change.
Particles weighing wi that are coated to weight wi+1= s i if X( ) ( )τ (5.6)
where Xi is the fraction of particles weighing wi
Therefore a new particle distribution will be;
i i s i i s i iX X f X f X( ) ( ) ( ) ( )( ) ( )τ τ τ τ+ = + +− −1 1 1 (5.7)
On the right hand side of equation 5.7, the second term represents a fraction of
particles weighing w(i-1) at time τ, the weight at which, after a single dimensionless
coating time, will increase to wi . The third term represents the fraction of particles
weighing wi which after a single dimensionless coating time will weigh wi+1. From
equation 5.7 the change in particle size distribution with time can be obtained.
The model incorporating the segregation factor was fitted to the experimental results
by matching the two mean particle weights. The resulting model distribution can then
be compared to the experimental results and the ability of the model to predict the
distribution can be assessed. Figure 5.8 shows the fitting of the mean particle weight
for seed I particles coated under Expt. 3+4 conditions. These are particles coated
under Expt.3 and further under Expt. 4 whose conditions are identical. The resulting
coating distribution which takes into accounts the two different growth rates is
compared to the experimental distribution in figure 5.9 (a) and (b). The two
distributions clearly resemble each other although, as expected, the model gives
smoother curves than those obtained experimentally. The graphs shows the ability of
the model to predict the particle distribution. Similar results were obtained for the
narrow distribution seed II as detailed in paper IV.

53
0 5 10 15 20 2511.3
11.4
11.5
11.6
11.7
11.8
11.9
12%
(n/
n) P
artic
les
Dimensionless Coating Time
0 50 100 150 200 250 300 350
11.3
11.4
11.5
11.6
11.7
11.8
11.9
12
Coating Time (min)
Figure 5.8 Mean particle weight for seed I coated under Expt. 3+4
conditions showing the agreement between the experimental results (*)
and the model values (solid line).
The effects of segregation on the coating process can be assessed by replacing the
segregation factor in equation 5.7 with a constant for all particle sizes, which will
give all particles equal chance of being coated. By matching the mean particle weight
from the modified model with that of the corresponding experiment, a distribution
without the effects of segregation is obtained. The distributions in terms of number
fractions for the model with and without segregation can then be compared to the
experimental distribution. Figure 5.10(a) shows how close experimental result is to
the model with the segregation factor for different particle sizes coated under Expt.
3+4 conditions. Figure 5.10(b) shows a comparison with a model without the
segregation factor but with the same seed and coating conditions.

54
0 50 100 150 200 250 300 350
0
5
10
15
20
25
30
Coating Time (min)
% (
n/n)
Par
ticle
s
1.11.2
1.0
1.3
1.4
0.9
1.5
0.8
1.6
(a)
0 5 10 15 20 250
5
10
15
20
25
Dimensionless Coating Time
% (
n/n)
Par
ticle
s
1.2
1.1
1.0
1.3
1.4
0.9
1.5
0.81.6
1.7
(b)
Figure 5.9 Particle size distribution from Seed I (Expt. 3+4);
(a)-experimental results, (b)-segregation factor model .

55
As can be seen in Figure 5.10(b), the model without the segregation factor, which is
equivalent to equal coating for all particles, tends to overestimate the actual size of
particles in both ends of the distribution. The overestimation of smaller particles (0.8
and 0.9 mg) by the model without segregation indicates that during the actual coating
process more of these particles are coated than the model estimates. At the same time,
larger particles (1.6-1.8 mg) are also overestimated by a factor of up to 2.7 (factor of
up to 7.7 for 1.7 mg particles -not shown in the graph). This implies that, for all seed
I particles to be equally coated, the resulting model with no segregation factor gives
a higher estimates for particles that are coated to larger sizes than the actual number
found experimentally.
The inclusion of the segregation factor lowers the estimation of small particles by the
model to values comparable to those found experimentally. As seen in Figure 5.10
(a), the overestimation of particles weighing 0.8-0.9 mg is limited to less that 1.6
times the experimental values. There is also a large improvement in the estimation of
larger particles without affecting the estimation of other particle sizes. One should
note that, to begin with, there is a very small number of the large particle sizes (about
1% for 1.6 mg and less than 0.6% for 1.7 and 1.8 mg), which makes them highly
susceptible to experimental errors. Similar results were obtained for the seed II
distribution as detailed in paper IV. For the lactose particles coated with HPMC, the
segregation factor was found to be;
s i wfK
i( ) .= 0 88310(5.8)
where w is particle weight in mg.
The difference was in the constant K, which for a top spraying coating of seed I
particles under Expt. 3+4 conditions was equal to 32.3 for the first growth part and
9.9 for the second growth part.

56
0.5
1.0
1.5
2.0
2.5
3.0
Fra
ctio
n (
mo
de
l)/F
ract
ion
(Exp
t)
0 .7 0.9 1.1 1.3 1.5 1.7 1.9
Particle Weight (mg)
22
14
10
2
Dimensionless Time
(a)
0.5
1
1.5
2
2.5
3
Fra
ctio
n (
mo
de
l)/F
ract
ion
(E
xpt)
0 .7 0.9 1.1 1.3 1.5 1.7 1.9
Particle Weight (mg)
22
14
10
2
Dimensionless Time
(b)
Figure 5.10 Comparison of the distribution estimation by the model
(a)-with segregation factor (b)- without segregation factor.

57
6. General Discussions
In the process of coating particles in a fluid bed, the hydrodynamic conditions
inside the bed determines the characteristics of the final product. In order to monitor
these conditions, a procedure has been developed for measuring the gas temperature
and humidity distribution during the process. It involves obtaining a limited number
of humidity and temperature measurements inside the bed using a purpose-designed
probe and using these measurements to generate extra values from which the profiles
are constructed. The profiles obtained for lactose and glass-beads particles show how
gas temperature and humidity are distributed inside the bed during a top spraying
coating process.
The profiles reveal that temperature and humidity are not evenly distributed inside
the bed. There were fluctuations for both temperature and humidity readings deep
inside the bed. These fluctuations were found in the upper part of the bed and they
extended inwards to the areas that are not reached by spray droplets. The regions of
highest fluctuation were associated with pockets of low temperature and high
humidity. The low temperature regions inside the bed formed either bell-shaped
profiles or funnel-shaped profiles. Analysing these profiles, one can deduce the net
migration patterns of the particles, the effect of different operating variables on
temperature and humidity distribution, the limits on spraying rate and the coating
function of different areas of the bed. Different coating regions can then be mapped
and monitored under different operating variables.
The procedure for measuring temperature and humidity for the gas inside the bed is
intrusive, but it may not be easy to obtain simultaneously both temperature and
humidity profiles without using an intrusive method. Therefore, care must be taken
to minimize the probe interference with the spray especially in areas near the spray
nozzle. It is also possible to improve the measurements by connecting the probe to a
data acquisition system and using the temperature and humidity measuring devices
with ‘similar’ sensitivities. The profiles obtained were assumed to be symmetrical,
but in applying such an assumption an uniform flow of air to the distributor plate
must first be assured. The procedure itself is not limited to symmetrical bed systems.
It can be applied even where the fluidization velocities are unequal, but it will require
the measurements of many points at different probe positions to obtain the reliable
profiles.

58
The presence of distinct coating regions was used in the modelling of the process in
order to find the effects of bed size, stagnant region, unequal transfer between
domains and fluidization velocity on the coating distribution of monodistributed
particles. The results indicate that large beds which are normally associated with large
non-active domains tend to widen the coating distribution. Furthermore, a higher
transfer to the spraying domain rather than a transfer to the non-active domain tends
to narrow the coating distribution. The difference in transfer between domains may
be accomplished in a number of ways including the use of draft tube in the Würster
design, the use of a cone in some Glatt designs, introducing the gas at an angle like
in the Hüttlin design and the use of a high spouting gas velocity in spouted-beds and
spout fluid-beds. The size of the spraying region is limited by the ability of the bed to
dry the wetted particles quick enough to avoid agglomeration or wet-quenching.
Higher fluidization velocities were found to favour a narrow distribution, although
in some cases they are also responsible for damaging the particles and spray drying
of the coating solution.
Polydistributed lactose particles were coated with cellulose was used to determine
the growth kinetics and the effects of seed distribution on the top spraying process.
Two seed distributions were used with the second distribution narrower than the
first. Both distributions clearly show that small particles get more coating than larger
particles. The results also confirm that the particles are being coated by visiting the
spraying region which is small than the rest of the bed. This implies that small
particles visit the spraying region more frequently than their larger counterparts. A
segregation factor is introduced to represent the chance of each size to visit the
spraying region and to be coated. For the top spraying of lactose particles, the
segregation factor was found to be an exponential decaying function of the particle
weight. When a narrower seed distribution were used, the chances of large particles
being coated were increased.
The assessment of the growth and particle size distribution was achieved by
measuring the weight of about 700 randomly chosen individual particles for each
sample. The method itself, although tedious and time-consuming, is simple, reliable
and reproducible. It provides a more accurate picture of the distribution than most
particle size measurement techniques, since the size increments are small. From the
distribution, one can tell how different particle sizes change with time and
consequently which particles are coated and how fast. From the same measurements,

59
one can obtain other particle distribution characteristics such as mean, variance and
skewness. When these variables are known, it is possible to determine the growth
kinetics and to confirm the mechanism of growth.
There are still a number of areas which need to be investigated to increase the overall
and specific understanding of fluid bed coating processes. This includes the
monitoring of the surface characteristics of a coated particle, which will provide an
insight into how the coating is distributed on individual particles and the effects of the
coating material on surface wettability and coating deposition. The question of
coating uniformity within individual particles has yet to be systematically
investigated, in part because of the complexity of equipment required and hence the
high costs. But as more sophisticated imaging techniques are developed, this
problem is bound to be addressed. In the course of answering the question of what
takes place during the coating process, the monitoring of elutriated spray material
requires a fresh study. This problem can be addressed in conjunction with the growth
rate in an overall material balance in the bed.

60
7. Conclusions
The procedures for measuring temperature and humidity profiles that were
developed in this work can play a pivotal role in the design and operation of different
fluidized bed processes. The procedure provides an easy to use method of obtaining
these important variables and their distribution inside a bed. Once one knows how
these distributions change with changing operating variables, the process can
operated under optimum conditions. One of the benefits of the procedure is the ability
to establish the spraying limit for particular bed conditions, above which the
operation runs a grave danger of defluidization by wet quenching. The profiles can
also be used to determine the optimum bed size, which has the benefit of increasing
the throughput and quality of the coated particles. The profiles from the two types of
particles used in this study have revealed the existence within the bed of different
zones with different coating functions. Furthermore, from the profiles one can map
the net migration of particles especially in the areas where there are differences in gas
temperature. Other bed characteristics like the existence of pockets of low
temperature and high humidity deep inside the bed with their associated high
fluctuations were also revealed. The procedure can also be used in other fluid bed
systems like drying, agglomeration, gasification and catalytic cracking.
Following the modelling of the fluidized bed coating process using the three domains
description, it was found out that an ideal bed is one with a high rate of transfer to a
large spraying zone, a moderate rate of transfer to a small non-active zone and
vigorous mixing of the entire bed. The aim should be to operate the bed under
conditions that are as close to ideal as possible. But factors like bed design,
wettability of the particles, operating temperature, feasible parameters for fluidization
velocity as well as characteristics of the desired product limit the range of operation
for the bed. Therefore, once the variables that cannot be changed are known, the
remaining variables can be then manipulated to bring the bed closer to the ideal
conditions. The humidity and temperature profiles can be used to determine the size
and position of the coating region and how they change with other operating
variables.
Experimental results from the coating of lactose particles under different conditions
show that, when polydistributed seeds are used, coating is not equally deposited on
all particles. In a top spraying coating process, small particles captures more coating
than larger particles. With bottom spraying, larger particles are expected to receive a

61
preferential coating as observed by Iley (1991). It was also established that, as the
seed distribution narrows, the preferential coating slows also. These results have a
serious repercussion on the coating of polydistributed seed particles in fluid bed
systems. If a monodistributed seed is used, all the particles have the same chance of
being coated but, since seed particles are almost always polydistributed, fluid bed
coating systems must be designed and operated with the segregation problem in
mind.

62
8. Notations
a circulation rate between domain G and domain F kg/s
A constant as defined in paper III
b circulation rate between domain E and domain F kg/s
B constant as defined in paper III
C constant as defined in paper III
d diameter of particle mm
D constant as defined in paper III
e population density function in domain E
f population density function in domain F
fs segregation factor
g population density function in domain G
K constant as defined in equation 6.5
m particles distribution moments
n number of particles
N total number of particles
r rate of coating mass added kg/s
t time s
w weight kg
x dimensionless coating weight
X particle fraction
z coating thickness mm
Z calculating factor as explained following equation (4.10)
Greek letters
α fraction of the active region involved in spraying
β fraction of the whole bed involved in coating process
τ dimensionless coating time
∆ step size increment
γ skewness
ρ density kg/m3

63
Subscripts
c coated
i counter
j lower counter limit
k upper counter limit
p particle

64
9. References
Agrawal S. and Ziegler E.N, On The Optimum Transfer Coefficient at an Exchange
Surface in a Gas-Fluidized Bed, Chem. Engng. Sci., 24, 1969, pp. 1235.
Becher R.-D. and Schlünder E.-U., Fluidized Bed Granulation - the Importance of a
Drying Zone for Particle Growth Mechanism, Chem. Eng. Proc., 37, 1998, pp.1-6.
Becher R-D. and Schlünder E-U., Fluidized Bed Granulation: Gas Flow, Particle
Motion and Moisture Distribution, Chem. Eng. Proc., 36, 1997, pp. 261-269.
Becher R-D. and Schlünder E-U., Wetting and Drying Process in Fluidized Bed
Granulation, in Drying '96 (C. Strrumillo, Z. Pakowski, eds.), Proceedings of the
10th International Drying Symposium, Kraków, vol. A, (1996) pp. 85-92.
Cherif R. et al., 1996, Study of Coating of Solid Particles in a Fluidized Bed, Proc.
from CHISA ‘96- 12th International Congress in Chemical and Process Engineering,
Prague, Czech Republic, 25-30 Aug. 1996, P7.65.
Choi M.M.S. and Meisen A., Sulfur Coating of Urea in a Shallow Spouted Beds,
Chem. Engng. Sci., 52(7), 1997, pp.1073-1086.
Conceicao-Filho R.S., Barrozo M.A.S., Limaverde J.R. and Ataide C.H., The Use
of Spouted Bed Fertilizer Coating Over Soybeans Seeds, Proc. World Congress on
Particle Technology 3, Brighton, UK, July 6-9 , 1998.
Eldredge H.B. and Drown D.C., Determination of a Significant Factors that Effect
Particle Coating Rates in Fluidized Bed, Proc. World Congress on Particle
Technology 3, Brighton, UK, July 6-9, 1998.
Ennis B.J., Agglomeration and Size Enlargement; Session Summary Paper, Powder
Technol., 88, 1996, pp. 203-225.
Ennis B.J. and Litster J.D., Section 20: Size Enlargement, Perry’s Chemical
Engineering Handbook, 7th edn., McGraw-Hill, New York, 1997.

65
Davies W.L. and Gloor Jr. W.T., Batch Production of Pharmaceutical Granulation
in Fluidized Bed I: Effects of Process Variables on Physical Properties of Final
Granulation, J. Pharm. Sci. , 60, 1971, pp. 1869-1874.
Dackwerts P.V., Significance of Liquid-Film Coefficients in Gas Absorption,, Ind.
Engng. Chem., 43(6), 1951, pp. 1460-1467.
Geldart D., Types of Gas Fluidization, Powder Technol., 7, 1973, pp 285-292.
Gutfinger C. and Chen W.H., Heat Transfer With Moving Boundary- Application to
Fluidized Bed Coating, Int. J. Heat Mass Transfer, 12, 1969, pp. 1097-1108.
Heil C., Some Properties of Spout-fluid Beds, PhD thesis, Eindhoven, 1984.
Holland C.D. and Liapis A.I., Computer Methods for Solving Dynamic Separation
Problems, Mc-Graw Hill, New York, 1983, pp. 356-360,
Horváth E. and Ormós Z., Film Coating of Dragée Seeds by Fluidized Bed Spraying
Methods, Acta Pharm. Technol., 35, 1989a, pp 90.
Horváth E.H. and Ormós Z., Continuous Film Coating in Fluidized Bed,
Proceedings from 5th Congress on Applied Chemistry, Balatonfured, Hungary,
Sept. 3-7, 1989b, Vol. 2., pp. 346-351
Hulburt H.M. and Kartz S., Some Problems in Particle Technology, Chem, Engg.
Sci, 19, 1964, pp. 555-574.
Hüttlin GmbH, Hüttlin Kugelcoater brochure, BWI Hüttlin GmbH, Steinen
Germany. 1998.
Ichikawa H. and Fukumori Y., Microgranulation of Pulvirized Pharmaceutical
Powder with Aqueous Polymeric Dispersion Using a Spouted Bed Process., Proc.
of CHISA ‘96, Prague, Czech Republic, 25-30 Aug. 1996, P1.122
Iley W.J., Effect of Particle Size and Porosity on Particle Film Coatings, Powder
Technol., 65, 1991, pp. 441-445.

66
Jacobs I.C. and Mason N.S., In: Polymeric Delivery System -Properties and
Applications, (Al-Nokaly M.A., Piatt D.M., Chapentier B.A., eds.), ACS,
Washington DC, 1993.
Jozwiakowski M.J., Franz R.M. and Jones D.M., Characterization of a Hot-Melt
Fluid Bed Coating Process for Fine Particles, Pharmaceutical Research , 7(11) 1990.
Jones D.M., Air Suspension Coating, in Encyclopedia of Pharmaceutical
Technology (J. Swarbrick and J.C. Boylan, eds), Marcel Dekker, New York, 1988,
vol. 1, pp. 189.
Kage H., Takahashi T., Yoshida T., Ogura H. and Matsuno Y., Coating Efficiency
of Seed Particles in a Fluidized Bed by Automization of Powder Suspension,
Powder Technol., 86, 1996, pp. 243-250.
Kinii D. and Levenspiel O., Fluidization Engineering, Betterworth-Heinmann, MA,
USA, 1991.
Kmiec A., Hydrodynamics of Flows and Heat Transfer in Spouted Bed, Chem.
Eng. J., 19, 1980, pp. 189-200.
Kucharski J. and Kmiec A., Kinetics of Granulation Process During Coating of
Tablets in a Spouted Bed., Chem. Engng. Sci., 44(8), 1989, pp. 1627-1636.
Lehmann K. and Dreher D., Coating of Tablets and Small Particles with Acrylic
Resins by Fluid Bed Technology, Int. J. Pharm, Tech. & Prod. Mfr., 2(4), 1981,
pp. 31-43.
Litster J.D. and Sarwono R., Fluidized Drum Granulation; Studies of Agglomeration
Formation, Powder Technol., 88 , 1996, pp. 165-172
Laicher A. et al, Process Optimization of Pallet Coating and Drying Using a Fluid-
Bed Production Units, Pharm. Technol. Europe, Sept. 1994.

67
Laicher A. et al, Aqueous Coating of Pellets to a Sustained-release Dosage Forms in
a Fluid Bed Coater, Pharm. Ind., 55(12), 1993, pp. 1113-1116.
Link K. R. and Schlünder E-U., Fluidized Bed Spray Granulation Investigation of
the Coating Process on a Single Sphere, Chem. Eng. Proc., 36, 1997, pp. 443-457.
Liu L.X. and Litster J.D., Spouted Bed Seed Coating; the effect of process variables
on maximum coating rate and elutriation, Powder Technol., 74, 1993, pp. 215-230.
Muroyama K. and Fan L.-S., Fundamentals of Gas-Liquid-Solid Fluidization,
AIChE J., 31, 1985, pp. 1
Nienow A.W., Fluidized Bed Granulation and Coating: Application to Materials,
Agriculture and Biotechnology, Chem. Eng. Comm., 139, 1995, pp. 233-253.
Nienow A.W. and Chiba T., Fluidization of Dissimilar Materials, in Fluidization ,
(J.F Davidson, R.Cliff and D. Harrison, eds.) 1985, pp. 357-382, Academic Press,
London.
Nienow A.W. and Rowe P.N., Particulate Growth and Coating in a Gas-Fluidized
Bed, In; Fluidization , (Davidson J.F., Cliff R. and Harrison D., eds), Chap. 17,
Academic Press, London, 1985.
Norring-Christensen F. and Bertelsen P., Qualitative Description of the Würster-
Based Fluid-Bed Coating Process, Drug Dev. Ind. Pharm., 23(5), 1977, pp. 451-
463.
Oliveira W.P., Study of Tablet Coating by Spouted Bed Process With and Without a
Draft Tube, Proc. World Congress on Particle Technology 3, Brighton, UK, July 6-
9, 1998.
Orr C., Particle Technology, Macmillan Company, New York, 1966.
Paine A.J., Error Estimation in the Sampling From Particle Size Distribution,
Part. Part. Syst. Charact., 10, 1993, 26-32.

68
Potter O.E., Mixing, in Fluidization , (Davidson J.F. and Harrison D., eds),
Academic Press, London, 1971, pp. 293-381.
Reay D. and Baker C.G.J., Drying, In: Fluidization , (Davidson J.F., Cliff R. and
Harrison D., eds), Academic Press, London ,1985, pp. 529-562.
Saleh K., Parard M. and Hemati M., Experimental Study of Fluidized Bed Coating:
Effects of Particle Size and Structure in Growth Kinetics, Proc. World Congress on
Particle Technology 3, Brighton, UK, July 6-9, 1998.
Schaefer T. and Worts O., Control of Fluidized Bed Granulation, Arch. Pharm.
Chemi. Sci. Ed., 6, 1978, pp. 1-13, 14-25, pp. 69-82.
Schaefer T. and Worts O., Control of Fluidized Bed Granulation I. Effects of Spray
Angle, Nozzle Height and Starting Materials on Granule Size and Size Distribution,
Arch. Pharm. Chemi. Sci. Ed., 5, 1977, pp. 51-60.
Sherrington P.J. and Oliver R., Granulation, Heyden, London, 1981.
Sherony D.A., A Model of Surface Renewal with Applications to Fluid Bed Coating
of Particles., Chem. Engng Sci., 36, 1981, pp. 845-848.
Smith P.G. and Nienow A.W., On Atomizing a Liquid Into Gas Fluidized Bed.,
Chem. Engng. Sci., 37, 1982, pp. 950-954.
Smith P.G. and Nienow A.W., Particle Growth Mechanisms in Fluidized Bed
Granulation., Chem. Engng. Sci., 38(8), 1983, pp. 1223-1231, 1233-1240.
Stein M., Martin T.W., Seville J.P.K., McNiel P.A. and Parker D.J., Positron
Emision Particle Tracking: Particle Velocity in Gas Fluidized Beds, Mixers and other
Applications, In: (J. Chaouki, F. Larachi and M.P. Dudukovic, eds.), Non-
Inversive Monitoring of Multiphase Flows, Elsevier Science, Amsterdam, 1997, pp.
311-333.

69
Taraha K. et al. , Pharmaceutical Preparation for Sustained Release of a Drug and
a Process for Producing the Same, International Patent Application, WO 93/16686,
1993.
Thiel W.J. and Nguyen L.T., Fluidised Bed Film Coating of an Ordered Powder
Mixture to Produce Microencapsulated Ordered Units, J. Pharm. Pharmacol., 36,
1984, pp. 145-152.
Thiel W.J. and Sberna F.J., Fluidized Bed Film Coating of an Interactive Powder
Mixture to Produce Microcapsulated 2-5µm Particles, J. Pharm. Pharmacol., 38,
1986, pp. 166-171.
Trojosky M., Modelling the Mass- and Heat Transport in Liquid Sprayed Gas/Solid
Fluidized Beds, dissertation TU Magdeburg, Germany, 1991.
Tsutsumi A., Nakamoto S., Mineo T.,Yoshuda K., A Nivel Fluidized-Bed Coating
of Fine Particles by Rapid Expansion of Supercritical Fluid Solution , Powder
Technol., 85, 1995, pp. 275-278.
Van Deemter J.J., Mixing In: Fluidization , (Davidson J.F., Cliff R. and Harrison
D., eds), Academic Press, London , 1985, pp. 331-355.
Weiss P.J. and Meisen A., Laboratory Studies on Sulphur-Coating Urea by the
Spouted Bed Process, Can. J. Chem. Engng., 61, 1983, pp. 440-447.
Whitehead A.B., Behaviour of Fluidized Bed System., Int. J. Pharm, Technol.
Prod. Manuf,, 2(4), 1981, pp. 13-18.
Whitehead A.B., Diatributor Characteristics and Bed Properties, In: Fluidization ,
(Davidson J.F., Cliff R. and Harrison D., eds), Academic Press, London ,1985, pp.
173-199.
Wnukowski P, On the Coating of Particles in Fluid Bed Granulator - Modeling and
Simulation of the Residence-time Distribution in Different Processing Units., PhD
Thesis, Royal Institute of Technology, Stockholm, 1989.

70
Wnukowski P. and Settewal F., The Coating of Particles in a Fluidized Bed
(Residence Time Distribution in a System of Two Coupled Perfect Mixers), Chem.
Engng. Sci. , 44(3), 1989, pp. 493-505.
