on the onset and development of thermal · pdf fileon the dynamics in the solar core...
TRANSCRIPT

ON THE DYNAMICS IN THE SOLAR CORE
Bangalore, 8 April, 2008
Indian Institute of Astrophysics
Attila Grandpierre, PhD
Senior Research Fellow
Konkoly Observatory
of the Hungarian Academy of Sciences
Budapest, Hungary

Solar structure

Solar structure

Inversion of the solar rotation rate. The rotation becomes rigid down to
0.3R . The error bars progressively increase toward the core because
the p modes are less and less sensitive and because fewer and fewer
modes are available for the inversion at these depths. ?~5Ω ?

Why is the solar core interesting?
• The basis of astrophysics
• 98% of the solar mass
• This is the place where par excellence cosmic processes occur, that do not occur in laboratories: coupled gravitational, electromagnetic, hydrodynamic, thermodynamic, quantum processes, including nuclear energy production
• Climatic change, monsoons, ice ages, fall of civilizations

Introduction• “The Sun‟s interior is believed to be in a quiescent
state and therefore the relevant physics is simple”Bahcall, 1989
• The Sun is a “luminous ball of gas” (A Dictionary of Astronomy, Oxford University Press, 1997, p.450)
• The Sun is a vast nonequilibrium plasma system of ionized particles penetrated by a magnetic field, coupled to time varying rotation, activity, g-modes etc.
• Detailed calculations (Grandpierre and Ágoston, 2005) suggested that two kinds of yet unnoticed dynamic processes exist in the solar core: heat waves and hot bubbles, generated by perturbations arising from
physical processes
Confirmations of our predictions
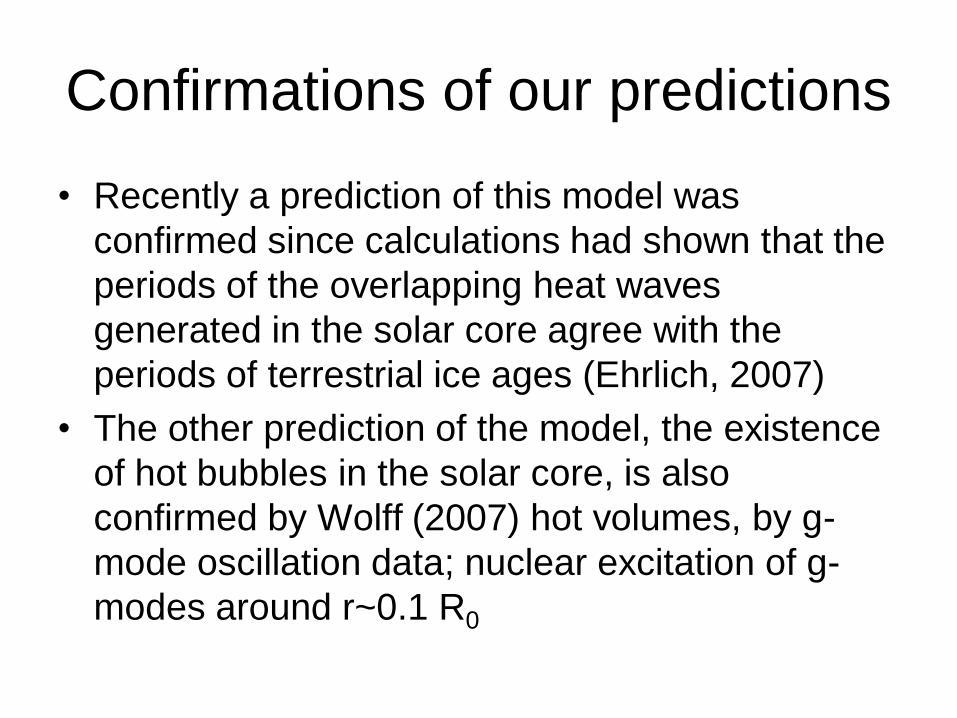
• Recently a prediction of this model was
confirmed since calculations had shown that the
periods of the overlapping heat waves
generated in the solar core agree with the
periods of terrestrial ice ages (Ehrlich, 2007)
• The other prediction of the model, the existence
of hot bubbles in the solar core, is also
confirmed by Wolff (2007) hot volumes, by g-
mode oscillation data; nuclear excitation of g-
modes around r~0.1 R0

Wolff, 2002, Fig. 1. 10.7 cm Radio
Flux Index, half century
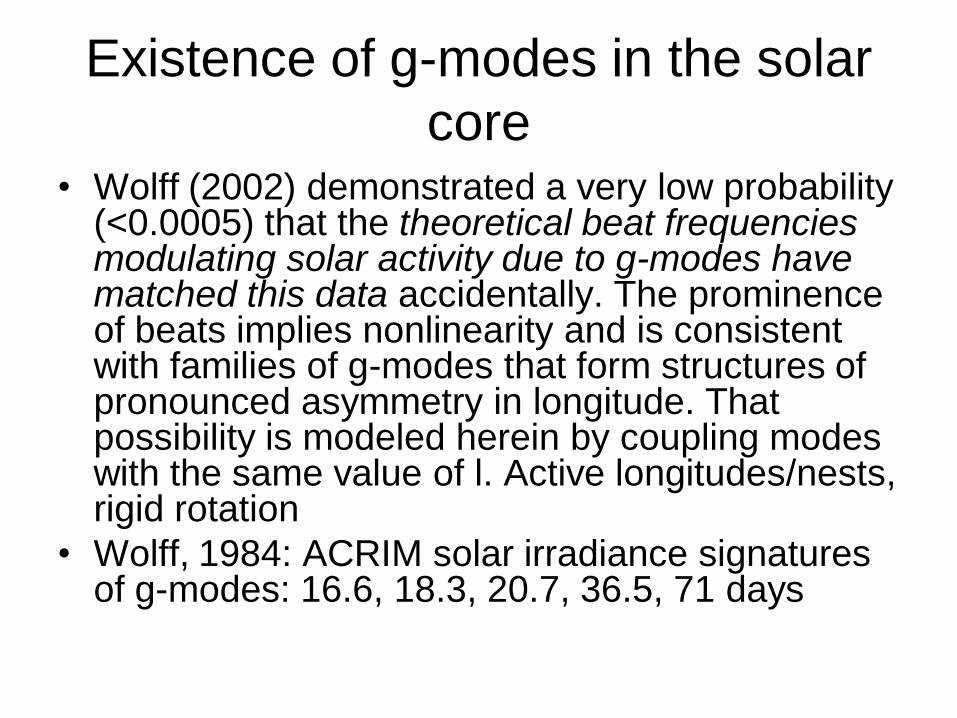
Existence of g-modes in the solar
core• Wolff (2002) demonstrated a very low probability
(<0.0005) that the theoretical beat frequencies modulating solar activity due to g-modes have matched this data accidentally. The prominence of beats implies nonlinearity and is consistent with families of g-modes that form structures of pronounced asymmetry in longitude. That possibility is modeled herein by coupling modes with the same value of l. Active longitudes/nests, rigid rotation
• Wolff, 1984: ACRIM solar irradiance signatures of g-modes: 16.6, 18.3, 20.7, 36.5, 71 days

Production of hot volumes by coupling g-
modes excited by nuclear heating
• Families of g-modes are assumed linear
everywhere except in small “hot volumes”
where they add constructively to cause
nonlinear motion. The resulting local
increase in nuclear burning increases g-
mode excitation and acts in a direction that
would lock members of each family into
one structure that rotates rigidly.

Hot volumes < 10 Mm
• For the size of a spot one can use the 50% contour whose “diameter” is about at a distance r from the center of the Sun. At r~0.1 R, this diameter is (13 Mm)(10/l)0.91. As nuclear burning at the hot spot pumps extra energy into the standing waves, it is partially regenerating them. To the extent that nuclear burning in the hot spot approximates a delta function on a spherical surface, it excites new m-states at rotational orientations identical to those that gave the maximal structure. Thus, a state trying to drift away due to any rotational dispersion is also being pulled back as new energy is pumped into it. When the excitation is strong enough to overcome dispersion, the m-states are locked in longitude and the structure is maintained indefinitely.

Garcia et al., 2007
• From the velocity measurements, they computed the power spectral density (PSD) by means of a fast Fourier transform algorithm. To look for the periodic signature of the g modes in this PSD, they computed a second power spectrum of the PSD between 25 and 140 µHz. A broad structure in the region centered at 24 min appears in this power spectrum.
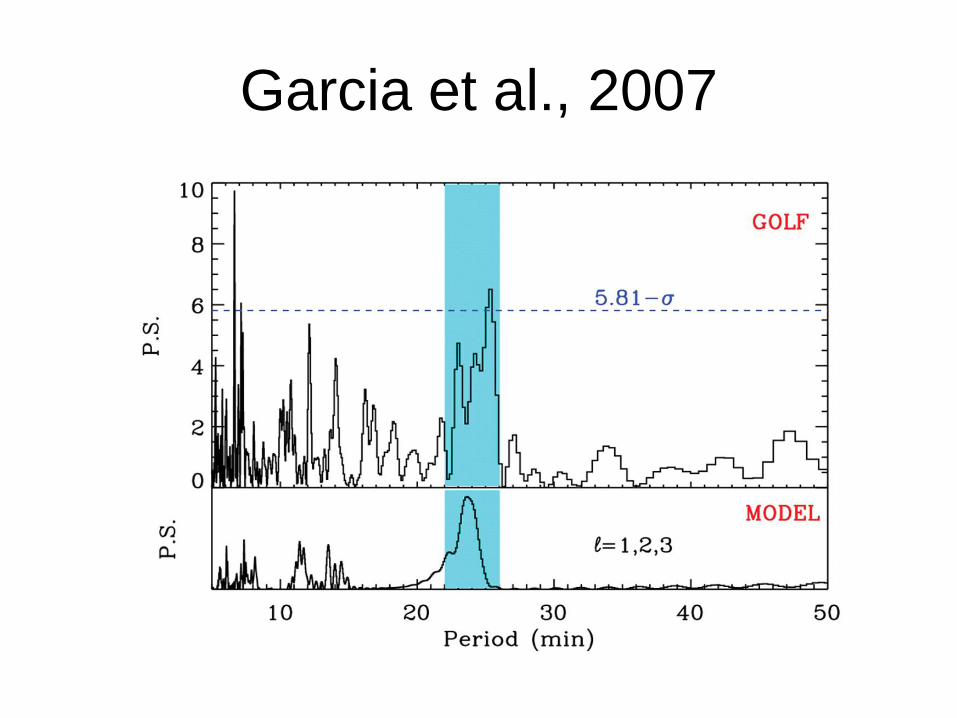
Garcia et al., 2007

Plasma systems are dynamic and
produce strong local heating• Plasma systems show an enormous variety of dynamic
phenomena: being highly electrically conductive, they respond to magnetic fields. Magnetic fields show a tendency to instabilities, have a complex and time varying spatial structure, generating various time varying current systems, filaments, sheets, and jets, manifesting extremely rich behavior. Goossens (2003, 1) emphasized: Plasmas are extremely complicated systems fundamentally different from classic neutral gases, especially when there is a magnetic field present.
• In general, the plasma can support electric currents (Goossens, 2003, 1) - pinch effect - strong local heating

Magnetic field in the solar core
• Hiremath & Gokhale, 1995: poloidal plus toroidal
fields in the solar core; global oscillations; 2001:
P~1 G, T~104 G
• Gough and McIntyre, 1998: a nonzero interior
poloidal field Bi is necessary to explain the
observed closely uniform rotation of the radiative
zone, and estimated that Bi ≈103 G well below
the top of the radiative zone if the magnetic field
Bi deep in the radiative interior is the remnant of
a primordial field.

Gough and McIntyre, 1998

Magnetic field in the solar core
• Friedland and Gruzinov (2004) computed the ohmic decay eigenmodes for the axisymmetric toroidal field configurations and the corresponding lifetimes, and give the profiles and lifetimes for all modes whose lifetimes exceed the solar age. The toroidal field in the radiative zone of the Sun can, in principle, have complex structure. The strength of toroidal fields, being entirely confined to the radiative zone, is not subject of the above bound. Friedland and Gruzinov (2004) gave their lowest upper bound to be BFG~2.1*106 G.
• Rashba et al. (2007) 3*105 G, helioseismic, static magnetic field model

Energetics of hot bubbles
• EB~B2/8 *V; B~3*105 G; R~107 cm; 2*1032
ergs
• (DErot/Dt)present ≈2*1034 ergs year-1; 2*1035
ergs
• Burgess, 2004, g-modes DT/T~0.1, L~107
cm; DQ~cmDT~2*108 4*1021*102*106
~1039 ergs
• Wolff, 2008, DT/T~0.1, L~107 cm; 1036-1039 ergs

Observations indicating
dynamism in the solar core• Torsional oscillations
• March 1998 event supplied additional energy by 22% (Chaplin et al. 2003) coincident in time with the southern hemisphere onset of cycle 23, with a major emission of particles.
• Hot spots separated by about 180 degrees in longitude. Many hot-spot systems last for more than one solar cycle, and therefore the mechanism(s) generating them must be independent of toroidal magnetic fluxes (Bai, 2003). Anomalous rotation rate from 25 to 29 days (vs. normal 25-26.5 days). Probable site: below the convective zone.

Observations indicating
dynamism in the solar core
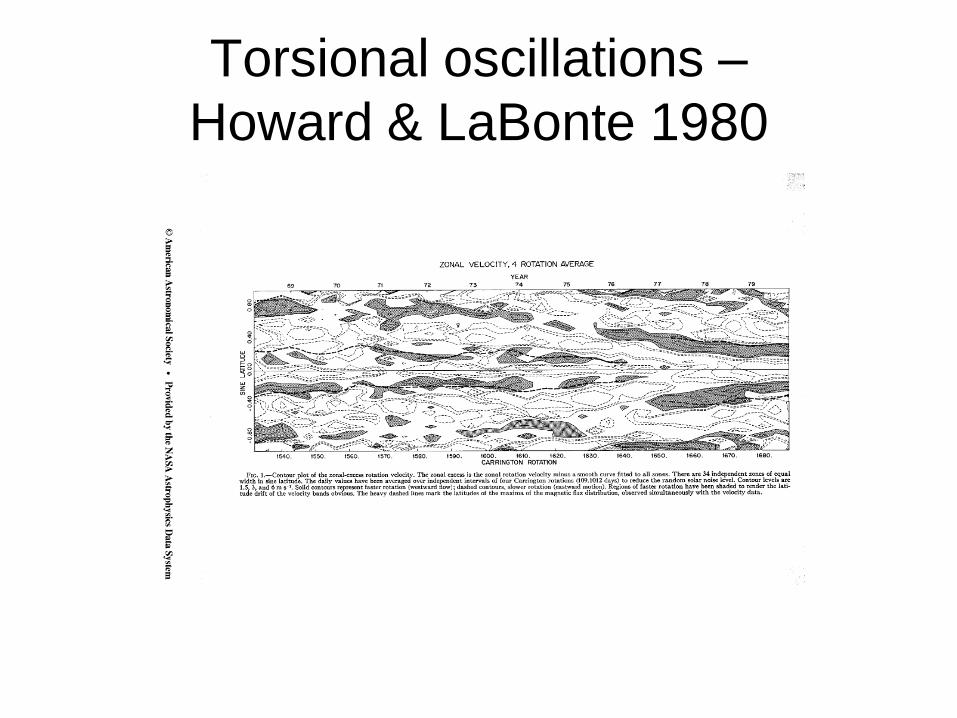
Torsional oscillations –
Howard & LaBonte 1980

Dynamics in the solar core
• Grandpierre, 1984, 1986, 1990, 1991, 1996,
1999, 2005, 2008
• Gokhale, 1977, 1984, 1992, 1993, 1995, 1997
• Hiremath, 1990, 1995, 2001, 2004, 2006
• Gough, 1986, 1990, 2001
• Turck-Chieze, 2001, 2007
• Wolff, 2007
• Garcia, 2007

Calculations
• Stability analysis: for infinitesimal, homologous perturbations - thermally stable.
• Finite amplitude, non-homologous perturbations
• Simple numerical estimations: the timescales of the decay of these events
• We solved the nonlinear differential equation system
Preceding investigations
• Linear stability analysis: Schwarzschild and Harm (1973),
Rosenbluth and Bahcall (1973); Unno (1975) - the solar
core is stable to internal, infinitesimal, radial and non-radial,
homologous perturbations.
• Paterno et al. (1997) nonradial thermal instabilities in the
solar core for internal, infinitesimal, shellular perturbations.
The heating timescale 4 × 10⁶ years; cooling 7 × 10⁵ years.
• Russell, 1919; Eddington, 1926, Atkinson, 1931; Zeldovich,
1981; dangerous sensitivity of stellar energy production
• Gorbatsky, 1964, hot bubbles; Grandpierre 1984, 1986,
1990, 1991, 1996, 1999, 2004, 2005: non-spherical heating,
dynamic solar model

BASIC EQUATIONS
• Conservation of the k-component of momentum per unit volume ∂( vk)/ ∂t + ∑(i) ∂/∂xi ( vk - Pik) = Xk, where Xk is the k-component of the total force acting per unit mass, and Pik is the total stress tensor.
• Conservation of energy dU/dt + p/ div v =
N - 1/r div (FR + Fc) + 1/r ∑(ik) Pik ∂vk/∂xi
• The equation of state is p = (Rg/ ) T
Estimations
• Buoyant (Fb=Vg Dr) and frictional (Ff=K/2 v2 S r) forces Fb=Ff;
• v=(8/3Rg(1-TS/T))1/2 (1)
• With typical values in the solar core TS/T <8/9, g= 2* 105 cm s-2, R=105-106 cm, v ~2 to 7 *105
cm s-1 (Gorbatsky, 1964).
• ∂U/ ∂t = - 1/ r divFR = - 1/ r div (DR grad ER)(2)
• DR = 1/3 c lph, lph = 1/(kr); FR = -(4ac/3kr) T3 ∂T/∂r
• Eq. (2), U=Cp T, integrating; Cp (∂T/∂t)V = - (1/r) 4p R2 FR.

Estimations
• tadj = 2 Cp R2/(16 T3), = 5.67*10-5 erg cm-2K-
4s-1. With typical values ( = 2 cm2 g-1, = 90 g cm-3, Cp=2.1 *108erg K-1 mole-1, T = 108 K, R = 106 cm), tadj = 3*103 s, while for T = 107 K, tadj = 4*106 s.
• trise = lT/v, lT ~ 1.5*1010 cm at r=RSun/10; With v=1.5 * 105 to 1.5 * 106 cm s-1, trise ~ 1.5*1010/v; 105 to 104 s.
• The timescale of cooling Q=CV m T = 2 R3 p; (dQ/dt)exp = -p d(4/3 R3)/dt

Estimations
• 2 p (3 R2) (dR/dt)exp + 2 R3
(dp/dt)adiab = -p 4 R2 (dR/dt)exp
• (dR/dt)exp = -R/5 (1/p(dp/dt))
• texp = -(1/5 (1/p (dp/dr)) v)-1 = 5 Hp/v; Hp = |1/p(dp/dr)|-1 ~7.3 *109
cm;
• texp ~ 3.6*1010/v; 3 * 107 to 104 s.

Timescales
• Nuclear timescale tnucl=CpT/ (Grandpierre, 1990)
• Timescales compared:
• tadj = 2 Cp R2/(16 T3),
• trise ~ 1.5*1010/v
• texp ~ 3.6*1010/v
• for T = 107 K, R = 106 cm, tadj ~ 7 * 106 s, texp ~ 3*104-3*105 s, trise ~ 104 to 105 s; tnucl ~1016 s.
• for T = 108 K, tadj = 7*103 s, texp ~ 3*104-3*105 s, trise ~ 104 to 105 s; tnucl ~1 s.

Table 1. The time-scales [in seconds] for bubbles with R0=3*106 cm.
The bubble rises from r=0.1 RSun. T0 is in 107 K.
T0 texp tdiff tnucl trise
1.74 5.7*104 1.0*107 1.1*1014 2.3*104
5.0 3.3*104 2.5*105 6.9*107 1.3*104
9.0 3.0*104 4.2*104 2.6*105 1.2*104
20.0 2.9*104 3.8*103 7.8*101 1.2*104

Fig. 1. The rise of bubbles with different initial
temperatures, R0= 5*106 cm. T0=1.74, 5, 9*107 K.
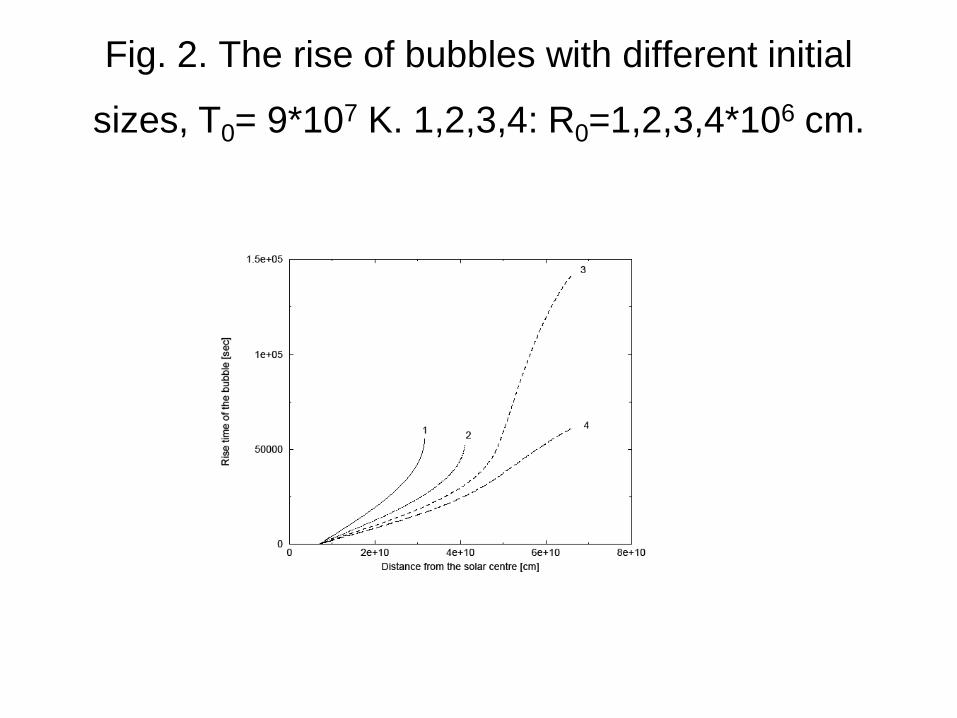
Fig. 2. The rise of bubbles with different initial
sizes, T0= 9*107 K. 1,2,3,4: R0=1,2,3,4*106 cm.

Fig. 3. The evolution of the velocity of the bubble
with different initial sizes, for T0= 9*107 K. 1,2,3,4:
R0=1,2,3,4*106 cm.

Fig. 4. The evolution of the relative rate of
hydrogen deficiency of the bubble, for T0=9*107 K.
1,2,3,4: R0=1,2,3,4*106 cm.

Fig. 5. The evolution of the relative temperature
surplus of the bubbles rising from r=0.65 RSun.
T0=0.5, 1, 1.5, 2, 3, 4, 5 and 9*107 K. R0=4*106 cm.

Fig. 6. The evolution of the bubble rise from r=0.1,
0.4 and 0.65 RSun. Dotted line: T0=9*107, R0=5*106.
Solid line: T0=9*107, R0=3*106. Dashed line:
T0=2*107, R0=4*106.

Typical geometry of magnetic
structures around flare onset


Tsuneta, 1993

Bruzek, 1964

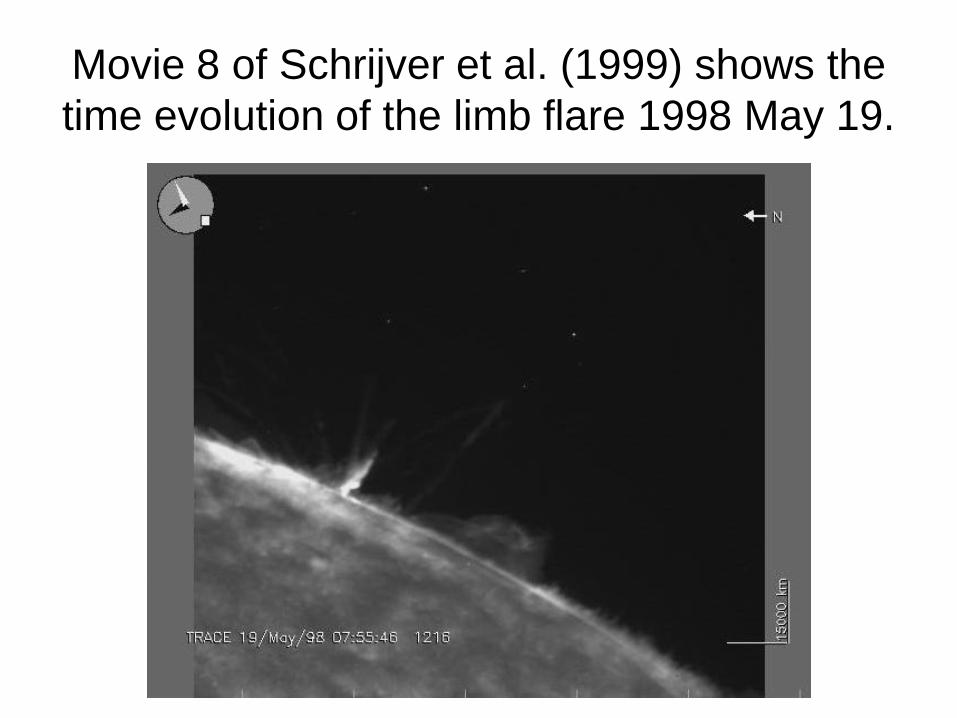
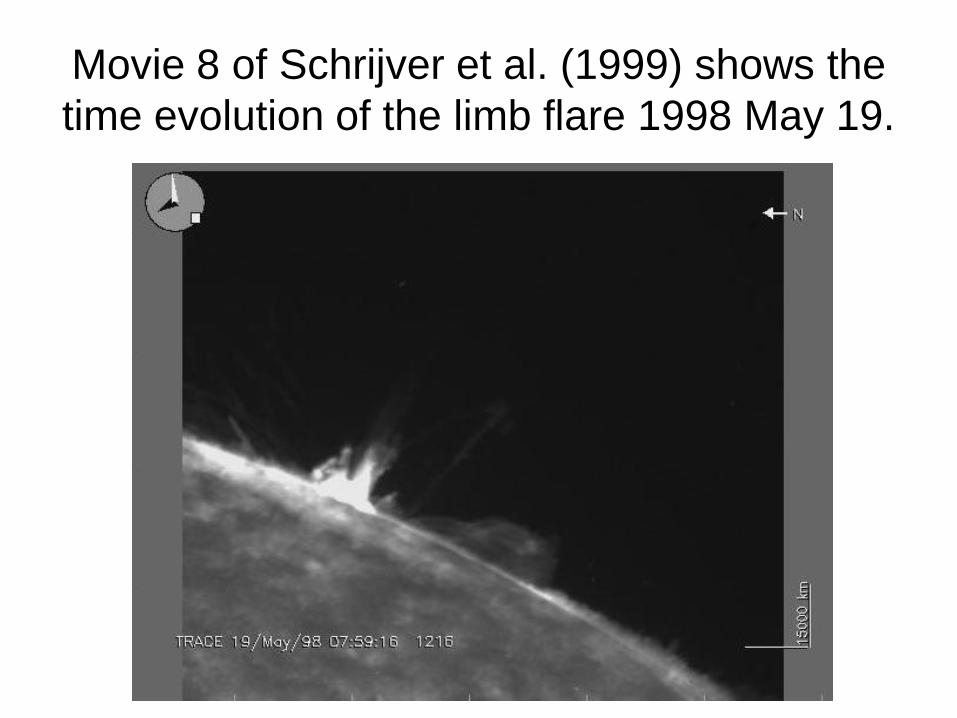
Movie 8 of Schrijver et al. (1999) shows the
time evolution of the limb flare 1998 May 19.

Movie 8 of Schrijver et al. (1999) shows the
time evolution of the limb flare 1998 May 19.

Movie 8 of Schrijver et al. (1999) shows the
time evolution of the limb flare 1998 May 19.

Movie 8 of Schrijver et al. (1999) shows the
time evolution of the limb flare 1998 May 19.
Movie 8 of Schrijver et al. (1999) shows the
time evolution of the limb flare 1998 May 19.

Movie 8 of Schrijver et al. (1999) shows the
time evolution of the limb flare 1998 May 19.

Movie 8 of Schrijver et al. (1999) shows the
time evolution of the limb flare 1998 May 19.

Movie 8 of Schrijver et al. (1999) shows the
time evolution of the limb flare 1998 May 19.

Movie 8 of Schrijver et al. (1999) shows the
time evolution of the limb flare 1998 May 19.

Movie 8 of Schrijver et al. (1999) shows the
time evolution of the limb flare 1998 May 19.

Movie 8 of Schrijver et al. (1999) shows the
time evolution of the limb flare 1998 May 19.
Movie 8 of Schrijver et al. (1999) shows the
time evolution of the limb flare 1998 May 19.

Movie 8 of Schrijver et al. (1999) shows the
time evolution of the limb flare 1998 May 19.

Movie 8 of Schrijver et al. (1999) shows the
time evolution of the limb flare 1998 May 19.

• Y „inflow”, movie

Problematic aspects
• It seemed that there is no need to
introduce new models for explaining the
data of the solar interior
• Apparently, there is no suitable energy
source for strong local heating
• Seemingly there is no possibility to
observe data relevant to the new model

New situation
• SOHO (1995-2008) g-modes are detected, Garcia et al. (2007) Science; Turck-Chieze et al. (2007)
• GOLF-NG spectrometer, PICARD (2008-2010), DynaMICS (2009-2017) in parallel to SDO (2008-2017), then a world-class mission located at the L1 orbit or above the solar poles
• LISA, ASTROD.

Explanations of the dynamic solar
core model• i.) Our mechanism explains the basic problem how to
generate the magnetic topology necessary for reconnection;
• ii.) Our model explains why the loop tops show upward elongated cusp-like structures instead of downward concave intrusions generated by particle beams injected from higher lying regions downward, as it is indicated by simulations (Forbes, Malherbe, Priest 1989, Fig. 2; Forbes, Malherbe, 1991, Fig. 5). Present-day pictures on the mechanisms generating the flares (e.g. Fig. 1 of Lin & Soon, 2004) assume the presence of reconnection outflow injected into the loop top from above, but ignores the observable consequences that would be concave structures instead of the observed upward elongating antiparallel semi-islands and cusp-like structures;

Explanations of the dynamic solar
core model
• iii.) Our model explains why the primary energy liberation occurs mostly above the loop tops but below the X-point. Saint-Hilaire and Benz (2002) had shown that most of the initial energy first appears as energetic electrons in the lower, stationary part. Since the particle beams are injected in our model from below, the X-point is generated at the loop top and is driven upwards by the particle beam/plasmoid later on; therefore the primary energy release is produced in our model in between the loop-top and the X-point.

Predictions of the dynamic solar
core model• Flare-related chemical anomalies represent a long-
standing unsolved issue of solar physics
• 15N/14N rate is enhanced by 50%, from a value 2.9*10-3
of 3*109 years ago to a present day value of 4.4*10-3
(Kerridge et al., 1991). The problem is so severe that Guzik, Watson and Cox (2005) recommended considering accretion of material depleted in the more volatile elements C, N, O, Ne and Ar.
• The model presented here suggests the presence of a primary nonthermal energy source in relation to preflare velocity fluctuations (Nigro, Malara and Veltri, 2005) generated by the shock waves and particle beams since the sonic boom occurs before the flare and below the photosphere.

Predictions of the dynamic solar
core model• i.) hot bubble(s) rising in the subphotosphere beneath the flare site
accelerated to sonic speeds ~8-10 km s-1;
• ii.) shock waves are generated in the subphotosphere;
• iii.) particle beam is generated in the subphotosphere and is injected upwards;
• iv.) the material of the photosphere is lifted up before the particle beam, therefore the surface of the Sun is hotter underneath of the flare site than elsewhere;
• v.) flare material is enhanced in heavy elements not only as a result of selective electromagnetic processes;
• vi.) reconnection topology is generated as a consequence of the process driving the coronal primary energy release of the flare, formed by particle beams injected from below;
• vii.) measurement of the rise speed of the main body of flare loops;
• viii.) the solar core have a dynamic nature that can be tested by e.g. detecting g-mode solar oscillations (Turck-Chieze et al., 2004).

Global oscillations
• It is easy to show that even powers of „m‟ in the -expansion do not affect the drift rate of
standing waves but affecting only the argument of cos ot (Wolff, 2007)
• Two equally strong hot spots symmetric in longitude (Wolff, 2007)
• The symmetry breaking between odd and even modes is consistent with Hale‟s polarity law: the orientation of bipolar spots is opposite on the other hemisphere; the toroidal flux system giving rise to sunspots is antisymmetric around the equator (odd parity) and varies with the cycle (Stenflo & Vogel, 1986)

On the excitation of global EM
oscillations• l=3, 5, 7: a large-scale mechanism; Howard & LaBonte,
1980: 30o – l=5
• Zonal deviation from equilibrium
• Odd modes: forced oscillation, external force
• Distinguishes a longitude
• The excitation is at the interface of the fast spinning solar core and the inner radiative zone
• This interface changes under forced, zonal, directed oscillation, regulated by a clock mechanism; generates g-, MHD-, p-modes; coupling of gravity, nuclear energy production, EM

The source of excitation
• Javaraiah & Gokhale, 1995: relation to
planetary configurations
• The solar core oscillates around the mass
center of the Solar System, with a period
of ~11,2 years (Grandpierre, 1996)
• Coupled gravitational many-body system
to g-mode, EM oscillations, nuclear
reactions, dynamo waves, rotation

References
• Grandpierre, A. 2008, Dynamics in the solar core, submitted
• Grandpierre, A. and Ágoston, G. 2005, On the onset of thermal metastabilities in the solar core, Astrophys. Space Sci., 298, No. 4, 537-552.
• Grandpierre, A. 2000, The thermonuclear instability of the solar core, Nucl. Phys. B (Proc. Suppl.) 85: 52-57.

References
• Grandpierre, A. 1999, A Dynamic Solar Core Model: on the activity related changes of the neutrino fluxes, Astron. Astrophys., 348: 993-999.
• Grandpierre, A. 1997, A Mechanism Driving Solar Flares, in Proc. YOYOGI Symposium, "Observational Plasma Astrophysics: Five Years of YOHKOH and Beyond", eds. T. Watanabe et al.
• Grandpierre, A. 1996, A Pulsating-Ejecting Solar Core Model and the Solar Neutrino Problem, Astronomy and Astrophysics, 308: 199-214.

References
• www.konkoly.hu/staff/grandpierre