on the measurement of surface diffusivity in disordered...
TRANSCRIPT
The Open-Access Journal for the Basic Principles of Diffusion Theory, Experiment and Application
1
On the Measurement of Surface Diffusivity in Disordered Nanoporous Carbon via Molecular Dynamics Simulations
Xi Mi1,2 and Yunfeng Shi1 1 Department of Material Science & Engineering, Rensselaer Polytechnic Institute, USA
2
Department of Physics, Rensselaer Polytechnic Institute, USA
Corresponding Author: Yunfeng Shi, Department of Material Science & Engineering, Rensselaer Polytechnic Institute, NY 12180 Troy, E-Mail: [email protected]
Abstract Gas diffusion in nanoporous carbon includes distinct diffusion modes: surface diffusion on
the pore walls and non-surface diffusion away from pore walls. We have performed molecular dynamics (MD) simulations of Ar diffusion in disordered nanoporous carbon. The main objective of this work is to separate the surface diffusion and non-surface diffusion contributions so as to comprehend their respective dependency on the porous structure and testing conditions. The nanoporous carbon sample is obtained using the quenched molecular dynamics (QMD) method. Gas flows are generated by applying a constant external force on each Ar atom, mimicking a constant chemical potential gradient. The contributions from surface diffusion and non-surface diffusion are separated according to the distance of the gas atoms away from the pore wall. We show that the surface diffusivity is affected by the interactions between gas atoms and the pore walls, the temperature, and the loading.
Keywords NANOPOROUS CARBON; SURFACE DIFFUSION; CORRECTED DIFFUSIVITY;
ADSORPTION; MOLECULAR DYNAMICS SIMULATIONS;
1. Introduction Nanoporous carbon materials can be made into devices for gas separation [1–3], reaction [4] and storage [5], in which gas diffusion plays important roles. The gas diffusion inside nanoporous network can be classified loosely into surface diffusion and non-surface diffusion (Knudsen diffusion and bulk diffusion). Although surface diffusion is arguably the most important diffusion mode for adsorbing species in nanoporous materials, it is the least understood [6–10]. One of the main challenges to understand how gas molecules diffuse on the pore walls is the lack of structural understanding of porous structures in general. Existing simulation studies on diffusion in nanoporous carbon have been limited to simple models, such as the slit © 2011, Yunfeng Shi diffusion-fundamentals.org 16 (2011) 84, pp 1-8
2
pore model [2,11]. Recently, several nanoporous carbon models have been put forward among which Hybrid Reverse Monte Carlo [12] (HRMC) and Quenched Molecular Dynamics [13,14] (QMD) methods seem most promising. HRMC and QMD models are able to describe the disorderness of nanoporous carbon while still preserving reasonable ring distributions and neighbour distributions. More importantly, the structure factor S(q) of the above nanoporous carbon models matches that measured in experiments [12,13]. There have been a number of diffusion studies using HRMC model recently by Gubbins et al. [15–17]. In their studies, self-diffusivities from mean square displacements (MSD) vs. time were calculated by means of equilibrium MD (EMD) simulations [15–17]. However, the calculation of self-diffusivity from MSD measurements faces the following challenges: (1) the diffusive regime is difficult to reach at low temperature (i.e., the MSD is not strictly linear with time [15,17]), which prevents the extraction of the self-diffusivity; (2) it is unclear how to obtain the precise diffusion contributions from the surface diffusion and non-surface diffusion modes; (3) recent studies show sub-diffusive behaviour due to confinement effects (MSD~t1/2 [15,18]), which further complicates the calculation of the self-diffusivity. Our aim here is to separate the contributions from surface diffusion and non-surface diffusion so as to better understand the relation between surface diffusion and porous structure. Here we use a “gravitation method” which has been used to generate gas flow [11,19]. The essence of this method is to apply a constant external force on each Ar atom, mimicking a constant chemical potential gradient, to generate Ar flow. We differentiate surface and non-surface contributions to diffusion through carefully analysed atomic trajectories. Ar atoms that are within a 5 Å range of porous carbon are considered adsorbed on the surface. Their diffusion is seen as surface diffusion. In this way, one can correlate surface diffusion on the pore wall surface directly. We find that the surface diffusivity is more sensitive to C-Ar interactions than the non-surface diffusivity. Surface diffusivity has an Arrhenius-like dependence on temperature. In addition, surface diffusivity first increases, and then decreases with increasing Ar loading. These findings agree well with other research works.
2. Simulation Methodology The porous carbon sample is obtained through Quenched Molecular Dynamics
(QMD) [13,14]. The system is initially filled with mono-atomic C gas at very high temperature. Then it is gradually quenched to room temperature to form a porous structure. Detailed descriptions can be found in Ref. [13,14].
In this work, we use molecular dynamics simulations to simulate Ar motion through porous carbon and then compute diffusivities. The simulation box is cubic with a length of 37.78 Å in each direction. It consists of a total of 2048 C atoms, which assemble into a porous network through QMD. Next, different numbers of Ar atoms are inserted in order to study the diffusion at different loadings. After Ar insertion, each sample is thermally relaxed to reach equilibrium. Then a constant external force is applied on each Ar atom so as to generate Ar flow along the direction of the external force, as is illustrated in Fig. 1. The force fields used to describe C-Ar and Ar-Ar interactions are both 12-6 Lennard-Jones (LJ) potentials with following parameters: σC-Ar = 3.38 Å, εC-Ar/kB = 58.0 K, σAr-Ar = 3.405 Å and εAr-Ar/kB
The method we have used here to generate flows within porous medium resembles the “gravitation method” introduced in Ref. [19]. According to Darken’s model [21], the constant external force on each Ar atom is equivalent to a constant chemical potential gradient pointing in the opposite direction for Ar. The diffusivity can be computed as:
= 120.0 K [20]. NVT ensembles are implemented throughout the simulation. Each integration time step is 0.07 fs. Each simulation runs for 7 ns to get good statistics.
© 2011, Yunfeng Shi diffusion-fundamentals.org 16 (2011) 84, pp 1-8

3
Fig. 1: Illustration of Ar adsorbed in porous carbon and method of generating flows. Red spheres represent Ar atoms. The porous C network is colored in black. A constant external force is applied on each Ar atom, mimicking a constant chemical gradient, so as to generate flow along the direction of the force.
xRTDcJ
∂∂
×−=µ (1)
where J is gas flux, c is gas number density and R is the universal gas constant. The diffusivity D computed this way is the corrected diffusivity along the x direction. This method has also been used recently in other simulation works on diffusion [11].
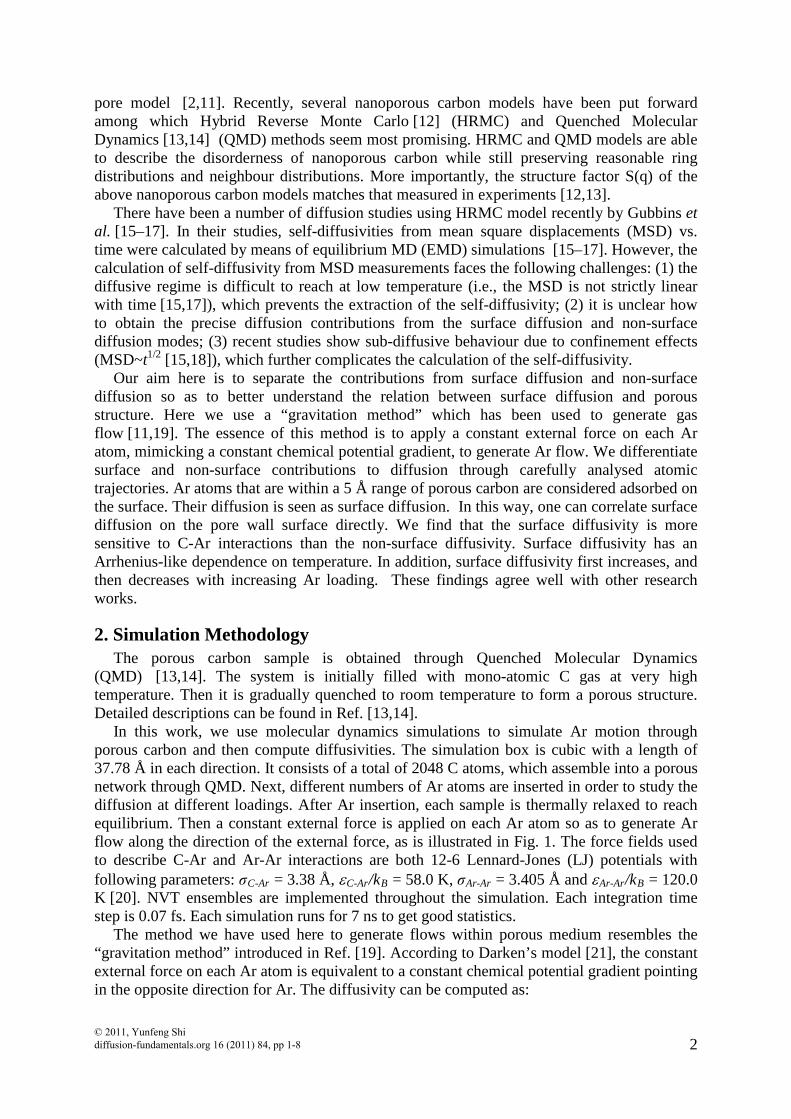
In order to speed up the simulation, we fix all C atoms when generating Ar flows to compute the corrected diffusivity. In this way, C-C interactions do not have to be calculated. Fig. 2(a) shows a typical plot of Ar flux vs. chemical potential gradient. The plot shows a very good linear relation and thus enables us to extract the corrected diffusivity from the slope of the fitting line. We also simulated a few samples with unconstrained C atoms (using RSS potential for C-C interactions [13], which is the same force field used in QMD simulations to generate the nanoporous carbon model). As can be seen in Fig. 2(a), diffusivities calculated from unconstrained samples agree reasonably with constraint samples. Therefore, the following results are reported using a frozen porous carbon network.
To further verify our method, we compare corrected diffusivity and self-diffusivity at different Ar loadings. Both quantities should be equal at the dilute limit, i.e., zero loading [22]. To compute the self-diffusivity, we perform equilibrium MD simulations to obtain the MSD as a function of time. We have calculated the corrected diffusivity and self-diffusivity for different loadings at 290 K. To obtain good statistics for the zero-loading cases, we use samples with 100 Ar atoms but without Ar-Ar interactions. This is equivalent to average over 100 samples each with the entire porous carbon structure and one isolated Ar atom. Fig. 2(b) clearly shows that the corrected diffusivity agrees with the self-diffusivity at zero loading for our samples. The surface and non-surface flux are well-defined as long as we know which atoms are “surface” atoms, the atoms adsorbed on pore walls, and which are “non-surface” atoms, the atoms that are not adsorbed.
We use distance criteria to determine whether an Ar atom is adsorbed at a particular instant. To verify this, we plot a typical plot for shortest C-Ar distance distribution in Fig. 3. The shortest C-Ar distance is defined as the distance from an Ar atom to its nearest C atom. The peak ranging from 3 Å to 5 Å represents the first adsorption layer of Ar on porous carbon. Therefore, we label Ar atoms that are within 5 Å separation to any C atom as adsorbed atoms (“surface” atoms). All the other Ar atoms (“non-surface” atoms) are considered to be not directly interacting with C. © 2011, Yunfeng Shi diffusion-fundamentals.org 16 (2011) 84, pp 1-8
4
Fig. 2: (a) Typical plots of Ar flux vs. chemical potential gradient (flexible C and unconstrained C). A clear linear relation is observed (b) Comparison between self-diffusivity and transport diffusivity at 290 K. Both diffusivities converge to the same value at zero loading.
Fig 3: Normalized shortest C-Ar distribution. The distance from each Ar atom to its nearest C atom is calculated, then plotted as a histogram and subsequently normalized by the total number of Ar atoms in the system.
(a)
(b)
© 2011, Yunfeng Shi diffusion-fundamentals.org 16 (2011) 84, pp 1-8

5
3. Results and Discussions
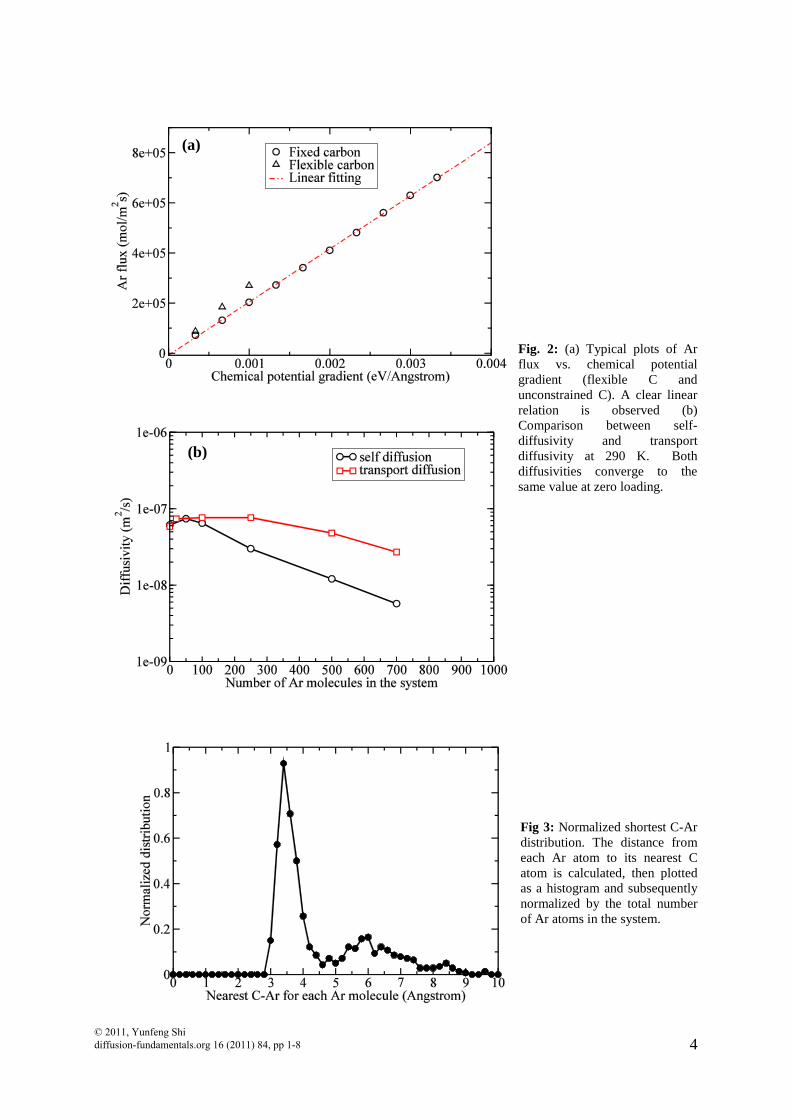
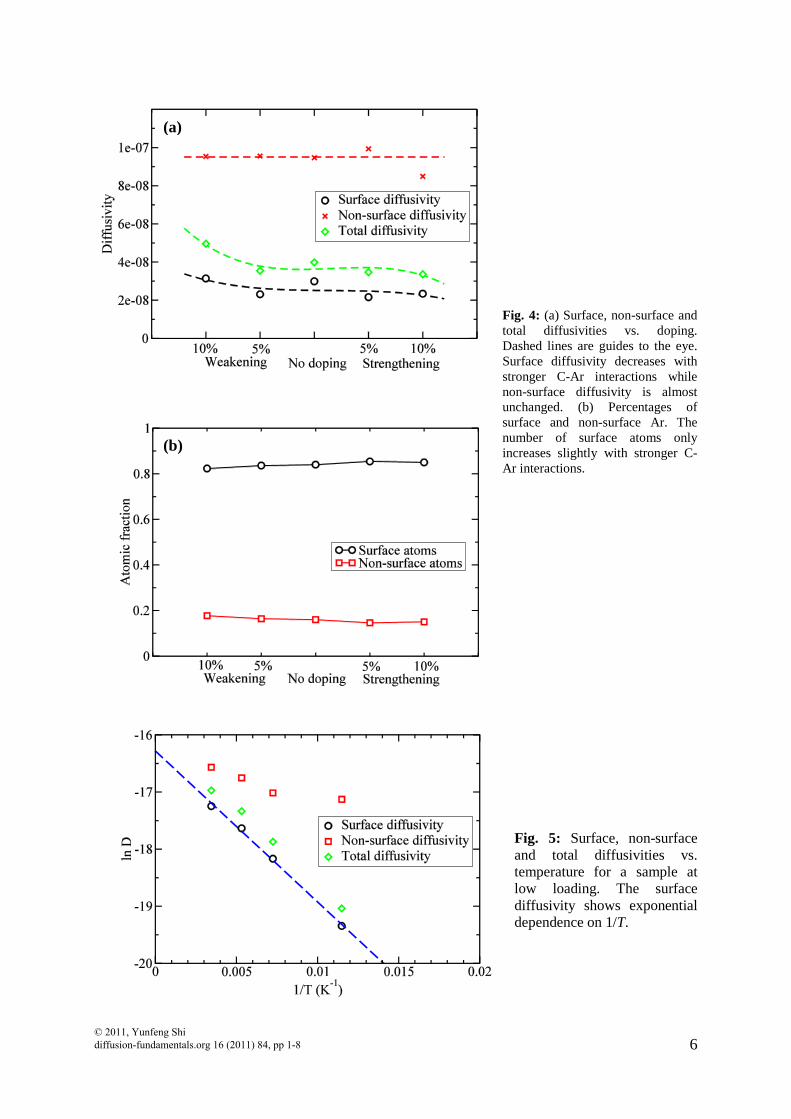
3.1 Dependency on gas-substrate affinity Fig.4 shows (a) surface, non-surface and total diffusivity vs. doping (b) percentage of Ar
atoms being adsorbed or not adsorbed. We randomly select fractions of C atoms (5% or 10%) and artificially either reduce in half or double their interactions with Ar atoms. After that, similar diffusion tests have been performed on these samples. This is to mimic the doping situation where C atoms are replaced by other atoms that have stronger/weaker interactions with Ar atoms. We use this method to investigate how surface diffusivity changes with C-Ar interaction. It is found that the percentage of adsorbed Ar only increases slightly when C-Ar interactions become stronger. On the other hand, surface diffusivity decreases with stronger C-Ar interactions while non-surface diffusivity almost keeps constant from 10% weakening to 10% strengthening. This can be understood as follows. The larger the C-Ar interaction, the more difficult for a surface Ar atom to diffuse to another surface spot. However, for non-surface atoms, since they are away from the pore wall, they are much less affected by the change of C-Ar interactions. Therefore, we have demonstrated a procedure of adjusting surface diffusivity alone without disturbing the non-surface diffusivity. The noises in Fig. 4(a) are caused by the fact that the “doping” atoms are chosen randomly in each sample. It is possible that C atoms at different location of the porous network can have a different impact on gas diffusion. It should be noted that the above observed trend in diffusivity has non-negligible noise, which we plan to reduce through carrying out multiple independent simulations.
3.2 Dependency on temperature It is generally understood that surface diffusion is accomplished by thermally activated, adsorbate molecules jumping to adjacent adsorption sites (HIO model) [23]. Thus the temperature dependence of surface diffusivity obeys Arrhenius-like relations [21]:
)exp(0 TkEDDB
ass −= (2)
where Ea is the activation energy of surface diffusion and kB is the Boltzmann constant. Fig.5 plots the surface diffusivity, non-surface diffusivity and total diffusivity for Ar
diffusion in nanoporous carbon at 290 K at zero loadings. The surface diffusivity can be fitted with eq.(2). We obtain Ea/kB = 264 K, as compared to εC-Ar/kB = 58.0 K, which we used for C-Ar van der Waals interactions. This value is reasonable, implying multiple C-Ar van der Waals pairs are broken and then reformed during the Ar hopping process.
3.3 Dependency on loading Both surface diffusivity and non-surface diffusivity strongly depend on the loading of gas molecules in the nanoporous carbon sample. Both surface diffusivity and non-surface diffusivity first increase and then decrease with increasing loading, although they reach maximum values at different loadings. As a result, the total diffusivity also increases and then decreases, as is observed in other works [16–18]. The reason can be qualitatively understood following the aforementioned references: Ar atoms first adsorbs on high-affinity adsorption sites of nanoporous carbon. This causes the potential energy landscape that Ar atoms sample on nanoporous carbon walls to be smoother upon initial loading. Therefore, there appears an initial increase in diffusivity at low loading. At higher loading, surface diffusivity drops, probably due to strong Ar-Ar interactions.
© 2011, Yunfeng Shi diffusion-fundamentals.org 16 (2011) 84, pp 1-8
6
Fig. 4: (a) Surface, non-surface and total diffusivities vs. doping. Dashed lines are guides to the eye. Surface diffusivity decreases with stronger C-Ar interactions while non-surface diffusivity is almost unchanged. (b) Percentages of surface and non-surface Ar. The number of surface atoms only increases slightly with stronger C-Ar interactions.
Fig. 5: Surface, non-surface and total diffusivities vs. temperature for a sample at low loading. The surface diffusivity shows exponential dependence on 1/T.
(a)
(b)
© 2011, Yunfeng Shi diffusion-fundamentals.org 16 (2011) 84, pp 1-8

7
Fig. 6: Surface, non-surface and total diffusivities vs. loading at 290 K.
4. Conclusions In this work, we have measured surface and non-surface diffusivities for Ar in nanoporous
carbon. Using the “doping” method introduced here, we show that the surface diffusivity is more sensitive to pore wall–gas interactions than non-surface diffusivity. So it is possible to modulate surface diffusion by adjusting pore wall–gas interactions. In addition, surface diffusion is investigated upon different testing conditions, i.e., the temperature and Ar loading. We observe Arrhenius-like relations for surface diffusivity as a function of temperature. On the other hand, surface diffusivity shows non-trivial loading-dependency: surface diffusivity increases and then decreases with increasing Ar loading in the system.
Acknowledgements We would like to thank the following scientists for illuminating discussions: Professor Marc-Olivier Coppens and Professor Liping Huang at Rensselaer Polytechnic Institute and Professor Keith Gubbins and Dr. Jeremy Palmer at North Carolina State University.
References [1] M. B. Rao and S. Sircar, Journal of Membrane Science 85, 253-264 (1993). [2] M. G. Sedigh, W. J. Onstot, L. Xu, W. L. Peng, T. T. Tsotsis, and M. Sahimi, J. Phys.
Chem. A 102, 8580-8589 (2011). [3] P. Pandey and R. S. Chauhan, Progress in Polymer Science 26, 853-893 (2001). [4] B. Xiao, J. P. Boudou, and K. M. Thomas, Langmuir 21, 3400-3409 (2005). [5] R. E. Morris and P. S. Wheatley, Angewandte Chemie International Edition 47, 4966-
4981 (2008). [6] I. Prasetyo, H. D. Do, and D. D. Do, Chemical Engineering Science 57, 133-141 (2002). [7] A. Kapoor and R. T. Yang, Chemical Engineering Science 46, 1995-2002 (1991). [8] O. V. Bychuk and B. O’Shaughnessy, Phys. Rev. Lett. 74, 1795 (1995). [9] H. M. Alsyouri and J. Y. S. Lin, J. Phys. Chem. B 109, 13623-13629 (2005). [10] C. G. Sonwane and Q. Li, J. Phys. Chem. B 109, 5691-5699 (2005).
© 2011, Yunfeng Shi diffusion-fundamentals.org 16 (2011) 84, pp 1-8

8
[11] Q. Cai, M. J. Biggs, and N. A. Seaton, Physical Chemistry Chemical Physics 10, 2519 (2008).
[12] S. K. Jain, R. J.-M. Pellenq, J. P. Pikunic, and K. E. Gubbins, Langmuir 22, 9942-9948 (2006).
[13] X. Mi and Y. Shi, MRS Online Proceedings Library 1224, 1224-FF10-10 (2009). [14] Y. Shi, J. Chem. Phys. 128, 234707 (2008). [15] J. C. Palmer, J. D. Moore, J. K. Brennan, and K. E. Gubbins, Adsorption 17, 189-199
(2010). [16] J. D. Moore, J. C. Palmer, Y.-C. Liu, T. J. Roussel, J. K. Brennan, and K. E. Gubbins,
Applied Surface Science 256, 5131-5136 (2010). [17] T. X. Nguyen, S. K. Bhatia, S. K. Jain, and K. E. Gubbins, Molecular Simulation 32,
567-577 (2006). [18] K. E. Gubbins, Y.-C. Liu, J. D. Moore, and J. C. Palmer, Physical Chemistry
Chemical Physics 13, 58 (2011). [19] J. Koplik, J. R. Banavar, and J. F. Willemsen, Physics of Fluids A: Fluid Dynamics 1,
781 (1989). [20] S. K. Jain, J. P. Pikunic, R. J.-M. Pellenq, and K. E. Gubbins, Adsorption 11, 355-360
(2005). [21] D. D. Do, Absorption Analysis: Equilibria and Kinetics (World Scientific Publishing
Company, 1998). [22] D. S. Sholl, Acc. Chem. Res. 39, 403-411 (2011). [23] Higashi, H. Ito, and J. Oishi, Nippon Genshiryoku Gakkaishi Japan 5, 846-853
(1963).
© 2011, Yunfeng Shi diffusion-fundamentals.org 16 (2011) 84, pp 1-8