on the kofa national wildlife refuge 2000 … › southwest › es › arizona › documents ›...
TRANSCRIPT

DEPARTMENT OF THE INTERIOR
U.S. FISH AND WILDLIFE SERVICE
REGION 2 DIVISION OF ENVIRONMENTAL CONTAMINANTS
CONTAMINANTS IN BIGHORN SHEEP
ON THE KOFA NATIONAL WILDLIFE REFUGE, 2000-2001
By Carrie H. Marr, Anthony L. Velasco1, and Ron Kearns2
U.S. Fish and Wildlife Service Arizona Ecological Services Office
2321 W. Royal Palm Road, Suite 103 Phoenix, Arizona 85021
August 2004
2ABSTRACT Soils of abandoned mines on the Kofa National Wildlife Refuge (KNWR) are contaminated with arsenic, barium, mercury, manganese, lead, and zinc. Previous studies have shown that trace element and metal concentrations in bats were elevated above threshold concentrations. High trace element and metal concentrations in bats suggested that bighorn sheep also may be exposed to these contaminants when using abandoned mines as resting areas. We found evidence of bighorn sheep use, bighorn sheep carcasses, and scat in several abandoned mines. To determine whether bighorn sheep are exposed to, and are accumulating hazardous levels of metals while using abandoned mines, we collected soil samples, as well as scat and bone samples when available. We compared mine soil concentrations to Arizona non-residential clean up levels. Hazard quotients were elevated in several mines and elevated for manganese in one Sheep Tank Mine sample. We analyzed bighorn sheep tissues for trace elements. We obtained blood, liver, and bone samples from hunter-harvested bighorn in 2000 and 2001. Arizona Game and Fish Department also collected blood from bighorn during a translocation operation in 2001. Iron and magnesium were elevated in tissues compared to reference literature concentrations in other species. Most often, domestic sheep baseline levels were used for comparison because of limited available data for bighorn sheep. All other metals data were within normal ranges. Patterns of elevated tissue accumulation were: copper and iron in blood; barium, cadmium, manganese, and zinc in liver; and lead, strontium, and magnesium in bone. Intersex comparisons were also made. Barium was the only element significantly greater in female blood. Although not statistically different, iron concentrations were also greater in females compared to males. We compared scat collected from different mines with mines’ soil concentrations and found that scat had elevated boron, magnesium, and strontium concentrations. We recommend inset fencing for the four adits at Sheep Tank Mine so bighorn can still rest at the shaded entrance of the mine, but cannot go deep into the mine where increased metal exposures are more likely. We also recommend that future contaminant studies on KNWR bighorn include nutritional analysis so as to fully assess the health of the herd.
Project No. 22410-1261-2N42 DEC ID No. 200120002 1 Present address: 3761 Georgetown Rd., Frankfort, Kentucky 40601 2 Kofa National Wildlife Refuge, 356 W. 1st Street, Yuma, Arizona 85364

3INTRODUCTION The California gold rush of 1849 brought attention to the rich mineral resources found in the Kofa, Plomosa, and Castle Dome mountains, now part of the Kofa National Wildlife Refuge (KNWR) (Graham 1971). Tertiary volcanic and hypabyssal rocks contain Neogene epithermal veins that provided most of the precious metal production in the vicinity. These veins are rich in silver or gold. In this area, the silver-bearing veins are characterized by manganiferous calcite, and can contain galena (lead ore), barite, and chalcopyrite (copper ore). The epithermal veins of Sheep Tank Mine are considered a localized anomaly with very high values of arsenic, lead, copper, silver, mercury, and zinc (Bagby et al. 1987). The Sheep Tank Mine, however, was mined primarily for manganese, an ingredient used in making steel. Manganese was mined and exploited heavily to support the war effort during World War II. Numerous other anomalies are present on KNWR and also have been mined. In 1984, Bagby et al. (1987) found 448 mining claims still existing on the KNWR’s 8 mining districts - a significant reduction from the 1,050 claims identified 12 years earlier. Inactive claims may attract wildlife, particularly if they provide shelter from the intense summer temperatures which can reach in excess of 124° F (51 C°). The KNWR was established in 1939 for the protection, management, and preservation of desert bighorn sheep (bighorn) (Ovis canadensis mexicana). It is estimated that between 550 and 800 bighorn sheep currently inhabit its rugged mountains. The largest ranges also are the most heavily influenced by mining; these include the Kofa, Castle Dome, and Plomosa mountains. The 665,400 acre (269,278 hectare) refuge also protects habitat for other unique biota of the Sonoran Desert ecosystem such as the desert tortoise (Gopherus agassizii), ringtail (Bassariscus astutus), California leaf-nosed bat (Macrotus californicus), California myotis (Myotis californicus), ironwood (Olneya tesota), saguaro (Cereus giganteus), California fan palm (Washingtonia filifera), and the Kofa Mountain barberry (Berberis harrisoniana). On hot days most bighorn sheep bed between 10:00 am and 3:00 pm (Simmons 1980). They prefer caves, mines, overhangs, or other shaded relief and will lie down with feet tucked under the body and head erect, unless completely relaxed, then they will rest their chin on the ground. Desert bighorn regulate heat by sweating, often combined with panting, presumably to reduce water loss (Simmons 1971, 1980). While much has been published on the behavior of the species, no information is available on the grooming habits of bighorn sheep. Grooming habits are assumed to be similar to other ungulates, where licking fur of juveniles and suckling pose greater risks of ingesting mine soil/dust by females and young. Bedding and grooming habits also are likely pathways of exposure (respiratory intake and ingestion) to heavy metals found in high-grade ores of the mines. Bench et al. (2001) found that inhalation is a significant exposure pathway for metals and Beyer et al. (1994) noted that soil ingestion may be a principal exposure pathway to environmental contaminants. Because bighorn sheep are in contact with loose soil on the floor of the mine, bighorn sheep using mines on KNWR are likely at a high risk of exposure to metals in abandoned mines. Biologists have observed bighorn sheep eating soil and rocks, presumably to obtain calcium
4(Ca), phosphorus (P) or other minerals (Browning and Monson 1980). Thorton and Abrahams (1983) found that soil ingestion for grazing animals was a major exposure pathway to heavy metals, although the amount of soil as a percentage of diet in ungulates is estimated at less than 2% (Beyer et al. 1994). Since highly mineralized deposits are abundant on the KNWR, bighorn may be receiving potentially chronic dietary doses of toxic elements by using these deposits. Bagby et al. (1987) sampled alluvial areas for his mineral assessment of the KNWR because mining operations and weathering processes contaminated stream sediments. Bighorn are likely exposed to metal-enriched areas while feeding and by seeking shelter in abandoned mines. However, the effects of mineral deficiencies and toxicities for bighorn are virtually unstudied (Allen 1980). Preliminary data from soils in Sheep Tank Mine show arsenic, mercury, lead, and zinc to be above Arizona maximum background levels (97; 0.57; 100; 150 ppm, respectively) (Bagby et al. 1987; King and Velasco, 1998 unpub. data). Arsenic is a teratogen and carcinogen that can be absorbed by ingestion, inhalation, or through permeation of skin or mucous membranes. Susceptible species of mammals were adversely affected at chronic doses of 1 to 10 mg arsenic per kilogram of body weight (Eisler 1988a). Mercury is a highly toxic, bioaccumulative element; sensitive mammals showed significant adverse effects when daily intakes were 250 ug/kg body weight (Eisler 1987). Lead can affect behavior, growth, survival, and reproduction in mammals, with chronic exposures less than 1 mg/kg body weight (Eisler 1988b). Zinc is relatively non-toxic to mammals; however, some literature suggests that respiratory uptake poses significantly greater risks than dietary uptake (Eisler 1993). Several trace elements and metals interact with each other; therefore, we analyzed bighorn tissues for 19 different trace elements and metals. In 1998, U.S. Fish and Wildlife Service (FWS) Environmental Contaminants personnel conducted an investigation of contaminants in bats of the Imperial National Wildlife Refuge (NWR). We sampled the Sheep Tank Mine at KNWR as a reference site for Colorado River contaminant influences. Analytical results later revealed potentially harmful concentrations of several heavy metals in California leaf-nosed bats (Macrotus californicus) inhabiting the mine. Tissue burdens exceeded threshold levels for arsenic (<1.0 ppm wet weight (Eisler 1988a)) and lead (<1.0 ppm dry weight (Ma 1996)). Bats had significantly higher barium and manganese levels from KNWR when compared to bats from Imperial NWR. We also detected very high levels of these metals in soil samples taken from the mine floor, which were directly correlated with the elevated levels found in bat tissues. However, because we did not clean bats prior to analytical testing, elevated metals may be reflective of soil particles adhering to skin or hair of the bats rather than in the tissues. Nonetheless, barium, mercury, and arsenic soil levels were 10-14 times higher than the ambient Arizona maximum (Earth Technology 1991). When approaching this mine to conduct the sampling, a herd of bighorn cautiously exited from another mine opening. Upon entering the mine we detected a foul odor, eventually discovering three bighorn carcasses in varying states of decay. Because barium and manganese were elevated in bat tissue, and barium, mercury, and arsenic were elevated in the soil, we were concerned that bighorn were also being exposed to metals when they use mine adits for shelter.

5OBJECTIVES High soil concentrations in several KNWR mines indicated the need to evaluate wildlife exposures to high concentrations of metals in mine adit soils before we recommended mine closure. The objectives of this study were 1) to analyze bighorn tissue for trace elements to determine exposure to abandoned mines on the KNWR; 2) to identify suspected mines if soil, scat and carcass tissue had high concentrations of elements; 3) to compare values among age classes and among sites within KNWR and determine risk based on levels of exposure; and 4) to recommend management or mitigation measures for mines with high concentrations of elements and/or where high tissue concentrations were found.
METHODS
Study Area We conducted this study on the KNWR. We selected specific sample sites (mines) for more intensive review based on results of desert bighorn sheep tissue analyses, bat tissue analyses, home range of individuals, and inferential mining-district data. Mining was a major industry at the KNWR from the 1890-1910s prior to establishment as a refuge (Kepner and Hunter 1988). Gold, silver, copper, lead, zinc, and manganese were the major mineral deposits mined. Eight mining districts: Kofa, Castle Dome, Sheep Tank, and Plomosa (New Water mountains and Livingston Hills), which produced the greatest amount of ore, and Alamo Springs, Tank Mountains, Neversweat, and New Water delineated where most of the mineral deposits were (Bagby et al. 1987). There has been little to no production on most districts since 1974 (Kepner and Hunter 1988). The biotic community formations of the KNWR are in the Sonoran desertscrub formation: the lower Colorado River subdivision and Arizona upland subdivision (Turner and Brown 1994). Temperatures in the region vary from a mean of 52.7° F (11.5° C) in the winter to 91.9° F (33.3° C) in the summer. Average annual rainfall is 4.37 inches (111.1 mm). The KNWR ranges from 164 ft to 1,775 ft (50 m to 541 m) in elevation. The lower Colorado River subdivision is characterized by western honey mesquite (Prosopis glandulosa var. torreyana), ironwood (Olneya tesota), blue palo verde (Parkinsonia florida), and smoketree (Psorothamnus spinosa), desert willow (Chilopsis linearis), chuparosa (Justicia californica), desert honeysuckle (Anisacanthus thurberi), and canyon ragweed (Ambrosia ambrosioides), cat-claw acacia (Acacia greggi), burrobush (Hymenoclea salsola var. pentalepis), Anderson thornbush (Lycium andersonii), desert broom (Baccharis sarothroides), and creosotebush (Larrea tridentata). The Arizona upland subdivision is characterized by blue palo verde, ironwood, mesquite (Prosopis sp.), cat-claw acacia, foothill palo verde (Parkinsonia microphylla), crucifixion thorn (Canotia holacantha), many cholla species (Cylindropuntia sp.), saguaro (Carnegiea gigantea), fishhook pincushion (Mammilaria grahamii), fish-hook barrel cactus (Ferocactus wislizenii), and compass barrel cactus (F. acanthodes).
Sample collection and preparation We prepared packets containing chemically-cleaned sample jars, “vacutainer-style” blood sampler syringe packs, a condition index note-card, pre-addressed shipping materials,
6instructions, and study objectives and information/instructions and submitted them to Arizona Game and Fish Department (AGFD) for distribution to hunters that drew permits for the KNWR bighorn sheep hunts. We prepared packets for hunts occurring in Year 1 (2000) and Year 2 (2001) of the study. Thirteen permits were established for Year 1 harvest; seventeen permits were available for Year 2 harvest. We requested that hunters obtain a small sample of blood, bone, and liver, take notes on time and place of harvest, and condition of the animal. We instructed successful hunters to collect “matchbook-size” samples of fresh liver, a 2-inch segment of long bone, and 1-2 vials of fresh blood (from the body cavity or large vein or artery) during field dressing. We provided age-classification and condition indices for reference when ranking the harvested animal on the note-card. The shipping container contained a small “blue-ice” packet and shipping instructions for returning samples to the Arizona Ecological Services Office (AESO). Arizona Game and Fish Department obtained additional harvest data. After receipt of samples from the field, we froze specimens and held them until we received all samples from successful hunters. We then catalogued samples and submitted them to analytical laboratories under contract with the FWS’s Patuxent Analytical Control Facility (PACF).
Nine of the thirteen hunters returned the full complement of tissue samples to the field office in 2000. We provided seventeen hunters drawn for the KNWR hunt units in 2001 with hunter information/sample packets, and four additional hunters potentially hunting near KNWR boundaries, at the bighorn hunter’s clinic in September 2001. Nine of the 21 hunters returned tissue samples to the field office. Analytical results from bighorn tissues assisted in determining appropriate mines to sample. When tissue burdens indicated presence of metals, we used a home-range of 1 mile (1.6 km) for individual bighorn to compare tissue values to the existing mine-district mineral characterization reports found in the literature (Simmons 1980). We visited suspected mines for evidence of bighorn sheep utilization (presence/absence of scat and/or bones), and we sampled soils for metals. We collected soil samples using a stainless steel spoon and pan. Then we homogenized five individual sub-samples selected from bedding areas frequented by bighorn into one sample (FWS 1984) and placed them in whirl-paks. We inspected KNWR mines for bighorn use in autumn of 2001 (Figure 1). In mines where we found evidence of bighorn use (scat and/or bones), we collected soil, fecal pellets, and carcass samples (bones) when available. We investigated 27 mines or adit complexes (horizontal mining tunnels); eight of these mines had scat available for sampling. We collected multiple samples where ore material seemed to vary (i.e., based on color and/or texture variations where bighorn could be exposed to different minerals), and we found five carcass remnants (bones) in three different adits. We collected bones and stored them in whirl-paks. We rinsed scat samples in distilled water, in the laboratory, to reduce possible contamination by soil particles adhering to fecal pellets. We allowed samples to dry and placed them in new sample containers prior to shipment to PACF contract labs. We also added long bone tissue analyses to the list of analytical tests in 2001 to review potential chronic exposures of trace elements in bighorn. In early October 2000, two quail hunters found a moribund bighorn ram in a waterhole in the

7Castle Dome Mountain portion of KNWR. The hunters immediately contacted refuge personnel by cellular phone, but the bighorn died after refuge personnel arrived to rescue the animal. They transported the bighorn to the University of Arizona Veterinary Diagnostic Laboratory for necropsy. The lab collected liver samples during the necropsy and analyzed for copper, selenium, and zinc. The results of the necropsy described the bighorn ram as selenium and vitamin E deficient (Reggiardo 2000). Arizona Game and Fish Department conducts bighorn translocations irregularly as a population management tool. They determine the translocation schedules on an “as needed” basis. The AGFD conducted a translocation in November 2001. They captured twenty-seven bighorn and moved them to another nearby hunt unit. The bighorn went through a series of veterinary tests before they were released; veterinarians gave the bighorn physical examinations; inoculations were administered, and a suite of blood samples, pap smears, and throat cultures were taken to analyze for blue tongue, Epizootic Hemorrhagic Disease, Bovine Virus Diarrhea virus, Parainfluenza-3 (bovine), Bovine Respiratory Syncytical virus, Infectious Bovine, Rhinotracheitis virus, and Chlamydia. We coordinated with AGFD, KNWR, and Arizona-Sonora Desert Museum to collect blood samples from captured bighorn. Blood collection followed procedures outlined by Smith and Krausman (1988). We obtained blood samples for each of these bighorn, and these samples were submitted with the hunter-harvested tissues. We also collected age and condition information according to internal AGFD protocol (pers. comm., June 28, 2004, Bob Henry, AGFD, Yuma, AZ) during the processing associated with translocation. Chemical analyses Research Triangle Institute (RTI) in 2001 and Laboratory and Environmental Testing, Inc.(LET) in 2003 analyzed blood, liver, carcass, soil and fecal samples for aluminum (Al), arsenic (As), boron (B), barium (Ba), beryllium (Be), cadmium (Cd), chromium (Cr), copper (Cu), iron (Fe), mercury (Hg), magnesium (Mg), manganese (Mn), molybdenum (Mo), nickel (Ni), lead (Pb), selenium (Se), strontium (Sr), vanadium (V), and zinc (Zn). Two different labs were used because we did not specify to which lab PACF should send the samples. Arsenic and Se concentrations were determined by graphite furnace atomic absorption spectrophotometry (EPA 1984) in 2001 by RTI and by hydride generation atomic absorption in 2003 by LET (EPA 1987). Mercury was quantified by cold vapor atomic absorption (EPA 1984). Lead in animal tissue was analyzed using graphite furnace atomic absorption in the 2001 samples (EPA 1987). All other elements were analyzed by inductively coupled plasma (ICP) atomic emission spectroscopy (Dahlquist and Knoll 1978, EPA 1987) or ICP-mass spectrometry. Vanadium could not be measured in 2000 bone samples due to high Ca interference. The laboratories maintained quality assurance and quality control (QA/QC) by analyzing blanks, duplicates, and spiked samples. The PACF monitored QA/QC. Analytical methodology and reports met or exceeded PACF QA/QC standards. Metal concentrations are expressed in ppm, dry weight. The lower limits of quantification varied by element and by sample and are listed in Appendices 1-5. Percent moisture is also presented to permit wet weight to dry weight conversions.

8Statistical analysis We compared tissue metal concentrations (following Millard et al. 1986) using nonparametric statistical tests (Kruskal-Wallis One-Way ANOVA on Ranks). The Kruskal-Wallis tests included tests for sex-dependent effects. We also ran regressions of age versus metals. We calculated the arithmetic mean when a metal was detected in ≥50% of the samples. Geometric means are also presented for those metals that failed the Modified-Levene Equal-Variance test (Levene 1960, Conover et al. 1981). For those samples which were non-detect, we substituted a value of one-half the lower limit of detection for the non-detected value to facilitate calculation of means. We had to normalize some residue data by log- or square root- transformation before we could compare means. We used the Bonferroni Kruskal-Wallis Multiple-Comparison Z-Value test to separate means when the Kruskal-Wallis ANOVA test showed significant differences.
RESULTS We collected desert bighorn sheep samples throughout the KNWR (Figure 1). With the exception of one bighorn ram, we collected all bighorn in either the Kofa Mountains or the Castle Dome Mountains. Most hunter-harvested bighorn were taken near sites where the translocated bighorn were captured. The proximity of bighorn captures may be due to the topography of KNWR. Bighorn prefer the steep, rocky slopes on KNWR to broad, open areas such as King Valley. Bighorn sheep in California move seasonally depending on forage conditions; however, this has not been observed in a similar study in Arizona on the nearby Cabeza Prieta NWR (Simmons 1980). Rams have seasonal movements to areas of lower relief from November to late spring where they often congregate in “bachelor quarters”. Ewes and younger bighorn remain in higher relief areas, where lambing occurs (“lambing grounds”), during this period. Most bighorn congregate once again around water holes in June and often stay in larger mixed bands throughout the breeding period until late October. The location of bighorn is related to the topography of the mountains at KNWR, and this is also where all of the mines are located. There are 77 mines, claims, or patents in or near the KNWR mountains. There are also developed water sources for the bighorn in the mountains; we noted that some of the collected bighorn sheep were closer to water sources than mines. We have divided the KNWR into six general areas, for ease in describing the relationship between bighorn capture location and mine and/or water proximity: Donaldson Claim – Kofa Queen, Tunnel Springs, Kofa mountains, Sheep Tank Mine, Castle Dome mountains, and Arch Tank (Table 1). Out of the eight mining districts described earlier, the Donaldson Claim – Kofa Queen, Tunnel Springs and Kofa mountains are all in the Kofa district. The Sheep Tank Mine is in the Sheep Tank district and the Castle Dome mountains and Arch Tank are in the Castle Dome district. Three hunters did not provide any data for the harvest location: 8BHS, 10BHS, and 11BHS.
Donaldson Claim - Kofa Queen Nine bighorn were captured or harvested between the Donaldson Claim and the Kofa Queen
9(Figure 1; Table 1). Hunters had harvested two of these bighorn. We did not collect any soil or scat samples between the Donaldson Claim and the Kofa Queen Mine. Five translocated and two hunter-harvested bighorn were captured in this area. We did not detect several metals in the translocated bighorns’ blood samples: Al, As, Be, Cd, Cr, Hg, Mg, Mo, Ni, Pb, or V. We did not find any As, Be, and Ni and we only found one or two detections of Cd, Cr, Hg, Mo, and V in the hunter-harvested bighorn data. Again, we detected Ba, Mg, and Sr from 1-3 orders of magnitude greater in bone than in blood or liver. Copper and zinc concentrations in liver tissue were slightly higher than the concentrations in blood. Iron was detected in all bighorn blood samples, ranging from 120-2,450 ppm dry weight. Tunnel Springs Mine Hunters killed four bighorn between the Tunnel Springs Mine and the Rand-Geyser-IXL mine grouping in the Kofa Mountains in 2000 and 2001 (Figure 1; Table 1); no bighorn were collected from this area during the relocation effort. These bighorn were only 1.1 - 2.35 miles (1.77 – 3.78 km) from the nearest mines. We also collected soil (n=2) and bighorn scat (n=2) in the Tunnel Springs Mine. One individual, Individual L, had high concentrations of Al, Fe, Mg, Mn, and V in the blood and high levels of Mg in the bone (Appendix 2). This could indicate that it had been in a mine just prior to its harvest. Typically, Mg is deposited in bone, and higher Mg bone concentrations were found in the other three Tunnel Springs rams, when compared to the other KNWR mine areas. Although other matrices had lower Sr levels than bone, bighorn appear to be eliminating 1.2 to 2.7-times as much Sr as they are exposed to in the soils of these mines. Barium was also concentrated in these bighorns’ bones (between 2.6 and 55.8-times greater in bone than blood). Barium in soil was as high as 432 ppm, one order of magnitude greater than bone concentrations. Barium concentrations in scat were 1.5 to 4.4-times lower than in soils. Similar to Sr, bighorn are eliminating as much Ba as they are concentrating in their bones. Blood Fe concentrations ranged from 1,279 to 15,000 ppm dry weight.
Kofa Mountains Fourteen bighorn were captured or harvested near the North Star and King of Arizona Mines (Table 1). The closest bighorn harvested to a mine was less than one-tenth mile (0.16 km) from the Rob Roy mine. The furthest individuals from mines in this area were roughly two miles (3.22 km) away. Bighorn sheep can range over 3-4 square miles (8-10 sq. km) during the summer, whereas rams may travel widely and occasionally wonder 30-50 miles (50-80 km) (Simmons 1980). There are over 20 mines in this area. There were ten translocated and four hunter-harvested bighorns in this grouping. We collected one scat and one soil sample in the Kofa Mine area, but not from the same mine site. Barium, magnesium, and strontium all were bioconcentrated in the bone. Since soil and scat concentrations of Ba, Mg, and Sr were all very similar, it appears that these bighorn had reached a saturation point (steady state) in the bone, at which point they began to eliminate as much

10metal as they were exposed to, or that washing scat did not adequately remove soil particles. Copper and zinc concentrations were elevated in their livers, compared to blood, by about 20 and 1.5 times, respectively. Animal 7BHS had a greater blood Zn concentration than the other individuals, suggesting recent exposure (Appendix 2).
Sheep Tank Mine Several soil, scat, and bone (n=15) samples were collected at Sheep Tank Mine. Although bighorn sign was abundant, we did not collect any live bighorn samples from this area of the KNWR. Soil samples had greater Ba, Fe, Mn, Pb and Zn concentrations than scat or bone. Scat sample 7a had almost four times more Mg than the soil sample collected in the same general location. No bighorn were collected near this mine, but one ram was harvested in the New Water Mountains, in the north-east corner of KNWR in 2000 (Figure 1; Table 1). This ram was 11.89 miles (19.14 km) from the Sheep Tank Mine, but only 6.68 miles (10.75 km) from the nearest mine cluster near Alamo Springs. There are no mines in this corner of KNWR, but there are water holes nearby to which bighorn may be attracted. Castle Dome Mountains Eleven bighorn were found in the Castle Dome Mountains (Figure 1; Table 1). Seven bighorn were captured within 2 miles (3.22 km) of mines in this area. For example, one hunter-harvested ram, Individual H, was killed near Doc Carter Springs (Appendix 1). This spring is 1.25 miles (2.01 km) from the Adams Mine Group Mine. Another example is a translocated bighorn that was found less than a quarter-mile (0.40 km) away from the Keystone Mine. One bighorn, dead from natural causes, was found in this area, less than a mile (1.61 km) away from the Keystone Mine. Three bighorn were taken less than 2.5 miles (4.02 km) from the Castle Dome Adit . Barium and magnesium were elevated in bone in hunter-harvested individuals E and H compared to the other matrices (Appendix 1). Barium and magnesium accumulate in the bone because they are divalent cations similar to Ca. Similarly, Cu and Zn concentrations in liver tissues were highest in these bighorn and in individual K (Appendix 2). In one of two blood samples, individual H had an elevated blood Zn concentration, which may indicate recent exposure to a Zn source. However, in the other blood sample for individual H, the blood Zn concentration was not as elevated. We do not know if one Zn concentration was an anomaly or if it did reflect a recent exposure. Individual A was a dead ram found by hunters, and it had slightly elevated Zn concentrations in liver tissue (Appendix 1). All translocated bighorns from the Castle Dome Area were female. These females had elevated Fe in the blood but again, this may not be atypical for bighorns, especially females. Individual K had an elevated Fe concentration in the blood. Since Fe plays an integral role in oxygen delivery in the blood, this is probably not unusual. All other metal concentrations were similar between translocated and hunter-harvested bighorn. There was a higher concentration of Al, Be, Cu, Fe, Mn, Pb, V, and Zn in mine soil than in scat. Blood Al concentrations from the Castle Dome bighorns were 1-2 orders of magnitude less than in soil. When As was detected, it was 2 orders of magnitude less in bighorn blood than in soil

11and 1 order less in scat than in soil. We detected Be one order of magnitude less in blood and scat samples than in the soil. Livers concentrated Cu over soil concentrations by one order of magnitude; however, blood Cu concentrations were lower than soil concentrations by one order of magnitude. Soil Fe and Zn concentrations were one order of magnitude greater than blood and scat. Manganese concentrations in blood were two orders of magnitude lower than the Mn found in scat and soil. Lead was not detected in bone samples collected in the Castle Dome bighorns. Blood concentrations of Pb were one order of magnitude less than scat. Soil Pb concentrations were one order of magnitude greater than scat. Bighorn must depurate Pb efficiently in feces unless individuals are exposed to such high concentrations that Pb would deposit in bone; all scat samples were rinsed prior analysis, but it may be possible that mine soil particles absorbed to fresh scat and subsequent rinsing did not effectively remove the soil particles. Vanadium concentrations varied the same way that Pb did in blood, scat, and soil. Arch Tank We did not collect any soil or scat in the Arch Tank area because it is a wildlife water, not an abandoned mine. Three bone samples were collected: one bone (bone9) was collected at Arch Tank, and the other two were from hunter-harvested bighorn near Virgin Basin. Six bighorn were either captured or killed within 2.6 – 3.2 miles (4.18 – 5.15 km) of Arch Tank in 2000 and 2001 (Figure 1; Table 1). There are at least six other tanks in this area, but no mines. Only two hunter-harvested rams were collected in this area, so comparisons among matrices are limited. Bone Ba, Mg, and Sr concentrations were consistently 1-3 orders of magnitude higher than concentrations in blood or liver. Liver concentrations of Cu were three orders of magnitude higher than blood and bone concentrations. Blood Fe concentrations were over 6 times higher than liver concentrations and 2-4 orders of magnitude greater than bone Fe concentrations. One Virgin Basin bone sample had a Pb concentration 286-times greater than the lowest blood Pb concentration at Arch Tank.
Metals
Risk To determine the appropriate level of concern to bighorn based on soil concentrations (because this is likely to be the only pathway where bighorn are exposed to high metal concentrations), we compared soil screening levels (SSLs; ADEQ 1997) to soil concentrations in the 10 different soil samples collected. Soil screening levels are available for 17 different trace elements (Table 7). All of the As hazard quotients (HQ) (Table 7) have a value >1. One Mn HQ at Sheep Tank Mine Adit is >1. While HQs are not a measure of unacceptable risk, they do indicate a level of concern. Therefore, it was prudent to analyze sites with HQs>1 to see how the bighorn are affected. We also note that all of the Hazard Indices (HI), which are a sum of all of the HQs for a particular site, are >1. The highest HI was from Sheep Tank Mine Adit #3 (69.61) and the lowest HI was from one of the Castle Dome Adit soil samples (1.827). To estimate HI conservatively, we summed the HQ for each metal at one site to derive the HI. Therefore, we assumed that toxicity from each metal would be cumulative. This probably overestimates the level of concern, but we elected to err on the side of caution.
12Blood, Bone, Kidney, and Liver If non-detects made up more than 50% of the total number of samples, we did not conduct statistical analysis for that matrix. We found Al in twenty liver and eighteen bone samples and arithmetic mean concentrations ranged from 12 to 28 ppm (Table 2). Median concentrations were significantly higher in bone than in liver (χ2=12.52, P<0.001). We detected As in less than half of the blood samples collected. We detected B in 77% of the blood samples and 76% of the liver samples. Median concentrations were significantly greater in blood than in liver (χ2=8.744, P=0.003). We detected Ba in all blood samples and bone, but in only six liver samples. The data had to be log-transformed for statistical analysis because we detected unequal variance. Geometric mean concentrations were 1.83 ppm in blood and 70.01 ppm in bone. Median Ba concentrations were significantly greater in bone than in blood (χ2=84.73, P<0.0001). We only detected Be in the blood samples collected in 2000 and only Cd in bone, kidney, and liver collected in 2000. We detected Cr in all samples collected in 2000 but in only nine samples collected in 2001. Detection limits varied for different matrices (range: 1.2 – 1.44 ppm) at one lab (2000), while the other lab used 0.5 ppm detection limit for all matrices except soil (2001), even though they used the same procedures. Most of the non-detects occurred at the lab with the 0.5 ppm detection level; this detection level was lower than all of the detects from the other lab. Therefore, it is appropriate to make inter-lab comparisons. Liver and bone Cr concentrations were not statistically different from one another (χ2=0.311, P=0.5773). Statistical analysis of Cu revealed that median blood concentrations were significantly greater than bone (χ2=43.00, P<0.0001). Copper liver variance was not equal to the other two matrices and transformations of the data did not help. Although statistical analysis was not possible, liver concentrations consistently ranged 4.8 to 62-times greater than either blood or bone concentrations. It appears that the liver sequestered Cu preferentially over blood or bone. We detected Fe in all blood and liver samples and in most bone samples. Median blood Fe concentrations were statistically greater than liver and bone (χ2=74.69, P<0.0001). Geometric mean concentrations were 1832, 291.6, and 54.05 ppm dry weight in blood, liver, and bone, respectively. We detected Hg in nine out of ten liver samples and in one kidney sample in 2000 and in six liver samples in 2001. We detected Mg in all samples collected, but there was greater variation in individual bone samples. Although bone samples had higher Mg concentrations than blood or liver, we could not test for statistical differences. There was a statistical difference between the median blood and liver concentrations (χ2=36.39, P<0.0001). We did not detect Mn in greater than 50% of the blood samples. Median Mn concentrations were significantly greater in liver than in bone (χ2=14.61, P<0.0001) although the bone arithmetic mean was greater than liver. This occurred because the range of liver concentrations was smaller and because the distribution of Mn concentrations in bone was not normal. We did not detect Mo in any bone, but we did detect it in all 2000 blood and liver samples. We did not detect Mo in any 2001 blood or bone samples. If the detection limit had been lower in 2001, we may have been able to detect Mo in
13blood. In the 2000 analyses, all of the blood had concentrations <2 ppm. Neither lab detected any Mo in bone. The arithmetic mean concentration of Mo in liver was 3.38 ± 1.04 ppm. We only detected Ni in eight samples in 2000 and 2001. Median Pb concentrations were statistically greater in bone than in blood (χ2=18.74, P<0.000015). We only calculated an arithmetic mean Se concentration in blood because the liver concentrations varied greatly and there were not enough bone samples for statistical analysis. Selenium concentrations in blood ranged from 0.37 to 0.287 ppm dry weight. We detected Sr in 98 out of 100 samples collected. Median Sr concentrations statistically were the greatest in bone and smallest in the liver (χ2=62.97, P<0.0001). Among matrices, none of the Sr concentrations were statistically similar to one another. We detected V in all 2000 blood samples and in eight 2001 bone samples, but there were not enough detections for statistical analysis. We detected Zn in all of the samples. Each matrix had statistically different median Zn concentrations (χ2=37.76, P<0.0001). Median bone Zn concentrations were higher than blood concentrations, but lower than liver concentrations. Again, although the arithmetic mean concentrations for blood and bone were similar, the median concentrations were different due to the distribution of the concentrations and sample size. Age comparisons Age data were collected on the hunter-harvested and translocated bighorn in 2000 and 2001 with the cooperation of Arizona Game and Fish Department (pers. comm., March 21, 2004, Bob Henry, AGFD, Yuma, Arizona). There were no significant differences between bighorn of different ages for the following elements: As, Ba, Be, Cd, Cu, Hg, Mo, Ni, Se, Sr, and V (Figure 3). Selenium was the only contaminant that had a normal distribution; it was analyzed using a one-way ANOVA. The variance of the Cr data was not equal among the different age classes. The Cr data were transformed; however, no statistical conclusion could be made. Age-classes 1, 2, 5, 5.5, and Adult did not have enough samples for statistical comparison (n=2, 2, 2, 1, 2, respectively). The following metals had age-classes that were statistically different from each other: Al, B, Fe, Mg, Mn, Pb, and Zn all had age-classes that were statistically different from one another. For all statistically significant comparisons except Fe, age-class 3 had a lower median concentration than the other statistically significant age-classes. Unless noted, all other age-classes were similar to one another. The age-class 3 had statistically different Al concentrations than the age-classes 6, 7, 8 (χ2=41.57, P=0.00015). While the lambs (age-class=0.5 years) had the highest mean concentration, they also had the greatest amount of variance in individual Al concentrations. Median Al concentrations were 1 ppm in age-class 3 versus 6.59, 14, and 6.81 ppm in age-classes 6, 7, and 8, respectively. We found was statistically different B concentrations in the age-class 3 than in the 6,9,10-year age-classes (χ2=26.55, P=0.022). Median B concentrations were 1 ppm in the age-class 3 versus 4, 3, 3.3 ppm in age-classes 6, 9, and 10. Since 1 ppm B was one-half the limit of detection, this statistical difference may not be meaningful given that B was below the detection limit in at least 50% of the samples. Age-class 3 (median = 2355 ppm) had statistically greater Fe concentrations than in age-classes 8 and 10 (medians = 627 and 263 ppm) (χ2=48.91, P=0.00009). We found the lowest median Mg concentrations in age-class 3 (175 ppm) compared to age-classes 6 and 8 (590 and 603 ppm)
14(χ2=44.60, P=0.00005). Age-class 3 had statistically lower Mn concentrations (median = 0.25 ppm) compared to age-class 8 (median = 1.2 ppm) (χ2=40.27, P=0.0002). Age-class 8 (1.105 ppm) had statistically greater median Pb concentrations compared to age-class 3 (0.1 ppm). While Figure 3 indicates that lambs had the greatest mean Pb concentrations, the median Pb concentration was 0.1 ppm, or non-detect. We did not detect any Mn and Pb for age-class 3. Age-class 4 (27.5 ppm) had a statistically lower median Zn concentration than age-class unknown (131 ppm). Soil We collected soil at two different entrances to Tunnel Mine, High Henry Mine, two different places at Castle Dome Adit, and at five different sites at Sheep Tank Mine. We found extremely high concentrations of As, Ba, Hg, Mn, Pb, and Zn in mine soils (Table 3). Sheep Tank Mine Adit #3 had the highest concentrations. We recovered As (660 ppm) at 6.8-times the Arizona maximum background (97 ppm) and at 66-times the Arizona Non-Residential soil remediation level (10 ppm). We detected Ba as high as 8750 ppm, which is 5.8-times Arizona maximum background (1,500 ppm). We detected Hg 16.7-times the Arizona maximum background (0.57 ppm). We detected the highest Mn concentration, 102,000 ppm, at 10.2-times the Arizona maximum (10,000 ppm) and 2.4-times the Arizona Non-Residential standard (43,000 ppm). Our soil samples had Pb and Zn concentrations 16.3 and 27.8-times the Arizona maximum (100 ppm, 150 ppm), but were lower than the Arizona Non-Residential standard (2,000 ppm, 510,000 ppm). Scat We found and collected scat (fecal pellets) at the same abandoned mines where we collected soil. We compared trace element concentrations in scat to concentrations in soil found at the same mine (Table 4) to see if any trends were apparent. Boron concentrations in scat were greater than in soil. We only detected B in a few soil samples. Except for one scat sample at the Sheep Tank Adits, we detected higher B concentrations in scat than in the soil. At Tunnel Springs Mine, we detected B greater in one scat sample than in the soil. We detected Ba in scat (188 ppm) from Castle Dome Adit about 10-times greater than the Ba detected in Castle Dome soil. Chromium scat concentrations were greater in the Castle Dome Mine (4.8 ppm) and Sheep Tank Adit #2 (17 ppm). The Tunnel Springs Mine and Castle Dome Adit had greater Cu concentrations in scat than soil (8.6 and 17 ppm vs. 5.6 ppm; 11 ppm vs. 1 ppm, respectively). Low concentrations of Se and Ni in the soils made most of the Se and Ni concentrations in scat seem elevated. We detected Mg in all of the soils (2,000-7,000 ppm), so the greater scat concentrations provide evidence that those concentrations are high (5,020-11,500 ppm). We found Sr greater in the scat in all samples but one. Only one sample, Scat2 (103 ppm), from Tunnel Springs Mine had greater V and Zn concentrations in scat. Castle Dome Adit had nine different metals where the scat concentrations were higher than soil concentrations. Tunnel Springs Mine had six and seven exceedances where the scat trace metal concentrations were greater than soil. All of the Sheep Tank Adits had lower numbers of exceedances (1-6). This is probably an artifact of higher soil concentrations at the Sheep Tank Adits. High Henry Mine had only one element, Sr, with a concentration greater than scat.

15Bone We compared bone concentrations from hunter-harvested individuals with blood and liver samples and we also compared bone data with the soil and scat concentrations from abandoned mines (Table 5). We have seen bighorn use abandoned mines during aerial surveys and have found several bighorn carcasses at Sheep Tank Mine. We assumed that these individuals died in the mines as opposed to being cached in the mines by lions. We collected bones from those bighorn. Carcass bone had greater Ba, Mg, and Sr concentrations than soil and/or scat concentrations (Table 5). Bone had lower Ba concentrations than scat concentrations, but only by a difference of 45 to 93 ppm. The bone collected in abandoned mines had lower Pb concentrations when compared to the mines’ soil concentrations. We detected soil Pb concentrations 114 to 857 times greater than in bone. Blood We conducted intersex comparisons of elements in blood (Table 6). We collected almost twice-as-many male bighorn samples than females. Boron, Cu, Mg, and Zn had higher concentrations in males than in females. We detected limited concentrations of Al and As in females. Males had a statistically greater median B concentration than in females (χ2=18.76, P=0.000015); the same was true for arithmetic means: males had an average 4.685 ppm (dry weight) versus 2.000 ppm in females. Females had a greater natural logarithm median Ba concentration than males, but the difference was not statistically significant (χ2=3.665, P=0.055550). We detected Be in only one sample in 2001. We only detected Cd in two male blood samples, both at 0.2 ppm. We only detected Cr, Pb, Mn, Mo, Ni, and V in male samples. Males had a statistically greater median Cu concentrations than in females (χ2=18.04, P=0.000022). Females had higher Fe concentrations compared to males. Differences in sample size may have been a factor in our inability to statistically analyze the difference between Fe in male and female bighorns. The comparison of median Pb concentrations detected unequal variance, which violated an assumption of the one-way ANOVA. Attempts to transform the data did not correct the problem. We did not detect Hg in any blood samples. Males had a statistically higher median Mg concentrations than females (χ2=24.08, P=0.000001). Males and females had similar Se concentrations. The mean female blood samples had 0.57 mg/L Sr. We could not conduct statistical tests comparing Se and Sr between the sexes because we detected unequal variance (the variance for the bighorn females was very low), which violated an assumption of the one-way ANOVA. Males had a median Zn concentration, 48.3 ppm, statistically greater than the female, 30 ppm (χ2=17.40, P=0.00003) DISCUSSION Bighorn sheep in Arizona The current state-wide estimated number of desert bighorn sheep in Arizona is stable at about 5,500 (pers. comm., March 29, 2004, Brian Wakeling, AGFD, Phoenix, AZ). All Arizona bighorn populations fluctuate because disease, drought, competition, predation, and population

16size affect population dynamics. Recreational hunting of bighorn rams is permitted in Arizona. There were 94 desert bighorn hunt permits issued in Arizona in 2000. Thirteen permits were issued on KNWR, comprising 14% of the 2000 total. Sixteen permits were issued in 2001, comprising 17% of the 2001 total. Hunter success for the month-long December hunt on KNWR is usually 90% or higher. The desert bighorn population on KNWR is stable. Annual surveys of all bighorn habitat were done from 1980-86. Modified surveys covering half of the habitat were done from 1987 to 1991. Beginning in 1994, surveys were done triennially. Reliable population estimates since 1992 have ranged from 600 to 887 bighorn. The current estimate is 623 (KNWR 2003). The 17 surveys, spanning a period of 23 years, have resulted in yearling:ram:ewe:lamb sex/age ratios of 17:57:100:20.
Bighorn are ruminants with a four-chambered stomach. This allows them to browse in areas where they are susceptible to predation, then ruminate while laying down on more rocky, predator-free, terrain. Bighorn sheep use caves and abandoned mines to escape inclement weather and to possibly avoid predation. Utilization of abandoned mines on the KNWR potentially exposes bighorn to unusually high levels of trace elements and metals. While there are studies in the literature that report the effects of metals on ungulates and domestic sheep (Ovis aries), we were unable to find scientific literature on the effects of metals on desert bighorn sheep. Reviews on the concentrations and effects of metals are available for As, Cd, Cr, Cu, Hg, Mo, Ni, Pb, Se, and Zn (Eisler 1985a, 1985b, 1986, 1987, 1988a, 1988b, 1989, 1993, 1998a, 1998b). Most of these reports have data for domestic sheep. If we could not find data for domestic sheep, we then used surrogate ungulate species (e.g., white-tailed deer, Odocoileus virginianus) for comparisons below. Fox et al. (2000) studied forage mineral content of Sonoran pronghorn (Antilocapra americana sonoriensis) in the Growler and Agua Dulce mountains in southwestern Arizona, due south of the KNWR. They did not have any blood or liver data to confirm their dietary models. Wren (1986), Ma (1996), and Thompson (1996) reviewed the literature for the effects of Pb and Hg in mammals. Wren (1986) did not mention domestic sheep in his review. Ma (1996) had data on white-tailed deer, mule deer, moose, caribou, and mountain goat, but not on bighorn. Thompson (1996) reviewed the effects of Hg in mammals, but did not include any ungulates in his discussion. Metal bioaccumulation in bighorn is influenced by their trophic interactions (herbivory). Therefore, we limited our data analysis to other herbivorous ungulates. We found several studies that described metal concentrations in deer. Most studies only considered one matrix. Lewis et al. (2001), King et al. (1984), Musante et al. (1993), Stansley et al. (1991), and Woolf et al. (1982) studied metal concentrations in white-tailed deer livers; Dierenfeld and Jessup (1990) described the variation of Se in mule deer blood (Odocoileus hemionus) in a study examining the concentrations of 19 trace elements. The results of soil, scat, and bone concentrations at KNWR indicate that the bighorn are frequently exposed to the elevated mineral concentrations in the abandoned mines. Scat and

17bone evidence from the mines revealed that bighorn use the mines as loafing spots during the intense mid-day heat as well as for shelter for sick and dying individuals. Elevated concentrations of Ba, Mg, Sr, and Zn in bones from the Sheep Tank Mine describe either the tendencies for these elements to accumulate in the bone or chronic exposure to these elements or both. We found elevated concentrations of Ba and Zn in soil samples from the Sheep Tank Mines. Scat samples from the Sheep Tank Mines also had elevated Ba and Zn concentrations, although they were not greater than soil concentrations. Scat had greater Mg and Sr concentrations from the Sheep Tank Mines than soil concentrations. High concentrations of Ba and Zn in soil and scat probably describe an equilibrium condition for these elements, where bighorn bones with chronic exposures to the soil approach a ceiling concentration in the bone (since bone preferentially accumulates these two elements). The result is elevated concentrations in scat, if Ba and Zn concentrations in bone are at steady state. Individual comparisons In 2000, we did not find high tissue burdens for metals overall, with the exception of Pb. We collected rams with higher Pb blood values in the northern mining districts of KNWR, which could possibly indicate recent exposures to Pb. However, chronic exposures to Pb do not appear to be a problem, as bone tissue did not have high Pb concentrations. Some individual bighorn had high concentrations of trace elements, depending on the tissue and the individual. For example, the liver from Individual A (Appendix 1) had high Cu and Zn concentrations compared to the other bighorn rams. Although Individual A had high Cu and Zn concentrations in its liver (623 and 307 ppm dry weight, respectively), the therapeutic range for Cu and Zn in domestic sheep livers (Cu: 100-400 ppm dry weight; Zn: 120-300 ppm dry weight) is only slightly lower than Individual A’s concentrations. We detected 1.6 ppm Se dry weight, which is slightly higher than the mean liver weight for KNWR bighorn, 1.07 ppm dry weight. Still other bighorn livers had similar levels of Zn. Comparing the therapeutic range for Zn in domestic sheep liver, eleven rams on the KNWR actually have low concentrations of Zn (a Zn deficiency). The same is true for Cu concentrations in liver tissue from seven bighorn. Individual bighorn L (Appendix 2) had abnormally high levels of Al, As, B, Fe, Mg, Pb, and Zn in blood and Cr in liver. It is interesting to note that we detected so many different metals at high concentrations in the blood. This ram may have visited an abandoned mine prior to its harvest in the Kofa Mountains. Spatial analysis and Risk While Tunnel Mine, High Henry, and Castle Dome Adit had one or two elevated soil metal concentrations, the Sheep Tank Adits had four to six elevated soil metal concentrations that exceeded either Arizona background levels (Boerngen and Shacklette 1981; Earth Technology 1991) or Arizona non-residential soil remediation levels (ADEQ 1997). All Sheep Tank Adit #3 data exceeded these criteria. It may not be appropriate to calculate an HI with all of these metals since several of these elements interfere with the toxicity others. However, the HI does represent a worst-case scenario level of concern. Therefore, we must consider these indices with the concentrations in other matrices to evaluate what kind of exposure bighorn receive with such
18high mineral concentrations in the soil. Matrix comparisons We noticed the trends that bone had Mg and Sr concentrations greater than blood and liver concentrations (Table 1; Figure 2). When all samples were combined, scat Mg and Sr concentrations had the highest concentrations overall. We described the same phenomenon above for the Sheep Tank Mines. Although tissue and scat data were probably not from the same individual bighorn, we thought scat comparisons to other matrices could reveal general trends. The liver had the greatest concentrations of Cu, Mo, and Se compared to all other matrices (Figure 2). Metallothioneins play a large role in the storage and elimination of trace metals. Metallothioneins scavenge metals in the blood and store them in the liver, such as Cu and Mo that were detected in KNWR bighorn. The liver had statistically greater Mg concentrations than in blood, but elevated concentrations in liver when compared to bone could indicate more short-term or even sub-chronic exposure, rather than long-term exposure (Table 1). We expected Se to be high in the liver since this is one of its target organs. Although we found low soil Se concentrations, the blood and liver had high concentrations (Figure 2). We detected slightly higher scat Se concentrations than in soil, although we did have a few outliers in the scat and soil data sets. Differences among the Se concentrations in soil/scat and liver/blood/bone appeared because Se biomagnifies through the food chain. Preferential accumulation of Se, despite its low concentration in most soils, suggests that Se bioaccumulation may occur wherever bighorn are exposed to high soil concentrations, plant material that accumulates Se, or mineral rich waters. There may be localized pockets of high mineral content that bighorn seek out to lick, and as a by-product, the bighorn are exposed to elevated Se. We did not detect any bone Pb accumulation as would be expected since the KNWR has a Pb mine on it. We detected soil Pb concentrations 114 to 857 times greater than in bone. Scat had the highest concentrations of B, Mg, and Sr compared to other matrices (Figure 2). Since bone Mg and Sr accumulated in bone more than blood or liver (Table 5), but was higher in scat, we hypothesize that the bone had achieved Mg and Sr equilibrium. This explains the high concentrations in scat: if the bone cannot sequester any more Mg or Sr, then the metals are eliminated into scat. Increased elimination in scat could be due to exposure from mines and/or possible contamination of the scat sample from mine soil adhesion. Increased elimination into scat is probable, because there may be no useful purpose for them, no target organ for those elements in bighorn, or the target organ was saturated. Most other metals had higher soil concentrations than scat and bone (Al, As, Ba, Be, Cd, Cr, Fe, Hg, Mn, Ni, Pb,V, Zn). Soil had high concentrations of many metals compared to blood, liver, bone, and scat concentrations. Therefore, it is possible that the HQs overestimated the risk to bighorn on the KNWR. For example, soil had extremely high Hg concentrations compared to Arizona background (Boerngen and Shacklette 1981, Earth Technology 1991), but blood, bone, liver, and scat had very low Hg concentrations. This indicates that Hg is not bioaccumulating into bighorn

19tissues. This also indicates that methyl-mercury (MeHg) is not present on site, since this is the form of Hg that biotransfers into biota. Most MeHg is formed under anaerobic conditions in aquatic environments (Eisler 1987); since these conditions are not present on site, it would explain why Hg is not high in tissue concentrations. Many other trace metals do not biomagnify, but the same trend was seen were soil had extremely high concentrations, but tissue did not. Evidence suggests that these metals (Al, As, Ba, Be, Cd, Cr, Fe, Hg, Mn, Pb, Ni, V, Zn) are not bioavailable to bighorn. Mining could also be affecting the wildlife waters at KNWR. Bagby et al. (1987) and Kepner and Hunter (1988) both noted that high metal concentrations in mine tailings and mineral deposits on KNWR could contribute to high sediment concentrations around the mineralized areas and could transport trace metals off-site. Bagby et al. (1987) noted that the southern Castle Domes contained mineral deposits of gold, lead, arsenic, thallium, zinc, and silver. Bagby et al. (1987) also found sediment As concentrations in exceedance of 19 ppm in many of the Castle Dome drainage basins. The Castle Domes and the Sheep Tank formation were the only sites where off-site transport of many trace elements occurred (Kepner and Hunter 1988). Adam’s Well, in the southern portion of the Castle Domes, formed when a prospector dug a mine shaft for access to a Cu formation and hit water. Since then, the KNWR turned it into a water development with a drinking trough for bighorn and deer. AGFD sampled the drinker at Adam’s Well in September 2002 and found an As concentration of 50 ppm (unpublished data, March 5, 2003, Steve Rosenstock, AGFD, Phoenix, AZ). This is 139-times greater than the Arizona Water Quality Standards for Aquatic and Wildlife-Warm (AZ WQS-warm) acute standard (0.360 ppm) and 263-times greater than the chronic standard (0.190 ppm). This is the only wildlife water directly developed out of a mine shaft and is probably an extreme example. However, other wildlife waters may have some transported tailings or sediment associated with them. Many of the drainage basins on KNWR are not perennial streams, but are washes that flow in response to storms or flow below the surface. In the Tunnel Springs area of the Kofa Mountains, Bagby et al. (1987) found elevated sediment Hg, antimony (Sb), and Zn concentrations. High Tank #8 is a wildlife water improvement, established for bighorn and other wildlife at KNWR. High Tank #8 is in the Kofa Mountains, near the Tunnel Springs mines. High Tank #8 also had elevated As concentrations in water (Rosenstock and Rabe 2002). At 0.1 ppm As, High Tank #8 was greater than EPA primary drinking water standards (0.05 ppm), but lower than AZ WQS-warm acute and chronic standards. Age comparisons While the graphs in Figure 3 might indicate that lambs had the greatest mean concentrations of seven different trace elements, the statistical comparisons and a comparison of median concentrations reveal that lambs did not have the greatest concentrations of trace elements. The graphs also show that lambs had the greatest variation. Therefore, conclusions cannot be made concerning high element concentrations in lambs. The general trend for these seven metals is that metal concentrations increase over time as bighorn age. This was not statistically validated in all age-classes due to problems with low sample size and high variance. Iron was the one
20exception. Our concentrations slowly decreased with age. Decreasing Fe concentrations over time may be an artifact of collecting more male samples than females, and collecting younger females than males. Since females had higher median Fe concentrations in blood samples than male, this trend may indicate that older female samples need to be collected to understand this trend fully. Bone had the greatest median Mg concentrations, although bone concentrations varied the most and could not be statistically analyzed. Greater Mg concentrations in older bighorn indicated that more Mg accumulated in bone over time. While age-class 8 had the greatest Pb median concentration, the general trend indicated that Pb accumulated over time. Lead also accumulated in bone more than other organs. This indicated that bighorn were chronically exposed to Pb in the environment throughout their lives; abandoned mines were probably the greatest source of this exposure. Since younger organisms are the most susceptible to Pb poisoning (Eisler 1988b), KNWR bighorn seem to be avoiding the ill effects of Pb in developing and/or young bighorn. Bighorn liver had the greatest median Zn concentrations and Zn appeared to be accumulating in bighorn organs over time as bighorn age increased (Figure 3). Zinc is stored by metallothioneins in the liver; increased Zn has been positively correlated with metallothionein concentrations (Eisler 1993).
Blood – intersex comparisons Significant differences in blood metal concentrations between sexes could be an artifact of bighorn social structure – males tend to roam by themselves or in polygamous bands. If males that are by themselves spend more time in abandoned mines, then they should have higher concentrations of metals and blood metal concentrations would reflect very recent exposures. Only Fe had a median metal concentration greater in females than males, although we could not statistically analyze the difference due to violation of the unequal variance assumption. We do not know why Fe would be higher in females than males and we could not find any literature addressing this issue. Copper plays a role in several essential enzyme pathways, including Cu-Zn superoxide dismutase, and is bound to protein complexes (Eisler 1998a). Metallothioneins help regulate Cu concentrations in the blood. Excess Cu is bound to metallothioneins and is eliminated in the by the gastrointestinal tract (Eisler 1998a). It is possible that males have higher nutritional requirements and, therefore, higher baseline Cu concentrations than females. Males had elevated Cu concentrations compared to females. It is possible that Zn concentrations in males are maintained at higher concentrations than females. Metals
Arsenic Arsenic is a relatively abundant element that is teratogenic, causing fetal death and malformations in mammals (Eisler 1988a). We were unable to find any As data on bighorn in the literature. Moribund white-tailed deer liver concentrations ranged from 24 – 102 ppm, wet weight1 (96 – 408 ppm, dry weight) (Mathews and Porter 1989). Background concentrations of As in cows ranged from 0.009-0.026 ppm wet weight in blood (0.036-0.104 ppm, dry weight) and 0.008-0.012 ppm wet weight in liver (0.032-0.048 ppm, dry weight). We did not detect As
1 Dry Weight = Wet Weight / (1-%Moisture); if % moisture was not reported, then the assumption was the sample was 75% moisture.

21in any KNWR bighorn livers (0.2-0.58 ppm detection limit) but we did find it up to 2.3 ppm in the blood (Appendices 1 and 2). Most blood samples, however, were in the ND-0.8 ppm range. Therefore, bighorn from KNWR had As concentrations within normal range. Cadmium Cadmium accumulates in the liver and kidney of vertebrates and tends to increase in concentration in older individuals (Eisler 1985a). We did not find any reports of Cd in bighorn in the literature. Kofa NWR bighorn samples had low Cd concentrations. Background Cd concentrations ranged from 1.5 ppm wet weight (6 ppm, dry weight) in elk liver to 0.0-0.7 ppm wet weight (0-2.8 ppm dry weight) in white-tailed deer livers (Jenkins 1980). Woolf et al. (1982) reported background Cd concentrations in white-tailed deer liver between 0.02-6.5 ppm dry weight. Kofa NWR bighorn livers ranged from 0.05-0.47 ppm dry weight (Table 2), within the range of background concentrations reported in the literature. Chromium We found data on Cr in bighorn hair in the literature, but not in other bighorn tissues (Jenkins 1980). Eisler (1986) reported that Cr is not bioaccumulated in the food web and is usually highest in the lowest trophic levels; species sensitivity to Cr varies greatly. While the significance of Cr in tissues is unclear, tissue concentrations greater than 4.0 ppm dry weight are evidence of contamination (Eisler 1986). Only three bighorn liver samples from KNWR exceeded this criterion (Appendices 1 and 2). Individual L had a liver concentration of 5.4 ppm (Appendix 2), and had elevated concentrations of many metals in his blood, liver, and bone. In another case, hunters killed a 12-year old ram 2.4 miles (3.86 km) from the nearest cluster of mines (individual G; 19.40 ppm liver; Appendix 1), but not far from both Charco 3 and High Tank 2 water developments. The last ram, collected in the Arch Tank area, had 4.5 ppm liver Cr. Woolf et al. (1982) reported a background range of 0.32-9.0 ppm dry weight Cr in white-tailed deer livers in Illinois. Only one of our samples, the 12-year old ram’s liver, exceeded this background concentration (19.4 ppm). A dead calf found near a drilling rig had 14.8 ppm wet weight (59.2 ppm dry weight) Cr in the liver. However, this calf had ingested concentrated sodium chromate used in constructing the well (Eisler 1986; Reagor and MacDonald 1980). Eisler (1986) described the Cr half-life in the body as high, but that its likelihood for assimilation was low, which reduced the likelihood for toxicity. Langard and Norseth (1979) reported that mammals primarily excreted Cr in the urine; we did not collect any urine, but scat had Cr concentrations second only to the soil Cr concentrations (Figure 2). While a few individuals at KNWR had elevated Cr concentrations, most individuals did not exceed the 4 ppm threshold and 9.0 ppm background concentration. From our data, there is no evidence that Cr toxicity is a occurring in bighorn at KNWR. Copper Copper poisoning, liver damage, impaired reproduction, reduced resistance to disease, and jaundice have been reported in domestic sheep (Gopinath and Howell 1975; Bires et al. 1993). Eisler (1998a) commented that domestic sheep are the most sensitive farm animal to Cu exposures. Copper-poisoned versus reference domestic sheep had blood concentrations of 1.74-9.1 vs. 0.6-1.6 ppm wet weight (6.96-36.4 and 2.4-6.4 ppm dry weight) (MacPherson and

22Hemingway 1969). Poisoned domestic sheep had average liver concentrations from 432 ppm wet weight (1,728 ppm dry weight). Around 1,000 mg/kg dry weight in liver, domestic sheep appeared normal, but liver enzymes indicating liver damage had increased. The domestic sheep eventually died as a result of increased blood Cu concentrations as the liver released Cu. This resulted in an acute hemolytic crisis, massive hemolysis and kidney damage, and finally, uremia and death (Bremner 1979; Doherty et al. 1969; Eisler 1998a; Thompson and Todd 1974; Todd 1969). White-tailed deer liver concentrations in Illinois ranged from 0-456 ppm (Woolf et al. 1982). Blood and liver concentrations from bighorn on the KNWR ranged from 1.9-10.2 ppm and 9.1-632 ppm dry weight, respectively (Table 2). These concentrations are slightly elevated over the background and reference concentrations, but not nearly as high as the copper-poisoned domestic sheep. The average bighorn liver had 173.1 ppm Cu (median = 122 ppm), well below the concentration of a copper-poisoned domestic sheep. The copper-poisoned domestic sheep had been slowly exposed to Cu through chronic exposures; during this phase, the liver stored Cu, with low Cu concentrations in the blood. Copper is an essential element, and it can be absorbed in greater amounts than is metabolically necessary (Sugawara et al. 1994). We do not believe that this is occurring at KNWR. Copper toxicity does not appear to be a concern at KNWR. Iron Whittaker et al. (2000) found average Fe serum concentrations at 0.21 ppm wet weight (0.84 ppm dry weight). Standish et al. (1969) report that cattle fed no supplemental Fe had 185 ppm dry weight Fe in liver compared to 605 ppm Fe in steers receiving 1,600 ppm dietary Fe. Kofa NWR bighorn had mean Fe blood and liver concentrations of 1,919 and 305.8 ppm dry weight, respectively (Table 2). The comparison of plasma concentrations in KNWR bighorn to serum concentrations in bighorn sheep (Whittaker et al. 2000) may not be appropriate because trace metals in whole blood change more slowly than those in plasma (Kincaid 1999). It is not known if there is a difference in Fe concentrations between serum and whole blood. If comparisons of plasma and serum are appropriate, then KNWR bighorn had a 2,200-times greater blood level than Oregon bighorn. KNWR bighorn liver concentrations fell in the middle of steer concentrations without and with Fe nutritional supplements. Livestock with Fe toxicosis experience reduced plasma Cu (Standish et al. 1969), elevated serum Fe levels (NAS 1980). Clinical signs include anorexia, oliguria, diarrhea, hypothermia, diphasic shock, metabolic acidosis, and death (Boyd and Shanas 1963, NAS 1980). Many minerals are interrelated, working through complex pathways. MacGregor and Duren (2002) noted that Fe interacts with Zn, P, Mn, and Cu. Phosphorus was not analyzed in this study, but we did not find Zn, Mn, or Cu deficiencies as a result of the extreme blood Fe concentrations. As a whole, we recommend monitoring blood Fe regularly to see what levels are normal for the population and if these levels affect bighorn. Lead Lead does not biomagnify into the food web and embryos/fetuses and young animals are the most sensitive life-stages to Pb (Eisler 1988b). Lead is a central nervous system toxin; bone and blood Pb levels can be monitored for signs of Pb toxicity (Eisler 1988b). Domestic sheep livers had background concentrations of Pb less than 1.5 ppm wet weight (6 ppm dry weight) (Bunzl and Kracke 1984). Lambs exposed to 350 ug/L Pb in maternal blood during gestation had
23impaired visual discrimination and learning behavior (EPA 1980). White-tailed deer livers had background concentrations from 0.0-13 ppm dry weight (Woolf et al. 1982). Kofa NWR bighorn had low levels of Pb in the liver (ND-2.36 ppm dry weight) and low blood Pb concentrations (0.03-12 ppm dry weight) (Table 2). Bighorn at KNWR do not have Pb poisoning based on these benchmarks. Magnesium and Manganese A study on white-tailed deer in Illinois measured Mg and Mn background in livers. Liver concentrations ranged from 23-422 ppm dry weight Mg and 1.9-37 ppm dry weight Mn in white-tailed deer. Deer had mean concentrations of 2.5 ppm and 8.4 ppm dry weight, respectively (Woolf et al. 1982). Kofa NWR bighorn livers had 623.3 ppm mean dry weight Mg (518-926 ppm) and 12.08 ppm mean dry weight Mn (8.8-17 ppm) (Table 2). California bighorn sheep in Oregon had blood Mg concentrations averaged 3.15 ppm over 12 years (Whittaker et al. 2000). Kofa NWR bighorn blood Mg concentrations which averaged 315.9 ppm. While no benchmarks exist for animals exposed to Mg or Mn, there is data suggesting that the biliary route eliminates Mn and that levels in the blood are maintained at steady state through homeostatic pathways (ATSDR 2000; Lauwerys et al. 1992). While Mg concentrations were almost 250-times greater in bighorn livers and 100-times greater in bighorn blood than in white-tailed deer, Mn concentrations fell within the background range measured in Illinois. Bighorn likely compensate by eliminating more Mg into scat: scat had elevated Mg concentrations over soil concentrations; Mg was one of only three elements where scat had higher concentrations than soil. Magnesium is an essential mineral and is known to interact with Mn, Ca, and P (MacGregor and Duren 2002). No interaction was observed between KNWR bighorn Mg and Mn concentrations. Researchers have found that supplements high in Ca, P, or potassium (K) limit Mg absorption in domestic sheep (Chico et al. 1973; Pless et al. 1973; Newton et al. 1972). High blood serum Mg levels generally reflected high dietary exposures (NAS 1980). Effects of excessive Mg in diet include diarrhea, bone degeneration, lack of reflexes, anesthesia, and cardiorespiratory depression (NAS 1980). Bighorn Mg concentrations need to be monitored in concert with other metals to see how it affects metabolism, development, reproduction, and survival. Manganese appeared to be within the same concentration range as deer livers from Illinois. Therefore, we assumed that KNWR bighorn are not at risk for Mn toxicity. Mercury Mercury bioaccumulates in the food web and is a central nervous system poison. Domestic sheep grazing on a mercury-contaminated field for 23 months had a maximum liver concentration of 2.4 ppm wet weight (9.6 ppm dry weight) (Edwards and Pumphery 1982). Mammals susceptible to Hg contamination had adverse effects of Hg when tissue concentrations exceeded 1.1 ppm (Eisler 1987). A recommended blood concentration for mammals is less than 1.2 ppm wet weight (4.8 ppm dry weight) (Suzuki 1979). Eisler (1987) reported that larger mammals (e.g., mule deer) were more resistant to Hg than smaller, carnivorous mammals (e.g. mink, cats, dogs, river otters, etc). We did not detect Hg in blood and bone at KNWR. Mercury concentrations in KNWR livers ranged from 0.01-0.2 ppm dry weight (Table 2). These Hg liver concentrations fall within the low range of Hg in tissues (Wren 1986). Kofa NWR bighorn tissue concentrations had 5.5 to 48-times less Hg than concentrations causing adverse effects.

24Bighorn at KNWR are not at risk from Hg poisoning in the abandoned mines. Molybdenum Molybdenum liver concentrations in domestic sheep ranged from 2-4 ppm dry weight in both normal lambs and adults and 12-30 ppm in lambs and adults fed a molybdenum-rich diet (Underwood 1979; Eisler 1989). Kienholz (1977) reported 0.1-4 ppm Mo in nine wildlife species’ livers from areas high in Mo. Bighorn liver concentrations ranged from ND to 5.06 ppm. Bighorn livers had a mean concentration of 3.381 ppm (Table 2). Molybdenum poisoning of ruminants has been reported world-wide, but little data are available in wildlife; cattle (Bos spp.) had at least a 10-times greater sensitivity to Mo than other tested species and mule deer had at least an order of magnitude tolerance to dietary Mo than domestic ruminants (Eisler 1989). While bighorn on the KNWR have normal to slightly elevated liver concentrations of Mo, we do not know how sensitive domestic sheep and/or bighorn are to Mo. Nickel Background liver concentrations in domestic sheep had about 0.01 ppm wet weight Ni (0.04 ppm dry weight). White-tailed deer liver concentrations ranged from 0.0-97 ppm (x-bar=3.6 ppm) (Woolf et al. 1982). KNWR bighorn liver concentrations averaged 0.297±0.203 ppm dry weight (Appendices 1 and 2). Compared to the background liver concentrations, it appears that KNWR livers fall within the normal Ni concentration range. Eisler (1998b) reported that biological half-life in mammals is low and that Ni does not bioaccumulate. Nickel that is ingested remains biologically unavailable and is eliminated into the scat (Hausinger 1993; Sevin 1980). Nickel is not a proximal threat to bighorn at environmental concentrations encountered on the KNWR. Selenium White-tailed deer had a mean muscle concentration of 0.16 ppm dry weight (0.05-0.49) (Ullrey et al. 1981). We could not find any Se data for domestic sheep or other ruminants. Bighorn Se concentrations at KNWR ranged from 0.24-2.3 ppm in liver to ND-0.72 in bone (Table 2). Bighorn livers had slightly elevated concentrations over white-tailed deer, but Se in KNWR bighorn livers did not increase with time (Figure 3). Selenium is probably enriched in the mountains on the KNWR, as the entire west has seleniferous soils arising from Cretaceous shales (Rosenfeld and Beath 1964). Fatalities occurred after domestic sheep ate 3.2 to 12.8 mg/kg Se in the diet (Eisler 1985b). Desert bighorn males average 73 kg (Hansen 1980). Therefore, individual bighorn would have to eat 934.4 mg of Se to experience acute selenosis. Effects associated with chronic selenosis include either the ‘blind staggers’: anorexia, emaciation, and sudden collapse, followed by death or ‘alkali disease’: where keratinaceous materials are deformed or sloughed off, conception is diminished, and the heart, kidney, and liver have degenerated (Eisler 1985b). We do not expect any selenosis given the tissue concentrations in the bighorn on the KNWR. Strontium Strontium is biologically active; it utilizes the same pathways that Ca uses for uptake and transport since both elements are divalent cations (ATSDR 2001). Some systems can differentiate between Ca and Sr, since Sr is a bigger cation; however, young mammals are at risk
25for bone accumulation of Sr, since this system cannot differentiate between the two elements while bone deposition is occurring (ATSDR 2001). Calcium, phosphorus, and vitamin D will ameliorate exposure to low levels of Sr (ATSDR 2001). Rats orally exposed to Sr had a no observable adverse effect level (NOAEL) around 100 mg/kg/day for musculoskeletal effects (ATSDR 2001). Schroeder et al. (1972) found that bones and connective tissues in humans retain 99% of absorbed Sr. Bighorn scat on KNWR had the highest Sr concentrations with the second highest in bone; soil had the third highest concentrations, with nominal concentrations detected in blood and liver (Figure 2). This suggests that bone Sr concentrations were at equilibrium and that bighorn eliminate new exposures into the feces. Young bighorn did not accumulate a significantly greater amount of Sr than adults, although older age-classes did have slightly higher concentrations than fawns (Figure 3). There are no effects data in the literature to suggest that concentrations in KNWR bighorn are toxic. Zinc We did not find any background Zn concentrations in the literature for bighorn. Mule deer livers averaged 113 ppm wet weight (452 ppm dry weight) (Munshower and Neuman 1979). Average white-tailed deer liver concentrations ranged from 70 ppm dry weight in Illinois to 132-167 ppm dry weight in Pennsylvania depending on the distance from a Zn smelter (Sileo and Beyer 1985). White-tailed deer had background liver Zn concentrations from 21-252 ppm dry weight (Woolf et al. 1982). Moribund domestic sheep had elevated Zn liver concentrations: 463-650 mg/kg dry weight (Schlosberg 1976; Allen et al. 1983). Puls (1994) data on domestic sheep suggests the safe range for bighorn is 120-300 ppm dry weight. Kofa NWR bighorn livers averaged 132 ppm dry weight (Table 2). Scat concentrations from the deer in Pennsylvania ranged from 185-577 ppm dry weight (Sileo and Beyer 1985). Bighorn scat concentrations ranged from 28-167 ppm dry weight (Table 4). Given the white-tailed deer data, bighorn liver concentrations fell within the normal range. Kofa NWR livers definitely had lower concentrations than the moribund bighorn liver. Scat at KNWR had far lower concentrations than those reported by Sileo and Beyer (1985). Zinc is commonly found in mineralized regions and is necessary for certain enzymatic processes (Eisler 1993), but KNWR bighorn do not have Zn concentrations that would indicate exposure to toxic levels of Zn. Eisler (1993) stated that Zn is relatively non-toxic in mammals due to its wide margin of safety. CONCLUSION Abandoned mine soil values at KNWR suggest that bighorn can be exposed to high metal concentrations in mine soil and dust (Table 3). Most bighorn tissue had concentrations similar to background in surrogate species or had concentrations below threshold levels of concern. Kofa NWR bighorn Fe and Mg concentrations may warrant further study since bighorn had unusually high concentrations of both in blood and liver. Although bats from KNWR had higher Ba and Mn concentrations than Imperial NWR, we did not find high concentrations of these metals in bighorn. We did not have enough data for some metals to make suitable comparisons with bighorn. Sheep Tank Mine had the greatest soil contamination and the highest hazard indices. Also, KNWR had high As HQs at all sites and a high Mn HQ at Sheep Tank Mine Adit #3.

26Despite those HQs, bighorn tissues had either normal or just slightly elevated As and Mn concentrations. MANAGEMENT ACTIONS/RECOMMENDATIONS Bighorn using abandoned mines can be exposed to extremely high levels of As, Ba, Mn, Pb, and Zn. Fortunately, bighorn are not bioaccumulating high concentrations of most trace elements and metals. Institutional controls, such as inset fencing, for the four adits in the Sheep Tank Mines are recommended. These will restrict bighorn use to the entrance of the distal portions of the mine while allowing bats and other wildlife to continue to use the mines. This will allow bighorn to use mine entrances for shade and cover, while reducing the potential for bighorn to stir up fine airborne particles, deeper within the mines, which could exacerbate respiratory exposures. Fencing would also prevent the need to continue monitoring As and Mo at the Sheep Tank Mine. We also recommend further studies on the effects of high levels of blood Fe and blood and liver Mg which should include Ca, P, and K monitoring. MacGregor and Duren (2002) suggest a complete nutritional profile including fiber, crude fat, and crude protein, as well as analysis of at least 12 different minerals to be able to properly assess the health of a herd. We could work cooperatively with AGFD during the hunting season to collect samples. Further studies could also examine the relationship between trace elements and wildlife water catchments due to off-site transport of tailings or metals-enriched sediments in many KNWR washes.
ACKNOWLEDGEMENTS We sincerely thank Jena Moon, Kofa NWR intern, for collecting the soil samples, as well as bone and/or fecal samples when she inspected the abandoned mines. We are indebted to Bob Henry (AGFD), Brian Wakeling (AGFD), Susanna Henry (KNWR), and Ray Varney (KNWR) for logistical support and project review; and to Jeff Servoss for assistance in preparing hunter packets. We would also like to thank Pete Ramirez and Paul Krausman for reviewing the report. Thanks to the following hunters for submitting samples: Hayes Dye, Scott Bonine, Bev Pahlisch, Jeff Stephan, Jeff Reilly, Fielden Weddle, Constance Hammond, Broc Brimhall, Randy Herrera, James Auza, Robert Barkley, Ludo Wurfbain, Mark Saba, Bruce Gwynn, Jack Ruffino, Gerald Anderson, Dennis Dugger, Joseph Susi, and James Lee. We are also grateful to the AGFD bighorn translocation team for collecting samples. REFERENCES
Allen, J. G., H. G. Master, R. L. Peet, K. R. Mullins, R. D. Lewis, S. Z. Skirrow, and J. Fry. 1983. Zinc toxicity in ruminants. Journal of Comparative Pathology 93:363-377.
27Allen, R.W. 1980. Natural Mortality and Debility. Pages 172-185. In The Desert Bighorn: Its
Life History, Ecology and Management. G. Monson and L. Sumner (eds.). University of Arizona Press, Tucson, Arizona. 370 pp.
(ADEQ) Arizona Department of Environmental Quality. 1997. Soil Remediation Standards.
Arizona Administrative Code R18-7, Appendix A. Pp 8-17. (ATSDR) Agency for Toxic Substances and Disease Registry. 2000. Toxicological Profile for
Manganese. Atlanta, GA: U.S. Department of Health and Human Services, Public Health Service.
_______. 2001. Toxicological profile for Strontium. Draft for public comment. Atlanta, GA: U.S. Department of Health and Human Services, Public Health Service.
Bagby, W. C., G.B. Haxel, D.B. Smith, R.D. Koch, M.J. Grubensky, D.R. Sherrod, and L.G.
Pickthorn. 1987. Mineral resource assessment of the Kofa National Wildlife Refuge, Arizona. USGS Open-File Report 87-609. 45 pp.
Bench, G., T.M. Carlsen, P.G. Grant, J.S. Jr. Wollett, R.E. Martinelli, J.L. Lewis, and K.K.
Divine. 2001. Olfactory bulb uptake and determination of biotransfer factors in the California ground squirrel (Spermophilus beecheyi) exposed to manganese and cadmium in environmental habitats. Environmental Science and Technology 35(2):270-277.
Beyer, W.N., E.E. Connor, and S. Gerould. 1994. Estimates of soil ingestion by wildlife.
Journal of Wildlife Management 58:375-382. Bires, J., J. Dianovsky, P. Bartko, and Z. Juhasova. 1993. Changes in the selected biochemical
indicators and on a genetic apparatus of sheep in the course of application of copper from industrial emission source. Ekologia (Bratislava) 12:153-162.
Boerngen, J.G. and H.T. Shacklette. 1981. Chemical analysis of soils and other surficial
materials of the conterminous United States. U.S. Geological Survey, Open-File Report 81-197, 18 pp.
Boyd E.M. and S.N. Shanas. 1963. The acute oral toxicity of reduced iron. Canadian Medical
Association Journal 89:171. Bremner, I. 1979. Copper toxicity studies using domestic and laboratory animals. Pages 285-306
in J. O. Nriagu, editor. Copper in the environment. Part 2: health effects. John Wiley, New York.
Browning, B.M. and G. Monson. 1980. Food. Pages. 80-99. In The Desert Bighorn: Its Life
History, Ecology and Management. G. Monson and L. Sumner (eds.). University of
28Arizona Press, Tucson, Arizona. 370 pp.
Bunzl, K., and W. Kracke. 1984. Distribution of 210Pb, 210Po, stable lead and fallout 137Cs in
soil, plants and moorland sheep of a heath. Science of the Total Environment 39:143-159.
Chico, C.F., C.B. Ammerman, J.P. Feaster, and B.G. Dunavant. 1973. Nutritional relationships
of dietary calcium, phosphorus and magnesium in sheep. Journal of Animal Science 36:986.
Conover, W.J., Johnson, M.E., and Johnson, M.M. 1981. Technometrics 23:351-361. Dahlquist, R.L. and J.W. Knoll. 1978. Inductively coupled plasma-atomic emission
spectrometry: Analysis of biological materials and soils for major trace- and ultra- trace elements. Applied Spectroscopy 32:1-29.
Dierenfeld, E.S. and D.A. Jessup. 1990. Variation in serum a-tocopherol, retinal, cholesterol,
and selenium of free-ranging Mule deer (Odocoileus hemionus). Journal of Zoology and Wildlife Medicine 4:432.
Doherty, P.C., R.M. Barlow, and K.W. Angus. 1969. Spongy changes in the brains of sheep
poisoned by excess dietary copper. Research in Veterinary Science 10:303-304. Earth Technology. 1991. Evaluation of background metal concentrations in Arizona soils.
Prepared for Arizona Dept of Environmental Quality. 60 pp. Edwards, P.R., and N.W.J. Pumphery. 1982. Ingestion and retention of mercury by sheep
grazing near a chlor-alkali plant. J. Sci. Food Agric. 33:237-243. Eisler, R. 1985a. Cadmium hazards to fish, wildlife, and invertebrates: a synoptic review. U.S.
Fish and Wildlife Service Biological Report 85 (1.2), Contaminant Hazard Reviews Report No. 2. 46 pp.
_______. 1985b. Selenium hazards to fish, wildlife and invertebrates: a synoptic review. U.S.
Fish and Wildlife Service Biological Report 85 (1.5). 57 pp. _______. 1986. Chromium hazards to fish, wildlife, and invertebrates: a synoptic review. U.S.
Fish and Wildlife Service Biological Report 85 (1.6). 60 pp. _______. 1987. Mercury hazards to fish, wildlife, and invertebrates: a synoptic review. U.S. Fish
Wildl. Serv. Biol. Rept. 85 (1.10), Contaminant Hazard Reviews Report 10. 90 pp. _______. 1988a. Arsenic hazards to fish, wildlife, and invertebrates: a synoptic review. U.S. Fish
Wildl. Serv. Biol. Rept. 85 (1.12), Contaminant Hazard Reviews Report 12. 92 pp.

29 _______. 1988b. Lead hazards to fish, wildlife, and invertebrates: a synoptic review. U.S. Fish
Wildl. Serv. Biol. Rept. 85 (1.14), Contaminant Hazard Reviews Report 14. 134 pp. _______. 1989. Molybdenum hazards to fish, wildlife, and invertebrates: a synoptic review.
U.S. Fish Wildl. Serv. Biol. Rep. 85 (1.19). 61 pp. _______. 1993. Zinc hazards to fish, wildlife, and invertebrates: a synoptic review. U.S. Fish
Wildl. Serv. Biol. Rept. 10, Contaminant Hazard Reviews Report 26. 106 pp. _______. 1998a. Copper hazards to fish, wildlife, and invertebrates: a synoptic review. U.S.
Geological Survey, Biological Resources Division, Biological Science Report USGS/BRD/BSR--1998-0002.
_______. 1998b. Nickel hazards to fish, wildlife, and invertebrates: a synoptic review. U.S.
Geological Survey, Biological Resources Division, Biological Science Report USGS/BRD/BSR--1998-0001.
(EPA) Environmental Protection Agency. 1980. Ambient water quality criteria for lead. U.S.
Environ. Protection Agency Rep. 440/5-80-057. Avail. from Natl. Tech. Info. Serv., 5285 Port Royal Road, Springfield, Virginia 22161. 151 pp.
_____. 1984. Test Methods for Evaluating Solid Waste, EPA Publication No. SW-846, 2nd Ed.,
U.S. EPA: Washington, D.C. _____. 1987. Test Methods for Evaluating Solid Waste, EPA Publication No. SW-846, 3rd Ed.,
U.S. EPA: Washington, D.C. (including revisions). Fox, L.M., P.R. Krausman, M.L. Morrison, and T.H. Noon. 2000. Mineral content of Sonoran
pronghorn forage. California Fish and Game 86(3):159-174. (FWS) Fish and Wildlife Service. 1984. Field operational manual for the resource contaminant
assessment. U.S. Fish Wildl. Serv., Washington, D.C. Gopinath, C., and J. M. Howell. 1975. Experimental chronic copper toxicity in sheep. Changes
that follow the cessation of dosing at the onset of haemolysis. Research in Veterinary Science 19:35-43.
Graham, H. 1971. The impact of modern man. Pages15.1-15.35. In The Desert Bighorn: Its Life
History, Ecology and Management. L. Sumner and G. Monson (eds.). Desert Bighorn Council, Tucson, Arizona.
Hansen, C.G. 1980. Physical characteristics. Pages 52-63. In The Desert Bighorn: Its Life
History, Ecology and Management. G. Monson and L. Sumner (eds.). University of

30Arizona Press, Tucson, Arizona. 370 pp.
Hausinger, R. P. 1993. Biochemistry of nickel. Plenum Press, New York. 280 pp.
Jenkins, D. W. 1980. Biological monitoring of toxic trace metals. Volume 2: Toxic trace metals
in plants and animals of the world. Part II. U.S. Environmental Protection Agency Report 600/3-80-091. p. 504-982.
Kepner, W.G. and W.C. Hunter. 1988. Kofa National Wildlife Refuge Contaminant Study.
U.S. Fish and Wildlife Service. Phoenix, Arizona. 12 pages. Kienholz, E. W. 1977. Effects of environmental molybdenum levels upon wildlife. Pages 731-
737 In Molybdenum in the environment. Vol. 2. The geochemistry, cycling, and industrial uses of molybdenum. W. R. Chappell and K. K. Peterson (eds.). Marcel Dekker, New York.
Kincaid, R.L. 1999. Assessment of trace mineral status of ruminants: a review. Proceedings of
the American Society of Animal Science 1999:3-10. King, K.A., J. Leleux, and B.M. Mulhern. 1984. Molybdenum and copper levels in white-tailed
deer near uranium mines in Texas. Journal of Wildlife Management 48:267-270.
KNWR. 2003. Annual Narrative report. Pp. 59. (unpublished internal document). Langard, S. and T. Norseth. 1979. Chromium. Pages 383-397 In Handbook on the toxicology
of metals. L. Friberg, G.F. Nordberg, and V.B. Vouk (eds.). Elsevier/North Holland Biomedical Press.
Lauwerys, R.R., A. Bernard, H. Roels et al. 1992. Health risk assessment of long term exposure
to chemicals: Application to cadmium and manganese. Arch. Toxicol. Suppl. 15:97-102. Levene, H. 1960. In Contributions to Probability and Statistics: Essays in Honor of Harold
Hotelling, I. Olkin et al., eds. Stanford University Press, Stanford Calif., pages 278-292. Lewis, L.A., R.J. Poppenga, W.R. Davidson, J.R. Fischer, and K.A. Morgan. 2001. Lead
toxicosis and trace element levels in wild birds and mammals at a firearms training facility. Archives of Environmental Contamination and Toxicology 41:208-214.
Ma, W. 1996. Lead in mammals. Pages 281-296. In Environmental Contaminants in Wildlife:
Interpreting Tissue Concentrations. W.N. Beyer, G.H. Heinz, and A.W. Redmon-Norwood (eds.). Lewis Publishers, New York. 494 pp.
MacGregor, S. and E. Duren. 2002. Selenium toxicity in livestock. Pp 22-36.
31MacPherson, A., and R. G. Hemingway. 1969. The relative merit of various blood analyses and
liver function tests in giving an early diagnosis of chronic copper poisoning in sheep. British Veterinary Journal 125:213-221.
Mathews, N.E. and W.F. Porter. 1989. Acute arsenic toxication of a free-ranging white-tailed
deer in New York. J. Wildl. Disease 25(1):132-135. Millard, J.B., S.C. Lapham, and Paul Hahn. 1986. Radionuclide levels in sheep and cattle
grazing near uranium mining and milling at Church Rock, NM. New Mexico Environmental Improvement Division Report. EID/RAD 86-3. 32 pp.
Munshower, F.F. and D.R. Neuman. 1979. Metals in soft tissues of mule deer and antelope.
Bulletin of Environmental Contamination and Toxicology 22:827-832. Musante, C.L., M.R. Ellingwood, and D.E. Stilwell. 1993. Cadmium contamination of deer
livers in Connecticut. Bulletin of Environmental Contamination and Toxicology 51:838-843.
(NAS) National Academy of Sciences. 1980. In Mineral tolerance of domestic animals.
National Academy of Sciences, National Research Council, Communications on Animal Nutrition, Washington, D.C. Http://www.nap.edu/openbook/0309030226/html/253.html
Newton, G.L., J.P. Fontenot, R.E. Tucker, and C.E. Polan. 1972. Effects of high dietary
potassium intake on the metabolism of magnesium by sheep. Journal of Animal Science 35:440.
Pless, C.D., J.P. Fontenot, and K.E. Webb, Jr. 1973. Effect of dietary calcium and phosphorus
levels on magnesium utilization in sheep. Virginia Polytechnic Institute State University Research Division Report 153:104.
Puls, R. 1994. Mineral levels in animal health. 2nd Edition. Sherpa International, Clearbrook,
British Columbia, Canada. Reagor, J.C. and D. MacDonald. 1980. Chromate poisoning in cattle – a case report.
Southwest. Vetern. 33:10-11. Reggiardo, C. 2000. Letter to S. Rosenstock, Arizona Game and Fish Department, Reference
number 00-3922, Bighorn sheep necropsy. 2 pp. Rosenfeld, I. and O.A. Beath. 1964. Selenium: Geobotany, biochemistry, toxicity, and nutrition.
Academic Press, New York. 141 pages. Rosenstock, S.S. and M.J. Rabe. 2002. Wildlife water developments study: 2001 annual
progress report. Collection Agreement #Non-98-0715. Arizona Game and Fish
32Department. January 2002. 64 pages.
Schlosberg, A. 1976. Suspected poisoning of sheep associated with high tissue zinc levels.
Refuah Veterinarith 33:77-78.
Schroeder, H.A., I.H. Tipton, A.P. Nason. 1972. Trace metals in man: strontium and barium. Journal of Chronic Diseases 25:491-517.
Sevin, I. F. 1980. Nickel. Pages 263-291 In Metals in the environment. H. A. Waldron, (ed.).
Academic Press, London. Sileo, L., and W. N. Beyer. 1985. Heavy metals in white-tailed deer living near a zinc smelter
in Pennsylvania. Journal of Wildlife Diseases 21:289-296. Simmons, N.M. 1971. Adaptive behavior. Pages 7.1-7.33. In The Desert Bighorn: Its Life
History, Ecology and Management. L. Sumner and G. Monson (eds.). Desert Bighorn Council, Tucson, Arizona. 370 pp.
Simmons, N.M. 1980. Behavior. Pages 124-144. In The Desert Bighorn: Its Life History,
Ecology and Management. G. Monson and L. Sumner (eds.). University of Arizona Press, Tucson, Arizona.
Smith, N.S. and P. R. Krausman. 1988. Desert bighorn sheep: A guide to selected management
practices. A literature review and synthesis including appendixes on assessing condition, collecting blood, determining age, constructing water catchments, and evaluating bighorn range. U.S. Fish Wildl. Serv., Biol. Rep. 88(35). 27 pp.
Standish, J.F., C.B. Ammerman, C.F. Simpson, F.C. Neal, and A.Z. Palmer. 1969. Influence of
graded levels of dietary iron, as ferrous sulfate, on performance and tissue mineral component of steers. Journal of Animal Science 29:496.
Stansley, W., D.E. Roscoe, and R.E. Hazen. 1991. Cadmium contamination of deer livers in
New Jersey: Human health risk assessment. The Science of the Total Environment 107:71-82.
Sugawara, N., D. Li, M. Katakura, and C. Sugawara. 1994. Biliary excretion of copper in Fischer
rats treated with copper salt and in Long-Evans Cinnamon (LEC) rats with an inherently abnormal copper metabolism. Biological Trace Element Research 46:125-134.
Suzuki, T. 1979. Dose-effect and dose-response relationships of mercury and its derivatives.
Pages 399-431. In The biogeochemistry of mercury in the environment. J.O. Nriagu (ed.). Elsevier/North-Holland Biomedical Press, New York.
33Thompson, D. R. 1996. Mercury in birds and Terrestrial Mammals. Pages 341-356 In Environmental
Contaminants in Wildlife Interpreting Tissue Concentrations. W. N. Beyer, G. H. Heinz, and A. W. Redmon-Norwood (eds.). Lewis Publishers, Boca Raton, FL.
Thompson, R. H., and J. R. Todd. 1974. Muscle damage in chronic copper poisoning of sheep.
Research in Veterinary Science 16:97-99. Thorton, I. and P. Abrahams. 1983. Soil ingestion- a major pathway of heavy metals into
livestock grazing contaminated land. The Science of the Total Environment 28:287-294. Todd, J. R. 1969. Chronic copper toxicity of ruminants. Proceedings of the Nutrition Society
28:189-198. Turner, R.M. and D.E. Brown. 1994. Sonoran Desertscrub. Pages 180-221. In Biotic
communities: southwestern United States and northwestern Mexico. Brown, D.E. (ed.). University of Utah Press. Salt Lake City.
Ullrey, D. E., W. G. Youatt, and P. A. Whetter. 1981. Muscle selenium concentrations in
Michigan deer. J. Wildl. Manage. 45:534-536. Underwood, E. J. 1979. Interactions of trace elements. Pages 641-668. In Toxicity of heavy
metals in the environment. Part 2. F. W. Oehme (ed.). Marcel Dekker, New York. Whittaker, D.G., J.C. Lemos, and T.R. Clark. 2000. Blood chemistry and trace mineral
reference values for California bighorn sheep in Oregon. Pages 54-67. In Twelfth Biennial Symposium Northern Wild Sheep and Goat Council 12. Jean Carey (ed.)
Woolf, A., J.R. Smith, and L. Small. 1982. Metals in livers of white-tailed deer in Illinois. Bull.
Environm. Contam. Toxicol. 28:189-194. Wren, C.D. 1986. A review of metal accumulation and toxicity in wild mammals. I. Mercury.
Environ. Res. 40:210-244.

34
FIGURES, TABLES, AND APPENDICES

Figure 1. Locations of 1st hunt (2000), 2nd hunt (including transplanted bighorn sheep; 2001), mine locations, and soil, scat, and/or bone collection sites in Kofa National Wildlife Refuge (KNWR), Arizona. Transplanted bighorn sheep are not identified separately from hunter-harvested bighorn sheep in 2001.
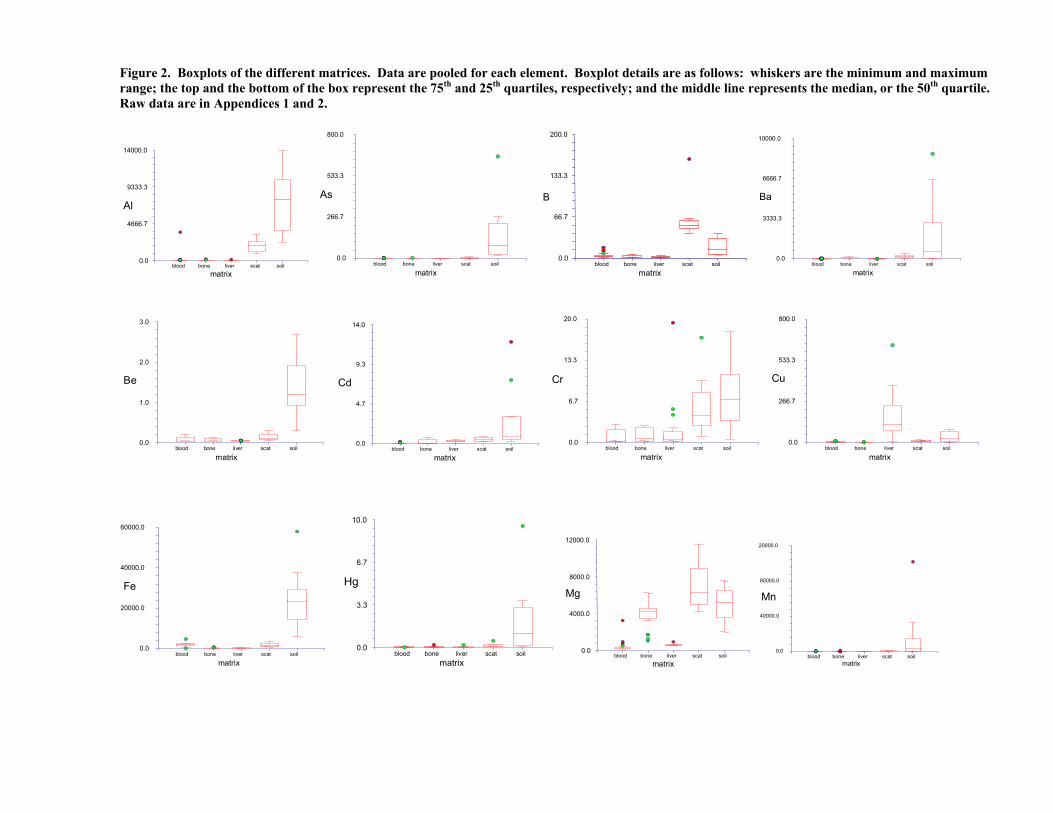
Figure 2. Boxplots of the different matrices. Data are pooled for each element. Boxplot details are as follows: whiskers are the minimum and maximum range; the top and the bottom of the box represent the 75th and 25th quartiles, respectively; and the middle line represents the median, or the 50th quartile. Raw data are in Appendices 1 and 2.
0.0
4666.7
9333.3
14000.0
blood bone liver scat soil matrix
Al
0.0
266.7
533.3
800.0
blood bone liver scat soil
matrix
As
0.0
66.7
133.3
200.0
blood bone liver scat soil
matrix
B
0.0
3333.3
6666.7
10000.0
blood bone liver scat soil
matrix
Ba
0.0
1.0
2.0
3.0
blood bone liver scat soil
matrix
Be
0.0
4.7
9.3
14.0
blood bone liver scat soil
matrix
Cd
0.0
6.7
13.3
20.0
blood bone liver scat soil
matrix
Cr
0.0
266.7
533.3
800.0
blood bone liver scat soil
matrix
Cu
0.0
20000.0
40000.0
60000.0
blood bone liver scat soil matrix
Fe
0.0
3.3
6.7
10.0
blood bone liver scat soil matrix
Hg
0.0
4000.0
8000.0
12000.0
blood bone liver scat soil
matrix
Mg
0.0
40000.0
80000.0
20000.0
blood bone liver scat soil matrix
Mn
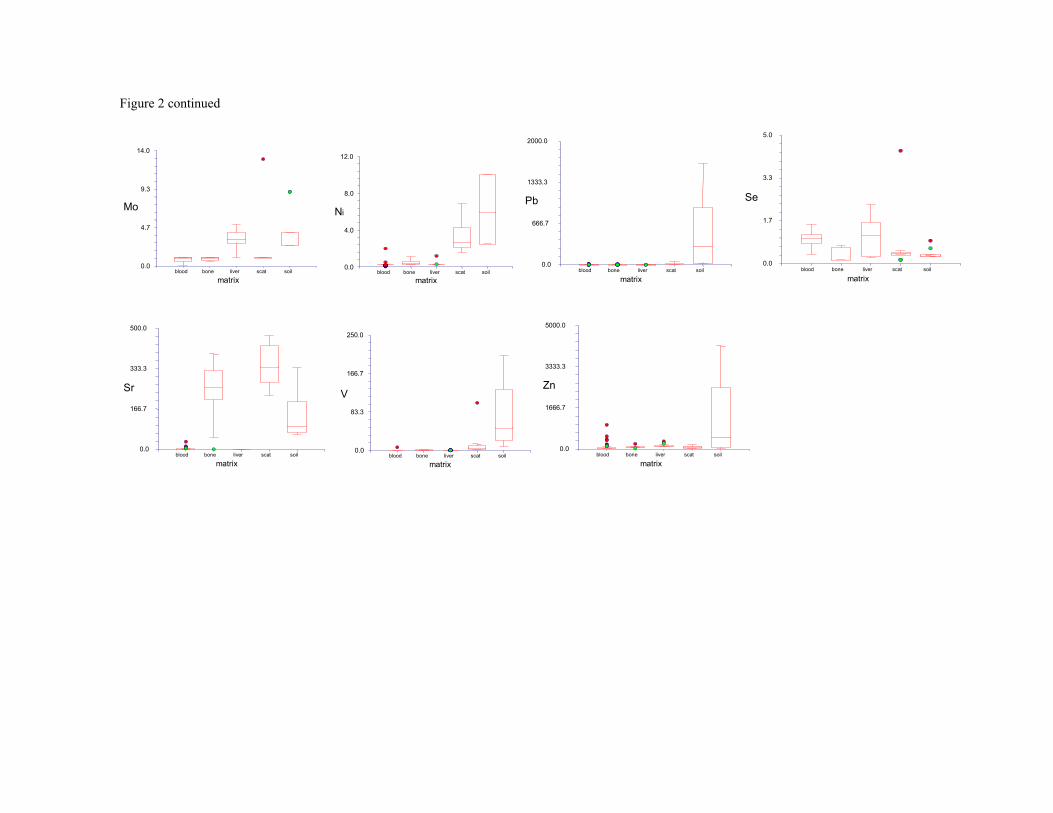
Figure 2 continued
0.0
4.7
9.3
14.0
blood bone liver scat soil matrix
Mo
0.0
4.0
8.0
12.0
blood bone liver scat soil
matrix
Ni
0.0
666.7
1333.3
2000.0
blood bone liver scat soil
matrix
Pb
0.0
1.7
3.3
5.0
blood bone liver scat soil
matrix
Se
0.0
166.7
333.3
500.0
blood bone liver scat soil matrix
Sr
0.0
83.3
166.7
250.0
blood bone liver scat soil
matrix
V
0.0
1666.7
3333.3
5000.0
blood bone liver scat soil
matrix
Zn

Figure 3. Error bar report showing mean and standard deviation for different age class and elements. AD= Adult. UN=unknown. If not stated, all other values than the ones shown are statistically similar to one another.
χ2= 41.57 P=0.00015 * * * * A B B B
-4000.0
-1000.0
2000.0
5000.0
8000.0
0.5 1 2 3 4 5 5.5 6 7 8 9 10 12 AD UN age
Al
χ2=13.35 P=0.500
-10.0
1.3
12.5
23.8
35.0
0.5 1 2 3 4 5 5.5 6 7 8 9 10 12 AD UNage
As
χ2=26.55 * P=0.022 B * *
B B
* A
0.0
2.5
5.0
7.5
10.0
0.5 1 2 3 4 5 5.5 6 7 8 9 10 12 AD UN
age
B
χ2=8.434 P=0.866
-200.0
-50.0
100.0
250.0
400.0
0.5 1 2 3 4 5 5.5 6 7 8 9 10 12 AD UN age
B
χ2=12.58 P=0.560
-0.2
0.1
0.3
0.6
0.8
0.5 1 2 3 4 5 5.5 6 7 8 9 10 12 AD UN age
Be
χ2=6.993 P=0.935
-0.2
0.0
0.2
0.4
0.6
0.5 1 2 3 4 5 5.5 6 7 8 9 10 12 AD UNage
Cd
Unable to do statistical comparisons.
-5.0
1.3
7.5
13.8
20.0
0.5 1 2 3 4 5 5.5 6 7 8 9 10 12 AD UNage
Cr
χ2=12.55 P=0.562
-100.0
0.0
100.0
200.0
300.0
0.5 1 2 3 4 5 5.5 6 7 8 9 10 12 AD UNage
Cu
χ2=48.91 P=0.00009
* * * A B B
-2000.0
1500.0
5000.0
8500.0
12000.0
0.5 1 2 3 4 5 5.5 6 7 8 9 10 12 AD UNage
Fe
χ2=16.16 P=0.304
-1.0
-0.1
0.8
1.6
2.5
0.5 1 2 3 4 5 5.5 6 7 8 9 10 12 AD UNage
Hg
χ2=44.60 P=0.00005 * * B B * A
-2000.0
-250.0
1500.0
3250.0
5000.0
0.5 1 2 3 4 5 5.5 6 7 8 9 10 12 AD UNage
Mg
χ2=40.27 P=0.0002
* * A B
-2000.0
-500.0
1000.0
2500.0
4000.0
0.5 1 2 3 4 5 5.5 6 7 8 9 10 12 AD UNage
Mn
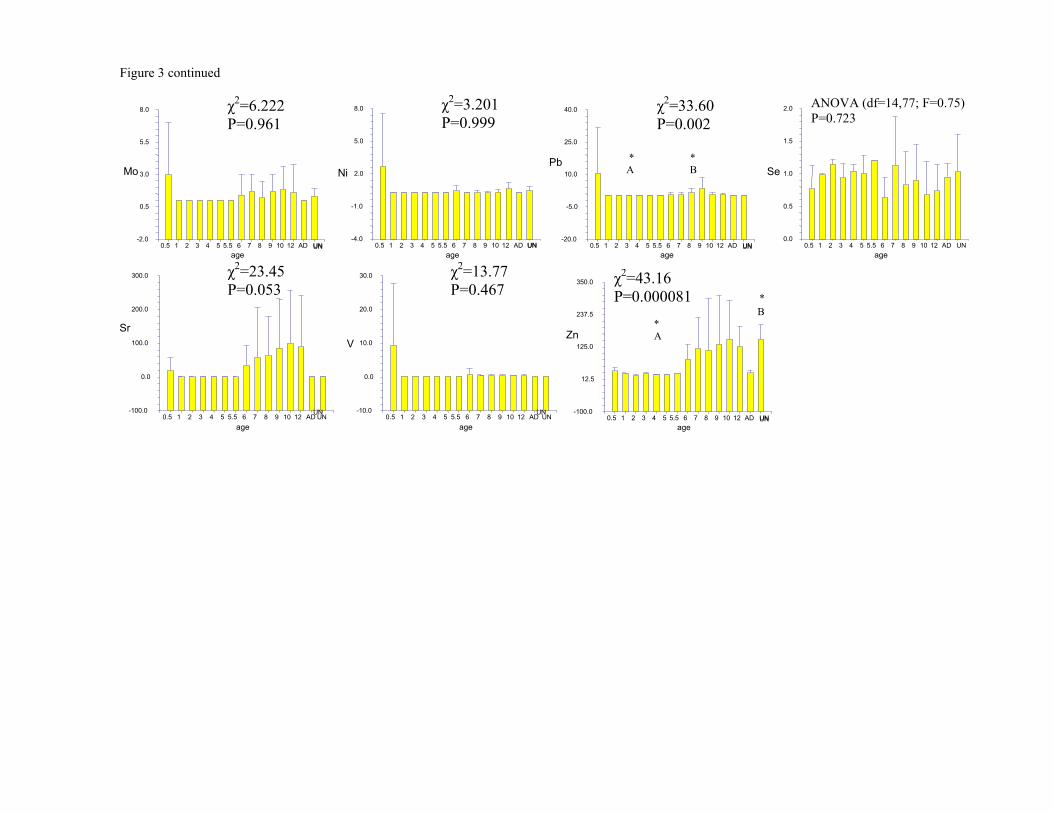
Figure 3 continued χ2=6.222 P=0.961
-2.0
0.5
3.0
5.5
8.0
0.5 1 2 3 4 5 5.5 6 7 8 9 10 12 AD UN age
Mo
UN
χ2=3.201 P=0.999
-4.0
-1.0
2.0
5.0
8.0
0.5 1 2 3 4 5 5.5 6 7 8 9 10 12 AD UNage
Ni
UN
χ2=33.60 P=0.002
* * A B
-20.0
-5.0
10.0
25.0
40.0
0.5 1 2 3 4 5 5.5 6 7 8 9 10 12 AD UNage
Pb
UN
ANOVA (df=14,77; F=0.75) P=0.723
0.0
0.5
1.0
1.5
2.0
0.5 1 2 3 4 5 5.5 6 7 8 9 10 12 AD UNage
Se
χ2=23.45 P=0.053
-100.0
0.0
100.0
200.0
300.0
0.5 1 2 3 4 5 5.5 6 7 8 9 10 12 AD UN age
Sr
UN
χ2=13.77 P=0.467
-10.0
0.0
10.0
20.0
30.0
0.5 1 2 3 4 5 5.5 6 7 8 9 10 12 AD UNage
V
UN
χ2=43.16 P=0.000081 *
B * A
-100.0
12.5
125.0
237.5
350.0
0.5 1 2 3 4 5 5.5 6 7 8 9 10 12 AD UNage
Zn
UN
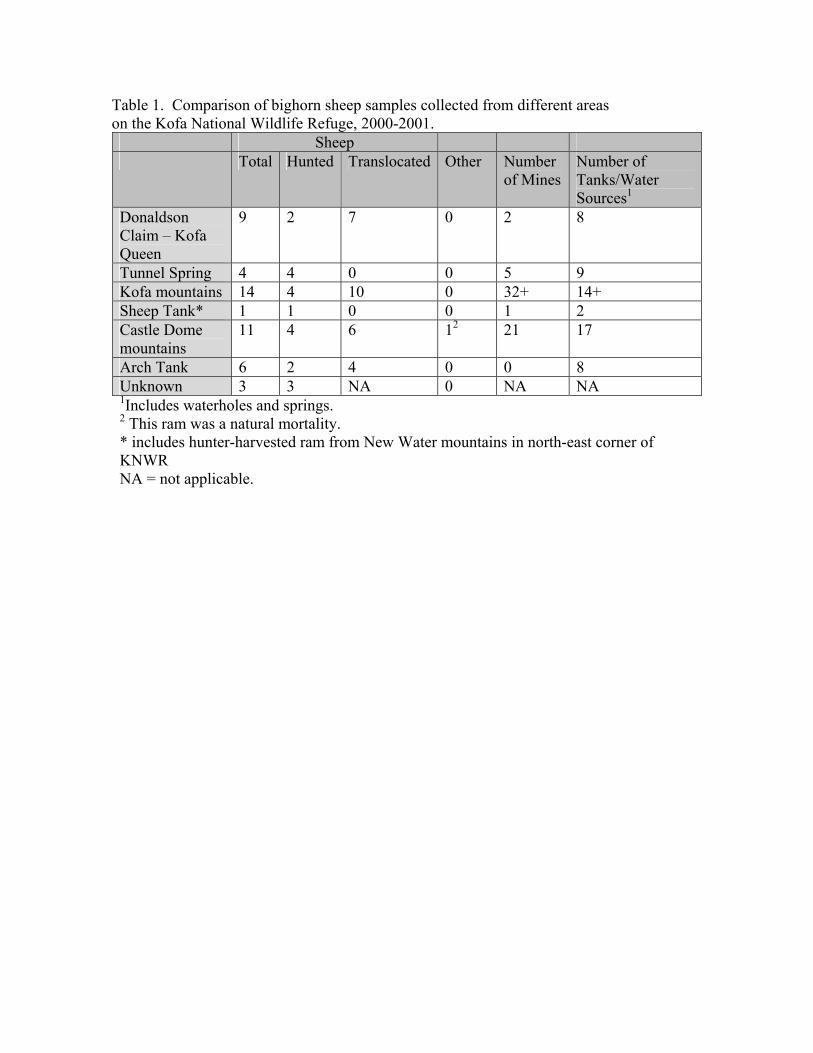
Table 1. Comparison of bighorn sheep samples collected from different areas on the Kofa National Wildlife Refuge, 2000-2001.
Sheep Total Hunted Translocated Other Number
of MinesNumber of Tanks/Water Sources1
Donaldson Claim – Kofa Queen
9 2 7 0 2 8
Tunnel Spring 4 4 0 0 5 9 Kofa mountains 14 4 10 0 32+ 14+ Sheep Tank* 1 1 0 0 1 2 Castle Dome mountains
11 4 6 12 21 17
Arch Tank 6 2 4 0 0 8 Unknown 3 3 NA 0 NA NA 1Includes waterholes and springs. 2 This ram was a natural mortality. * includes hunter-harvested ram from New Water mountains in north-east corner of KNWR NA = not applicable.
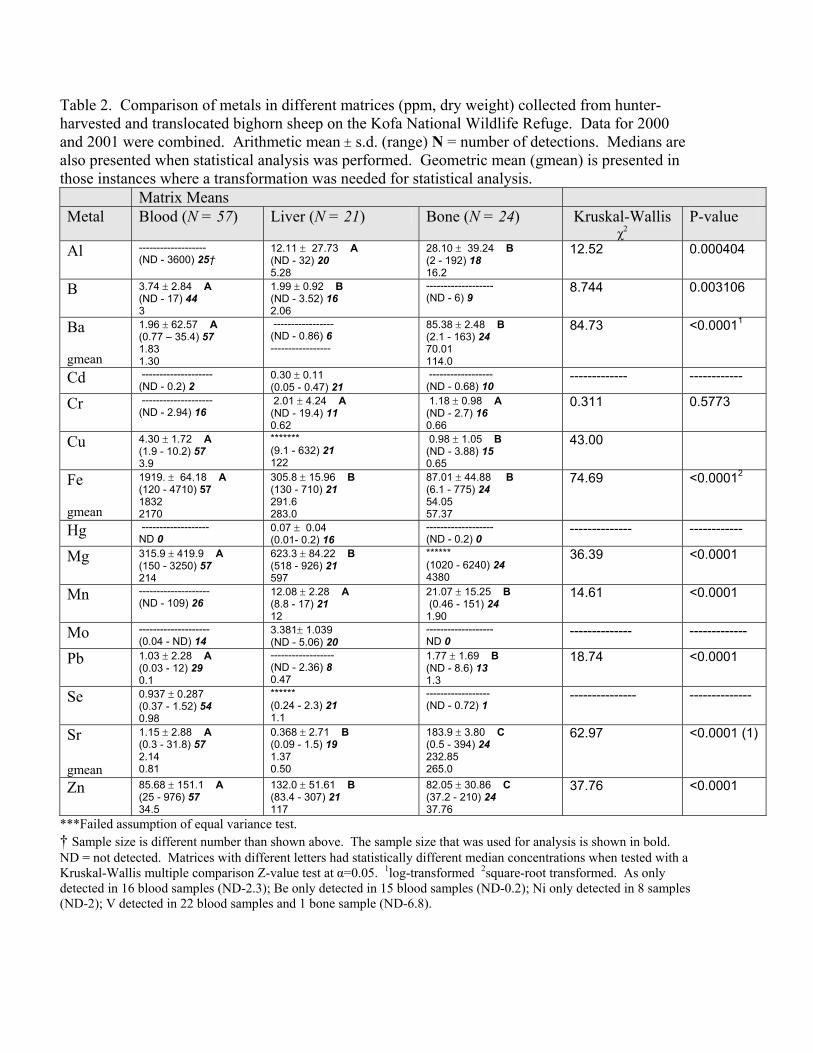
Table 2. Comparison of metals in different matrices (ppm, dry weight) collected from hunter-harvested and translocated bighorn sheep on the Kofa National Wildlife Refuge. Data for 2000 and 2001 were combined. Arithmetic mean ± s.d. (range) N = number of detections. Medians are also presented when statistical analysis was performed. Geometric mean (gmean) is presented in those instances where a transformation was needed for statistical analysis. Matrix Means Metal Blood (N = 57) Liver (N = 21) Bone (N = 24) Kruskal-Wallis
χ2 P-value
Al ------------------- (ND - 3600) 25†
12.11 ± 27.73 A (ND - 32) 20 5.28
28.10 ± 39.24 B (2 - 192) 18 16.2
12.52 0.000404
B 3.74 ± 2.84 A (ND - 17) 44 3
1.99 ± 0.92 B (ND - 3.52) 16 2.06
------------------- (ND - 6) 9
8.744 0.003106
Ba gmean
1.96 ± 62.57 A (0.77 – 35.4) 57 1.83 1.30
----------------- (ND - 0.86) 6 -----------------
85.38 ± 2.48 B (2.1 - 163) 24 70.01 114.0
84.73 <0.00011
Cd -------------------- (ND - 0.2) 2
0.30 ± 0.11 (0.05 - 0.47) 21
------------------ (ND - 0.68) 10
------------- ------------
Cr -------------------- (ND - 2.94) 16
2.01 ± 4.24 A (ND - 19.4) 11 0.62
1.18 ± 0.98 A (ND - 2.7) 16 0.66
0.311 0.5773
Cu 4.30 ± 1.72 A (1.9 - 10.2) 57 3.9
******* (9.1 - 632) 21 122
0.98 ± 1.05 B (ND - 3.88) 15 0.65
43.00
Fe gmean
1919. ± 64.18 A (120 - 4710) 57 1832 2170
305.8 ± 15.96 B (130 - 710) 21 291.6 283.0
87.01 ± 44.88 B (6.1 - 775) 24 54.05 57.37
74.69 <0.00012
Hg ------------------- ND 0
0.07 ± 0.04 (0.01- 0.2) 16
------------------- (ND - 0.2) 0
-------------- ------------
Mg 315.9 ± 419.9 A (150 - 3250) 57 214
623.3 ± 84.22 B (518 - 926) 21 597
****** (1020 - 6240) 24 4380
36.39 <0.0001
Mn -------------------- (ND - 109) 26
12.08 ± 2.28 A (8.8 - 17) 21 12
21.07 ± 15.25 B (0.46 - 151) 24 1.90
14.61 <0.0001
Mo -------------------- (0.04 - ND) 14
3.381± 1.039 (ND - 5.06) 20
------------------- ND 0
-------------- -------------
Pb 1.03 ± 2.28 A (0.03 - 12) 29 0.1
------------------ (ND - 2.36) 8 0.47
1.77 ± 1.69 B (ND - 8.6) 13 1.3
18.74 <0.0001
Se 0.937 ± 0.287 (0.37 - 1.52) 54 0.98
****** (0.24 - 2.3) 21 1.1
------------------ (ND - 0.72) 1
--------------- --------------
Sr gmean
1.15 ± 2.88 A (0.3 - 31.8) 57 2.14 0.81
0.368 ± 2.71 B (0.09 - 1.5) 19 1.37 0.50
183.9 ± 3.80 C (0.5 - 394) 24 232.85 265.0
62.97 <0.0001 (1)
Zn 85.68 ± 151.1 A (25 - 976) 57 34.5
132.0 ± 51.61 B (83.4 - 307) 21 117
82.05 ± 30.86 C (37.2 - 210) 24 37.76
37.76 <0.0001
***Failed assumption of equal variance test. † Sample size is different number than shown above. The sample size that was used for analysis is shown in bold. ND = not detected. Matrices with different letters had statistically different median concentrations when tested with a Kruskal-Wallis multiple comparison Z-value test at α=0.05. 1log-transformed 2square-root transformed. As only detected in 16 blood samples (ND-2.3); Be only detected in 15 blood samples (ND-0.2); Ni only detected in 8 samples (ND-2); V detected in 22 blood samples and 1 bone sample (ND-6.8).
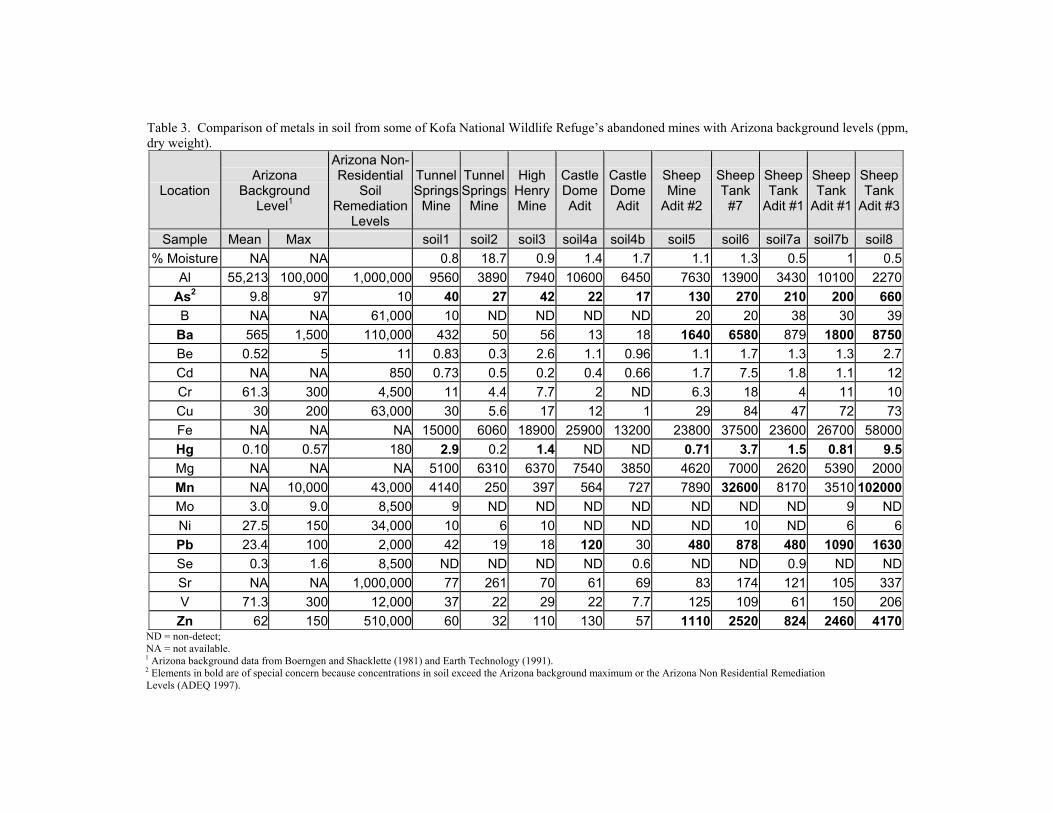
Table 3. Comparison of metals in soil from some of Kofa National Wildlife Refuge’s abandoned mines with Arizona background levels (ppm, dry weight).
Location Arizona
Background Level1
Arizona Non-Residential
Soil Remediation
Levels
Tunnel Springs
Mine
Tunnel Springs
Mine
High Henry Mine
Castle DomeAdit
Castle Dome Adit
Sheep Mine
Adit #2
Sheep Tank
#7
Sheep Tank
Adit #1
Sheep Tank
Adit #1
Sheep Tank
Adit #3
Sample Mean Max soil1 soil2 soil3 soil4a soil4b soil5 soil6 soil7a soil7b soil8 % Moisture NA NA 0.8 18.7 0.9 1.4 1.7 1.1 1.3 0.5 1 0.5
Al 55,213 100,000 1,000,000 9560 3890 7940 10600 6450 7630 13900 3430 10100 2270As2 9.8 97 10 40 27 42 22 17 130 270 210 200 660B NA NA 61,000 10 ND ND ND ND 20 20 38 30 39
Ba 565 1,500 110,000 432 50 56 13 18 1640 6580 879 1800 8750Be 0.52 5 11 0.83 0.3 2.6 1.1 0.96 1.1 1.7 1.3 1.3 2.7Cd NA NA 850 0.73 0.5 0.2 0.4 0.66 1.7 7.5 1.8 1.1 12Cr 61.3 300 4,500 11 4.4 7.7 2 ND 6.3 18 4 11 10Cu 30 200 63,000 30 5.6 17 12 1 29 84 47 72 73Fe NA NA NA 15000 6060 18900 25900 13200 23800 37500 23600 26700 58000Hg 0.10 0.57 180 2.9 0.2 1.4 ND ND 0.71 3.7 1.5 0.81 9.5Mg NA NA NA 5100 6310 6370 7540 3850 4620 7000 2620 5390 2000Mn NA 10,000 43,000 4140 250 397 564 727 7890 32600 8170 3510 102000Mo 3.0 9.0 8,500 9 ND ND ND ND ND ND ND 9 NDNi 27.5 150 34,000 10 6 10 ND ND ND 10 ND 6 6Pb 23.4 100 2,000 42 19 18 120 30 480 878 480 1090 1630Se 0.3 1.6 8,500 ND ND ND ND 0.6 ND ND 0.9 ND NDSr NA NA 1,000,000 77 261 70 61 69 83 174 121 105 337V 71.3 300 12,000 37 22 29 22 7.7 125 109 61 150 206Zn 62 150 510,000 60 32 110 130 57 1110 2520 824 2460 4170
ND = non-detect; NA = not available. 1 Arizona background data from Boerngen and Shacklette (1981) and Earth Technology (1991). 2 Elements in bold are of special concern because concentrations in soil exceed the Arizona background maximum or the Arizona Non Residential Remediation Levels (ADEQ 1997).
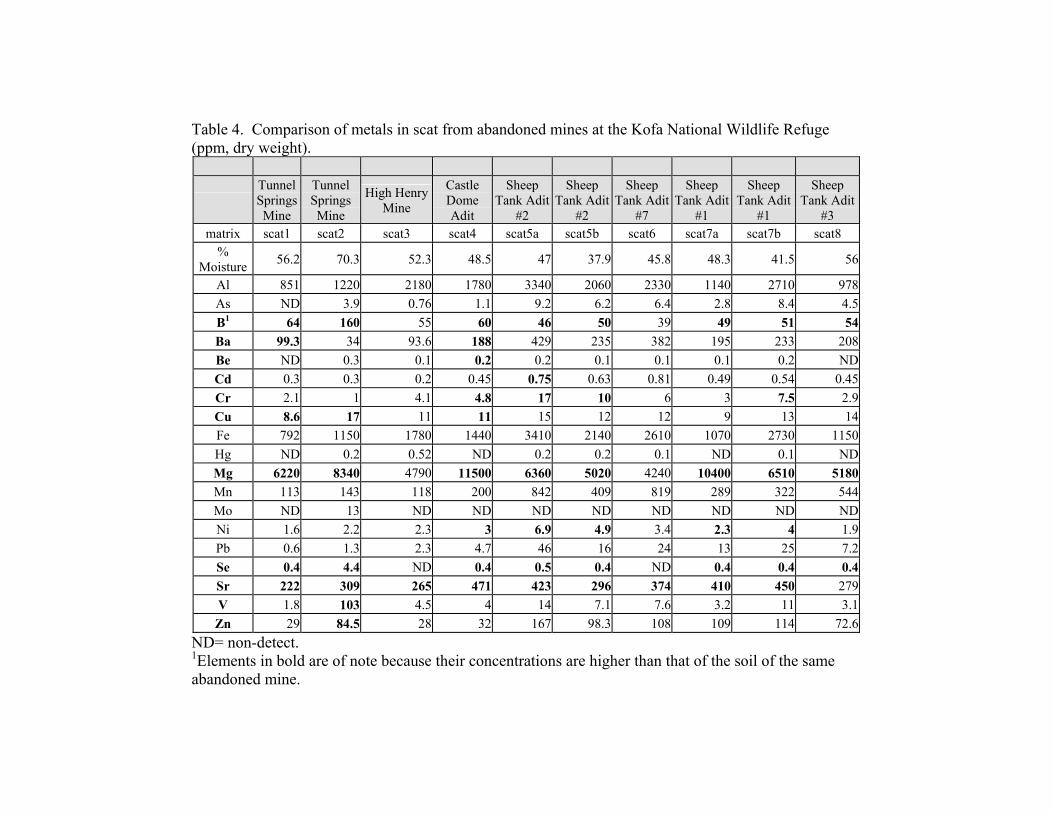
Table 4. Comparison of metals in scat from abandoned mines at the Kofa National Wildlife Refuge (ppm, dry weight).
Tunnel SpringsMine
Tunnel Springs Mine
High Henry Mine
Castle Dome Adit
Sheep Tank Adit
#2
Sheep Tank Adit
#2
Sheep Tank Adit
#7
Sheep Tank Adit
#1
Sheep Tank Adit
#1
Sheep Tank Adit
#3 matrix scat1 scat2 scat3 scat4 scat5a scat5b scat6 scat7a scat7b scat8
% Moisture 56.2 70.3 52.3 48.5 47 37.9 45.8 48.3 41.5 56
Al 851 1220 2180 1780 3340 2060 2330 1140 2710 978As ND 3.9 0.76 1.1 9.2 6.2 6.4 2.8 8.4 4.5B1 64 160 55 60 46 50 39 49 51 54Ba 99.3 34 93.6 188 429 235 382 195 233 208Be ND 0.3 0.1 0.2 0.2 0.1 0.1 0.1 0.2 NDCd 0.3 0.3 0.2 0.45 0.75 0.63 0.81 0.49 0.54 0.45Cr 2.1 6 31 4.1 4.8 17 10 7.5 2.9Cu 8.6 17 11 11 15 12 12 9 13 14Fe 792 1150 1780 1440 3410 2140 2610 1070 2730 1150Hg ND 0.2 0.52 ND 0.2 0.2 0.1 ND 0.1 NDMg 6220 8340 4790 11500 6360 5020 4240 10400 6510 5180Mn 113 143 118 200 842 409 819 289 322 544Mo ND 13 ND ND ND ND ND ND ND NDNi 1.6 2.2 2.3 3 6.9 4.9 3.4 2.3 4 1.9Pb 0.6 1.3 2.3 4.7 46 16 24 13 25 7.2Se 0.4 4.4 ND 0.4 0.5 0.4 ND 0.4 0.4 0.4Sr 222 309 265 471 423 296 374 410 450 279V 1.8 103 4.5 4 14 7.1 7.6 3.2 11 3.1Zn 29 84.5 28 32 167 98.3 108 109 114 72.6
ND= non-detect. 1Elements in bold are of note because their concentrations are higher than that of the soil of the same abandoned mine.

Table 5. Metals concentrations in bone. Sheep Tank Adit bone samples were compared to soil and scat from the same mine.
Location Geyser Dam1
Squaw Peak1
Signal Peak1
Virgin Basin
Virgin Basin
Kofa Butte
CharlieDied Tank UN UN UN
Sheep Tank Adit #1
Sheep Tank Adit #3
Sheep Tank Adit #3
Sheep Tank Adit #3
ArchTank
Individual Bone-L Bone-M Bone-N Bone-P Bone-C Bone-Q Bone-S
Bone-R
Bone-T
Bone-U
Bone-WW
Bone-VV
Bone-XX
Bone-XX
Bone-YY
Sex M M M M M M M M M M UN UN UN UN UN % Moisture 40.4 25.5 35.2 13.4 29.3 30.2 34.6 18.1 11 74 3.1 10.5 5.6 11.6 1.5
Al 32 17 30 22 33.5 12 48 13 23 80 45 2 18 11 9.7As ND ND ND ND ND ND ND ND ND ND 2.1 0.5 1 0.6 NDB 4 ND 6 ND ND ND ND ND 5 3 ND 2 ND ND 2Ba 92.1 111 135 95.7 51.2 115 151 133 151 2.1 140 163 148 149 137Be ND ND ND ND ND ND ND ND ND ND ND ND ND ND NDCd ND ND ND ND 0.52 ND ND ND ND ND ND ND ND ND NDCr 0.5 ND 1 2.7 1.35 ND 0.5 ND 0.6 1.5 ND ND ND ND NDCu 1.2 ND 1.2 0.4 1.28 ND 0.8 ND ND 3.5 ND ND ND ND NDFe 265 21 457 7.4 88 6.1 25 24 9 200 150 73 140 110 48Hg ND ND ND ND ND ND ND ND ND ND ND ND ND ND ND
Mg2 3960 4260 4480 4110 1701 4620 4150 3650 4380 1020 4190 5860 5340 6240 5130Mn 2.6 1 5 1.6 1.07 1 1.9 1 1.9 4.1 96.9 80 138 151 2.6Mo ND ND ND ND ND ND ND ND ND ND ND ND ND ND NDNi ND ND ND ND 1.14 ND ND ND 0.5 0.9 ND ND ND ND NDPb 1.1 1.3 1.6 8.6 ND 1.2 1.6 0.6 1.1 ND 4.2 1.9 3.5 2.5 0.82Se ND ND ND ND ND ND ND ND ND 0.4 ND ND ND ND NDSr 194 329 240 243 132 337 394 329 265 0.5 253 327 272 316 322V ND 0.9 0.6 1 ND 1 0.9 0.9 1 ND 1 ND ND ND NDZn 68.6 84.9 79.7 80.9 61.7 76.1 75.9 72.4 90.7 210 83.8 94.9 97.8 88.7 74.9
ND= non detect. M=male. UN=Unknown. 1These three areas are all in the Tunnel Springs area. 2Elements in bold are of interest because concentrations in bone exceed soil concentrations from the same mine; red indicates concentrations greater than scat and blue indicates concentrations greater than both soil and scat.
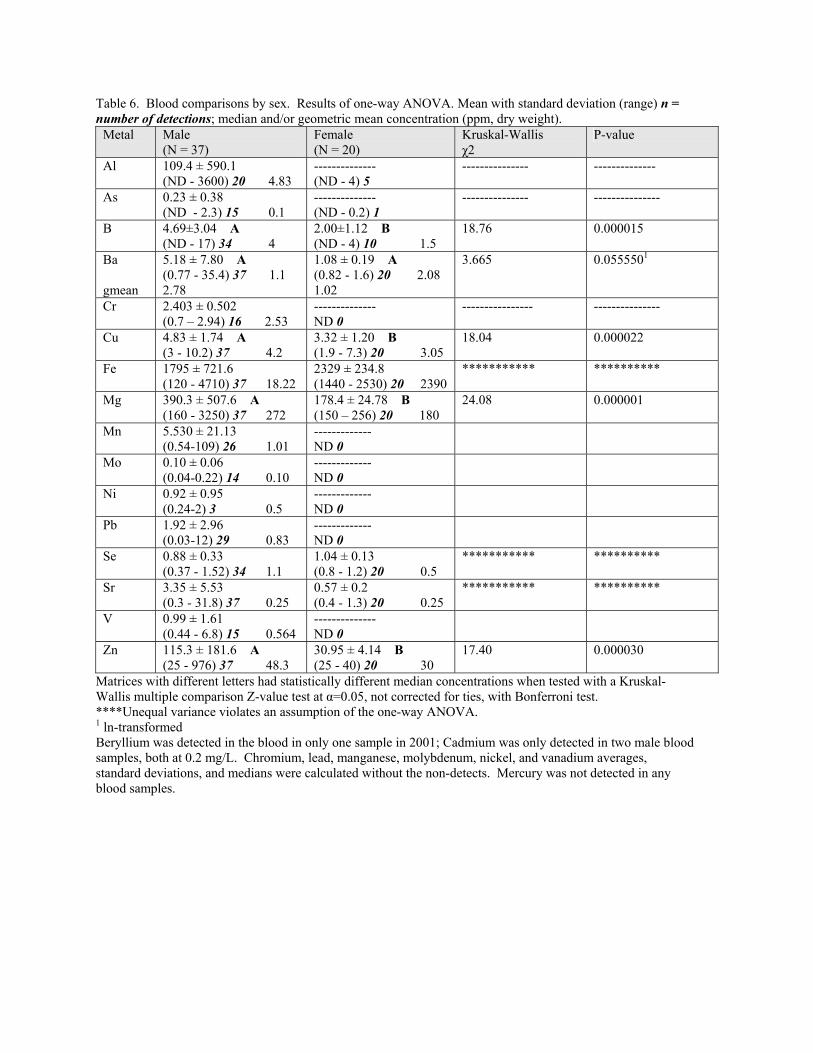
Table 6. Blood comparisons by sex. Results of one-way ANOVA. Mean with standard deviation (range) n = number of detections; median and/or geometric mean concentration (ppm, dry weight).
Metal Male (N = 37)
Female (N = 20)
Kruskal-Wallis χ2
P-value
Al
109.4 ± 590.1 (ND - 3600) 20 4.83
-------------- (ND - 4) 5
--------------- --------------
As 0.23 ± 0.38 (ND - 2.3) 15 0.1
-------------- (ND - 0.2) 1
--------------- ---------------
B 4.69±3.04 A (ND - 17) 34 4
2.00±1.12 B (ND - 4) 10 1.5
18.76 0.000015
Ba gmean
5.18 ± 7.80 A (0.77 - 35.4) 37 1.1 2.78
1.08 ± 0.19 A (0.82 - 1.6) 20 2.08 1.02
3.665 0.0555501
Cr 2.403 ± 0.502 (0.7 – 2.94) 16 2.53
-------------- ND 0
---------------- ---------------
Cu 4.83 ± 1.74 A (3 - 10.2) 37 4.2
3.32 ± 1.20 B (1.9 - 7.3) 20 3.05
18.04 0.000022
Fe
1795 ± 721.6 (120 - 4710) 37 18.22
2329 ± 234.8 (1440 - 2530) 20 2390
*********** **********
Mg 390.3 ± 507.6 A (160 - 3250) 37 272
178.4 ± 24.78 B (150 – 256) 20 180
24.08 0.000001
Mn 5.530 ± 21.13 (0.54-109) 26 1.01
------------- ND 0
Mo 0.10 ± 0.06 (0.04-0.22) 14 0.10
------------- ND 0
Ni 0.92 ± 0.95 (0.24-2) 3 0.5
------------- ND 0
Pb 1.92 ± 2.96 (0.03-12) 29 0.83
------------- ND 0
Se 0.88 ± 0.33 (0.37 - 1.52) 34 1.1
1.04 ± 0.13 (0.8 - 1.2) 20 0.5
*********** **********
Sr 3.35 ± 5.53 (0.3 - 31.8) 37 0.25
0.57 ± 0.2 (0.4 - 1.3) 20 0.25
*********** **********
V 0.99 ± 1.61 (0.44 - 6.8) 15 0.564
-------------- ND 0
Zn 115.3 ± 181.6 A (25 - 976) 37 48.3
30.95 ± 4.14 B (25 - 40) 20 30
17.40 0.000030
Matrices with different letters had statistically different median concentrations when tested with a Kruskal-Wallis multiple comparison Z-value test at α=0.05, not corrected for ties, with Bonferroni test. ****Unequal variance violates an assumption of the one-way ANOVA. 1 ln-transformed Beryllium was detected in the blood in only one sample in 2001; Cadmium was only detected in two male blood samples, both at 0.2 mg/L. Chromium, lead, manganese, molybdenum, nickel, and vanadium averages, standard deviations, and medians were calculated without the non-detects. Mercury was not detected in any blood samples.
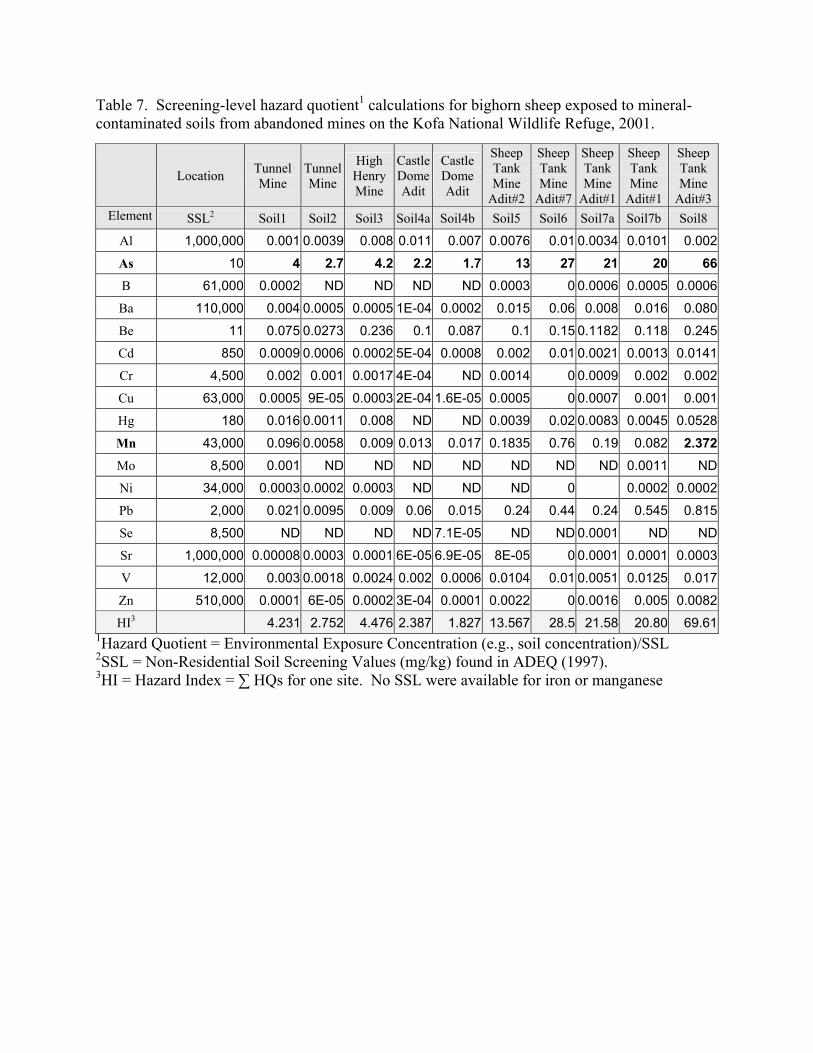
Table 7. Screening-level hazard quotient1 calculations for bighorn sheep exposed to mineral-contaminated soils from abandoned mines on the Kofa National Wildlife Refuge, 2001.
1Hazard Quotient = Environmental Exposure Concentration (e.g., soil concentration)/SSL
Location Tunnel Mine
Tunnel Mine
High Henry Mine
Castle Dome Adit
Castle Dome Adit
Sheep Tank Mine
Adit#2
Sheep Tank Mine
Adit#7
Sheep Tank Mine
Adit#1
Sheep Tank Mine
Adit#1
Sheep Tank Mine
Adit#3Element SSL2 Soil1 Soil2 Soil3 Soil4a Soil4b Soil5 Soil6 Soil7a Soil7b Soil8
Al 1,000,000 0.001 0.0039 0.008 0.011 0.007 0.0076 0.01 0.0034 0.0101 0.002
As 10 4 2.7 4.2 2.2 1.7 13 27 21 20 66B 61,000 0.0002 ND ND ND ND 0.0003 0 0.0006 0.0005 0.0006
Ba 110,000 0.004 0.0005 0.0005 1E-04 0.0002 0.015 0.06 0.008 0.016 0.080
Be 11 0.075 0.0273 0.236 0.1 0.087 0.1 0.15 0.1182 0.118 0.245
Cd 850 0.0009 0.0006 0.0002 5E-04 0.0008 0.002 0.01 0.0021 0.0013 0.0141
Cr 4,500 0.002 0.001 0.0017 4E-04 ND 0.0014 0 0.0009 0.002 0.002
Cu 63,000 0.0005 9E-05 0.0003 2E-04 1.6E-05 0.0005 0 0.0007 0.001 0.001
Hg 180 0.016 0.0011 0.008 ND ND 0.0039 0.02 0.0083 0.0045 0.0528
Mn 43,000 0.096 0.0058 0.009 0.013 0.017 0.1835 0.76 0.19 0.082 2.372Mo 8,500 0.001 ND ND ND ND ND ND ND 0.0011 ND
Ni 34,000 0.0003 0.0002 0.0003 ND ND ND 0 0.0002 0.0002
Pb 2,000 0.021 0.0095 0.009 0.06 0.015 0.24 0.44 0.24 0.545 0.815
Se 8,500 ND ND ND ND 7.1E-05 ND ND 0.0001 ND ND
Sr 1,000,000 0.00008 0.0003 0.0001 6E-05 6.9E-05 8E-05 0 0.0001 0.0001 0.0003
V 12,000 0.003 0.0018 0.0024 0.002 0.0006 0.0104 0.01 0.0051 0.0125 0.017
Zn 510,000 0.0001 6E-05 0.0002 3E-04 0.0001 0.0022 0 0.0016 0.005 0.0082
HI3 4.231 2.752 4.476 2.387 1.827 13.567 28.5 21.58 20.80 69.61
2SSL = Non-Residential Soil Screening Values (mg/kg) found in ADEQ (1997). 3HI = Hazard Index = ∑ HQs for one site. No SSL were available for iron or manganese
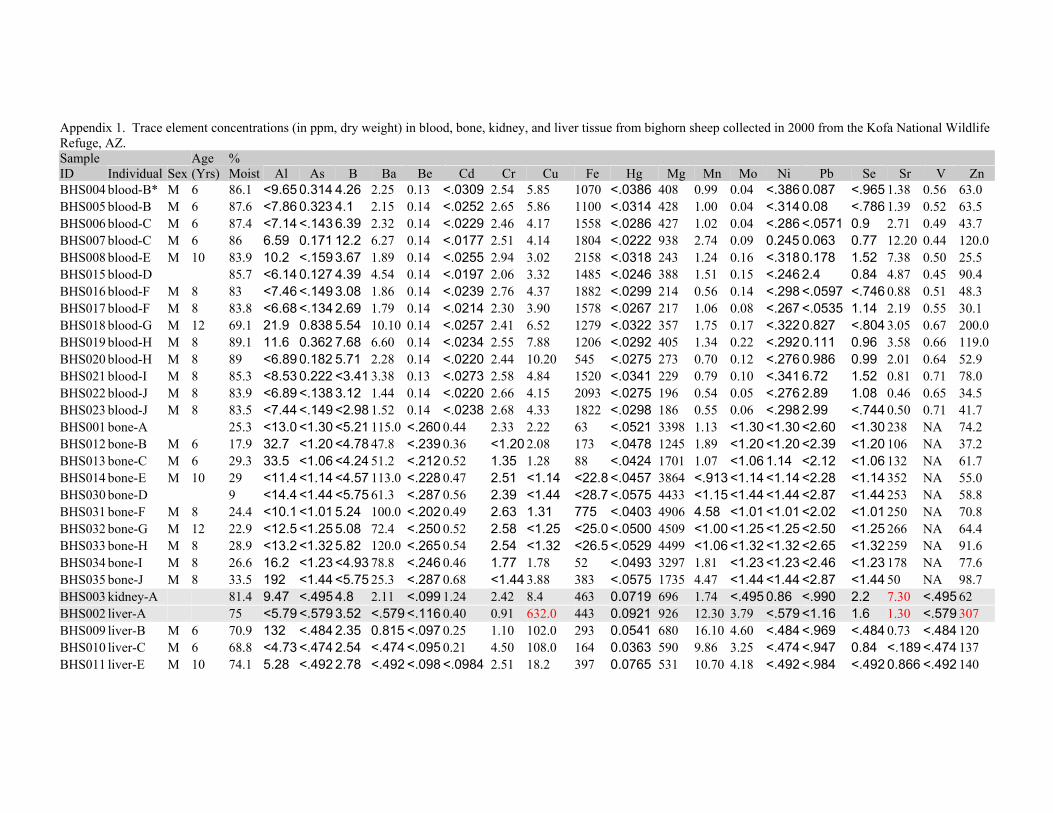
Appendix 1. Trace element concentrations (in ppm, dry weight) in blood, bone, kidney, and liver tissue from bighorn sheep collected in 2000 from the Kofa National Wildlife Refuge, AZ. Sample ID Individual Sex
Age (Yrs)
% Moist Al As B Ba Be Cd Cr Cu Fe Hg Mg Mn Mo Ni Pb Se Sr V Zn
BHS004 blood-B* M 6 86.1 <9.65 0.314 4.26 2.25
0.13 <.0309 2.54 5.85 1070 <.0386 408 0.99 0.04 <.386 0.087 <.965 1.38 0.56 63.0BHS005 blood-B M 6 87.6 <7.86 0.323 4.1 2.15 0.14 <.0252 2.65 5.86 1100 <.0314 428 1.00 0.04 <.314 0.08 <.786
1.39 0.52 63.5
BHS006 blood-C M 6 87.4 <7.14
<.143 6.39 2.32 0.14 <.0229 2.46 4.17 1558 <.0286 427 1.02 0.04 <.286 <.0571
0.9 2.71 0.49 43.7BHS007 blood-C M 6 86 6.59 0.171 12.2 6.27 0.14 <.0177 2.51 4.14 1804 <.0222 938 2.74 0.09 0.245 0.063 0.77 12.20
0.44 120.0
BHS008 blood-E M 10 83.9 10.2 <.159 3.67 1.89 0.14 <.0255 2.94 3.02 2158 <.0318 243 1.24 0.16 <.318 0.178
1.52 7.38 0.50 25.5BHS015 blood-D 85.7 <6.14 0.127 4.39 4.54 0.14 <.0197 2.06 3.32 1485 <.0246 388 1.51 0.15 <.246 2.4 0.84 4.87 0.45 90.4BHS016 blood-F M 8 83 <7.46 <.149 3.08 1.86 0.14 <.0239 2.76 4.37 1882 <.0299 214 0.56 0.14 <.298 <.0597 <.746 0.88 0.51 48.3BHS017 blood-F M 8 83.8 <6.68
<.134 2.69 1.79 0.14 <.0214 2.30 3.90 1578 <.0267 217 1.06 0.08 <.267 <.0535
1.14 2.19 0.55 30.1
BHS018 blood-G M 12 69.1 21.9 0.838 5.54 10.10
0.14 <.0257 2.41 6.52 1279 <.0322 357 1.75 0.17 <.322 0.827 <.804
3.05 0.67 200.0BHS019 blood-H M 8 89.1 11.6 0.362 7.68 6.60 0.14 <.0234 2.55 7.88 1206
<.0292 405 1.34 0.22 <.292 0.111 0.96 3.58 0.66 119.0
BHS020 blood-H M 8 89 <6.89 0.182 5.71 2.28 0.14 <.0220 2.44 10.20
545 <.0275 273 0.70 0.12 <.276 0.986 0.99 2.01 0.64 52.9BHS021 blood-I M 8 85.3 <8.53 0.222 <3.41 3.38 0.13 <.0273 2.58 4.84 1520 <.0341 229 0.79 0.10 <.341 6.72 1.52 0.81 0.71 78.0BHS022 blood-J M 8 83.9 <6.89 <.138 3.12 1.44 0.14 <.0220 2.66 4.15 2093 <.0275 196 0.54 0.05 <.276 2.89 1.08 0.46 0.65 34.5BHS023 blood-J M 8 83.5 <7.44 <.149 <2.98 1.52 0.14 <.0238
2.68 4.33 1822
<.0298 186 0.55 0.06 <.298 2.99 <.744 0.50 0.71
41.7
BHS001 bone-A 25.3 <13.0
<1.30 <5.21 115.0 <.260 0.44 2.33 2.22 63 <.0521 3398 1.13 <1.30 <1.30 <2.60 <1.30 238 NA 74.2BHS012 bone-B M 6 17.9 32.7 <1.20 <4.78 47.8 <.239 0.36 <1.20 2.08 173 <.0478 1245 1.89 <1.20 <1.20
<2.39 <1.20 106 NA 37.2
BHS013 bone-C M 6 29.3 33.5 <1.06 <4.24 51.2 <.212 0.52 1.35 1.28 88 <.0424 1701 1.07 <1.06 1.14 <2.12 <1.06 132 NA 61.7BHS014 bone-E M 10 29 <11.4 <1.14 <4.57 113.0 <.228 0.47 2.51 <1.14 <22.8 <.0457 3864 <.913 <1.14 <1.14 <2.28 <1.14 352 NA 55.0BHS030 bone-D 9 <14.4 <1.44 <5.75 61.3 <.287 0.56 2.39 <1.44
<28.7
<.0575 4433 <1.15
<1.44 <1.44 <2.87 <1.44 253 NA 58.8
BHS031 bone-F M 8 24.4 <10.1 <1.01 5.24 100.0 <.202 0.49 2.63 1.31 775 <.0403 4906 4.58 <1.01 <1.01 <2.02 <1.01 250 NA 70.8BHS032 bone-G M 12 22.9 <12.5 <1.25 5.08 72.4 <.250 0.52 2.58 <1.25 <25.0 <.0500 4509 <1.00 <1.25 <1.25 <2.50 <1.25 266 NA 64.4BHS033 bone-H M 8 28.9 <13.2
<1.32 5.82 120.0 <.265 0.54 2.54 <1.32
<26.5
<.0529 4499 <1.06
<1.32 <1.32 <2.65 <1.32 259 NA 91.6
BHS034 bone-I M 8 26.6 16.2
<1.23 <4.93 78.8 <.246 0.46 1.77 1.78 52 <.0493 3297 1.81 <1.23 <1.23 <2.46 <1.23 178 NA 77.6BHS035 bone-J M 8 33.5 192 <1.44 <5.75 25.3 <.287 0.68 <1.44 3.88 383 <.0575 1735 4.47 <1.44 <1.44 <2.87 <1.44 50 NA 98.7BHS003 kidney-A 81.4 9.47 <.495 4.8 2.11 <.099 1.24 2.42 8.4 463 0.0719 696 1.74 <.495 0.86 <.990 2.2 7.30 <.495 62 BHS002 liver-A 75 <5.79 <.579 3.52 <.579 <.116 0.40 0.91 632.0 443 0.0921 926 12.30 3.79 <.579 <1.16 1.6 1.30 <.579 307 BHS009 liver-B M 6 70.9 132 <.484 2.35
0.815 <.097 0.25 1.10 102.0 293 0.0541 680 16.10 4.60 <.484 <.969 <.484
0.73 <.484 120 BHS010 liver-C M 6 68.8 <4.73
<.474 2.54 <.474 <.095 0.21 4.50 108.0
164 0.0363 590 9.86 3.25 <.474 <.947 0.84 <.189 <.474 137
BHS011 liver-E M 10 74.1 5.28 <.492 2.78 <.492 <.098 <.0984 2.51 18.2 397 0.0765 531 10.70 4.18 <.492 <.984 <.492 0.866 <.492 140
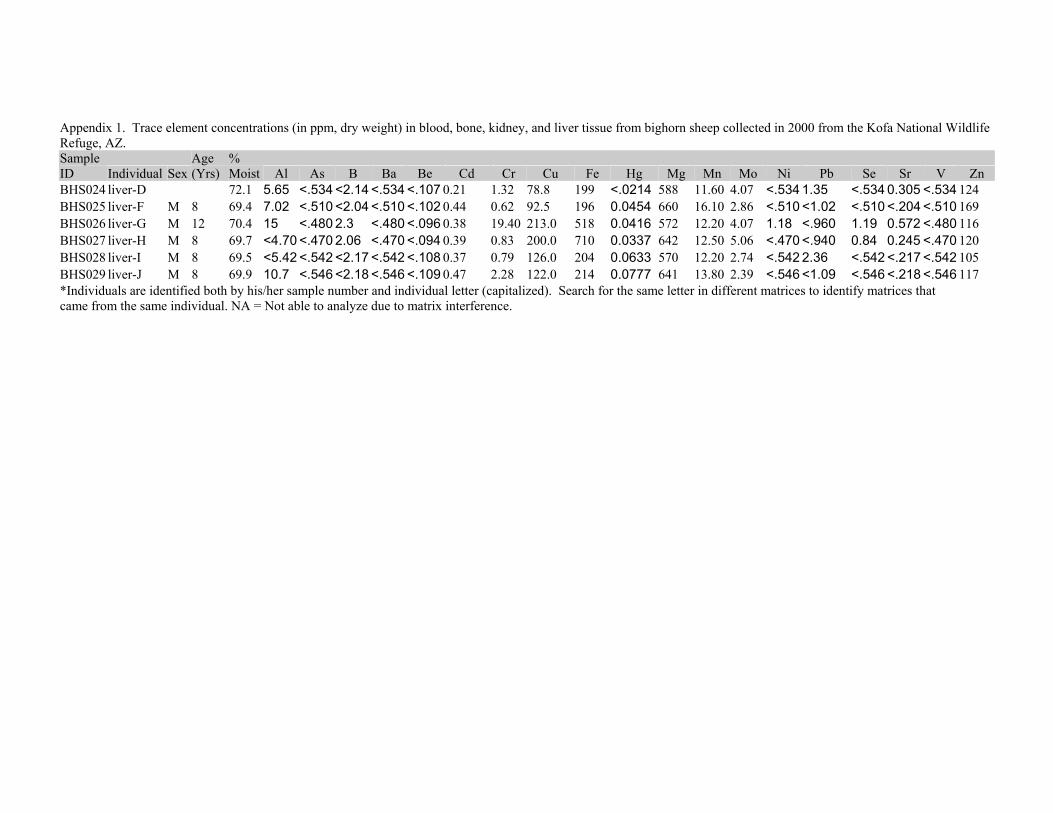
Appendix 1. Trace element concentrations (in ppm, dry weight) in blood, bone, kidney, and liver tissue from bighorn sheep collected in 2000 from the Kofa National Wildlife Refuge, AZ. Sample ID Individual Sex
Age (Yrs)
% Moist Al As B Ba Be Cd Cr Cu Fe Hg Mg Mn Mo Ni Pb Se Sr V Zn
BHS024 liver-D 72.1 5.65
<.534 <2.14 <.534 <.107 0.21 1.32 78.8 199 <.0214 588 11.60 4.07 <.534 1.35 <.534 0.305 <.534 124 BHS025 liver-F M 8 69.4 7.02
<.510 <2.04
<.510 <.102 0.44 0.62 92.5 196 0.0454 660 16.10 2.86 <.510
<1.02 <.510
<.204 <.510 169
BHS026 liver-G M 12 70.4 15 <.480 2.3 <.480 <.096 0.38 19.40 213.0 518 0.0416 572 12.20 4.07 1.18 <.960 1.19 0.572 <.480 116 BHS027 liver-H M 8 69.7 <4.70 <.470 2.06 <.470 <.094 0.39 0.83 200.0 710 0.0337 642 12.50 5.06 <.470 <.940
0.84 0.245 <.470 120
BHS028 liver-I M 8 69.5 <5.42
<.542 <2.17 <.542 <.108 0.37 0.79 126.0 204 0.0633 570 12.20 2.74 <.542 2.36 <.542 <.217 <.542 105 BHS029 liver-J M 8 69.9 10.7 <.546 <2.18 <.546 <.109 0.47 2.28 122.0 214 0.0777 641 13.80 2.39 <.546 <1.09 <.546 <.218 <.546 117 *Individuals are identified both by his/her sample number and individual letter (capitalized). Search for the same letter in different matrices to identify matrices that came from the same individual. NA = Not able to analyze due to matrix interference.

Appendix 2. Trace element concentrations (in ppm, dry weight) in blood, bone, kidney, and liver tissue from bighorn sheep collected in 2001 from the Kofa National Wildlife Refuge, AZ.
Sample Individual Sex Age (Yrs) % Moist Al As B Ba Be Cd Cr Cu Fe Hg Mg Mn Mo Ni Pb Se Sr V Zn
26
Blood-W* M 5 80.4 <2.00 <.200 2 0.77 <.100 <.100 <.500 3.1 2270 <.100 200 <.500 <2.00 <.500 <.200 0.8 0.3 <.500 2727 Blood-X F 3 84 <2.00 <.200 <2.00 1 <.100 <.100 <.500 7.3 1440 <.100 256 <.500 <2.00 <.500 <.200 1.2 1.3 <.500 3928 Blood-Y F 4 79.5 <2.00 <.200 3 0.84 <.100 <.100 <.500 2.3 2360 <.100 170 <.500 <2.00 <.500 <.200 0.97 0.4 <.500 2629 Blood-Z M 0.5 79.6 <2.00 <.200 3 1.3 <.100 <.100 <.500 3.7 2230 <.100 180 <.500 <2.00 <.500 <.200 0.98 0.5 <.500 3430 Blood-AA F 6 79.8 <2.00 <.200 <2.00 0.89 <.100 <.100 <.500 4 2170 <.100 190 <.500 <2.00 <.500 <.200 1 0.5 <.500 3257 Blood-BB M 1 77.7 <2.00 <.200 4 1 <.100 <.100 <.500 3.2 2160 <.100 160 <.500 <2.00 <.500 <.200 0.98 0.5 <.500 3258 Blood-CC F 2 78.6 <2.00 <.200 3 0.91 <.100 <.100 <.500 2.8 2280 <.100 170 <.500 <2.00 <.500 <.200 1.2 0.5 <.500 2559 Blood-DD F 4 78.9 2 <.200 <2.00 0.83 <.100 <.100 <.500 1.9 2400 <.100 201 <.500 <2.00 <.500 <.200 1 0.64 <.500 2860 Blood-EE F 2 79 <2.00 <.200 <2.00 0.85 <.100 <.100 <.500 3 2440 <.100 180 <.500 <2.00 <.500 <.200 1.1 0.5 <.500 2861 Blood-FF F 3 78.5 <2.00 <.200 <2.00 1.2 <.100 <.100 <.500 4 2330 <.100 200 <.500 <2.00 <.500 <.200 0.91 0.61 <.500 3262 Blood-GG F 3 78.3 <2.00 <.200 <2.00 1.2 <.100 <.100 <.500 3 2380 <.100 180 <.500 <2.00 <.500 <.200 0.99 0.6 <.500 3387 Blood-HH F 5.5 76.8 <2.00 <.200 <2.00 1.2 <.100 <.100 <.500 3.6 2490 <.100 150 <.500 <2.00 <.500 <.200 1.2 0.4 <.500 3488 Blood-II F AD 81 2 <.200 <2.00 1.6 <.100 <.100 <.500 5.3 2170 <.100 190 <.500 <2.00 <.500 <.200 0.8 0.72 <.500 4089 Blood-JJ F 3 77.1 <2.00 <.200 <2.00 1.1 <.100 <.100 <.500 2.4 2530 <.100 150 <.500 <2.00 <.500 <.200 1.2 0.5 <.500 2890 Blood-KK F 3 78.4 <2.00 <.200 2 1.1 <.100 <.100 <.500 3.1 2530 <.100 150 <.500 <2.00 <.500 <.200 0.93 0.4 <.500 3591
Blood-LL F 5 78.8 <2.00 0.2 3 0.96 <.100 <.100 <.500 2.3 2210 <.100 150 <.500 <2.00 <.500 <.200 1.2 0.5 <.500 2992 Blood-MM F 7 78.2 <2.00 <.400 4 1 <.100 <.100 <.500 3.2 2440 <.100 180 <.500 <2.00 <.500 <.200 0.94 0.5 <.500 3093 Blood-NN F AD 77.8 2 <.200 3 1 <.100 <.100 <.500 2.4 2480 <.100 160 <.500 <2.00 <.500 <.200 1.1 0.6 <.500 3094 Blood-OO F 4 80.2 3 <.200 3 1.1 <.100 <.100 <.500 3.6 2370 <.100 190 <.500 <2.00 <.500 <.200 1 0.6 <.500 2995 Blood-PP F 3 80 4 <.200 2 1.2 <.100 <.100 <.500 2.9 2400 <.100 190 <.500 <2.00 <.500 <.200 0.97 0.5 <.500 3696 Blood-QQ M 1 79.3 <2.00 <.200 3 1 <.100 <.100 <.500 3.4 2320 <.100 200 <.500 <2.00 <.500 <.200 1 0.4 <.500 3497 Blood-RR F 4 77.4 <2.00 <.200 4 0.96 <.100 <.100 <.500 2.9 2450 <.100 180 <.500 <2.00 <.500 <.200 1.2 0.5 <.500 2798
Blood-SS M 0.5 78.7 <2.00 <.200 3 1.1 <.100 <.100 <.500 3.6 2450 <.100 190 <.500 <2.00 <.500 <.200 1.1 0.4 <.500 4199 Blood-TT M 3 77.6 <2.00 <.200 <2.00 1.1 <.100 <.100 <.500 6.3 2250 <.100 170 <.500 <2.00 <.500 <.200 0.5 0.3 <.500 32
100 Blood-UU F 3 77.9 <2.00 <.200 <2.00 0.82 <.100 <.100 <.500 3.2 2300 <.100 170 <.500 <2.00 <.500 <.200 0.8 0.5 <.500 2810BHSBA Blood-T M 9 86.2 10 <2.00 <6.00 20 <.100 <.200 <.600 3 1150 <.100 310 0.7 <2.00 <.500 1 <2.00 1.4 <1.00 51211BHSBA Blood-U M UN 87.4 4 <.400 6.6 5.3 <.100 <.100 <.500 4.1 2030 <.100 384 <.500 <2.00 <.500 <.200 1.2 2.2 <.500 1311BHSBA Blood-K M 6 81.8 56 <.200 4 3.2 <.100 <.100 <.500 3.7 2160 <.100 282 3 <2.00 <.500 0.3 0.6 8.3 <.500 311BHSBB Blood-K M 6 83 57 <.200 4 3.4 <.100 <.100 <.500 4.3 2220 <.100 276 3.3 <2.00 <.500 0.3 0.6 9 <.500 37
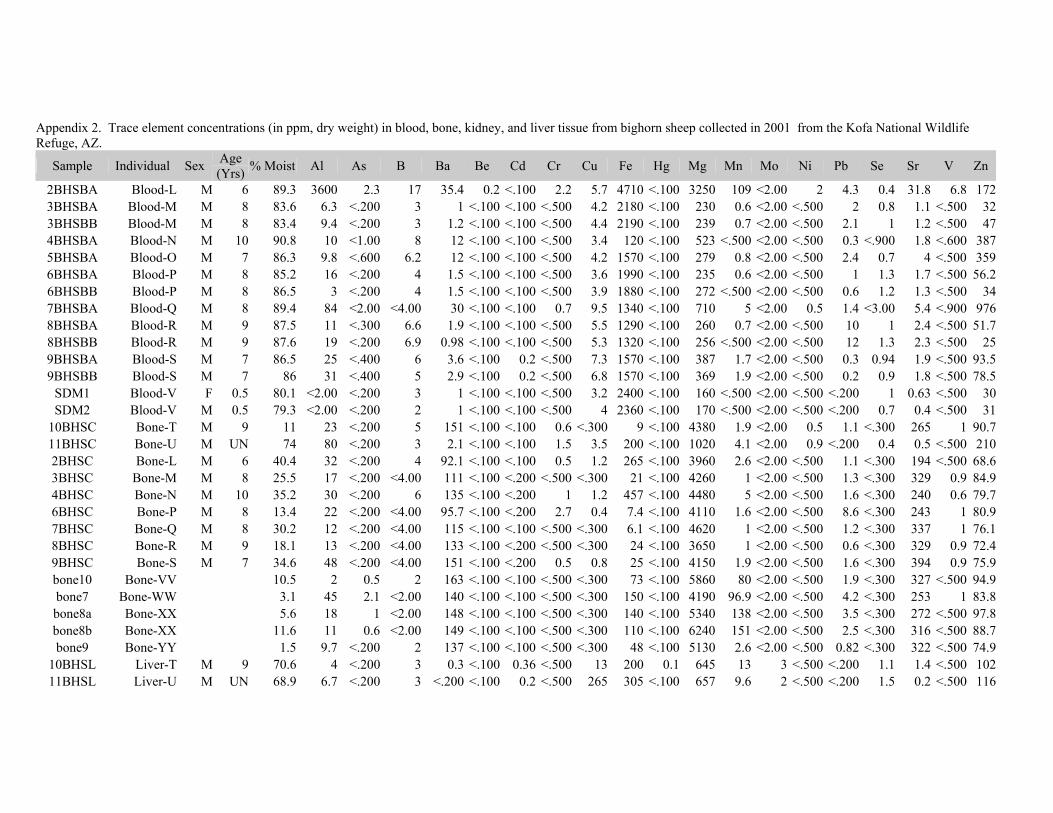
Appendix 2. Trace element concentrations (in ppm, dry weight) in blood, bone, kidney, and liver tissue from bighorn sheep collected in 2001 from the Kofa National Wildlife Refuge, AZ.
Sample Individual Sex Age (Yrs) % Moist Al As B Ba Be Cd Cr Cu Fe Hg Mg Mn Mo Ni Pb Se Sr V Zn
2BHSBA
Blood-L M 6 89.3 3600 2.3 17 35.4 0.2 <.100 2.2 5.7 4710 <.100 3250 109 <2.00 2 4.3 0.4 31.8 6.8 1723BHSBA Blood-M M 8 83.6 6.3 <.200 3 1 <.100 <.100 <.500 4.2 2180 <.100 230 0.6 <2.00 <.500 2 0.8 1.1 <.500 323BHSBB Blood-M M 8 83.4 9.4 <.200 3 1.2 <.100 <.100 <.500 4.4 2190 <.100 239 0.7 <2.00 <.500 2.1 1 1.2 <.500 474BHSBA Blood-N M 10 90.8 10 <1.00 8 12 <.100 <.100 <.500 3.4 120 <.100 523 <.500 <2.00 <.500 0.3 <.900 1.8 <.600 3875BHSBA Blood-O M 7 86.3 9.8 <.600 6.2 12 <.100 <.100 <.500 4.2 1570 <.100 279 0.8 <2.00 <.500 2.4 0.7 4 <.500 3596BHSBA Blood-P M 8 85.2 16 <.200 4 1.5 <.100 <.100 <.500 3.6 1990 <.100 235 0.6 <2.00 <.500 1 1.3 1.7 <.500 56.26BHSBB Blood-P M 8 86.5 3 <.200 4 1.5 <.100 <.100 <.500 3.9 1880 <.100 272 <.500 <2.00 <.500 0.6 1.2 1.3 <.500 347BHSBA Blood-Q M 8 89.4 84 <2.00 <4.00 30 <.100 <.100 0.7 9.5 1340 <.100 710 5 <2.00 0.5 1.4 <3.00 5.4 <.900 9768BHSBA Blood-R M 9 87.5 11 <.300 6.6 1.9 <.100 <.100 <.500 5.5 1290 <.100 260 0.7 <2.00 <.500 10 1 2.4 <.500 51.78BHSBB Blood-R M 9 87.6 19 <.200 6.9 0.98 <.100 <.100 <.500 5.3 1320 <.100 256 <.500 <2.00 <.500 12 1.3 2.3 <.500 259BHSBA
Blood-S M 7 86.5 25 <.400 6 3.6 <.100 0.2 <.500 7.3 1570 <.100 387 1.7 <2.00 <.500 0.3 0.94 1.9 <.500 93.59BHSBB Blood-S M 7 86 31 <.400 5 2.9 <.100 0.2 <.500 6.8 1570 <.100 369 1.9 <2.00 <.500 0.2 0.9 1.8 <.500 78.5
SDM1 Blood-V F 0.5 80.1 <2.00 <.200 3 1 <.100 <.100 <.500 3.2 2400 <.100 160 <.500 <2.00 <.500 <.200 1 0.63 <.500 30SDM2 Blood-V M 0.5 79.3 <2.00 <.200 2 1 <.100 <.100 <.500 4 2360 <.100 170 <.500 <2.00 <.500 <.200 0.7 0.4 <.500 31
10BHSC Bone-T M 9 11 23 <.200 5 151 <.100 <.100 0.6 <.300 9 <.100 4380 1.9 <2.00 0.5 1.1 <.300 265 1 90.711BHSC Bone-U M UN 74 80 <.200 3 2.1 <.100 <.100 1.5 3.5 200 <.100 1020 4.1 <2.00 0.9 <.200 0.4 0.5 <.500 2102BHSC Bone-L M 6 40.4 32 <.200 4 92.1 <.100 <.100 0.5 1.2 265 <.100 3960 2.6 <2.00 <.500 1.1 <.300 194 <.500 68.63BHSC Bone-M M 8 25.5 17 <.200 <4.00 111 <.100 <.200 <.500 <.300 21 <.100 4260 1 <2.00 <.500 1.3 <.300 329 0.9 84.94BHSC Bone-N M 10 35.2 30 <.200 6 135 <.100 <.200 1 1.2 457 <.100 4480 5 <2.00 <.500 1.6 <.300 240 0.6 79.76BHSC Bone-P M 8 13.4 22 <.200 <4.00 95.7 <.100 <.200 2.7 0.4 7.4 <.100 4110 1.6 <2.00 <.500 8.6 <.300 243 1 80.97BHSC Bone-Q M 8 30.2 12 <.200 <4.00 115 <.100 <.100 <.500 <.300 6.1 <.100 4620 1 <2.00 <.500 1.2 <.300 337 1 76.18BHSC Bone-R M 9 18.1 13 <.200 <4.00 133 <.100 <.200 <.500 <.300 24 <.100 3650 1 <2.00 <.500 0.6 <.300 329 0.9 72.49BHSC
Bone-S M 7 34.6 48 <.200 <4.00 151 <.100 <.200 0.5 0.8 25 <.100 4150 1.9 <2.00 <.500 1.6 <.300 394 0.9 75.9bone10 Bone-VV 10.5 2 0.5 2 163 <.100 <.100 <.500 <.300 73 <.100 5860 80 <2.00 <.500 1.9 <.300 327 <.500 94.9bone7 Bone-WW 3.1 45 2.1 <2.00 140 <.100 <.100 <.500 <.300 150 <.100 4190 96.9 <2.00 <.500 4.2 <.300 253 1 83.8bone8a Bone-XX 5.6 18 1 <2.00 148 <.100 <.100 <.500 <.300 140 <.100 5340 138 <2.00 <.500 3.5 <.300 272 <.500 97.8bone8b Bone-XX 11.6 11 0.6 <2.00 149 <.100 <.100 <.500 <.300 110 <.100 6240 151 <2.00 <.500 2.5 <.300 316 <.500 88.7bone9 Bone-YY 1.5 9.7 <.200 2 137 <.100 <.100 <.500 <.300 48 <.100 5130 2.6 <2.00 <.500 0.82 <.300 322 <.500 74.9
10BHSL Liver-T M 9 70.6 4 <.200 3 0.3 <.100 0.36 <.500 13 200 0.1 645 13 3 <.500 <.200 1.1 1.4 <.500 10211BHSL Liver-U M UN 68.9 6.7 <.200 3 <.200 <.100 0.2 <.500 265 305 <.100 657 9.6 2 <.500 <.200 1.5 0.2 <.500 116

Appendix 2. Trace element concentrations (in ppm, dry weight) in blood, bone, kidney, and liver tissue from bighorn sheep collected in 2001 from the Kofa National Wildlife Refuge, AZ.
Sample Individual Sex Age (Yrs) % Moist Al As B Ba Be Cd Cr Cu Fe Hg Mg Mn Mo Ni Pb Se Sr V Zn
1BHSSL Liver-K M 6 70.5 6 <.200 <2.00 <.200 <.100 0.32 <.500 82.2 231 0.2 583 8.9 5 <.500 0.5 0.93 0.62 <.500 89.12BHSL
Liver-L M 6 69.6 4 <.200 3 0.6 <.100 0.2 5.4 78.9 283 <.100 597 12 2 <.500 <.200 1.2 1.5 <.500 1703BHSL Liver-M M 8 69.8 11 <.200 <2.00 <.200 <.100 0.1 <.500 124 262 <.100 627 17 <2.00 <.500 <.200 1.3 <.200 <.500 1004BHSL Liver-N M 10 74.5 5 <.200 3 0.2 <.100 0.3 <.500 9.1 130 0.1 697 12 4 <.500 <.200 1 0.63 <.500 2255BHSL Liver-O M 7 73.5 4 <.200 2 <.200 <.100 0.35 <.500 370 483 <.100 556 8.8 4 <.500 0.2 2 0.5 <.500 1176BHSL Liver-P M 8 69.9 4 <.200 <2.00 0.2 <.100 0.3 <.500 333 357 <.100 579 10 3 <.500 0.3 1.9 <.200 <.500 1027BHSL Liver-Q M 8 69.4 8.6 <.200 <2.00 0.86 <.100 0.37 <.500 212 287 0.1 643 12 3 <.500 0.66 1.6 1.3 <.500 1248BHSL Liver-R M 9 70.8 <2.00 <.200 3 <.200 <.100 0.35 <.500 115 589 0.1 518 10 4 <.500 0.2 1.6 0.3 <.500 87.89BHSL Liver-S M 7 75.2 14 <.200 <2.00 <.200 <.100 0.3 <.500 341 275 0.1 587 13 3 <.500 0.3 2.3 0.6 <.500 83.4
UN = unknown. AD = adult. *Individuals are identified both by his/her sample number and individual letter (capitalized). Search for the same letter in different matrices to identify matrices that came from the same individual.