on the exchange velocity in street canyons with tree · pdf fileon the exchange velocity in...
TRANSCRIPT

th
On the exchange velocity in street canyons with tree planting
*Department of Physics and Astronomy - ALMA MATER STUDIORUM, University of Bologna (Italy)
** Dipartimento di Scienze e Tecnologie Biologiche ed Ambientali – University of Salento, Lecce (Italy)
*** Civil and Environmental Engineering and Earth Sciences, University of Notre Dame – USA
Silvana Di Sabatino*, Riccardo Buccolieri**,
Laura S. Leo***, Gianluca Pappaccogli**
International Conference on Urban Climate

Ventilation indicators Overview of CFD studies on urban wind flow and outdoor ventilation
of simplified urban configurations, including study of integral
parameters for ventilation performance (Mod. Ramponi et al., 2015)
Evaluation parameters
More than 10 different parameters were used in the
literature
Most studies performed are based on steady RANS
equations and on successful validation of these
simulations with wind tunnel measurements
Most of them considered idealized/regular geometries

City breathability The recent developed concept of CITY BREATHABILITY has the appeal to be useful for flow modellers, urban planners
and architects during the design of new urban areas since it captures the effect of building configuration and shape on flow
and turbulence.
Pollutant removal due to vertical mean flows and turbulent diffusion
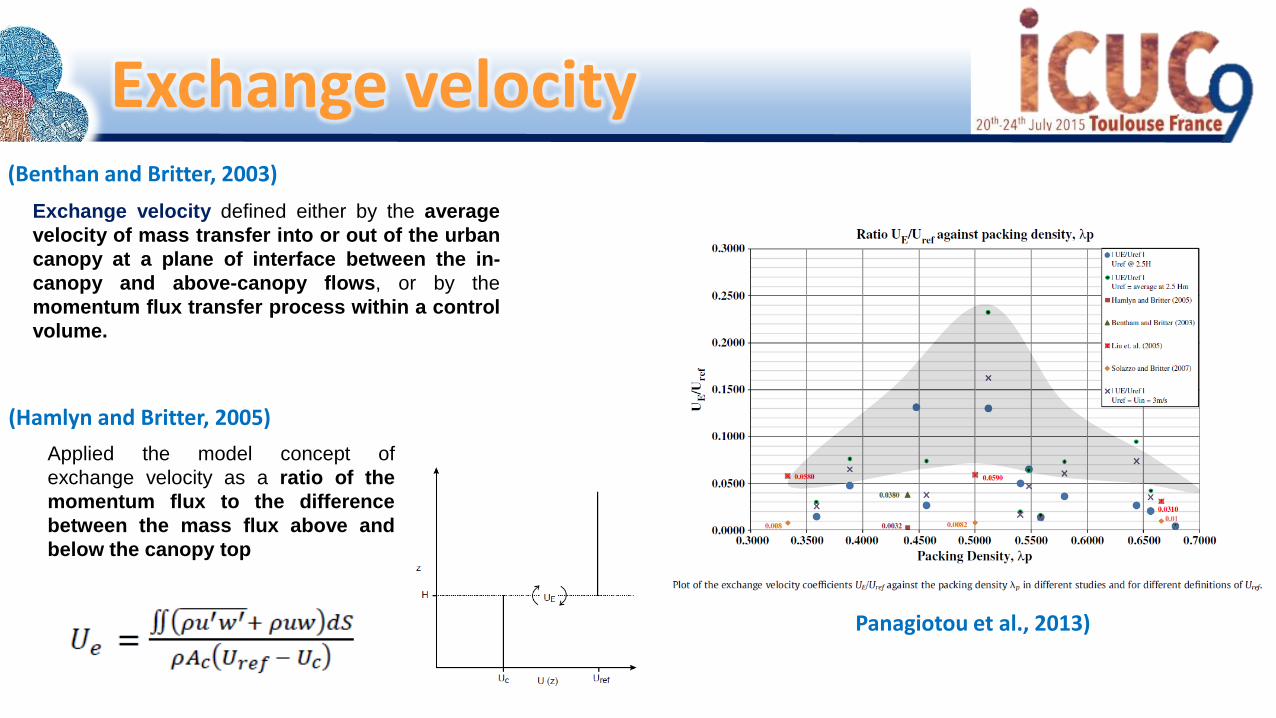
Exchange velocity
Exchange velocity defined either by the average
velocity of mass transfer into or out of the urban
canopy at a plane of interface between the in-
canopy and above-canopy flows, or by the
momentum flux transfer process within a control
volume.
(Benthan and Britter, 2003)
(Hamlyn and Britter, 2005)
Applied the model concept of
exchange velocity as a ratio of the
momentum flux to the difference
between the mass flux above and
below the canopy top
Panagiotou et al., 2013)
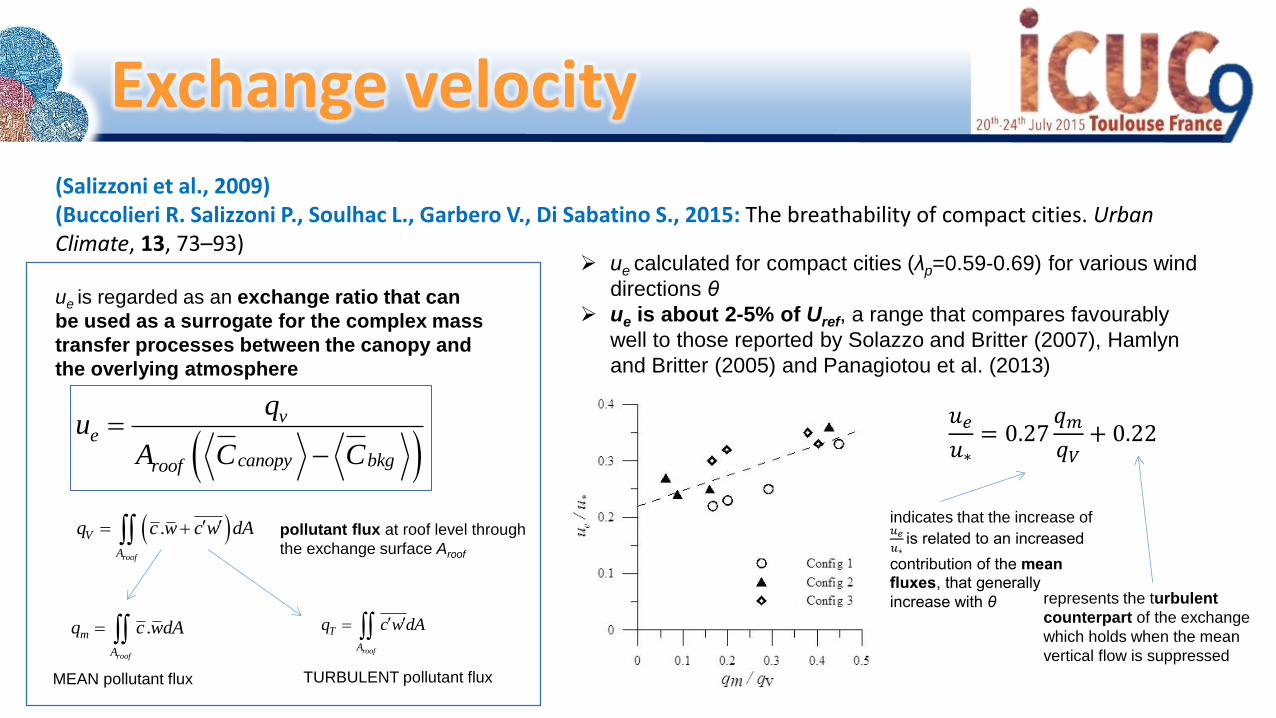
(Salizzoni et al., 2009) (Buccolieri R. Salizzoni P., Soulhac L., Garbero V., Di Sabatino S., 2015: The breathability of compact cities. Urban Climate, 13, 73–93)
v
e
canopy bkgroof
qu
A C C
roof
V
A
q c .w c w dA
ue is regarded as an exchange ratio that can
be used as a surrogate for the complex mass
transfer processes between the canopy and
the overlying atmosphere
roof
m
A
q c .wdA roof
T
A
q c w dA
Exchange velocity
ue calculated for compact cities (λp=0.59-0.69) for various wind
directions θ
ue is about 2-5% of Uref, a range that compares favourably
well to those reported by Solazzo and Britter (2007), Hamlyn
and Britter (2005) and Panagiotou et al. (2013)
𝑢𝑒
𝑢∗= 0.27
𝑞𝑚𝑞𝑉
+ 0.22
indicates that the increase of 𝑢𝑒
𝑢∗is related to an increased
contribution of the mean fluxes, that generally
increase with θ represents the turbulent
counterpart of the exchange
which holds when the mean
vertical flow is suppressed
pollutant flux at roof level through
the exchange surface Aroof
MEAN pollutant flux TURBULENT pollutant flux
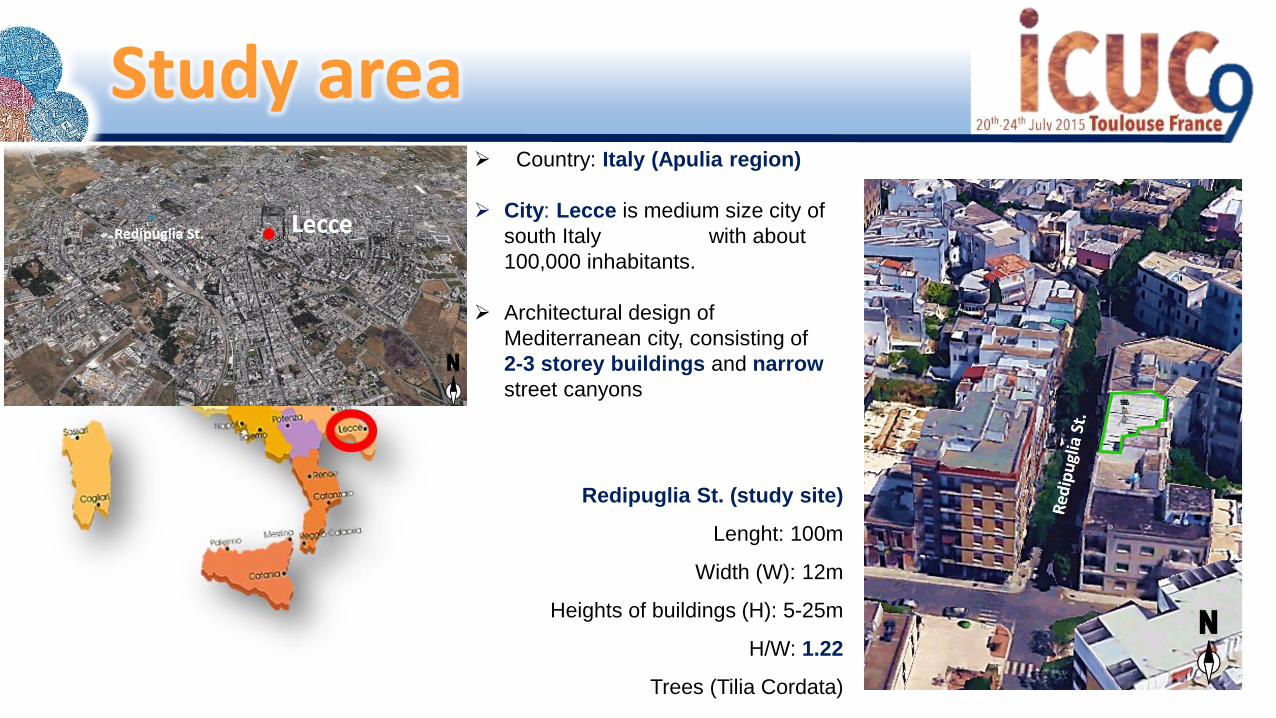
Country: Italy (Apulia region)
City: Lecce is medium size city of
south Italy with about
100,000 inhabitants.
Architectural design of
Mediterranean city, consisting of
2-3 storey buildings and narrow
street canyons
Redipuglia St. (study site)
Lenght: 100m
Width (W): 12m
Heights of buildings (H): 5-25m
H/W: 1.22
Trees (Tilia Cordata)
Study area
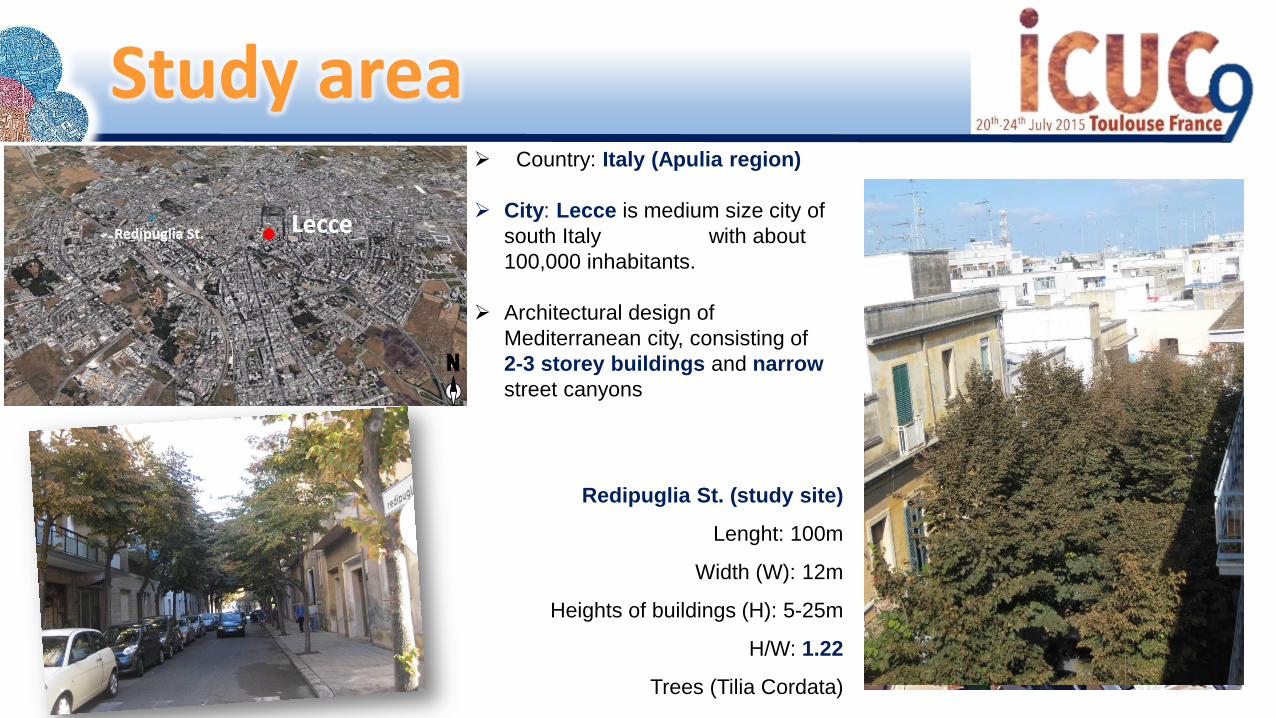
Study area Country: Italy (Apulia region)
City: Lecce is medium size city of
south Italy with about
100,000 inhabitants.
Architectural design of
Mediterranean city, consisting of
2-3 storey buildings and narrow
street canyons
Redipuglia St. (study site)
Lenght: 100m
Width (W): 12m
Heights of buildings (H): 5-25m
H/W: 1.22
Trees (Tilia Cordata)

Field measurements
Pappaccogli G., Buccolieri R., Maggiotto G., Leo L.S., Rispoli G., Micocci F., Di Sabatino S. 2014. The effects of
trees on micrometeorology in a medium-size Mediterranean city: in situ experiments and numerical simulations. Proc.
ASME 2014 4th Joint US-European Fluids Engineering Division Summer Meeting and 11th International Conference on
Nanochannels, Microchannels, and Minichannels, Chicago (Illinois, USA), 3-7 August. H
avg=
15
m
Field campaign: 11 October – 6 December 2013
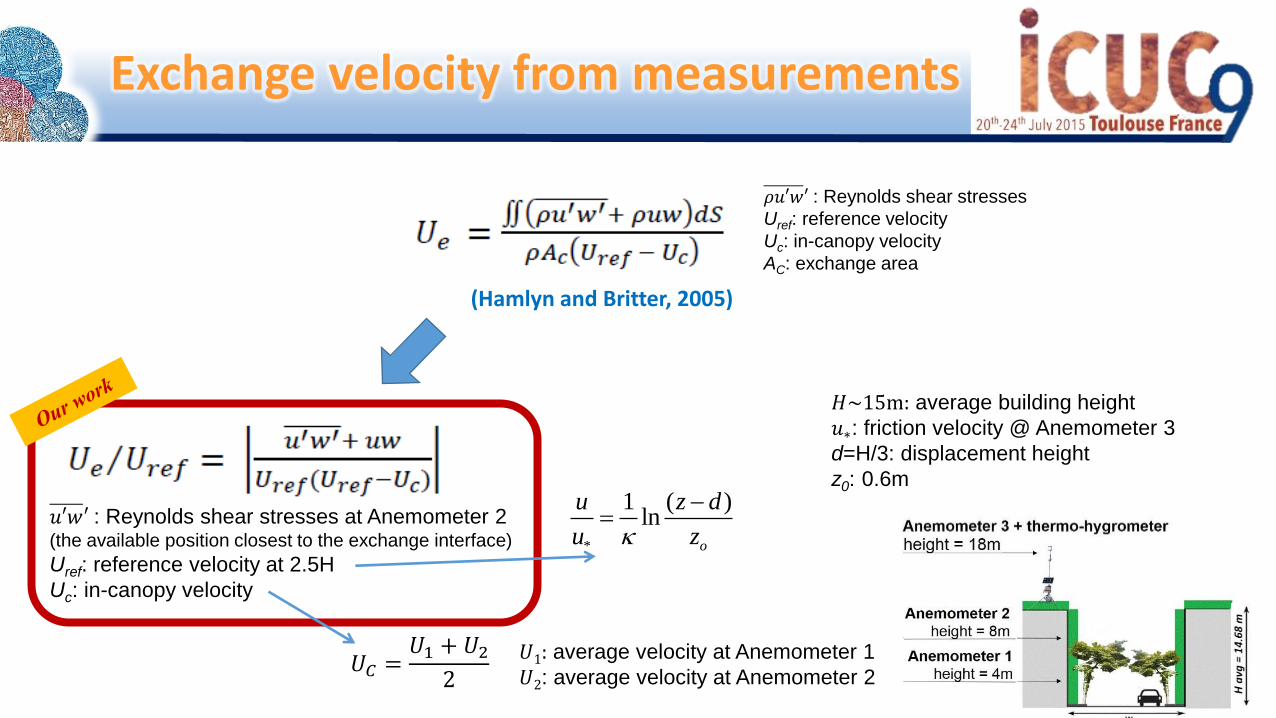
Exchange velocity from measurements
*
1 ( )ln
o
u z d
u z
𝜌𝑢′𝑤′ : Reynolds shear stresses
Uref: reference velocity
Uc: in-canopy velocity
AC: exchange area
(Hamlyn and Britter, 2005)
𝑢′𝑤′ : Reynolds shear stresses at Anemometer 2 (the available position closest to the exchange interface)
Uref: reference velocity at 2.5H
Uc: in-canopy velocity
𝐻~15m: average building height
𝑢∗: friction velocity @ Anemometer 3
d=H/3: displacement height
z0: 0.6m
𝑈𝐶 =𝑈1 + 𝑈2
2
𝑈1: average velocity at Anemometer 1
𝑈2: average velocity at Anemometer 2

Permeable zone with pressure loss coefficient λfs= Cd x LADmeas. = 0.35 (large LAI) – 0.024 m2m-3 (low LAI)
leaf drag coefficient assumed to be 0.2
With trees Without trees
bkgcanyoncref
v
ref
e
CCAU
q
HU
u
)5.2(
Vq pollutant flux (kg/s) at roof level through the exchange surface CA (m2)
canyonC averaged pollutant concentration within the canyon (kg/m3)
bkgC background concentration (kg/m3), i.e. pollutant concentration of the
incoming atmospheric flow (it can be null if this is defined zero outside
the domain).
Calculation of ue from
(computed as the residual
of a balance of the pollutant
fluxes entering and
leavening the street (i.e. in
the horizontal plane)
through the lateral sides
dAnCUdVQq i
A
i
V
UV
- V (m3): whole volume of the canyon. i
denotes x and y
- QU (kmol/m3-s): passive scalar emission rate
per unit volume within V
- A (m2): total surface of the street sections at
the border of the canopy
- (kmol/m3): concentration C
Exchange velocity calculation
Exchange velocity from CFD simulations
CFD code FLUENT
3D steady-state
grid: hexahedral elements
- ~2,000 000
-δx=δy=δz=0.25m (close to the walls)
RANS-Equations
- Reynolds Stress Model (RSM)
second order discretization schemes
line source: emission rate Qu u* : friction velocity
z0 = 0.1m is the aerodynamic roughness length
κ = Von Kàrmàn constant (0.40)
δ =150m is the computational domain height
Cμ= 0.09
λ𝑓𝑠
λ𝑤𝑡= 𝑀𝑜𝑑𝑒𝑙 𝑠𝑐𝑎𝑙𝑒
E.g. for M = 1:150 (model scale of
CODASC experiments and our
previous simulations), λ𝑤𝑡 = 52.5m-1
Gromke, 2011 (Environmental Pollution 159, 2094–2099)
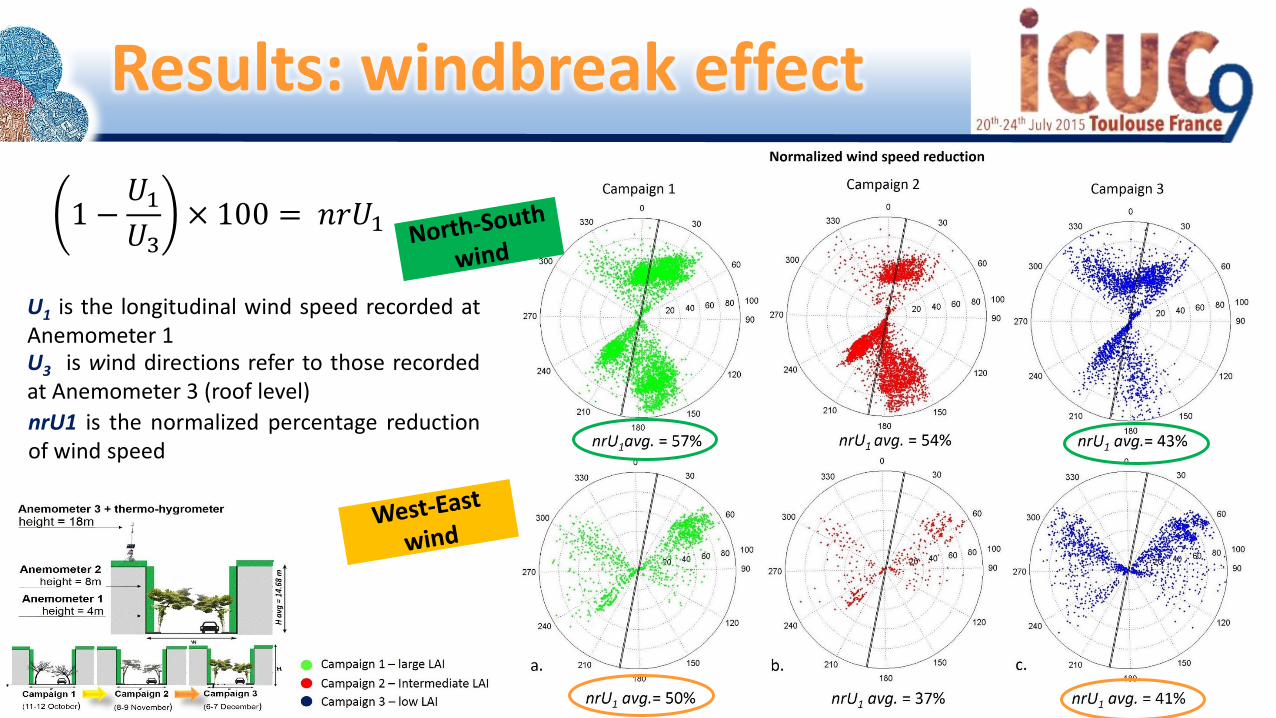
Results: windbreak effect
1 −𝑈1
𝑈3× 100 = 𝑛𝑟𝑈1
U1 is the longitudinal wind speed recorded at Anemometer 1 U3 is wind directions refer to those recorded at Anemometer 3 (roof level)
nrU1 is the normalized percentage reduction of wind speed

Results: Exchange velocity
𝑈𝑒 𝑈𝑟𝑒𝑓 =𝑢′𝑤′ + 𝑢𝑤
𝑈𝑟𝑒𝑓(𝑈𝑟𝑒𝑓 − 𝑈𝑐
𝟏𝟏°: 𝒔𝒕𝒓𝒆𝒆𝒕 𝒂𝒙𝒊𝒔 𝒐𝒓𝒊𝒆𝒏𝒕𝒂𝒕𝒊𝒐𝒏 𝒘𝒊𝒕𝒉 𝒓𝒆𝒔𝒑𝒆𝒄𝒕 𝒕𝒐 𝒕𝒉𝒆 𝑵𝒐𝒓𝒕𝒉
Wind directions from Anemometer 3
We focus on

NIGHT Parallel Perpendicular
DAY Parallel Perpendicular
Mean Std N_val Mean Std N_val Mean Std N_val Mean Std N_val
Campaign 1 0.18 0.19 172 0.16 0.20 34 Campaign 1 0.15 0.15 166 0.23 0.24 6
Campaign 2 0.13 0.15 104 0.34 0.39 5 all Campaign 2 0.13 0.09 99 0.07 0.00 1 all
Campaign 3 0.14 0.17 34 0.05 0.06 41 Campaign 3 0.13 0.12 137 0.05 0.09 12
Campaign 1 0.21 0.22 99 0.16 0.20 34 Campaign 1 0.32 0.24 31 0.28 0.24 5
Campaign 2 0.17 0.18 48 0.34 0.39 5 <2 Campaign 2 0.25 0.17 7 0.07 0.00 1 <2
Campaign 3 0.14 0.18 31 0.07 0.07 25 Campaign 3 0.25 0.20 24 0.17 0.21 2
Campaign 1 0.16 0.14 43 NaN NaN 0 Campaign 1 0.10 0.07 82 0.00 0.00 1
Campaign 2 0.12 0.12 30 NaN NaN 0 2<Uref<4 Campaign 2 0.13 0.09 46 NaN NaN 0 2<Uref<4
Campaign 3 0.09 0.01 3 0.03 0.02 14 Campaign 3 0.12 0.09 85 0.03 0.02 6
Campaign 1 0.10 0.04 30 NaN NaN 0 Campaign 1 0.13 0.09 53 NaN NaN 0
Campaign 2 0.06 0.02 26 NaN NaN 0 >4 Campaign 2 0.11 0.05 46 NaN NaN 0 >4
Campaign 3 NaN NaN 0 0.01 0.01 2 Campaign 3 0.07 0.03 28 0.02 0.01 4
Results: Exchange velocity
𝑈𝑒 𝑈𝑟𝑒𝑓 =𝑢′𝑤′ + 𝑢𝑤
𝑈𝑟𝑒𝑓(𝑈𝑟𝑒𝑓 − 𝑈𝑐
We focus on the cases Uref <2m/s (majority of data)
We start analysing CFD results (NIGHT, isothermal conditions):
- Campaign 1 (large LAI) and Campaign 3 (low LAI)
- For each Campaign, we performed two simulations: one for the parallel and one for the perpendicular wind
(directions represent the mode of field data)

TKE/u*2
z=4.5m (below tree crown)
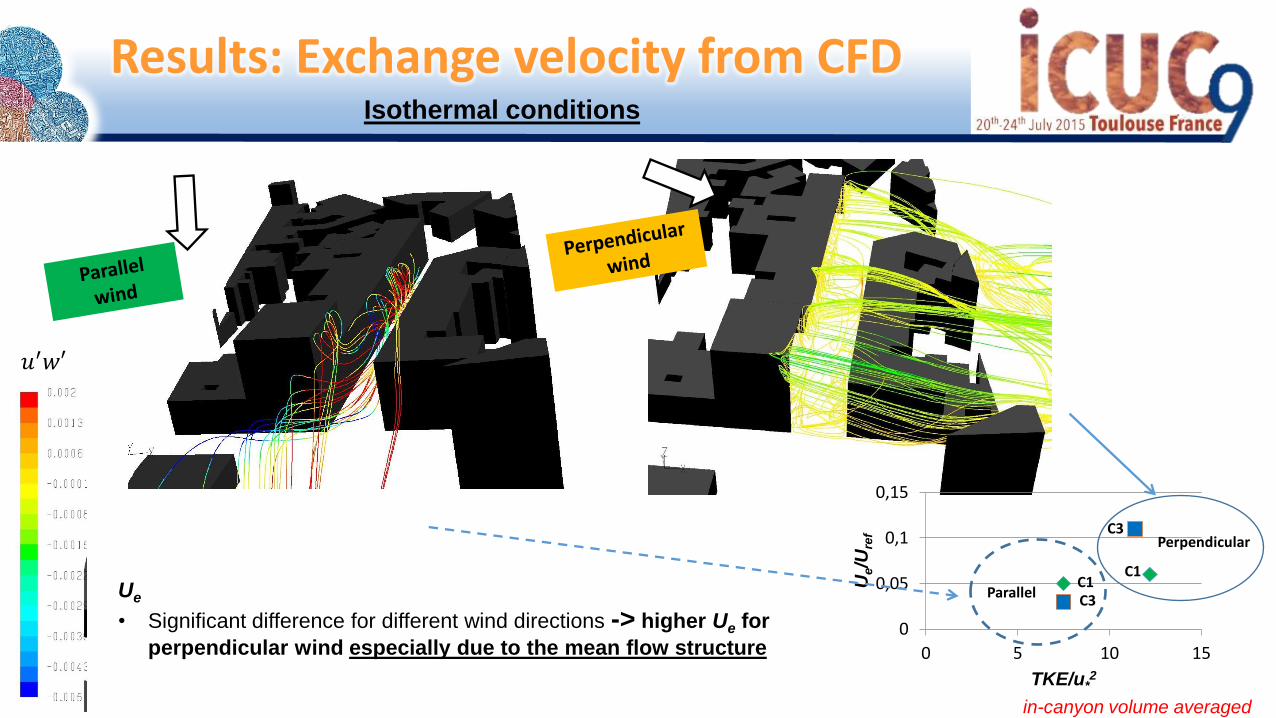
in-canyon volume averaged
Campaign 1 (large LAI) Campaign 3 (low LAI)
0
0,05
0,1
0,15
0 5 10 15
Ue/U
ref
TKE/u*2
Parallel
Perpendicular
C3
C3
C1 C1
TKE
• Slightly larger TKE for large LAI (C1) (below
tree crown). The same occurred at z=8.5m
(above tree crown)
• When averaged over all the in-canyon
volume, no significant difference in TKE
due to different LAI!
Ue
• Significant difference for different LAI
especially for perpendicular wind -> higher Ue
for low LAI (C3) due to lower blockage effect
Results: TKE from CFD Isothermal conditions
in-canyon volume averaged
0
0,05
0,1
0,15
0 5 10 15
Ue/U
ref
TKE/u*2
Parallel
Perpendicular
C3
C3
C1 C1
Ue
• Significant difference for different wind directions -> higher Ue for
perpendicular wind especially due to the mean flow structure
Results: Exchange velocity from CFD Isothermal conditions
𝑢′𝑤′

𝜷 =reduction of the exchange plane = (1-(Atree/AC))
𝜷 <<1 (𝑨𝒆 → 𝟎)
𝜷 intermediate
𝜷 ~1 (𝑨𝒆 → 𝑨𝑪)
Results: Ue vs exchange reduced plane
In urban canopies, 𝐭𝐡𝐞 𝐞𝐱𝐜𝐡𝐚𝐧𝐠𝐞 𝐚𝐫𝐞𝐚 𝑨𝑪 is assumed constant (l𝐞𝐧𝐠𝐡𝐭 × width of the canyon), while in our case 𝑨𝑪 varies with crown size, leaf density, season... in other words the plane of exchange is reduced
We thus estimate an effective exchange area 𝑨𝒆 = 𝑨𝑪 𝒙 𝜷 𝑨𝒕𝒓𝒆𝒆 = 𝐋𝐀𝐈𝒓
𝟐𝑾𝑵𝝅𝒓𝟐
r = crown radius W = width of the canyons N = number of trees
if 𝜷 ≠ 1

Campaign 1 – large LAI
Campaign 2 – Intermediate LAI
Campaign 3 – low LAI
CFD – Campaign 1
CFD – Campaign 3
Results: Exchange velocity
𝑈𝑒 𝑈𝑟𝑒𝑓 =𝑢′𝑤′ + 𝑢𝑤
𝑈𝑟𝑒𝑓(𝑈𝑟𝑒𝑓 − 𝑈𝑐
Field data show opposite results, i.e.: - Ue is higher for parallel wind - Ue is higher for large LAI (Camp. 1) Uref<2m/s
𝑈𝑒 𝑈𝑟𝑒𝑓 =𝑢′𝑤′
𝑈𝑟𝑒𝑓(𝑈𝑟𝑒𝑓 − 𝑈𝑐
We obtained the same behaviour as for the formulation with 𝑢𝑤
This implies that for large LAI, even though there is windbreak (as
shown before), Ue is higher due to more turbulence (probably from
leaves which the CFD does not take into account for) and thus there is a
large exchange in-out of the canyon
• This may imply that the
turbulent part is more
important than the mean
counterpart (the latter
dominates in the CFD results)
• We thus investigated the
contribution of 𝑢′𝑤′
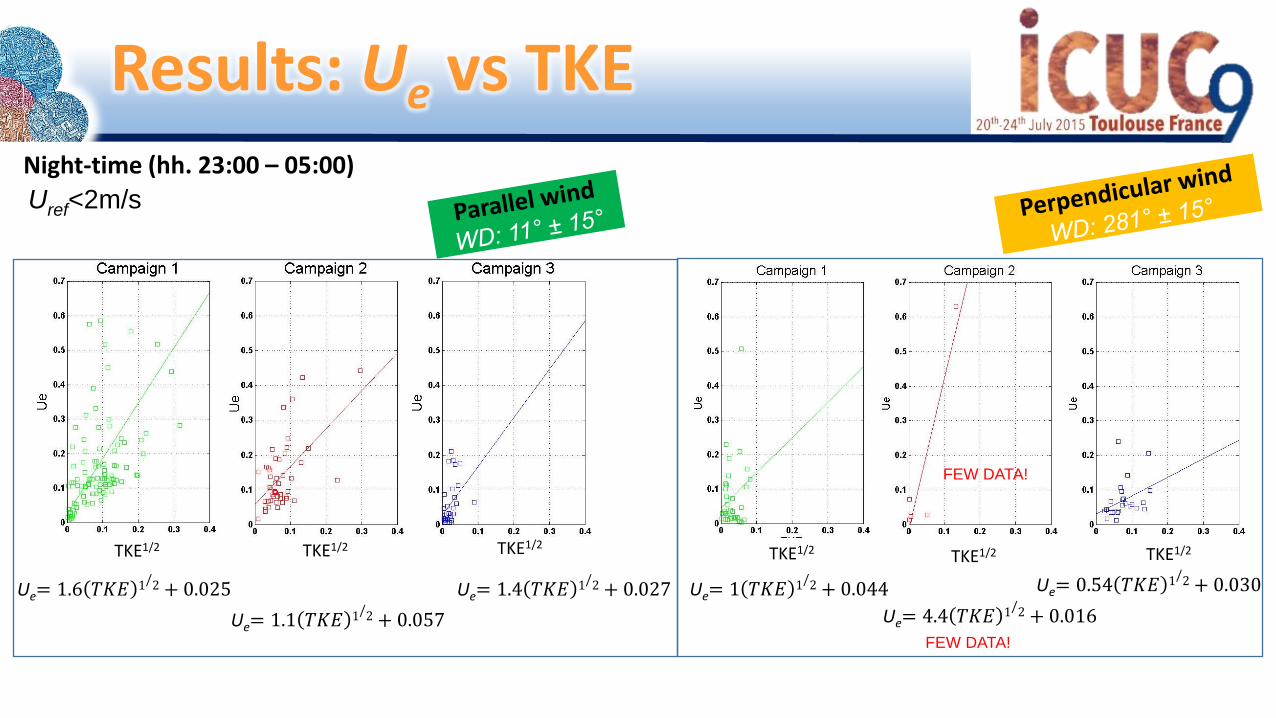
Night-time (hh. 23:00 – 05:00)
Results: Ue vs TKE
Uref<2m/s
Ue= 1.6 𝑇𝐾𝐸 1/2 + 0.025
Ue= 1.1 𝑇𝐾𝐸 1/2 + 0.057
Ue= 1.4 𝑇𝐾𝐸 1/2 + 0.027 Ue= 1 𝑇𝐾𝐸 1/2 + 0.044
Ue= 4.4 𝑇𝐾𝐸 1/2 + 0.016
Ue= 0.54 𝑇𝐾𝐸 1/2 + 0.030
FEW DATA!
TKE1/2 TKE1/2 TKE1/2 TKE1/2 TKE1/2 TKE1/2
FEW DATA!
Conclusions
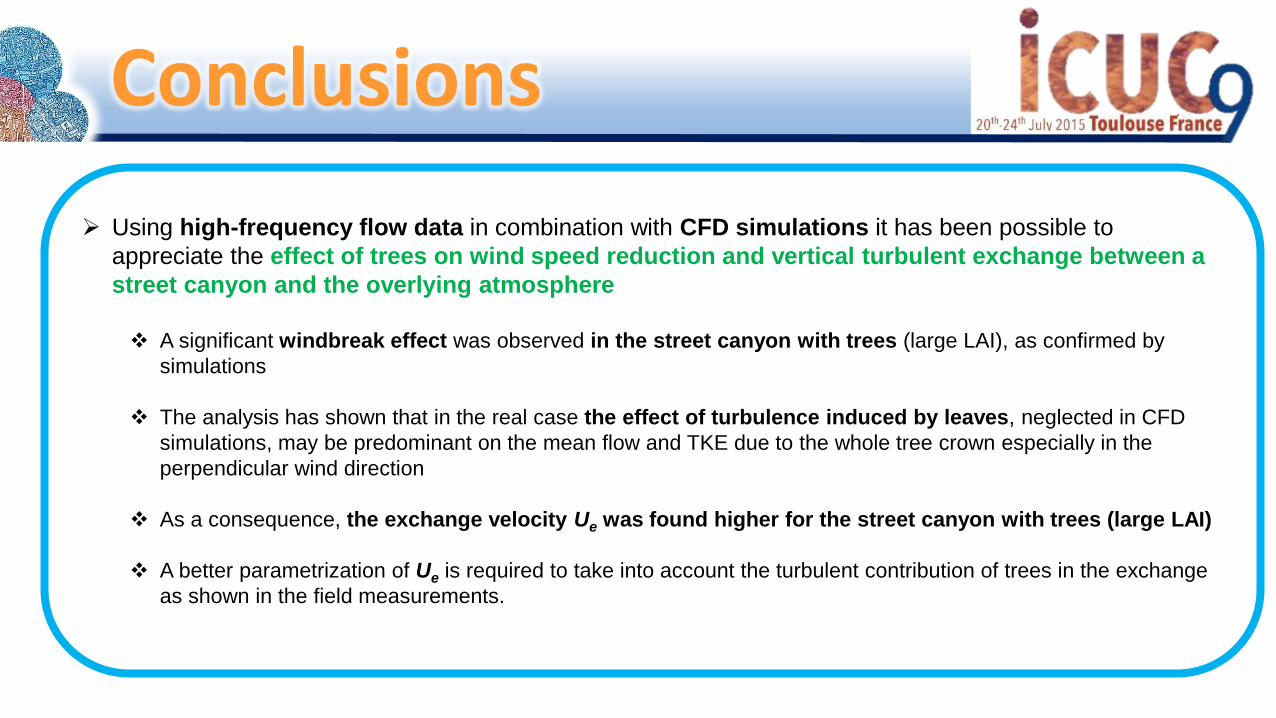
Using high-frequency flow data in combination with CFD simulations it has been possible to
appreciate the effect of trees on wind speed reduction and vertical turbulent exchange between a
street canyon and the overlying atmosphere
A significant windbreak effect was observed in the street canyon with trees (large LAI), as confirmed by
simulations
The analysis has shown that in the real case the effect of turbulence induced by leaves, neglected in CFD
simulations, may be predominant on the mean flow and TKE due to the whole tree crown especially in the
perpendicular wind direction
As a consequence, the exchange velocity Ue was found higher for the street canyon with trees (large LAI)
A better parametrization of Ue is required to take into account the turbulent contribution of trees in the exchange
as shown in the field measurements.

Aknowledgements The authors wish to thank the Dipartimento di Ingegneria dell’Innovazione - University of Salento for making
available ANSYS Fluent
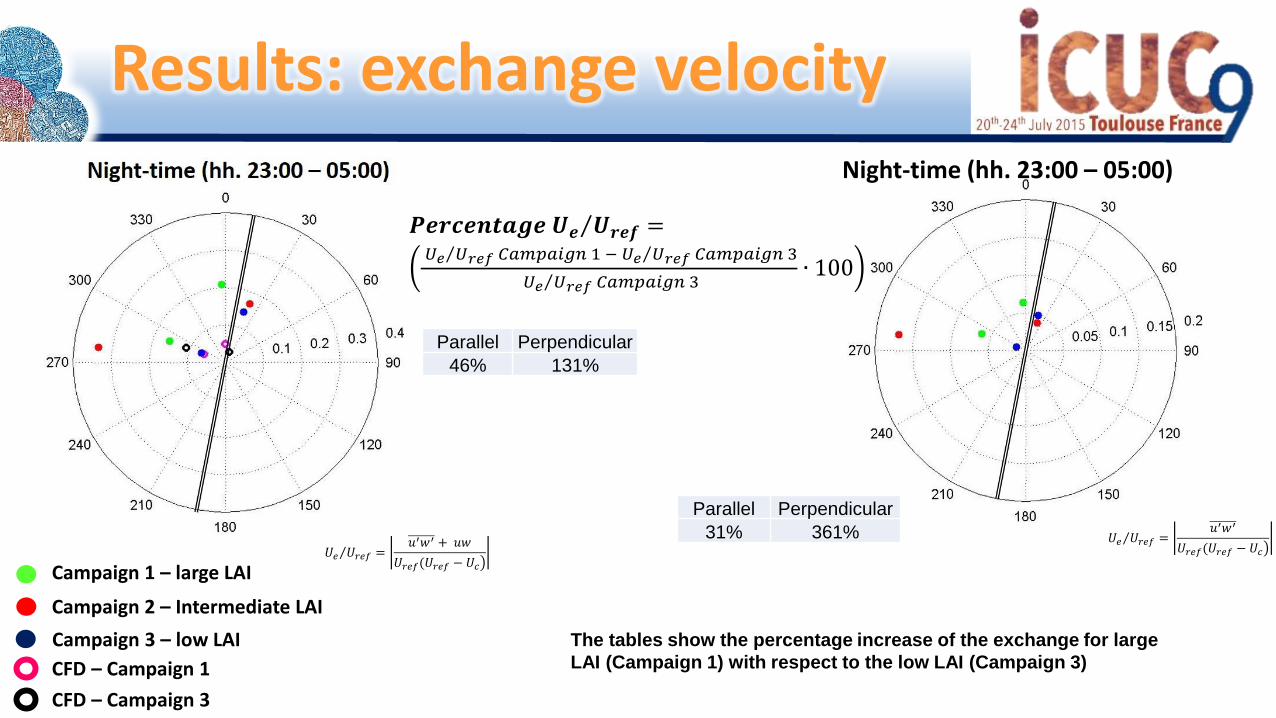
Results: exchange velocity
Parallel Perpendicular
46% 131%
𝑷𝒆𝒓𝒄𝒆𝒏𝒕𝒂𝒈𝒆 𝑼𝒆 𝑼𝒓𝒆𝒇 = 𝑈𝑒 𝑈𝑟𝑒𝑓 𝐶𝑎𝑚𝑝𝑎𝑖𝑔𝑛 1 − 𝑈𝑒 𝑈𝑟𝑒𝑓 𝐶𝑎𝑚𝑝𝑎𝑖𝑔𝑛 3
𝑈𝑒 𝑈𝑟𝑒𝑓 𝐶𝑎𝑚𝑝𝑎𝑖𝑔𝑛 3∙ 100
Parallel Perpendicular
31% 361% 𝑈𝑒 𝑈𝑟𝑒𝑓 =
𝑢′𝑤′ + 𝑢𝑤
𝑈𝑟𝑒𝑓(𝑈𝑟𝑒𝑓 − 𝑈𝑐
Night-time (hh. 23:00 – 05:00)
𝑈𝑒 𝑈𝑟𝑒𝑓 =𝑢′𝑤′
𝑈𝑟𝑒𝑓(𝑈𝑟𝑒𝑓 − 𝑈𝑐
Campaign 1 – large LAI
Campaign 2 – Intermediate LAI
Campaign 3 – low LAI
CFD – Campaign 1
CFD – Campaign 3
The tables show the percentage increase of the exchange for large
LAI (Campaign 1) with respect to the low LAI (Campaign 3)
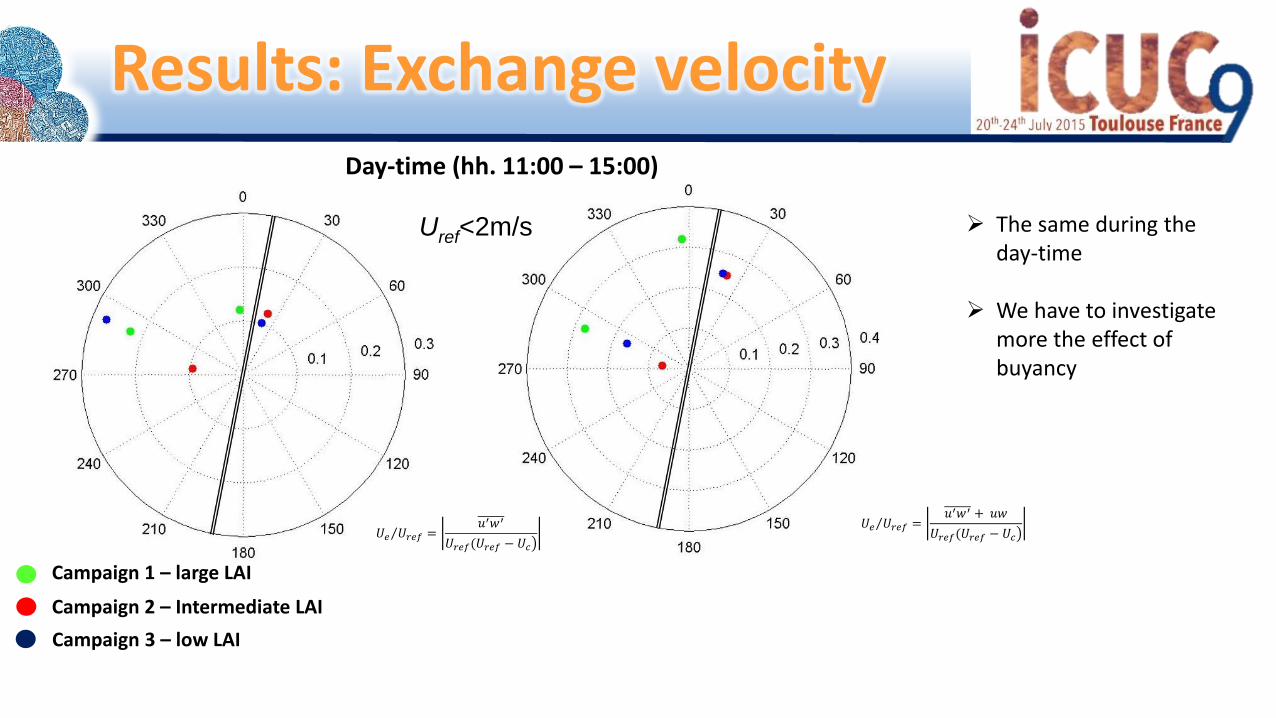
Results: Exchange velocity
𝑈𝑒 𝑈𝑟𝑒𝑓 =𝑢′𝑤′
𝑈𝑟𝑒𝑓(𝑈𝑟𝑒𝑓 − 𝑈𝑐
𝑈𝑒 𝑈𝑟𝑒𝑓 =𝑢′𝑤′ + 𝑢𝑤
𝑈𝑟𝑒𝑓(𝑈𝑟𝑒𝑓 − 𝑈𝑐
Uref<2m/s The same during the day-time
We have to investigate more the effect of buyancy
Day-time (hh. 11:00 – 15:00)
Campaign 1 – large LAI
Campaign 2 – Intermediate LAI
Campaign 3 – low LAI