on the current state of the stock market rationality ... · on the current state of the stock...
TRANSCRIPT
ON THE CURRENT STATE OF THE STOCKMARKET RATIONALITY HYPOTHESIS*
Robert C. Merton
Working Paper #1717-85 October 1985
*Presented at the Italian-American Conferencein Honor of Franco Modigliani, at Martha'sVineyard, September 19-20, 1985.
ON THE CURRENT STATE OF THE STOCKMARKET RATIONALITY HYPOTHESIS
Robert C. MertonMassachusetts Institute of Technology
September 1985
Introduction
The foundation for valuation in modern financial economics is the rational
market hypothesis. It implies that the market price of a security is equal to
the expectation of the present value of the future cash flows available for
distribution to that security where the quality of the information embedded in
that expectation is high relative to the information available to the
individual participants in the market. As has been discussed at length
elsewhere,l the question whether this hypothesis is a good approximation to
the behavior of real-world financial markets has major substantive
implications for both financial and general economic theory and practice.
1 See Fischer and Merton (1984); Marsh and Merton (1983; forthcoming);
Merton (1983).
-2-
The rational-market hypothesis provides a flexible framework for
valuation. It can, for example, accommodate models where discount rates are
stochastic over time and statistically dependent on future cash flows. It can
also accommodate nonhomogeneity in information and transactions costs among
individual market participants. The theory is not, however, a tautology. It
is not consistent with models or empirical facts which imply that either stock
prices depend in an important way on factors other than the fundamentals
underlying future cash flows and discount rates, or that the quality of
information reflected in stock prices is sufficiently poor that investors can
systematically identify significant differences between stock price and
fundamental value.
Although the subject of much controversy at its inception more than two
decades ago, the rational market hypothesis now permeates virtually every part
of finance theory. It has even become widely accepted as the "rule" (to which
one must prove the exception) for finance practice on Wall Street, LaSalle
Street, and in courtrooms and corporate headquarters. However, recent
developments in economic theory and empirical work have again cast doubts on
the validity of the hypothesis. Representing one view, Summers [1985] sees
much of the renewed controversy as little more than a case of financial
economists and general economists engaging in a partisan diversion of
intellectual effort over methodological questions instead of focusing on sound
research on major substantive questions.2 He sees this development as only
hastening an apparent secular trend toward inefficient disjunction between the
fields of finance and economics on subjects of conjoint research interest.
Perhaps that is so. But I must confess to having quite the opposite view on
these same research efforts with regard to both their substance and their
-3-
presumed dysfunctional effects on the fields of finance and economics.
However, to pursue this issue further would only be an exercise in
self-refutation. Thus, it suffices to say that whether market rationality is
viewed as a "hot topic" or as merely a "topic with too much heat," an analysis
of the current state of research on this issue would appear timely-especially
so, on this occasion honoring Franco Modigliani, past-President of both the
American Economic Association and the American Finance Association and prime
counterexample to the Summers doctrine.
This paper focuses on the central economic question underlying the issue
of stock market rationality: Do real-world capital markets and financial
intermediaries, as a practical matter, provide a good approximation to those
ideal-world counterparts which are necessary for efficient investor
riskbearing and efficient allocation of physical investment? Although
satisfaction of the rational market hypothesis is surely not sufficient to
2 As may come as a great surprise to those financial economists whoregularly publish papers on capital budgeting problems, earningsestimation, financing decisions and dividend policy, Summers [1985, p.634] finds it rather "...unfortunate that financial economists remain soreluctant to accept any research relating asset prices and fundamentalvalues." In making this remark, perhaps Summers has in mind thosefinancial economists who might select the closing price on the New YorkStock Exchange of a ketchup company's common stock as a better estimate ofthat firm's fundamental value than an estimate provided by a generaleconomist who computes a present value based on a linear regression modelof the supply and demand for ketchup; autoregressive forecasts of futurecosts of tomatoes, wages, prices of ketchup substitutes, and consumerincomes; and a "reasonable" discount rate.
III
-4-
ensure efficient-allocations, its broad-based rejection is almost certainly
sufficient to rule out efficient allocations.3
From this perspective on the issue, it matters little whether or not
real-world dealers and deal-makers can "scalp" investors and issuers as long
as their profits are a small fraction of aggregate transactions in important
and well-established markets. Similarly, it matters little for this issue if,
as suggested by Van Horne (1985), promoters often make large-percentage
profits during the transient period of time between the inception of a new
financial product (or market) and the widespread acceptance (or rejection) of
the product by investors and issuers.
In evaluating market rationality as it bears on economic efficiency, it
matters very much if stock prices generally can be shown to depend in an
important way on factors other than fundamentals. It also matters very much
if it can be shown that either academic economists or practitioners
systematically provide better forecasts of fundamental values than stock
prices do. Thus, this analysis focuses on empirical work on aggregate stock
price behavior, and especially the new volatility test methodologies, which
appear to provide evidence of this very sort.
3 As is well known, even with well-functioning (although not complete)markets and rational, well-informed consumer-investors, the competitivemarket solution may not be a pareto optimum, and thus, market rationalityis not a sufficient condition for efficiency. Using the neoclassicalmodel with overlapping generations, Tirole (1985)has shown that financialsecurity prices that deviate from fundamentals can lead to betterallocations than "rational" prices. However, I would argue that thosecases in which stock prices both deviate substantially from fundamentalvalues and lead to a pareto optimum allocation of investment are, at best,rare.

-5-
Although these empirical findings have had the most immediate effect in
reviving the controversy over stock market rationality, some of the emerging
developments in theory may prove, in the longer run, to be more important in
resolving the controversy. Before proceeding with the analysis of empirical
work, therefore, I pause briefly to comment on two of the more promising
candidates to supersede the rational market theory.
Grounded in the sociological behavioral theory of the self-fulfilling
prophecy, the theory of rational expectations speculative bubbles4 in effect
provides a theoretical foundation for answering the "If you are so smart, why
aren't you rich?" question underlying the rational market argument that fully-
recognized, sizable, and persistent deviations between market price and
fundamental value must necessarily provide "excess profit" opportunities for
either investors or issuers. As we know, however, from the work of Tirole
(1982), the interesting conditions under which such rational bubble equilibria
can exist are still to be determined. In particular, if the theory is to be
applied to the aggregate stock market in realistic fashion, then it must
accommodate both "positive" and "negative" bubbles in a rational expectations
framework. Such application would seem to require a satisfactory process to
explain both the limits on share repurchase by firms when prices are
persistently below marginal production cost and the limits on the creation of
new firms with "instant profits" for the promoters in periods when general
stock market prices significantly exceed that marginal cost.
4 On the self-fulfilling prophecy, see R.K. Merton, (1948). On the rationalexpectations speculative bubble theory, see Blanchard (1979); Blanchardand Watson (1982); Tirole (1982); and Van Horne (1985).

-6-
Although-few-economists would posit irrational behavior as the foundation
of their models, many, of course, do not subscribe to the sort of "super
rational" behavior implied by the rational expectations theory (with or
without bubbles). Based on the pioneering work of Kahneman and Tversky
[1979,1982], the theory of cognitive misperceptions (by which I mean the
observed set of systematic "errors" in individual decision making under
uncertainty) may become a base from which economic theory formally
incorporates nonrational (or as some economists have described it,
"quasi-rational") behavior.
As discussed in Arrow (1982), the empirical findings of such systematic
misperceptions in repeated laboratory experiments appear sound and there would
also appear to be many test cases within economics. In terms of both the
current state of empirical evidence in cognitive psychology and financial
economics, it would seem somewhat premature, however, to conclude that
cognitive misperceptions are an important determinant of aggregate stock
market behavior. Specifically, the same sharp empirical findings of cognitive
misperceptions have not (at least to my knowledge) been shown to apply to
individual decision making when the individual is permitted to interact with
others (as a group) in analyzing an important decision and when the group is
repeatedly called upon to make similar types of important decisions. But,
this is, of course, exactly the environment in which professional investors
make their stock market decisions.
If professional investors are not materially affected by these cognitive
misperceptions, then it would seem that either competition among professional
investors would lead to stock prices which do not reflect the cognitive errors
of other types of investors, or professional investors should earn substantial
III

-7-
excess returns by-exploiting the deviations in price from fundamental value.
Unlike the theory of rational expectations bubbles with its self-fulfilling
prophecy, there is no a priori reason in this theory to believe that investment
strategies designed to exploit significant deviations of price from
fundamental value will not be successful. However, as shown in the following
section, rather robust evidence indicates that professional investors do not
earn substantial excess returns.
These two theories, along with Shiller's (1984) theory of fads, explicitly
incorporate in an important way positive theories of behavior derived from
other social sciences. In doing so, they depart significantly from the
"traditional" approach of mainstream modern economic theory: namely, to
derive the positive theories of "how we do behave" almost exclusively from
normative economic theories of "how we should behave." Whether these theories
throw light on the specific issue of aggregate stock market rationality, it
will surely be interesting to follow the impact on economic theory generally
from these attempts to bring economics "back into line" with the rest of the
social sciences.

-8-
Empirical Studies of Stock Market Rationality
In his seminal 1965 paper proving the martingale property of
rationally-determined speculative price changes, Paul Samuelson was careful to
warn readers against interpreting conclusions drawn from his model about
markets as empirical statements:
You never get something for nothing. From a nonempirical baseof axioms, you never get empirical results. Deductive analysiscannot determine whether the empirical properties of thestochastic model I posit come close to resembling the empiricaldeterminants of today's real-world markets. (p. 42)
One can hardly disagree that the question whether stock market rationality
remains a part of economic theory should be decided empirically. There is,
however, a complication: we have no statute of limitations for rejecting a
theory. To the extent that one assumes the advancement of knowledge, it is
the fate of all theory to be encompassed, superseded, or outright rejected in
the long run. Nevertheless, at any moment, one must choose: either to
continue to use the theory or to discard it. It is with this choice in mind
that I examine the empirical evidence to date on stock market rationality.
As economists have cause to know well, the "long run" in economic behavior
can indeed be long. Having already sustained itself for at least twenty
years, the rational market theory exemplifies this same fact-here in the
history of economic science instead of in the history of economic behavior.
5 This assumes as a "base date" the publication of Samuelson's 1965 paperwhich first set forth the theory in rigorous form. There was, of course,the oral publication of his ideas for at least fifteen years before 1965,as well as many studies of speculative prices and their random properties,extending back as far as the early 1900s.
111
-9-
The longevity of-the theory can surely not be attributed to neglect on the
part of economists bent on putting it to empirical test. I have not made any
formal comparisons, but I suspect that over these twenty years, few, if any,
maintained hypotheses in economic theory have received as much empirical
attention as the rational market hypothesis. Indeed, there have probably been
too many such tests. Although it is likely that this claim could be supported
on the grounds of optimal resource allocation alone, the case is made here
solely on statistical grounds. In preparation for this and other matters
which bear on the testing of market rationality, I briefly review the history
of these tests.
About the time that Samuelson's fundamental paper appeared in print, what
has since become the Chicago Center for Research in Security Pricing completed
the construction of a file of prices and related data on all New York Stock
Exchange-listed stocks from 1926-1965. This file has been periodically
updated and expanded to include other exchanges so that there are now
available almost sixty years of monthly data and more than twenty years of
daily data on thousands of stocks. In addition, Robert Shiller of Yale has
created a return file for the aggregate stock market with data going back to
1872.
There had been some earlier empirical studies of the randomness of
speculative price changes, but the availability of a large-scale, easily
accessible data base caused a flurry of such studies beginning in the
mid-1960s. From simple runs and serial correlation tests to sophisticated
filtering and spectral analysis, the results were virtually uniform in finding
no significant serial dependencies in stock returns. The few cases of
significant serial correlation were small in magnitude and short-lived

-10-
(disappearing over a matter of a few days), and they could largely be
explained by specialist activities for individual stocks or
"non-contemporaneous trading effects" for portfolios of stocks. These
findings were, of course, consistent with the Samuelson martingale property as
a necessary condition for rationally-determined prices.
Financial researchers at this time were aware of the possibility that a
significant part of this randomness could be from random "animal spirits"
which would cause prices to deviate from fundamental values. There was,
however, a wide-spread belief that the empirical evidence did not support this
alternative to market rationality. The foundation for this belief was the
assumption that even with animal spirits, in the long run, stock prices will
converge in the statistical equilibrium sense to their fundamental values.
From this assumption, it follows that deviations from fundamental values will,
by necessity, induce serial dependencies in stock returns.6 If such
deviations were significant, then these dependencies should be detectable as,
for example, systematic patterns in the long-wave frequencies of the spectral
analysis of stock returns. Moreover, there had been empirical studies of
"relative strength" portfolio strategies which should do well if the market
"underreacts" to information and of "relative weakness" (contrary opinion)
portfolio strategies which should do well if the market tends to "overreact"
to information. Neither of these produced significant results. Working
6 See, for example, the model analyzed in Merton (1971, pp. 403-406) whichexamines price behavior and optimal portfolio selection when instantaneousstock price changes are random, but the level of stock price regressestoward a "normal price level" with a trend.
7 As will be discussed, the recent study by De Bondt and Thaler (1985)presents evidence that seemingly contradicts these earlier findings.
III
-11-
along similar lines were the studies of stocks which appear on the most active
trading list or which had moved up or down by usually large amounts, designed
to look for evidence of under- or overreaction. Once again, no significant
findings. Thus, it appeared at the time that the empirical evidence not only
gave support to Samuelson's necessary condition for rationally-determined
prices, but also failed to lend support to the alternative hypothesis of
random animal spirits.
As we know today from the work of Summers (1982) and others, many of these
studies provided rather weak tests for detecting the types of generalized
serial correlations which random animal spirits might generate, especially
when the speed of reversion to fundamental values is slow. However, the
concern in the 1960s was over another issue surrounding the power of these
tests: the selective bias inherent in "secret models."
As the cynical version of the story goes, one could not lose by testing
market rationality. If, indeed, significant empirical violations were found,
one could earn gold, if not glory, by keeping this discovery private and
developing portfolio strategies to be sold to professional money managers who
would take advantage of these violations. If, instead, one found no
significant violations, then this (financial) "failure" could be turned into
academic success by publishing the results in the scientific Journals. Thus,
while each study performed might represent an unbiased test, the collection of
such studies published were likely to be biased in favor of not rejecting
market rationality. Unlike the more-generally applicable claim for "quality"
bias that studies which are consistent with the accepted theory are subject to
less scrutiny by reviewers than ones which purport to reject it, the potential
for material effects from "profit-induced" biases is probably specialized

-12-
within economic analyses to studies of speculative prices.
One need not, however, accept this cynical characterization of academic
financial researchers to arrive at much the same conclusion. The portfolio
strategies tested by academics were usually simple and always mechanical;
therefore, the fact that they yielded no evidence of significant profit
opportunities is perhaps no great surprise. However, real-world professional
investors with significant resources might well have important information
sources and sophisticated models (be they of fundamentals or market
psychology) that are used to systematically beat the market. As this version
of the story goes, if only the academics could gain access to these
proprietary models, they would quickly be able to reject the rational market
hypothesis. Unfortunately, one assumes that few successful professional
investors are likely to reveal their hypothetically profitable models, and
thereby risk losing their source of income, simply to publicly refute the
rationally-determined price hypothesis of economists (which by hypothesis they
have, of course, already determined privately to be false.) Thus, it would
seem that the possibility of proprietary models would, at least, significantly
weaken, and in all likelihood, bias, the academic tests of market rationality.
Concern over the "secret model" problem led to the next wave of empirical
tests for which the pioneering study of the mutual fund industry by Jensen
(1968) serves as a prototype. The basic assumptions underlying these tests
hold that if such models exist, then professional investors have them, and if
they have them, then the results should show themselves in superior
performance (at least, before expenses charged to investors) of the funds they
managed. Tracking the performance of 115 investment companies over the period
1945-1964, Jensen found no significant evidence of superior performance for
-13-
the fund industry as a whole. Later work by Jensen and others also found no
evidence that individual investment companies within the industry had superior
performance. That is, it was found that for any fund which had outperformed
the naive market strategy of investing in the past, the odds of the same fund
doing so in the future were essentially fifty-fifty. Similar studies
subsequently made of the performance of other professional investor groups
(e.g., insurance company equity funds; bank trust departments) came to much
the same results. Moreover, as I have indicated in my preliminary remarks,
these findings have remained robust to date.8
To be sure, the variances of the returns on these managed portfolios are
sufficiently large that although the point estimates of the excess returns in
these studies support the null hypothesis of no superior performance, they
cannot reject the alternative null hypothesis that the managers do provide
sufficient performance to earn the 25-100 basis points they charge. This fact
may be important to the economics of the money management industry, but is
inconsequential for the broader question of market rationality as a good
approximation to the real-world stock market. That is, the undiscovered
existence of proprietary models is not likely to provide an important
8 Jensen (1968) found that the average "excess return" per year (includingmanagement expenses) across all funds in his sample and all the years from1945-1964, was -1.1 percent, and 66 percent of the funds had negativeaverage excess returns. When expenses were excluded, the correspondingstatistics were -0.4 percent per year and 48 percent. As reported in arecent Business Week article (February 4, 1985; pp. 58-59), based on theindustry standard data from SEI Funds Evaluation Services, 74 percent ofmanaged equity portfolios underperformed the Standard & Poor's 500 Indexin 1984; 68 percent underperformed for the period 1982-1984; 55 percentunderperformed from 1980-1984; and 56 percent underperformed from1975-1984.
-14-
explanation for~the rational market hypothesis having remained unrejected for
so long a time.
During the period of the 1960s and early 1970s, the overwhelming majority
of empirical findings continued to support the market rationality theory [cf.
Fama (1970)]. Indeed, editors of both finance and broader economic journals,
quite understandably, became increasingly reluctant to allot scarce journal
space to yet another test which did not reject market rationality. Despite
the mountain of accumulated evidence in support of the hypothesis, there were
a relatively few of the empirical studies conducted during this period which
did not seem to fit the rational market model. For example, low
price-to-earnings ratio stocks seem to systematically earn higher average
returns (even after correcting for risk differences) than high
price-to-earnings ratio stocks. This "PE effect," later renamed the "small
stock effect" after it was shown to be more closely associated with firm size
than PE ratios, still remains a puzzle. Some other anomalies were the finding
of various seasonal regularities such as the "January effect" and
"the-day-of-the-week effect," and still another is the behavior of stock
returns after a stock split. As the number of such puzzles gradually
accumulated, the apparently closed gate on the empirical issue of market
rationality began to reopen. Indeed, by 1978, even the Journal of Financial
Economics (with its well-known editorial view in support of market
rationality) devoted the entire June-September issue to a symposium on
anomalous evidence bearing on market efficiency.
During this period, there were a number of empirical findings in the
general economics literature which also cast doubt on the hypothesis of market
rationality. Time series calculations of Tobin's Q appeared to suggest that

-15-
stock market priees were too high at times while much too low at others, to be
explained by economic fundamentals alone. Modigliani and Cohn (1979)
presented a theory and empirical evidence that stock prices were irrationally
low during the 1970s because investors failed to take correct account of the
radically-increased levels of the inflation rate in assessing expected future
corporate profits and the rate at which they should be discounted.
Collectively these findings raised questions about the validity of stock
market rationality, but they were hardly definitive. Some were found to be
significant in one time period, but not in another. Others, such as Long's
(1978) study on the market valuation of cash dividends, focused on a small
sample of obscure securities. Virtually all shared the common element of
testing a joint hypothesis with other important and unproven assumptions in
addition to stock market rationality. There is, for example, the common joint
hypothesis of stock market rationality and prices that are formed according to
(one or another tax version) of the Capital Asset Pricing Model. Thus, at
most, these tests rejected a hypothesis including stock market rationality but
also other assumptions which, on a priori grounds, could reasonably be argued
as less likely to obtain than market rationality.
During the past five years, a series of tests based upon the volatility of
stock prices have produced seemingly new evidence of market nonrationality
that some consider relatively immune to these criticisms of the earlier
apparent rejections. One group of these tests pioneered by LeRoy and Porter
(1981) and Shiller (1981) has focused on the volatility of aggregate stock
market price relative to either aggregate earnings or dividends over long time
periods (in the case of the former, for the post-war period and in the latter,
since before the turn of the century). Their findings have been interpreted

-16-
as confirming the long-felt-but-unproved belief among some economists that
stock prices are far more volatile than could ever be justified on fundamental
evaluations alone.
A second group of tests examines the short-run volatility of stock price
changes from one trading day to the next. It was known in the 1960s that the
measured variance rate on stock returns is significantly lower over short time
periods including weekends and holidays when the market is closed than over
the same-length time periods when the market is open every day. The "rational"
explanation given for this "seasonal" observation on volatility held that with
businesses and many government activities closed, less new information is
produced on these nontrading days than on trading days when they are open.
However, using a period in the 1960s when the stock market was closed on every
Wednesday, French and Roll (1984) show that the previously-identified lower
stock return volatility over short time periods that include a nontrading day
applied to the Wednesday closings as well. Because nonspeculative market
activities were generally open on these Wednesdays, the earlier presumed
explanation was thus plainly inadequate. It would appear that market trading
itself seems to cause increased volatility in market prices, and some
interpret this finding as evidence against market prices being based on
fundamentals alone.
Explaining why rationally-determined speculative price changes would
9 To the extent that stock market prices themselves are an important sourceof information for investors in calibrating and evaluating other data usedto make their assessments of the fundamentals, the original argument thatsystematically less information is produced on days when the market isclosed can be extended to include the Wednesday closings.
III

-17-
exhibit the martTngale property even though the underlying economic variables
upon which these prices are formed may have considerable serial dependencies,
Samuelson (1965, p. 44) writes: "We would expect people in the marketplace,
in pursuit of avid and intelligent self-interest, to take account of those
elements of future events that in a probability sense may be discerned to be
casting their shadows before them." The empirical evidence to date has been
remarkably robust in finding no important cases of either lagged variables
explaining stock price returns or of real-world investors (who make their
decisions without benefit of even a peek into the future) being able to beat
the market. This impressive success in confirming the ex ante component of
the theory's prophecy has not, however, been matched in confirming its ex post
component: namely, one should be able to find current or future economic
events related to the fundamentals that, on average, explain current and past
changes in stock prices.
As has been discussed elsewhere [cf. Fama (1981); Fischer and Merton
(1984); Marsh and Merton (1983;1985)], the change in aggregate stock prices is
an important leading indicator of macro economic activity. Indeed, it is the
best single predictor of future changes in business fixed investment,
earnings, and dividends. Moreover, the forecast errors in the realization of
future earnings changes are significantly correlated with the
then-contemporaneous changes in stock prices. Nevertheless, although the
writers for the popular financial press try hard, they often cannot identify
the specific economic events which are important enough to cause the aggregate
value of the stock market to change by as much as two percent in a single day.
At the micro level, the accounting and finance literatures are populated
with studies of the behavior of individual stock prices, on, before, and
��__1_11____ _

-18-
after, the date of some potentially important event such as an earnings or
tender offer announcement. These "event" studies lend some support to the ex
post component of market rationality by showing that stock price changes
predict many such events; respond quickly and in an unbiased fashion to
surprises, and do not respond to seemingly important events which, in fact,
should not affect the fundamentals (e.g., "cosmetic" changes in accounting
earnings which have no impact on current or future cash flows). However, some
of these studies [cf. Ohlson and Penman (1985)], who find that stock price
return volatility appears to increase significantly after a stock split]
provide conflicting evidence which indicates that stock prices may be affected
by factors other than fundamentals.
Just as the strong empirical support for the ex ante component of market
rationality has moved the focus of theoretical research from models of
differential information to models of rational expectations bubbles, animal
spirits, and fads, so the relative lack of closure on the ex post component
seems to be the driving element behind the methodological focus of current
empirical tests of the hypothesis. Finance specialists seem to favor
short-term volatility or event studies while general economists favor
long-term studies, but both appear to agree that the statistical properties of
volatility tests make them the most promising approach for rejecting the
hypothesis of aggregate stock market rationality. The bulk of the formal
analysis in this paper is focused on the long-term volatility tests, leaving
for another occasion, the examination of the event-study approach. Before
undertaking that task, I digress to comment on a few, perhaps prosaic, but
nevertheless important issues that frame the testing of this hypothesis.
As we all know, what the stock market actually did from 1872-1985 is an

-19-
enumerable fact.- As such, those numbers do not change even as the number of
tests of the rational market hypothesis on these same data continues to grow.
As we also know, the standard test statistics used in these studies do not
reflect that fact. While, of course, the same comment could be made about
virtually every area of economic model testing [cf. Leamer (1983)], it perhaps
warrants more than usual attention in this case because of the unusually large
number of studies, the large number of observations in the data set, and the
magnitudes of unexplained volatility in stock prices.
As a case study of the problem, let us consider the regression study of
the hypothesis that the expected real rate of return on the market is a
constant, which is discussed in the Summers (1985) article. He writes:
Simple regression of real ex post stock returns onlagged dividend yields find that the nullhypothesis that the real ex ante rate is constantcan be rejected at almost any confidence level.(p. 635)
Although hardly a proponent of this null hypothesis in either theory or
practice [cf. Merton (1973;1980)], I would nevertheless argue that in making
his statement for apparently clear rejection, Summers does not take account of
the number of regressions, collectively, researchers have run of stock returns
on various contemporaneous and lagged variables. That some adjustment for
this fact could have material implications for the strength of his conclusion
is readily apparent from the negligible R2 or explanatory power of these
lagged yields. While one could perhaps argue on a priori grounds that
dividend yield is a reasonable surrogate variable for expected return, I can
report that much the same statistical significance results obtain (on the same
data set, of course) if one regresses returns on the reciprocal of current
m����� ���I_1I�---.--
-20-
stock price alone, omitting the dividend series altogether.1 0
If knowledge is to advance, we must seek out the exceptions, the puzzles,
the unexplained residuals and attempt to explain them. But, before problem
solution must come problem identification. Thus, economists place a premium
on the discovery of puzzles which in the context at hand amounts to finding
apparent rejections of a widely accepted theory of stock market behavior. All
of this fits well with what the cognitive psychologists tell us is our natural
individual predilection to focus, often disproportionately so, on the
unusual. As I have hinted earlier, this emphasis on the unusual has been
institutionalized by responsible and knowledgeable journal editors who
understandably look more favorably upon empirical studies which find anomalous
evidence with respect to a widely-accepted theory than upon studies which
merely serve to confirm that theory yet again. This focus, both individually
and institutionally, together with little control over the number of tests
performed, creates a fertile environment for both unintended selection bias
and for attaching greater significance to otherwise unbiased estimates than is
justified.
To clarify the point, consider this parable on the testing of
coin-flipping abilities. Some three thousand students have taken my finance
courses over the years and suppose that each had been asked to keep flipping a
coin until tails comes up. At the end of the experiment, the winner, call her
"A," is the person with the longest string of heads. Assuming no talent, the
10 See Marsh and Merton [1985]. Miller and Scholes [1982] find the sameresult for individual stock returns.

-21-
probability is greater than a half that "A" will have flipped 12 or more
straight heads. As the story goes, there is a widely believed theory that no
one has coin-flipping ability and hence, a researcher is collecting data to
investigate this hypothesis. Because one would not expect everyone to have
coin-flipping ability, he is not surprised to find that a number of tests
failed to reject the null hypothesis. Upon hearing of "A's" feat (but not of
the entire environment in which she achieved it), the researcher comes to MIT
where I certify that she did, indeed, flip 12 straight heads. Upon computing
that the probability of such an event occurring by chance alone is 212
or .00025, the researcher concludes that the widely believed theory of no
coin-flipping ability can be rejected at almost any confidence level.
Transformed to the context of tests of stock market rationality, what
empirical conclusion about the theory can be reached if we are told of a
certified discovery of a particular money manager who outperformed the market
in each and every year for twelve years? Even if the individual researcher
can further certify that the discovery of this apparently gifted manager was
by a random drawing, the significance of the finding cannot be easily
assessed. We know the population size of (past and present) money managers is
quite large. We also know that the number of researchers (past and present)
studying professional money management performance is not small. However, as
indicated, for quite legitimate individual and institutional reasons, results
that simply confirm the "norm" (of no significant performance capability) tend
not to be reported. Thus, the number of such random drawings undertaken
collectively by researchers is unknown and this makes the assessment of
significance rather difficult.
As we surely could do in the case of "A's" purported coin-flipping talent,
-22-
we might try to-resolve this problem by testing the money-manager's talent
"out of sample." Because of survivorship bias, this cannot be done easily
with data from years prior to the money manager's run. If the run is still
current, then we must wait many years to accumulate the new data needed to
test the hypothesis properly.
The problem of assessing significance becomes, therefore, especially acute
for testing theories of stock market behavior where very long observation
periods (e.g., fifty to one hundred years) are required. One such class of
examples are theories where price and fundamental value deviate substantially
and where it is further posited that the speed of convergence of price to
value is slow.
If, as is not unusual [cf. Shiller (1984)], a theory is formulated as a
possible solution for an empirical puzzle previously found in the data, then
the construction of a proper significance test of the theory on these same
data becomes quite subtle.
Consider, for example, the following sequence of empirical studies and
theories which followed the finding in the early 1970s, that low price-to-
earnings ratio stocks seem to significantly outperform high price-to-
earnings ratio stocks when performance is adjusted for risk according to the
Capital Asset Pricing Model. Because there was already theory and evidence to
suggest that the CAPM was inadequate to explain all the cross-sectional
differentials in average security returns and because price-to-earnings ratios
are not statistically independent of other firm characteristics (e.g.,
industry, dividend yield, financial and business risks), early explanations of
the puzzle centered on additional dimensions of risk as in the arbitrage
pricing and intertemporal capital asset pricing theories and on the tax
III

-23-
effects from the-mix of the pretax returns between dividends and capital
gains. Further empirical analysis of the same data suggested that the
aberration was more closely related to the size of the firm than to
price-to-earnings ratios, although this claim is still subject to some
dispute. Although firm size is also not statistically independent of other
firm characteristics, this finding added the prospect of market segmentation
or "tiering" to the original list of possible explantions for the puzzle.
Still further empirical analysis of the same data found a "seasonal"
effect in stock returns which appeared to produce systematically larger
returns on the market in the month of January. Closer inspection of these
data pinpointed the source in place and time to be smaller firms in the early
part of January. Moreover, by combining these two studies, it seems that the
original PE/small firm puzzle is almost entirely the result of stock-price
behavior in January. This result shifted the emphasis of theoretical
explanation from risk factors and segmentation to "temporary" depressions in
prices caused by year-end tax-loss sales of stocks that have already declined
in price.
In the growing list of theoretical explanations of this puzzle (followed
by tests on the same data set), perhaps the most recent entry is the "over-
reaction behavioral theory" of De Bondt and Thaler [1985] which implies that a
"contrary opinion" portfolio strategy will outperform the market. It is
particularly noteworthy because it also represents an early attempt at a
formal test of cognitive misperceptions theories as applied to the general
���__�_�_____�

-24-
stock market. - To test their theory, they construct two portfolios (each
containing 35 stocks): one contains extreme winners based on past returns and
the other extreme losers. They find that in a series of nonoverlapping
three-year holding periods, the "winners", on average, underperformed the
market by 1.7 percent per year and the "losers" overperformed the market by
6.5 percent per year. The difference between the two, 8.2% per year, was
Judged to be significant with a t-statistic of 2.20.
Do the empirical findings of De Bondt and Thaler, using over a half
century of data, really provide significant evidence for their theory? Is it
reasonable to use the standard t-statistic as a valid measure of significance
when the test is conducted on the same data used by many earlier studies whose
results influenced the choice of theory to be tested? As it happens in this
particular case, the former substantive question can be answered without
addressing the latter methodological one. That is, Franco Modigliani is fond
of the saying, "If, for a large number of observations, you have to consult
the tables to determine whether or not your t-statistic is significant, then
it is not significant." This expressed concern over the delicate issue of
balancing type-I and type-II errors would seem to apply here. Moreover,
11 As perhaps some indication of the tentative nature of the evidence drawnto support behavioral theories of the stock market, we have, on the onehand, De Bondt and Thaler concluding that investors make cognitivemistakes which result in the underpricing of stocks that have declined(losers) and overpricing of stocks that have risen (winners) and, on theother, Shefrin and Statman (1985) concluding that the evidence supports(different) cognitive mistakes which cause investors to sell their winners"too early" and hold on to their losers "too long". It would seem,therefore, that even a "rational" investor, fully cognizant of his naturaltendency to make these mistakes, would, nevertheless, find himself"convicted" by his actions of one or the other cognitive failures.
III
-25-
consider the additional findings of the study as described by the authors (p.
799): "First, the overreaction effect is asymmetric; it is much larger for
losers than for winners. Secondly, consistent with previous work on the
turn-of-the-year effect and seasonality, most of the excess returns are
realized in January." As the authors later put it [p. 804], "Several aspects
of the results remain without adequate explanation;". It is at this moment
difficult to see a clear theoretical explanation for overreaction being
asymmetric and even more so, for the excesses tending to be corrected at the
same time each year.
Suppose, however, that the authors had found no such unexplained anomalies
with respect to their theory and a larger t-statistic. Would their test,
considered in methodological terms, have fulfilled their expressed goal?
Namely, "... our goal is to test whether the overreaction hypothesis is
predictive [their emphasis]. In other words, whether it does more for us than
merely to explain, ex post, the P/E effect or Shiller's results on asset price
dispersion." [P. 7951. When a theory is formulated as an explanation of a
known empirical puzzle and then tested on the same data from which the puzzle
arose, it would appear that the distinction between "prediction" and "ex post
explanation" can be quite subtle.
These same concerns, of course, apply equally to the many empirical
studies which do not reject market rationality. The early tests of serial
dependencies in stock returns that used the newly-created data bases in the
1960s may have been sufficiently independent to satisfy the assumptions
underlying the standard test statistics. It is, however, difficult to believe
in the same level of independence for the practically countless subsequent
runs used to test closely related hypotheses on the same data.

-26-
Although there is no obvious solution to these methodological problems in
testing the rational market hypothesis, it does not follow that the
controversies associated with the hypothesis cannot be empirically resolved.
It does follow, however, that the reported statistical significance of the
evidence, both for and against the hypothesis, is likely to overstate-
perhaps, considerably so-the proper degree of precision to be attached to
these findings. As noted at the outset, although common to all areas of
economic hypothesis testing, these methodological problems appear to be
especially acute in the testing of market rationality. Thus, it would seem
that in evaluating the evidence on this matter, "more-than-usual" care should
be exercised in examining the substantive economic assumptions and statistical
methodologies used to present the evidence. In this spirit, I try my hand at
examining the recent volatility tests of aggregate stock market rationality.
Having already expressed my views on the LeRoy and Porter (1981) and
Shiller (1981) variance bound studies as tests of stock market rationality,1 2
I provide only a brief summary of those views as background for the discussion
of more recent volatility tests that have evolved from their work.
In formulating his variance bound tests, Shiller (1981) makes three basic
economic assumptions: (S.1) stock prices reflect investor beliefs which are
rational expectations of future dividends; (S.2) the real expected rate of
return on the stock market is constant over time; (S.3) aggregate real
dividends on the stock market can be described by a finite-variance stationary
stochastic process with a deterministic exponential growth rate. From these
12 As junior author of Marsh and Merton (1983; forthcoming).
III
-27-
assumptions, Shifler derives two variance bound relations: the first is that
the variance of real and detrended stock prices is bounded above by the
variance of real and detrended "perfect-foresight" stock prices constructed by
discounting ex post the realized stream of dividends at the estimated average
expected rate of return on the stock market. The second is that the variance
of the innovations (or unanticipated changes) in stock prices is bounded from
above by the product of the variance of dividends and a constant which
parametically depends on the long-run or statistical equilibrium expected
dividend-to-price ratio. Using 109 years of data, Shiller found that the
sample statistics violated by a very large margin both of his variance bounds
on stock price behavior. Although he did not derive the sampling properties
of his estimates, Shiller argued that the magnitude of the violations together
with the long observation period make sampling error an unlikely candidate to
explain these violations. Nevertheless, subsequent simulations by Flavin
(1983) and Kleidon (1983a,b) have shown that sampling error, and in addition,
sample bias, could be important factors.
Some economists interpret the Shiller findings as strong evidence against
the theory that stock prices are based upon fundamentals alone. Others, most
recently Summers (1985), are more careful in noting that even if the results
are "true" rejections, then they reject the joint hypothesis (S.1), (S.2), and
13(S.3) which need not, of course, imply rejection of (S.1). As noted
earlier in this section, there are a priori economic reasons as well as
13 More precisely, Summers (1985; p. 635) refers to the joint hypothesisinvolving what has been called here "(S.1) and (S.2)". I do not knowwhether his failure to note the stationarity condition (S.3) as well wasintended or not.
i�(�.����l�------^-l_-I �.�_�·.
-28-
empirical evidenee leading us to reject the hypothesis (S.2) that the expected
real rate is constant. While these are perhaps sufficient to reconcile the
test findings with market rationality, some economists [including Shiller
(1981,1982)] have presented analyses which suggest that fluctuations in the
expected real rate might have to be "unreasonably large" to make this
accommodation.
If (S.2) were modified to permit the expected real rate to follow a
stochastic but stationary process, then, together with (S.3), detrended
rational stock prices must follow a stationary process. The prototype
processes for stock prices and dividends used by both finance academics and
practitioners, are not stationary and this raises a priori questions about the
assumption (S.3). Kleidon (1983a,b) reports time series evidence against
stationarity for both stock prices and dividends, and, using simulations,
shows that Shiller's findings can occur for nonstationary dividend processes
and rationally determined stock prices.
Marsh and Merton (forthcoming) show that if the stationarity assumption is
replaced by a Lintner-like dividend model where the dividend is a positive
distributed lag of past stock prices, then the inequality in Shiller's first
variance bounds test is exactly reversed. Thus, for any given time series of
stock prices, this variance bound will always be violated by one or the other
assumption about the dividend process. Hence, they conclude that the bound is
wholly unreliable as a test of stock market rationality. They further show
that for this class of dividend processes, there is no easily identified bound
between the variance of dividends and the variance of stock price innovations.
Judging from these studies, the amount of light that these variance bounds
tests can shed on the issue of market rationality seems to depend critically

-29-
on the way in whTch we model the uncertainty surrounding future economic
fundamentals. That is, if the underlying economic fundamentals are such that
the levels of rationally determined, real (and detrended) stock prices can be
described by a stationary process, then they have power. If, instead it is
the percentage change in stock prices which is better described by a
stationary process, then they have no power. This observation was surely one
of the important driving forces in the development of the "second-generation"
volatility tests beginning with West (1983;1984) and represented most recently
by Mankiw, Romer, and Shapiro (1985). Although closely related to the
original Shiller-LeRoy-Porter formulations, these tests appear to be far more
robust because they do not require the stationarity assumption. Since the
Mankiw, Romer, and Shapiro (MRS) study is the most recent version of these
tests, the analysis here focuses on it.
As with the original Shiller variance bound test which derived an
inequality between the variance of rational stock prices, {P(t)} and the
variance of ex-post, perfect-foresight stock prices {P*(t)1, MRS also use
these series together with a time series of "naive forecast" stock prices
{P°(t)}, to test the following derived bounds [p. 679; (11') and (12')]:
Eo[P*(t) - O(t)]2 > Eo[P*(t) - P(t)]2 (1)
and
E[P*(t) - P°(t)]2 > E [P(t) - P°(t)]2 (2)O - 0

-30-
where Eo denotes the expectation operator, conditional on initial
conditions at t = 0. Although MRS do retain what has been called here
Shiller's assumptions (S.1) and (S.2), they do not make the stationarity
assumption (S.3). Hence, this conditioning of the expectations is necessary
to make sense of (1) and (2) when the series are not stationary processes.
To test the bounds (1) and (2), they form the test statistics [p. 683,
(16),(17)]:
5l T 2 T
S1 =T Z [P*(t) - P(t)]2 T [P (t) - P(t)] (3)t=l t=l
and
T TS2 = t [P*(t) - P(t)2 Z [P(t) - P (t)] (4)and2 st=l t l
and show that E[S1] > 0 and E[S 2] > 0. With the same data set used
by Shiller (1981) but now extended to run from 1872-1983, and a "naive
forecast" {P°(t)} based on the current dividend, MRS find that these
second moment inequalities are substantially violated by the point estimates
of both (3) and (4).
The MRS analysis appears to address all the cited criticisms of the
first-generation volatility tests with two exceptions, both of which they
point out (p. 686): the assumption of a constant discount rate and the
statistical significance of their estimates. Since the former has already
been discussed in the literature on the first-generation tests, I examine only
the latter here.
As with the original Shiller analysis, it is understandable that MRS did
not examine the significance issue formally. After all, it is no easy task to
derive the necessary mathematical relations for general processes. In the
III
-31-
Shiller case, the assumption of stationarity for the underlying processes make
somewhat credible the heuristic argument that with a 109-year observation
period, the sample statistic is not likely to differ from its expected value
by the large magnitudes necessary to void his apparent rejection. Such
creditability does not, however, extend to nonstationary processes. Because
the extension to include nonstationary processes is the most important
contribution of the MRS and other second-generation volatility tests, it is
appropriate to examine the sampling properties of their statistics in such an
environment.
As noted, deriving these properties in general is no easy task. Thus, I
focus here on a simple example which fits their conditions and is easy to
solve for the sampling properties.
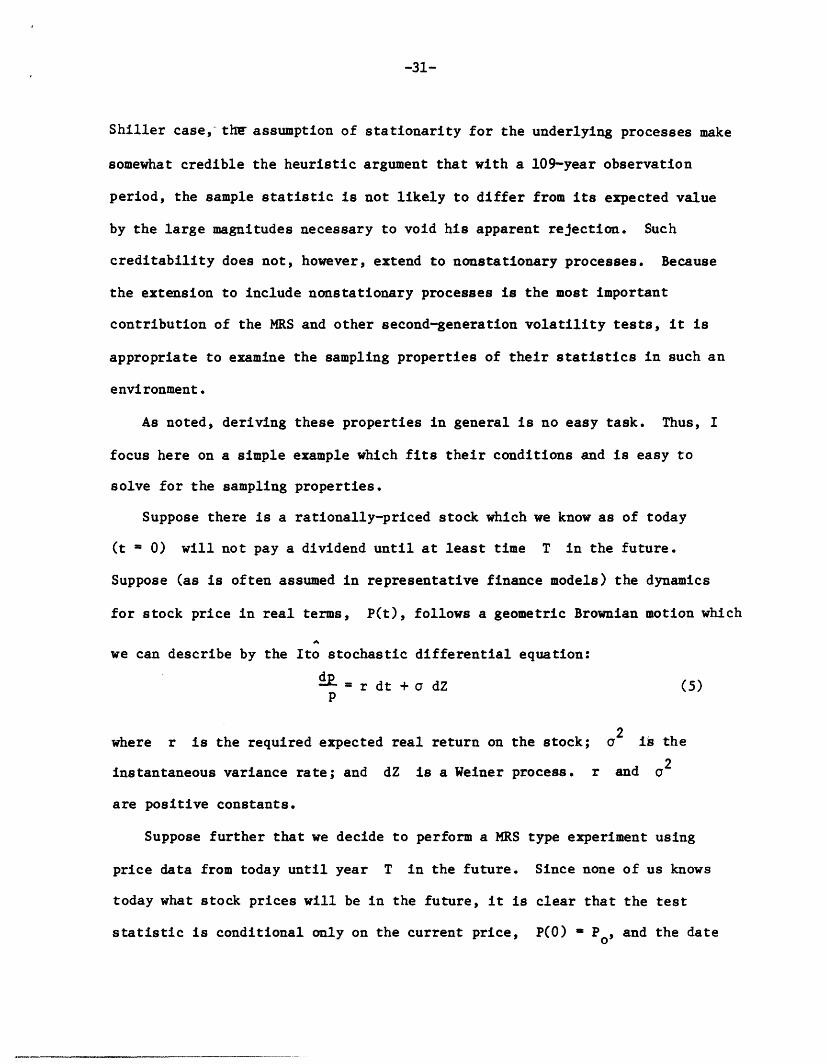
Suppose there is a rationally-priced stock which we know as of today
(t O) will not pay a dividend until at least time T in the future.
Suppose (as is often assumed in representative finance models) the dynamics
for stock price in real terms, P(t), follows a geometric Brownian motion which
we can describe by the Ito stochastic differential equation:
p r dt + a dZ (5)p
where r is the required expected real return on the stock; a2 is the
instantaneous variance rate; and dZ is a Weiner process. r and a2
are positive constants.
Suppose further that we decide to perform a MRS type experiment using
price data from today until year T in the future. Since none of us knows
today what stock prices will be in the future, it is clear that the test
statistic is conditional only on the current price, P(O) P, and the date
-32-
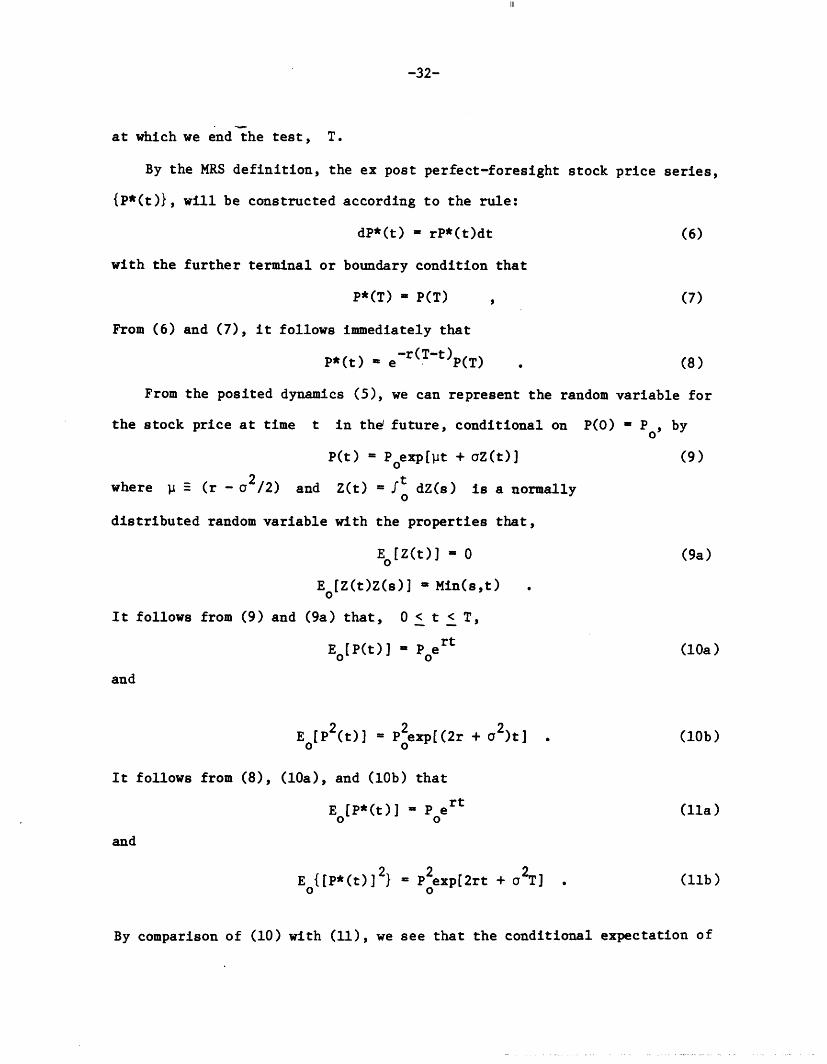
at which we end the test, T.
By the MRS definition, the ex post perfect-foresight stock price series,
(P*(t)}, will be constructed according to the rule:
dP*(t) rP*(t)dt (6)
with the further terminal or boundary condition that
P*(T) P(T) , (7)
From (6) and (7), it follows immediately that
-r(T-t)P*(t) e -r(T-t)P(T) (8)
From the posited dynamics (5), we can represent the random variable for
the stock price at time t in the' future, conditional on P(O) = P , byo
P(t) P exp[Pt + oZ(t)] (9)0
where j - (r -02/2) and Z(t) = It dZ(s) is a normallyO
distributed random variable with the properties that,
E [Z(t)] 0 (9a)
E [Z(t)Z(s)] Min(s,t)0
It follows from (9) and (9a) that, 0 < t < T,
Eo[P(t)] Pert (10a)0
and
E [P2(t)] P exp[(2r + 2 )t] . (10b)o 0
It follows from (8), (10a), and (10b) that
E [P*(t)] P ert (11a)0 0
and
E {[P*(t)]2 = p 2exp[2r t + o2T] . (11b)0 0
By comparison of (10) with (11), we see that the conditional expectation of
ill
-33-
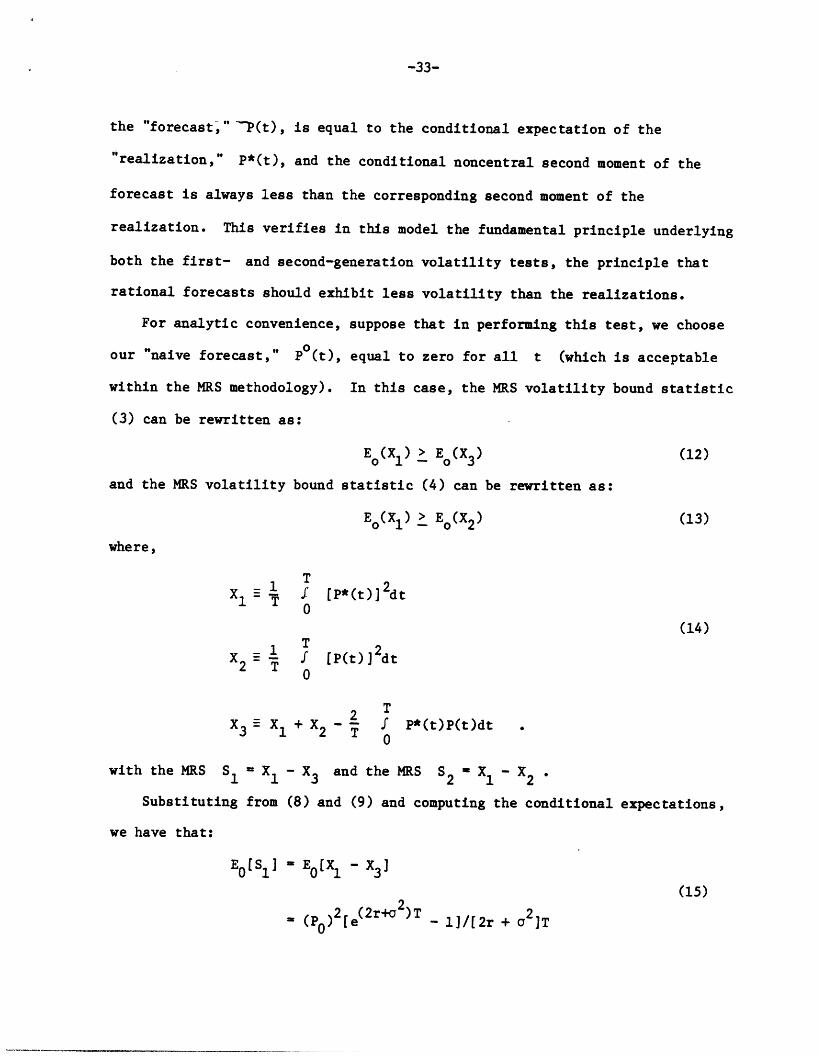
the "forecast" P(t), is equal to the conditional expectation of the
"realization," P*(t), and the conditional noncentral second moment of the
forecast is always less than the corresponding second moment of the
realization. This verifies in this model the fundamental principle underlying
both the first- and second-generation volatility tests, the principle that
rational forecasts should exhibit less volatility than the realizations.
For analytic convenience, suppose that in performing this test, we choose
our "naive forecast," P (t), equal to zero for all t (which is acceptable
within the MRS methodology). In this case, the MRS volatility bound statistic
(3) can be rewritten as:
Eo(X1 ) > Eo(X3) (12)
and the MRS volatility bound statistic (4) can be rewritten as:
Eo(X1 ) > Eo(X2) (13)
where,
2 T 2X1 - T [P*(t)]2dt
(14)
X2 _ 1 [P(t)]2dt
2 ~ 2 T
X3 X1 + X2 - f I P*(t)P(t)dt0
with the MRS S1i X1 - X3 and the MRS S2 = X1 - X2
Substituting from (8) and (9) and computing the conditional expectations,
we have that:
Eo[S] -EO[ X3]
(15)
- (P)[e( 2r a )T_ 1]/[2r + a2]T
I·_�__�_ �I� ��I�_�

-34-
and
Eo[S2] = Eo[X - X2]
(16)
2e 2T(PO) e T 2 2rT -a2 T[a2(e 2rT - 1) - 2r(1 - e-a2T )]
2r(2r + a )T
By inspection of (15) and (16), we confirm the MRS inequalities E[S1]
> 0 and E[S2] > 0, and moreover, we see that for a > 0,
they are strict inequalities whose magnitudes grpw without bound as the
observation period T becomes large. Unfortunately, the standard deviations
of both statistics also grow without bound as the observation period becomes
large, and moreover, the rates of growth are at a larger exponential rate than
the expected values. Hence, for large T, virtually any realized sample
values for S1 and S2 are consistent with the ex-ante inequalities (12)
and (13).
In noting the upward trend in their series and the prospect for
heteroskedasticity, MRS (pp. 685-686) attempt to correct for this possible
inefficiency by weighting each observation by the inverse of the market price
of the stock. However, such a scaling of the data does not rectify the
sampling problem. For example, using their scheme, the new statistic
S2' replacing S2 in (16) can be written as:
I 1 T }2 1 dt . (17)2-- f {[P*(t)]/P(t)} dt - f [P(t)/P(t)] dt (17)
2 T 0 T - 0
Again computing expectations, we have that:
rl - rid a2T 1-. 2 - N1 n
III
- .j/- - .IL L b -J - Le k-LO)
-35-
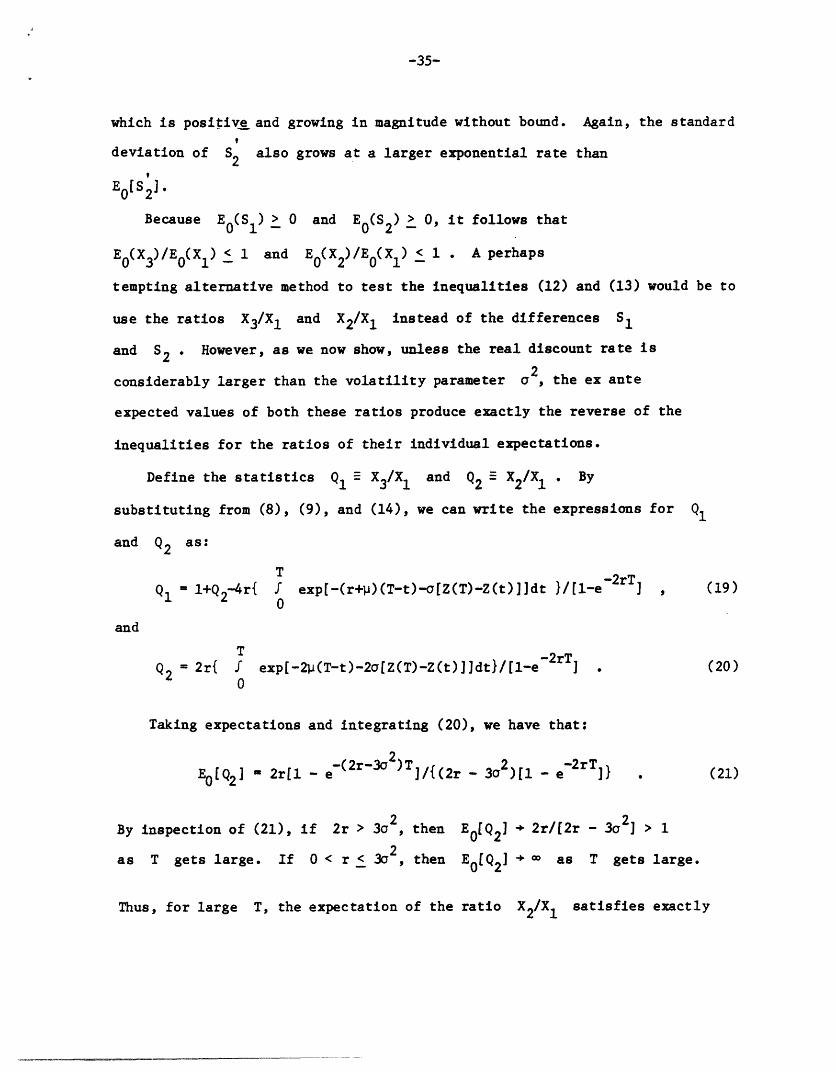
which is positive and growing in magnitude without bound. Again, the standard
deviation of S2 also grows at a larger exponential rate than2
E0[S2].
Because EO(S 1) > 0 and E (S2 ) > 0, it follows that
E (X3)/E (X1) < 1 and E(X2)/E(X1)< 1 . A perhaps
tempting alternative method to test the inequalities (12) and (13) would be to
use the ratios X3/X1 and X2/X1 instead of the differences S1
and S2 . However, as we now show, unless the real discount rate is
considerably larger than the volatility parameter a2, the ex ante
expected values of both these ratios produce exactly the reverse of the
inequalities for the ratios of their individual expectations.
Define the statistics Q1 - X3/X 1 and Q2 X/X1 . By
substituting from (8), (9), and (14), we can write the expressions for Q
and Q2 as:
~~~~~T ~-2rTQ1 = l+Q2-4r{ f exp[-(r+)(T-t)-a[Z(T)-Z(t)lldt }/[l-e ] , (19)
0
and
T -2rTQ2 = 2r{ f exp[-2p(T-t)-2a[Z(T)-Z(t)]]dt}/[l-e - . (20)
0
Taking expectations and integrating (20), we have that:
E0[Q2] 2r[l - e (2r )T]/{(2r - 3a2)[11 - r } (21)
By inspection of (21), if 2r > 302, then ElQ2] + 2r/[2r - 3a2] > 1
as T gets large. If 0 < r < 32, then E0[Q2] + as T gets large.
Thus, for large T, the expectation of the ratio X2/X1 satisfies exactly
_�a_ _� 1_1_^_ (11�1 �---··-----·--·------1_1_11 �---

-36-
the reverse of the inequality satisfied by the ratio of their expectations
Eo[X2]/E []' , and this is the case for all positive parameter values
r and 2.
Taking expectations in (19) and substituting from (21), we have that:
- ( 2 r - 3 02 ) T - ( 2 r - ° 2 ) T
E0Q 1] - +2r{ l-e 2[1-e 2}/[ -2rT (22)(2r-3o ) (2r-a 2)
From (22), if 0 < 2r < 3a , then EO[Ql] - o as T gets
large. For 2r > 32 and large T, we have that EO[Q1] + 1 +
2r(5a2-2r)/(2r-3a2)(2r- 2 ) which only becomes less than one if
22r > 5a . As described in Merton [1980, p. 353, Table 4.8], the average
monthly variance rate on the market between 1926 and 1978 was estimated to be
0.003467 which amounts to a 2 = 0.0416 in annual units. Hence, an
expected annual real rate of return on the market of the order of ten percent
would be required to make E0[Q1] satisfy the inequality EQ[Q1]
< 1. Thus, in addition to being indicative of the sampling problems, the
expectation of these ratios are largely consistent with the empirical evidence
reported by MRS.
The choice of P°(t) 0 as the "naive forecast" in this example,
does not explain these findings. If, for example, we chose P°(t) =
P ert, the "true" conditional expected value for both P(t) and P*(t),
the large T results will remain essentially unchanged because the ratios of
second central and non-central moments tend to one for both P(t) and
P*(t). Indeed, in this case, the MRS inequality just reduces to the original
Shiller variance bound defined here in terms of conditional variances and
using the "true" ex ante expected values for P*(t) and P(t). For much the
III

-37-
same reason, theselection of almost any naive forecast whose volatility is
considerably less than that of stock price is unlikely to change these
results. As shown by example in the appendix, the asymptotic distributions
for S1 and S2 need not converge even if the naive forecast is unbiased
and follows a nonstationary process quite similar to the one posited for stock
prices.
The example presented here assumes that the underlying stock pays no
interim dividends, and therefore, one might wonder if perhaps this polar case
is also pathological with respect to the MRS analysis. Although unable to
fully solve the dividend-paying case analytically, I offer the following
analysis to suggest that the fundamental sampling problems identified by this
example will not be significantly changed.
The MRS analysis appears to be impeccable with respect to bias (i.e., the
expected value conditions on their inequalities). The problem is that the
standard deviation of their estimate for the noncentral second moments grows
at an exponential rate greater than the growth of the expected value of the
estimate. Thus, the important characteristic to examine is the relation
between the second moment and the square root of the fourth moment of future
stock prices. Suppose that the dividend paid is a constant proportion p
of the current stock price. The noncentral second moment of P(T), given
P(0), can be written as [P(O)] exp[2(r - p + a2/2)T1. The square
root of the noncentral fourth moment of P(T) can be written as [P()] 2
exp[(2(r - p) + 3 a )T]. Thus, as long as 2r + a2 > 2p, the
expected second moment estimate grows exponentially. However, the ratio of
the expected value of the estimate to its standard deviation will for large
T, always decline according to exp[-2oi], independently of the payout
-38-
ratio, p. Because the MRS estimates involve simple averages of sums (or
integrals) of squared stock prices, it thus seems unlikely that the sampling
properties of the estimators for large T will be significantly affected by
appending dividends to the model. To the extent that dividend changes are
more sticky than proportional to stock price changes (which as an empirical
matter, they seem to be),14 then the model presented here becomes an even
better approximation.
In this light and given that Shiller (1981) had already found enormous
empirical violations of the central second-moment bounds between actual stock
prices and ex-post perfect-foresight prices, it is not altogether surprising
to find that the measured non-central second moments of these same two series
also exhibit large violations when estimated on the same data set. In that
sense, the Mankiw-Romer-Shapiro study provides no important new empirical
findings about the magnitudes of stock market volatility. Nevertheless, their
study [together with the West (1984) analysis] is central to the controversy
over the rational market hypothesis because of its claim to rule out the
interpretation of Shiller's empirical findings as simply a rejection of the
assumption of a stationary process for dividends and stock prices. As shown
here, this claim remains to be proved.
In summary, I believe that when the heat of the controversy dissipates,
there will be general agreement that the rejection or acceptance of the
rational market hypothesis as a good approximation to real-world stock market
14 See Marsh and Merton (1985).
- - -
III

-39-
behavior will- turn on how we model uncertainty. If, in fact, the levels of
expected real corporate economic earnings, dividends and discount rates in the
future are, ex-ante, well-approximated by a long average of the past levels
[plus perhaps a largely-deterministic trend], then it is difficult to believe
that observed volatilities of stock prices in both the long and not-so-long
runs, are based primarily on economic fundamentals. This assertion can be
confirmed by simulations using economic models of the nonfinancial sector with
stationary processes for the levels of outputs generating the uncertainty.
Thus, if the well-informed view among economists and investors in the
1930-1934 period was that corporate profits and dividends for existing15
stockholders would return in the reasonably near future to their historical
average levels [plus say a six percent trend], then market prices in that
period were not based upon fundamentals. If this were the view, then it is
surely difficult to explain on a rational basis why the average standard
deviation of stock returns during this period was almost three times the
corresponding average for the forty-eight other years between 1926-1978 [cf.
Merton (1980, pp. 353-4)]. If once again in the 1962-1966 period, the
informed view was that required expected returns and the levels and growth
rates of real profits in the future would be the same as in the long past,
15 Some investors in 1930-1934 may have believed that there was asignificantly changed probability of broad-based nationalization ofindustry than in the past. Given the substantially increased levels ofbusiness and financial leverage, there were perhaps others who saw adifferent prospect for widespread bankruptices than was the case in thepast.
Li·lyll�l-�
-40-
then stock prices were (ex ante) too high.l6
If, as is the standard assumption in finance, the facts are that the
future levels of expected real corporate economic earnings, dividends, and
discount rates are better approximated by nonstationary stochastic processes,
then even the seemingly extreme observations from these periods do not violate
the rational market hypothesis.
In light of the empirical evidence on the nonstationarity issue, a
pronouncement at this moment that the rational market theory should be
discarded from the economic paradigm, can, at best, be described as
"premature." However, no matter which way the issue is ultimately resolved,
the resolution itself promises to identify fruitful new research paths for
both the finance specialists and the general economist. Just as the break-
throughs of more than two decades ago by Lintner, Markowitz, Miller,
Modigliani, Samuelson, Sharpe, and Tobin, dramatically changed every aspect of
both finance theory and practice, so the rejection of market rationality
together with the development of the new theory to supersede it, would, once
again, cause a complete revision of the field. If, however, the rationality
hypothesis is sustained, then instead of asking the question "Why are stock
prices so much more volatile than (measured) consumption, dividends, and
replacement costs?", perhaps the general economist will begin to ask questions
like, "Why do (measured) consumption, dividends, and replacement costs exhibit
so little volatility when compared with rational stock prices?" With this
16 There were, however, some economists and professional investors whoapparently believed that the government had finally found both the willand the means to avoid major macroeconomic disruptions from highunemployment, erratic growth rates, and unstable inflation. Their bestguesses for the future may have been formulated with less weight on thedistant past.
III

reversed perspective may come the development of refined theories of consumer
behavior (based upon intertemporally-dependent preferences, adjustment costs
for consumption, the nontradability of human capital, and cognitive
misperceptions) that will explain the sluggish changes in aggregate
consumption relative to permanent income. They may also see new ways of
examining the question of sticky prices that has long been an important issue
in the analysis of the business cycle. Because rational speculative prices
cannot be sticky, comparisons of the volatilities of such prices with
non-speculative prices may provide a useful yardstick for measuring the
stickiness of nonspeculative prices and their impact on aggregate economic
activity.
_�____�1_1�� __I� ��_I__�_��__
-42-
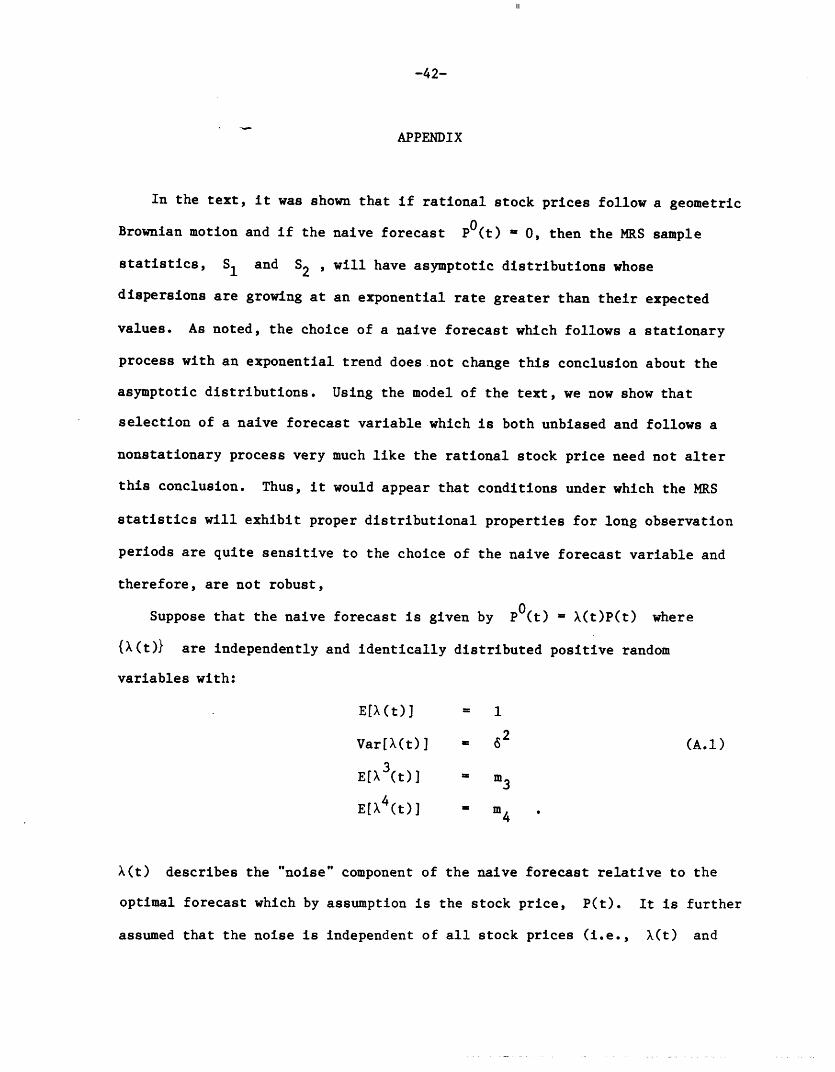
APPENDIX
In the text, it was shown that if rational stock prices follow a geometric
Brownian motion and if the naive forecast P(t) - 0, then the MRS sample
statistics, S1 and S2 , will have asymptotic distributions whose
dispersions are growing at an exponential rate greater than their expected
values. As noted, the choice of a naive forecast which follows a stationary
process with an exponential trend does not change this conclusion about the
asymptotic distributions. Using the model of the text, we now show that
selection of a naive forecast variable which is both unbiased and follows a
nonstationary process very much like the rational stock price need not alter
this conclusion. Thus, it would appear that conditions under which the MRS
statistics will exhibit proper distributional properties for long observation
periods are quite sensitive to the choice of the naive forecast variable and
therefore, are not robust,
Suppose that the naive forecast is given by P(t) = X(t)P(t) where
{X(t)} are independently and identically distributed positive random
variables with:
EXk(t)] = 1
Var[X(t)] ' 62 (A.1)
3E[X (t)] m3
E[k4(t)] 4
X(t) describes the "noise" component of the naive forecast relative to the
optimal forecast which by assumption is the stock price, P(t). It is further
assumed that the noise is independent of all stock prices (i.e., X(t) and
III
-43-
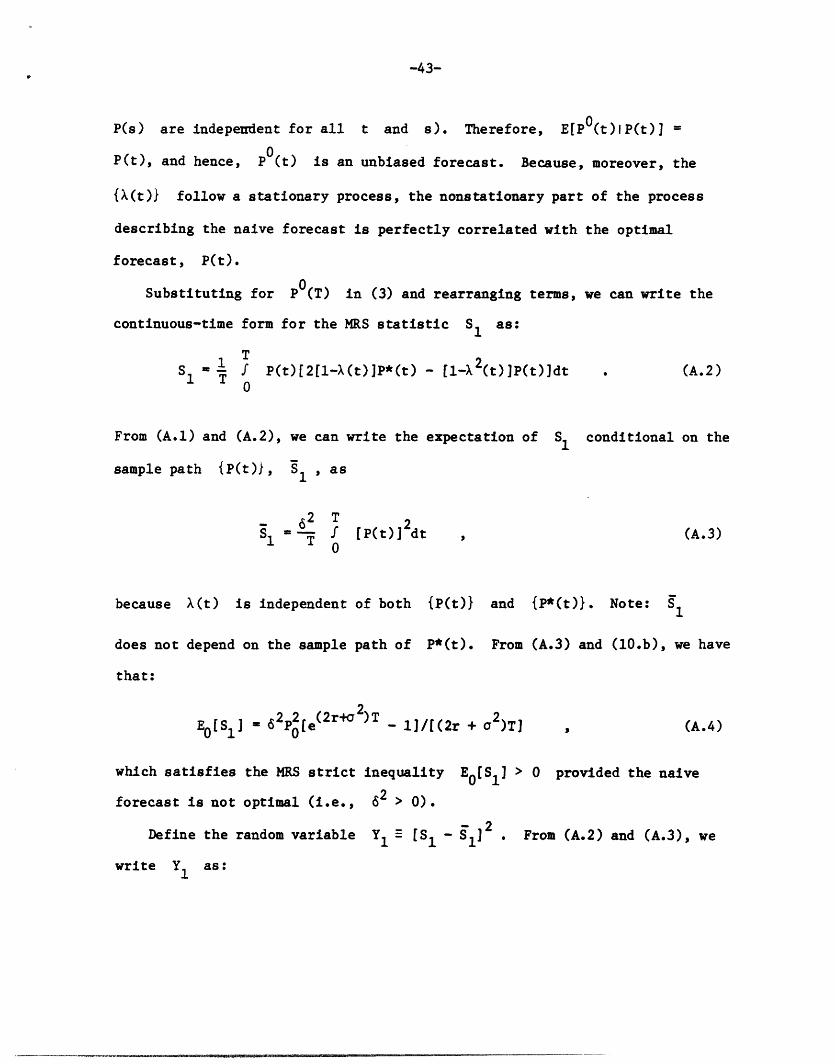
P(s) are independent for all t and s). Therefore, E[P (t)IP(t) =
P(t), and hence, P0(t) is an unbiased forecast. Because, moreover, the
{X(t)} follow a stationary process, the nonstationary part of the process
describing the naive forecast is perfectly correlated with the optimal
forecast, P(t).
Substituting for P0(T) in (3) and rearranging terms, we can write the
continuous-time form for the MRS statistic S1 as:
(A.2)S1 T f P(t)[2[1-X(t)jP*(t) - [l-X 2 (t)]P(t)]dt0
From (A.1) and (A.2), we can write the expectation of S1 conditional on the
sample path {P(t)), S1 , as
62 T
91 T [P(t)] 2dt (A.3)
because X(t) is independent of both {P(t)} and {P*(t)}. Note: S1
does not depend on the sample
that:
path of P*(t). From (A.3) and (10.b), we have
EOS 1 ] 62p2 e(2r+2 )T
which satisfies the MRS strict in
forecast is not optimal (i.e., 6'
Define the random variable Y
write Y1 as:
- 1]/[(2r + a2 )T] (A.4)
equality E[S1] > 0 provided the naive
2 > 0).
1 S- Sl ] 2 . From (A.2) and (A.3), we
ly-----l�-���----�-

-44-
T TY = 1 f- f P(t)P(s)[2[1-X(t)]P*(t) - [1+62 -2(t)]P(t)]T2 0 0
[2[1-X(s)]P*(s) - [1+62-X 2(s)]P(s)] ds dt
(A.5)
Because X(t) is independent of X(s) for t s, we have from (A.1)
and (A.5) that the expectation of Y1, conditional on the sample path {P(t)},
Y1' can be written as:
TY1 -2 f. P (t)[46 [P*(t)] +4[1+6 -m3]P(t)P*(t)+[m4 -(1+6 ) p2 (t)]dt
T 0
(A.6)
Note that the integrand of (A.6) is always positive. From (8) and (9), we have
that, k = 2,3,4:
{ [(t)]k[p*(t)]4-k [Prt]4exp[6T + k(k-7)(Tt)E[p(t) p(t)] I = [P0e I exp[6 T +-a k(k-7)(T-t)] (A.7)
Taking expectations in (A.6) and substituting from (A.7), we have that
E [Y1 ] E [Y] grows exponentially as:0 1 0 1
EO[Y 1] X exp[(4r + 6 )T]/T2 (A.8)
Therefore, the standard deviation of the MRS sample statistic S1 given by
V E0 [Y1 ] grows exponentially according to exp[(2r + 32)T]/T .
By inspection of (A.4), we have that the ratio of E[S1] to E0 [Y1] declines
exponentially
sample result
E 0[S1] > 0 .
at the rate (-2a 2T).
for S1 is consistent
By a similar analysis,
Thus, for large T, virtually any
with the population condition
the reader can verify that the same
III

-45-
result obtains fr the MRS statistic S2.
In contrasting their tests with the earlier Shiller (1981) analysis, MRS
[1985, p. 6831 point out that their statistics do not require detrending
"...because the 'naive forecast' P can grow as dividends grow..."
On page 684, they further their case for robustness by noting "...that the
naive forecast need not be efficient in any sense." The naive forecast
analyzed here does not seem to be pathological with respect to the conditions
they set forth. Thus, it would appear that the naive forecasts necessary to
provide proper asymptotic distributional properties for their statistics are
anything but naive.
··-I-�

III
-46-
REFERENCES
Arrow, K.J., 1982, "Risk Perception in Psychology and Economics," EconomicInquiry 20 (January), 1-9.
Blanchard, O., 1979, "Speculative Bubbles, Crashes, and RationalExpectations," Economic Letters 3, 387-389.
and M.W. Watson, 1982, "Bubbles, Rational Expectations, andFinancial Markets" in Crises in the Economic and Financial Structure, P.Wachtel (ed.), Lexington Books, 295-315.
DeBondt, W.F.M. and R. Thaler, 1985, "Does the Stock Market Overreact?",Journal of Finance 40(3) (July), 793-805.
Fama, E., 1970, "Efficient Capital Markets: A Review of Theory and EmpiricalWork," Journal of Finance 25 (May), 383-417.
, 1981, "Stock Returns, Real Activity, Inflation and Money," AmericanEconomic Review 71, 545-565.
Fischer, S. and R.C. Merton, 1984, "Macroeconomics and Finance: The Role ofthe Stock Market" in Essays on Macroeconomic Implications of Financial andLabor Markets and Political Processes, K. Brunner and A.H. Meltzer (eds.),Carnegie-Rochester Conference Series on Public Policy, Vol. 21 (Autumn),57-108.
Flavin, M.A., 1983 "Excess Volatility in the Financial Markets: A Reassessmentof the Empirical Evidence," Journal of Political Economy 91 (December),929-956.
French, K. and R. Roll, 1984, "Is Trading Self-Generating?" Unpublished Paper,Graduate School of Business, University of Chicago (February).
Jensen, M.C., 1968, "The Performance of the Mutual Funds in the Period1945-1964," Journal of Finance 23 (May) 384-416.
Kahneman, D. and A. Tversky, 1979, "Prospect Theory: An Analysis of DecisionUnder Risk," Econometrica 47(March), 263-291.
, 1982, "Intuitive Prediction: Biases andCorrective Procedures," in Judgement Under Uncertainty: Heuristics andBiases, D. Kahneman, P. Slovic, and A. Tversky (eds.), CambridgeUniversity Press.
Kleidon, A.W., 1983a, "Variance Bounds Tests and Stock Price ValuationModels," Working Paper, Graduate School of Business, Stanford University(January).
-47-
183b, "Bias in Small Sample Tests of Stock Price Rationality,"Unpublished, University of Chicago.
Leaner, E.E., 1983, "Let's Take the Con Out of Econometrics," AmericanEconomic Review 73(1), 31-43.
LeRoy, S.F. and R.D. Porter, 1981, "The Present-Value Relation: Tests Basedon Implied Variance Bounds," Econometrica 49(3), 555-574.
Long, Jr., J.B., 1978, "The Market Valuation of Cash Dividends: A Case toConsider," Journal of Financial Economics 6(2/3) (June/September), 235-264.
Mankiw, N.G., D. Romer, and M.D. Shapiro, 1985, "An Unbiased Reexamination ofStock Market Volatility," Journal of Finance XL(3) (July), 677-687.
Marsh, T.A. and R.C. Merton, 1983, "Aggregate Dividend Behavior and ItsImplications for Tests of Stock Market Rationality," Working Paper No.1475-83, Sloan School of Management, MIT (September).
, 1985, "Dividend Behavior for the Aggregate StockMarket," Working Paper No. 1670-85, Sloan School of Management, MIT (May).
, Forthcoming, "Dividend Variability and VarianceBounds Tests for the Rationality of Stock Market Prices," AmericanEconomic Review.
Merton, R.C., 1971, "Optimum Consumption and Portfolio Rules in a ContinuousTime Model," Journal of Economic Theory 3 (December), 373-413.
, 1973, "An Intertemporal Capital Asset Pricing Model,"Econometrica 41 (September), 867-887.
, 1980, "On Estimating the Expected Return on the Market: AnExploratory Investigation," Journal of Financial Economics 8, 323-361.
, 1983, "Financial Economics" in Paul Samuelson and ModernEconomic Theory, E.C. Brown and R.M. Solow (eds.), McGraw-Hill, 105-138.
Merton, R.K., 1948, "The Self-Fulfilling Prophecy," Antioch Review (Summer),193-210.
Miller, M.H. and M.S. Scholes, 1982, "Dividends and Taxes: Some EmpiricalEvidence," Journal of Political Economy (90), 1118-1142.
Modigliani, F. and R. Cohn, 1979, "Inflation, Rational Valuation and theMarket," Financial Analysts Journal (March-April), 3-23.
Ohlson, J.A. and S.H. Penman, 1985, "Volatility Increases Subsequent to StockSplits: An Empirical Abberation," Journal of Financial Economics 14(2)(June), 251-266.
"1�-��---
III
-48-
Samuelson, PA.-,-1965, "Proof That Properly Anticipated Prices FluctuateRandomly," Industrial Management Review 6 (Spring), 41-49.
Shefrin, H. and M. Statman, 1985, "The Disposition to Sell Winners Too Earlyand Ride Losers Too Long: Theory and Evidence," Journal of Finance 40(3)(July), 777-790.
Shiller, R.J., 1981, "Do Stock Prices Move Too Much to be Justified bySubsequent Changes in Dividends?" American Economic Review 71 (June),421-436.
, 1982, "Consumption, Asset Markets, and MacroeconomicFluctuations," Carnegie-Rochester Conference on Public Policy 17, 203-250.
, 1984, "Stock Prices and Social Dynamics," Brookings Papers onEconomic Activity 2, 457-498.
Summers, L.H., 1982, "Do We Really Know That Financial Markets are Efficient?"National Bureau of Economic Research, Working Paper No. 994 (September).
, 1985, "On Economics and Finance," Journal of Finance XL(3)(July), 633-635.
Tirole, J., 1982, "On the Possibility of Speculation Under RationalExpectations," Econometrica 59 (September), 1163-1181.
, 1985, "Asset Bubbles and Overlapping Generations," Econometrica53(5) (September), 1071-1100.
Van Horne, J.C., "On Financial Innovations and Excesses," Journal of FinanceXL(3) (July), 621-631.
West, K.D., 1983, "A Variance Bounds Test of the Linear-Quadratic InventoryModel," in Inventory Models and Backlog Costs: An EmpiricalInvestigation, Unpublished Ph.D. Dissertation, Massachusetts Institute ofTechnology (May).
, 1984, "Speculative Bubbles and Stock Price Volatility," FinancialResearch Center, Memorandum No. 54, Princeton University (December).