on the benefits of 5g wireless technology for future
TRANSCRIPT
Sergey Shorgin
Institute of Informatics Problems of the Russian Academy of Sciences, Moscow, Russia, [email protected], http://www.ipiran.ru/english
Konstantin Samouylov, Irina Gudkova
Department of Applied Informatics and Probability Theory, Peoples’ Friendship University of Russia, Moscow, Russia, {ksam, igudkova}@sci.pfu.edu.ru, http://aipt.sci.pfu.edu.ru/en
Olga Galinina, Sergey Andreev
Tampere University of Technology, Tampere, Finland, {olga.galinina, sergey.andreev}@tut.fi, http://winter-group.net/
On the Benefits of 5G Wireless Technology for Future Mobile Cloud Computing
October 27-29, 2014
Lomonosov Moscow State University
Section "Practice and experiments in SDN & NFV"

© S. Shorgin, K. Samouylov, I. Gudkova, O. Galinina, and S. AndreevSDN & NFV 201427-29.10.2014
Major Challenges of Today
2
Increased mobile data traffic,
some say 1000x and beyond
Growth in connected devices,
up to 50 billion devices
Diverse requirements and
characteristics
Current mobile networks are likely to face capacity crunch
• a new technology that replaces 4G
• or several (integrated) technologies?
Attention shifts to what comes beyond 4G
(Fifth Generation!)

© S. Shorgin, K. Samouylov, I. Gudkova, O. Galinina, and S. AndreevSDN & NFV 201427-29.10.2014
What’s in a Name?
3
Given a 10-year cycle for every existing generation,
we expect 5G systems sometime around 2020
Whereas there is currently no complete definition, 5G
may already be understood from the user perspective
Human users would like to be connected at all times
• regardless of their current location
• take advantage of services provided
by multimedia-over-wireless networks

© S. Shorgin, K. Samouylov, I. Gudkova, O. Galinina, and S. AndreevSDN & NFV 201427-29.10.2014
A Glimpse of Tomorrow
4
Main challenge: user’s connectivity
experience should match service rate
requirements and be uniform
A comprehensive solution is to deploy
the higher density of smaller cells in cellular architecture
Network densification generally promises higher bit rates
and reduced energy for uplink transmission
But licensed spectrum continues to be
scarce and expensive, whereas the
traditional methods to improve its efficient
use approach their theoretical limits!

© S. Shorgin, K. Samouylov, I. Gudkova, O. Galinina, and S. AndreevSDN & NFV 201427-29.10.2014
The Paradigm Shift at Work
5
We expect the majority of near-term capacity and
connectivity gains from leveraging unlicensed spectrum
Consequently, the incentive to efficiently coordinate between
the alternative radio access technologies is growing stronger
WLAN becomes an integral
part of wireless landscape
A Heterogeneous Network (HetNet)
employs hierarchical deployment
of wide-area macro cells for basic
connectivity and coverage augmented with small cells of
various footprints and by different RATs to boost capacity

© S. Shorgin, K. Samouylov, I. Gudkova, O. Galinina, and S. AndreevSDN & NFV 201427-29.10.2014
Intelligent Use of Multiple Radio Access Technologies
6
Integrated cellular/WLAN deployment Own dynamic system-level simulator
• 7-cell 3GPP LTE Rel.-10 FDD
• Features diverse small cells
• Full support for IEEE 802.11-2012
• Event-driven state machine: signal
transmission, channel abstraction,
traffic and user dynamics, etc.
• Flexible statistics collection
Our focus is on dense HetNets
• Integration of cellular and WLAN
• Impact of network densification
• Advanced interference coordination
• Potential of WWAN offloading
• Energy efficient user operation

© S. Shorgin, K. Samouylov, I. Gudkova, O. Galinina, and S. AndreevSDN & NFV 201427-29.10.2014
Current Picture and Perspectives
7
• Simulation-based study of multi-radio HetNets
• Dynamic stochastic geometry analysis
• Comprehensive system architecture
• Current focus on integrated deployments
• Impact of centralized vs. distributed control

© S. Shorgin, K. Samouylov, I. Gudkova, O. Galinina, and S. AndreevSDN & NFV 201427-29.10.2014
Enhanced Spectral Reuse via Device-to-Device Communications
8
We study LTE/WiFi D2D offloading
• Analysis and system-level simulations
• Performance requirements and benefits
• Advanced network-assistance features
• 3GPP LTE-A & WiFi-Direct demonstration
Significant boost
in cell throughput
(up to 2x)
© S. Shorgin, K. Samouylov, I. Gudkova, O. Galinina, and S. AndreevSDN & NFV 201427-29.10.2014
Current Picture and Perspectives
9
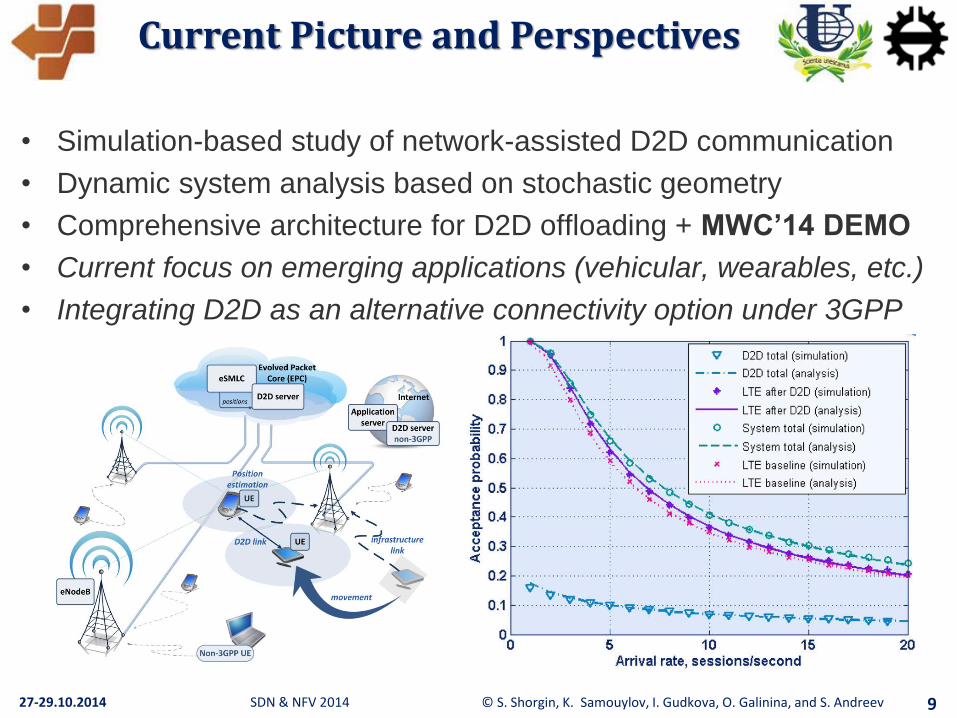
• Simulation-based study of network-assisted D2D communication
• Dynamic system analysis based on stochastic geometry
• Comprehensive architecture for D2D offloading + MWC’14 DEMO
• Current focus on emerging applications (vehicular, wearables, etc.)
• Integrating D2D as an alternative connectivity option under 3GPP

© S. Shorgin, K. Samouylov, I. Gudkova, O. Galinina, and S. AndreevSDN & NFV 201427-29.10.2014
Improved Power Efficiency
10
We concentrate on energy
efficiency of a mobile device
• Optimization of Tx power per radio
• Recommendations on when each
RAT should be used
• Analysis supported by simulations
• Efficient practical control algorithms
• Framework extended to D2D & MTC

© S. Shorgin, K. Samouylov, I. Gudkova, O. Galinina, and S. AndreevSDN & NFV 201427-29.10.2014
Current Picture and Perspectives
11
• Use optimization theory to solve energy efficiency problems
• Rich set of applications across HetNets, D2D, MTC, etc.
• Current focus on emerging applications
(e.g., wireless energy harvesting)
• Integrating existing energy efficient
algorithms into current networks
• Attractive trade-offs between spectral and
energy efficiencies
© S. Shorgin, K. Samouylov, I. Gudkova, O. Galinina, and S. AndreevSDN & NFV 201427-29.10.2014
Efficient Support for Machine-Type Communications in LTE
12
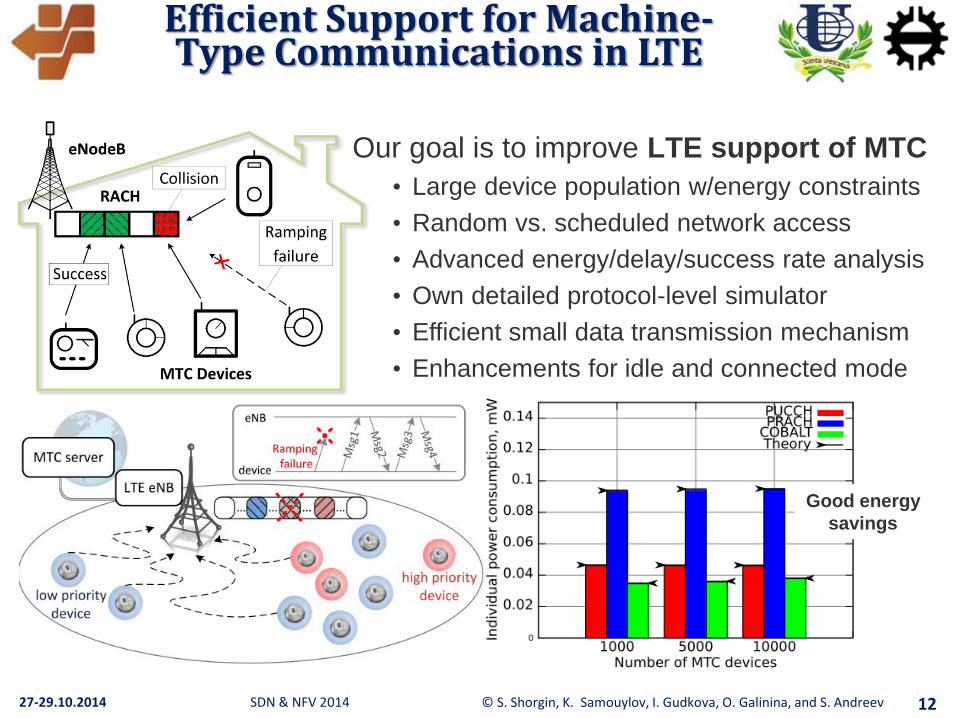
Our goal is to improve LTE support of MTC
• Large device population w/energy constraints
• Random vs. scheduled network access
• Advanced energy/delay/success rate analysis
• Own detailed protocol-level simulator
• Efficient small data transmission mechanism
• Enhancements for idle and connected mode
Good energy
savings

© S. Shorgin, K. Samouylov, I. Gudkova, O. Galinina, and S. AndreevSDN & NFV 201427-29.10.2014
Current Picture and Perspectives
13
• Comprehensive analysis of MTC overload scenario
• Efficient small data access mechanism: COBALT
• Extensive support with protocol-level simulations of 3GPP LTE
• Current focus on coexistence between MTC and H2H
• Further improvements in channel access, RRM, scalability, etc.
© S. Shorgin, K. Samouylov, I. Gudkova, O. Galinina, and S. AndreevSDN & NFV 201427-29.10.2014
LTE Services and Traffic Types
14
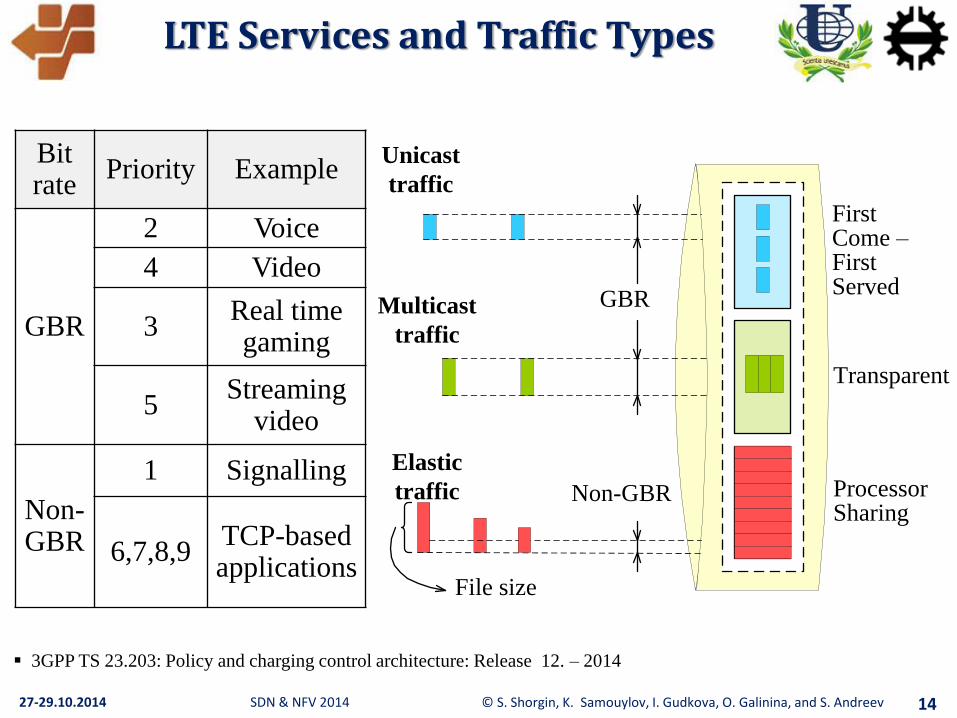
Bitrate
Priority Example
GBR
2 Voice
4 Video
3Real time gaming
5Streaming
video
Non-GBR
1 Signalling
6,7,8,9TCP-based applications
3GPP TS 23.203: Policy and charging control architecture: Release 12. – 2014
Unicast
traffic
Multicast
traffic
GBR
Non-GBR
File size
First Come –First Served
Transparent
Processor Sharing
Elastic
traffic

© S. Shorgin, K. Samouylov, I. Gudkova, O. Galinina, and S. AndreevSDN & NFV 201427-29.10.2014
Background & Teletrafficof Multiservice Loss Networks
UnicastF. Kelly, K. Ross, V. Iversen
Product form solution
Kaufman-Roberts recursion
MulticastJ. Virtamo, O. Martikainen,
K. Samouylov, Y. Gaidamaka
Product form solution
Recursive algorithm
ElasticT. Bonald, M. Logothetis,
G. Basharin, I. Gudkova
Product form solution
Recursive algorithm
15
Unicast & Multicast K. Boussetta, A.-L. Beylot, J. Virtamo,
K. Samouylov, Y. Gaidamaka
Product form solution
Recursive algorithm
Unicast & ElasticJ. Roberts, E. Altman, O. Boxma
No product form solution
Approximate methods
Unicast, Multicast & Elastic
(Triple Play)G. Basharin, K. Samouylov, I. Gudkova
No product form solution
Approximate methods
© S. Shorgin, K. Samouylov, I. Gudkova, O. Galinina, and S. AndreevSDN & NFV 201427-29.10.2014
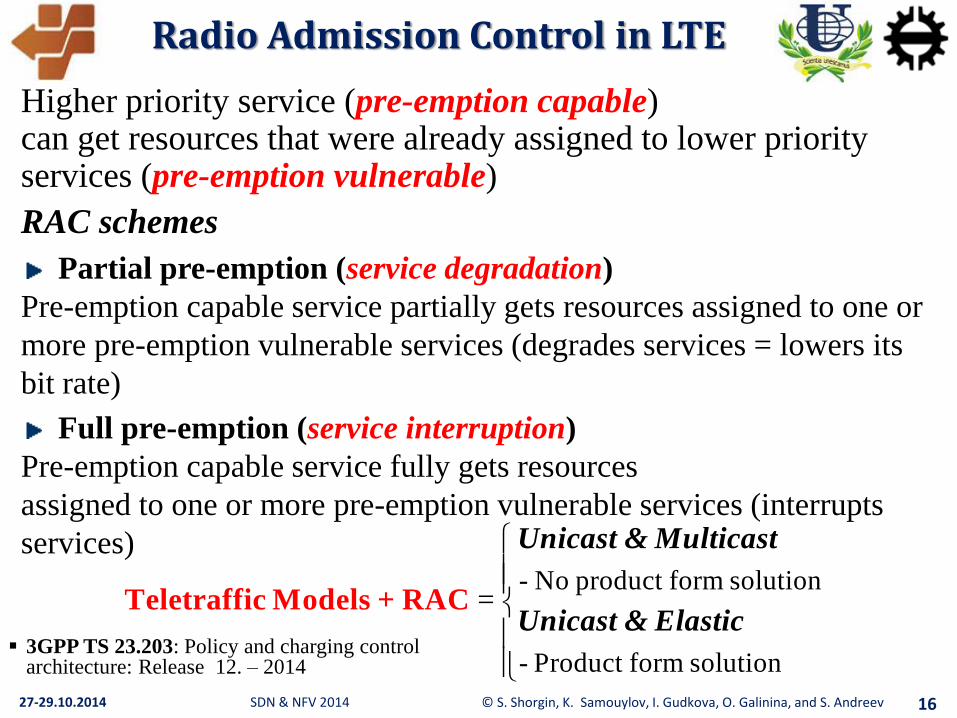
Radio Admission Control in LTE
Higher priority service (pre-emption capable) can get resources that were already assigned to lower priority services (pre-emption vulnerable)
RAC schemes
Partial pre-emption (service degradation)
Pre-emption capable service partially gets resources assigned to one or
more pre-emption vulnerable services (degrades services = lowers its
bit rate)
Full pre-emption (service interruption)
Pre-emption capable service fully gets resources
assigned to one or more pre-emption vulnerable services (interrupts
services)- No product form solution
- Product form solution
=
Teletraffic Models + RAC
Unicast & Multicast
Unicast & Elastic 3GPP TS 23.203: Policy and charging control
architecture: Release 12. – 2014
16
© S. Shorgin, K. Samouylov, I. Gudkova, O. Galinina, and S. AndreevSDN & NFV 201427-29.10.2014
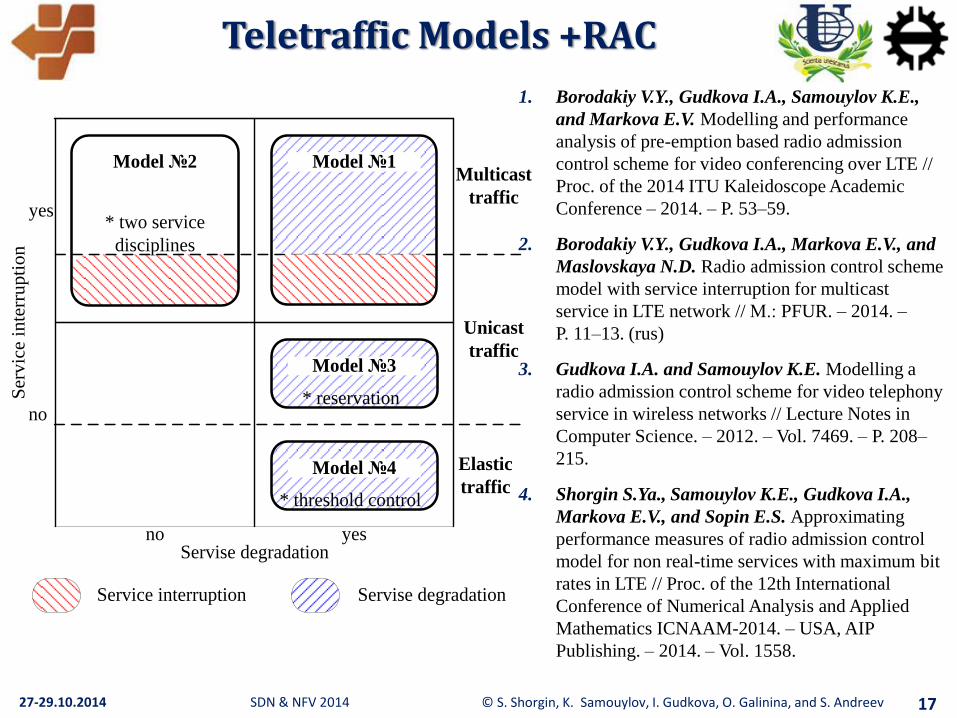
Serv
ice i
nte
rru
pti
on
Servise degradationyesno
no
yes
Unicast
traffic
Multicast
traffic
Elastic
traffic
Model №2
Service interruption Servise degradation
Model №1
Model №3
* reservation
Model №4
* threshold control
* two service
disciplines
Teletraffic Models +RAC
17
1. Borodakiy V.Y., Gudkova I.A., Samouylov K.E.,
and Markova E.V. Modelling and performance
analysis of pre-emption based radio admission
control scheme for video conferencing over LTE //
Proc. of the 2014 ITU Kaleidoscope Academic
Conference – 2014. – P. 53–59.
2. Borodakiy V.Y., Gudkova I.A., Markova E.V., and
Maslovskaya N.D. Radio admission control scheme
model with service interruption for multicast
service in LTE network // М.: PFUR. – 2014. –
P. 11–13. (rus)
3. Gudkova I.A. and Samouylov K.E. Modelling a
radio admission control scheme for video telephony
service in wireless networks // Lecture Notes in
Computer Science. – 2012. – Vol. 7469. – P. 208–
215.
4. Shorgin S.Ya., Samouylov K.E., Gudkova I.A.,
Markova E.V., and Sopin E.S. Approximating
performance measures of radio admission control
model for non real-time services with maximum bit
rates in LTE // Proc. of the 12th International
Conference of Numerical Analysis and Applied
Mathematics ICNAAM-2014. – USA, AIP
Publishing. – 2014. – Vol. 1558.

© S. Shorgin, K. Samouylov, I. Gudkova, O. Galinina, and S. AndreevSDN & NFV 201427-29.10.2014
Notation Parameter
C Downlink peak bit rate, bps
, Arrival rates of requests for VC and
VoD services, 1/s 1 1,
VC and VoD service times, s
1d Bit rate for VoD service, bps
1 k Kb b b Bit rates for VC service, bps
0,1,...,n C d Number of VoD users
1, , , ,
k Km m m m State of a multicast VC session
1k
m
Session is active - VC service is
provided at least to one user on bit
rate kb
0k
m Session is not active - VC service is
not provided to users on bit rate kb
pre-emption capable pre-emption vulnerable
video conference, VC
(multicast)
Yes
(interrupt VoD)
Yes
(degraded by VoD)
video on demand, VoD
(unicast)
Yes
(degrade VC)
Yes
(interrupted by VC)
bKbK
t
Kb
d
d
d
d
d
d
d
d
inte
rruption
d
t0 t1 t2 t3 t4
d
d
d
d d bK
d
d
5, 3, 1KC b d
bK
Example of service interruption
d
d
RAC Model for Unicast and Multicast Services
18

© S. Shorgin, K. Samouylov, I. Gudkova, O. Galinina, and S. AndreevSDN & NFV 201427-29.10.2014
Performance Measures
Blocking probability for video on demand
Interruption probability for video on demand
Mean bit rate for video conference
State space
1 11 ,,0 , ,0 , , , 2,,, k k knn C n C b C b n C b k Knn ee0X
1 111 1
1
, ,
C nK K
C n KKK
b bCn C
bbn C b n C
C Cp n p C
n C CC
0 0
1
1
1
1
1 10 2 1
10 2 1
, ,
, ,
k
k
k
k
C bC b K
k kn k n C b
C bC b K
kn k n C b
b p n b p n
b
p n p n
e e
e e
, ,K KB p C p C b 0 e
19
© S. Shorgin, K. Samouylov, I. Gudkova, O. Galinina, and S. AndreevSDN & NFV 201427-29.10.2014
0.0002
0.0004
0.0006
0.0008
0.001
0.0012
0.0014
0.0016
0.0018
0
5 10 15 20 25 30
Inte
rrupti
on p
robab
ilit
y
for
VoD
ser
vic
e
0.1
0.3
0.5 0.7
Total offered load
3
4
5
6
7
8
0
5 10 15 20 25 30
0.1
0.3
0.5
0.7
Total offered load
Mea
n b
it r
ate
for
VC
ser
vic
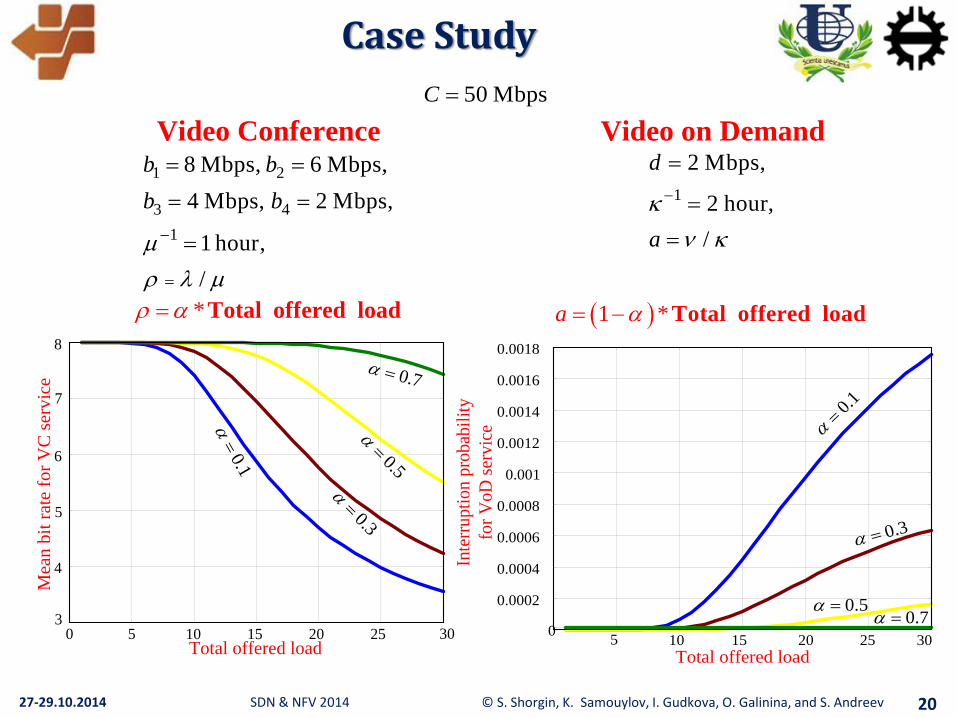
eCase Study
50 MbpsC
Video Conference
1 2
3 4
1
8 Mbps, 6 Mbps,
4 Mbps, 2 Mbps,
1 hour,
/
b b
b b
Video on Demand
1
2 Mbps,
2 hour,
/
d
a
* Total offered load 1 *a Total offered load
20
© S. Shorgin, K. Samouylov, I. Gudkova, O. Galinina, and S. AndreevSDN & NFV 201427-29.10.2014
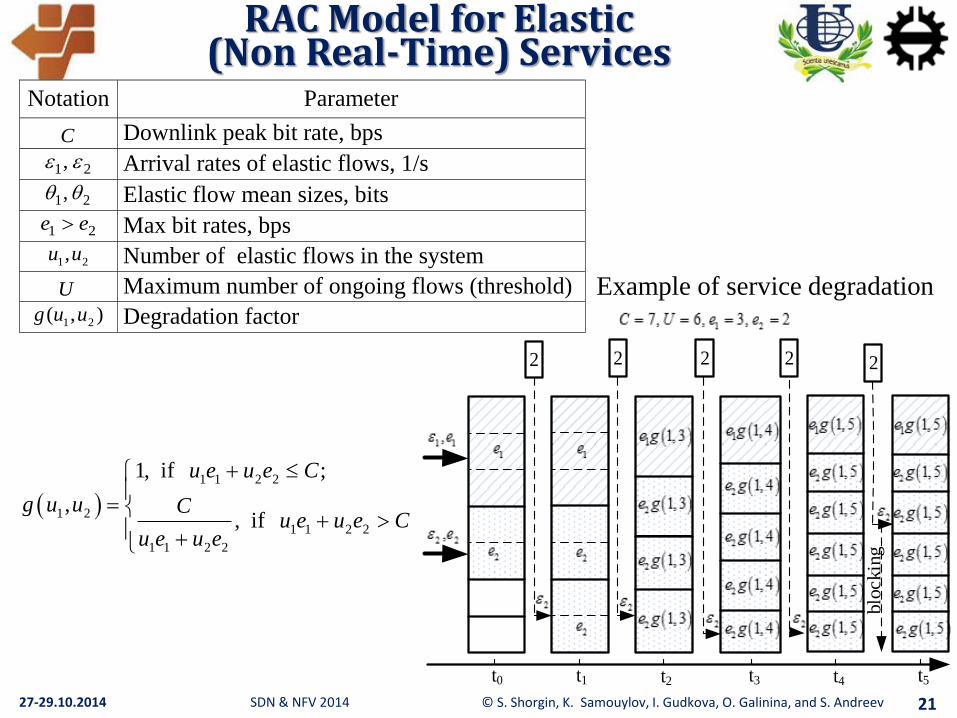
RAC Model for Elastic (Non Real-Time) Services
21
t0 t1 t2 t3 t4 t5
blo
ckin
g
t
2 2 2 2 2
1 1 2 2
1 2
1 1 2 2
1 1 2 2
1, if ;
,, if
u e u e C
g u u Cu e u e C
u e u e
Notation Parameter
C Downlink peak bit rate, bps
1 2, Arrival rates of elastic flows, 1/s
1 2, Elastic flow mean sizes, bits
1 2e e Max bit rates, bps
1 2,u u Number of elastic flows in the system
U Maximum number of ongoing flows (threshold)
1 2( , )g u u Degradation factor
Example of service degradation

© S. Shorgin, K. Samouylov, I. Gudkova, O. Galinina, and S. AndreevSDN & NFV 201427-29.10.2014
QoS Parameters
Blocking probability
Mean transfer time for first elastic flow
Mean transfer time for second elastic flow
State space
1 2
1 1 2
, 1 0
1
1 1
, ,
1
U u
uu u u i
u p u u iP i u i Q u
TB G Q U
X
1 2 1 2 1 2, : 0, 0,u u u u u u U X
1 2 1 2
1 2, :
,u u u u U
Q UB p u u
G
X
1 2
2 1 2
, 1 0
2
2 2
, ,
1
U u
uu u u i
u p u u u i P i u i Q u
TB G Q U
X
where conditional probability that the system is in state
given that the number of ongoing elastic flows is 𝑢𝑃𝑢 𝑢1, 𝑢2 𝑢1, 𝑢2
22

© S. Shorgin, K. Samouylov, I. Gudkova, O. Galinina, and S. AndreevSDN & NFV 201427-29.10.2014
Licensed Shared Access (LSA) (1/2)
Motivation behind the LSA Technology
Modern methods of constructing and organizing cellular
networks might become inefficient under the growth of traffic
volume (Cisco forecasts: in 2014 – 2.6 EB per month, in 2018
– 15.9 EB per month)
Allocating new spectrum for constant use by cellular networks
is difficult due to the approved frequency allocation plan
However, the State can allocate unused spectrum for a short
term (month, week, etc.)
23
Cisco VNI: Global Mobile Data Traffic Forecast Update, 2013–2018
© S. Shorgin, K. Samouylov, I. Gudkova, O. Galinina, and S. AndreevSDN & NFV 201427-29.10.2014
Licensed Shared Access (LSA) (2/2)
Role of the LSA Technology
LSA – the promising technology of temporary resource
allocation that allows:
an operator to lease additional frequency bands in order to
satisfy the increasing data rate requirements
the State to lease out unused frequency bands and to gain
income
24

© S. Shorgin, K. Samouylov, I. Gudkova, O. Galinina, and S. AndreevSDN & NFV 201427-29.10.2014
Licensed Shared Access (LSA) (2/2)
Example Usage of the LSA Technology
25
The owner of LSA band – is airport
This band is seldom used by the
airport
Cellular operator can lease it in order
to enhance its network performance
However, the operator will need to
”return” the leased band to airport if
one requests it.
Main band is available
LSA band is available
User

© S. Shorgin, K. Samouylov, I. Gudkova, O. Galinina, and S. AndreevSDN & NFV 201427-29.10.2014
LTE Cell Resource Allocation ModelBased on LSA Technology
26
2
1
C1
μ
μ
C2
μ
μ
λ1 2...
β
α
r
Notation Parameter
1C Main band downlink peak bit rate, Mbps
2C LSA band downlink peak bit rate, Mbps
Arrival rate of user requests for service , 1/s
1 Service time, s
r Buffer size (r<C2)
Rate of LSA band revocation, 1/s
Rate of LSA band restoration, 1/s
0,1, ,n r Number of users in the system
0,1s LSA band state (available/unavailable)
Taking into account all the special features of LSA technology,
we propose LTE cell model with one base station and two
bands – main band and LSA band
LSA band is available at certain moments

© S. Shorgin, K. Samouylov, I. Gudkova, O. Galinina, and S. AndreevSDN & NFV 201427-29.10.2014
LSA Band Availability Model (1/7)
27
... С
...
изъятие
возвращение в
рабочее состояние
Полоса
доступна Полоса
недоступна
r
LSA band
is available
LSA band
is unavailable
Notation Parameter
C Downlink peak bit rate, Mbps
Arrival rate of user requests for service , 1/s
1 Service time, s
r Buffer size (r<C)
Rate of LSA band revocation, 1/s
Rate of LSA band restoration, 1/s
0,1, ,n r Number of users waiting to receive service
0,1, ,m C Number of users receiving service
LSA band availability model describes LSA band revocation and
restoration mechanisms
LSA band can be revoked only when the system is empty

© S. Shorgin, K. Samouylov, I. Gudkova, O. Galinina, and S. AndreevSDN & NFV 201427-29.10.2014
LSA Band Availability Model (2/7)
28
Request
arrives
Service terminates
ON ON ONOFF OFFOFFON
Waiting time
Service time
Service delay
Service
starts
Service unavailability
+
Example of User Request Service

© S. Shorgin, K. Samouylov, I. Gudkova, O. Galinina, and S. AndreevSDN & NFV 201427-29.10.2014
LSA Band Availability Model (3/7)
29
System State Space
System state space satisfies the relation
It could be simply obtained that the process representing the
system states is a non-reversible Markov process and the
solution to the equilibrium equations is not of
product form
We obtained a recursive algorithm for calculating the stationary
probability distribution
( , ) : (0, ), 0,..., ; ( , ), 1,..., ; ( , 0), 1,..., (1)n m m m C n C n r C n n r X
( , ), ( , )p n m n m X
© S. Shorgin, K. Samouylov, I. Gudkova, O. Galinina, and S. AndreevSDN & NFV 201427-29.10.2014
LSA Band Availability Model (4/7)
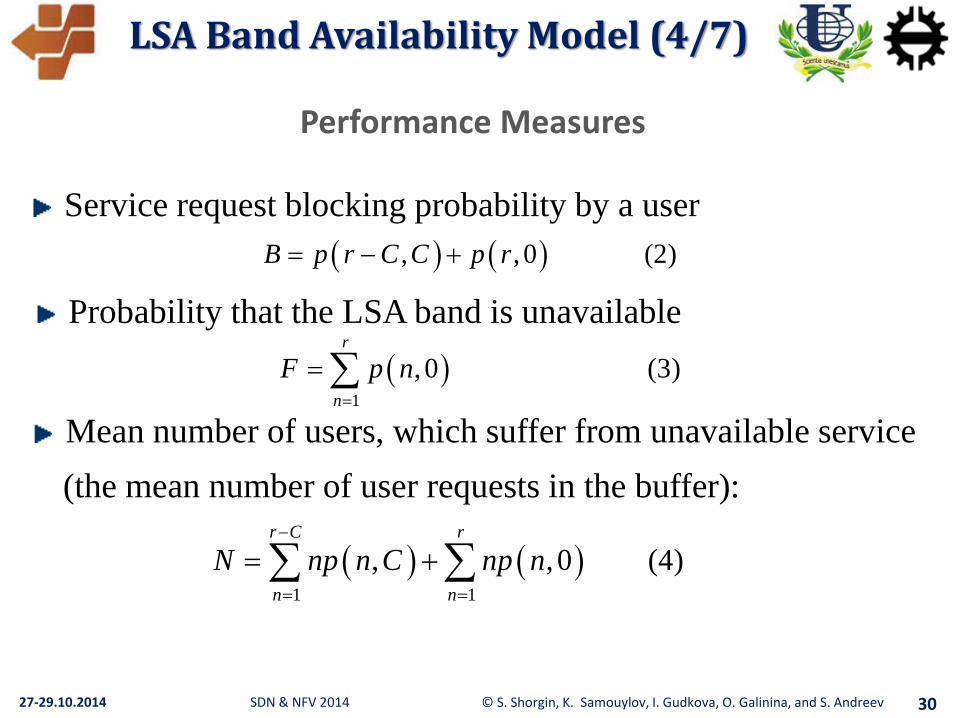
30
Performance Measures
, , 0 (2)B p r C C p r
1
, 0 (3)r
n
F p n
1 1
, , 0 (4)r C r
n n
N np n C np n
Service request blocking probability by a user
Probability that the LSA band is unavailable
Mean number of users, which suffer from unavailable service
(the mean number of user requests in the buffer):
© S. Shorgin, K. Samouylov, I. Gudkova, O. Galinina, and S. AndreevSDN & NFV 201427-29.10.2014
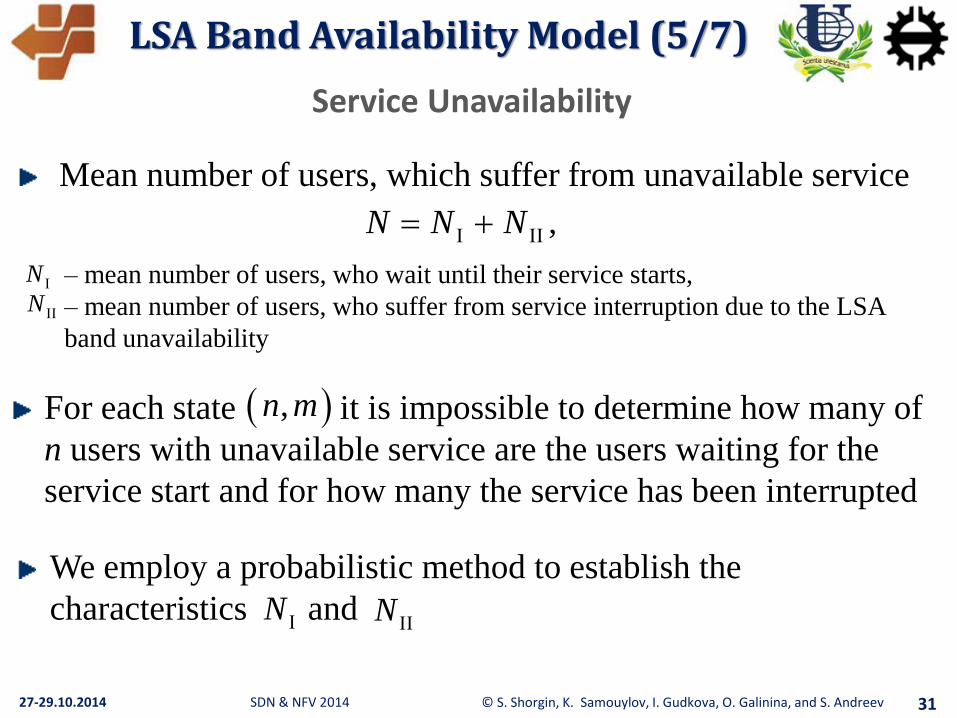
LSA Band Availability Model (5/7)
31
Service Unavailability
,N N N
N
N
,n m
Mean number of users, which suffer from unavailable service
– mean number of users, who wait until their service starts,
– mean number of users, who suffer from service interruption due to the LSA
band unavailability
For each state it is impossible to determine how many of
n users with unavailable service are the users waiting for the
service start and for how many the service has been interrupted
We employ a probabilistic method to establish the
characteristics and N N

© S. Shorgin, K. Samouylov, I. Gudkova, O. Galinina, and S. AndreevSDN & NFV 201427-29.10.2014
LSA Band Availability Model (6/7)
32
Numerical Example
0
0.0002
0.0004
0.0006
0.0008
0.001
10 20 30 40 50 60 70 80
0.1
0.2
0.3
0.4
0.5
0
0.5
1
1.5
2
2.5
3
500 1000 1500 2000 2500 3000
100 MbpsC 250r
1
1
1
1 month
30 minutes,
10 minutes,
/
1
1
10 days, 10 days, 1 day,
10 minutes,
30,
/
Total offered load Restoration time
Mea
n n
um
ber
of
use
rs
awai
tin
g s
erv
ice,
N1

© S. Shorgin, K. Samouylov, I. Gudkova, O. Galinina, and S. AndreevSDN & NFV 201427-29.10.2014
LSA Band Availability Model (7/7)
33
Simulation Results100 MbpsC 250r
1
1
1
1 month
30 minutes,
10 minutes.
Total offered load
Pro
bab
ilit
y t
hat
th
e sy
stem
is
emp
ty