on-site energy consumption and selected emissions at softwood
TRANSCRIPT
On-Site Energy Consumption andSelected Emissions at SoftwoodSawmills in the Southwestern
United States
Dan Loeffler
Nathaniel Anderson
Todd A. Morgan
Colin B. Sorenson
AbstractPresently there is a lack of information describing US southwestern energy consumption and emissions generated from the
sawmilling industry. This article uses a mail survey of softwood sawmills in the states of Arizona, Colorado, and NewMexico to develop a profile of on-site energy consumption and selected emissions for the industry. Energy consumption iscategorized by fuel type on a production basis for both renewable and nonrenewable sources for production year 2012.Selected emissions from on-site energy consumption were also estimated for respondent sawmills. Survey respondentsrepresented 35 percent of total softwood lumber production of 169.2 million board feet. Total annual on-site sawmill energyrequired was 64.8 billion British thermal units. Sixty-one percent was derived from diesel fuel, primarily for on-site rollingstock; 35 percent was from electricity; 3 percent was from gasoline used for on-site rolling stock; and the remainder was frompropane and wood. Energy produced from nonrenewable sources accounted for 94 percent of total on-site energyconsumption. Off-site electricity generation for consumption at sawmills comprise the majority of all emissions in thisanalysis: 62 percent of CO2, 99 percent of CH4, 94 percent of NOX, 99 percent of SOX, and 99 percent of particulate matter �10 lm (PM10). Diesel fuel, which supplies the majority of on-site energy, comprises 36 percent CO2, 0 percent CH4, 5percent NOX, 0.4 percent SOX, and 1.1 percent of PM10.
Debate continues as to which types of energy sourcesare considered carbon neutral (Searchinger 2010, Cher-ubini et al. 2011, Lippke et al. 2012, Schulze et al. 2012,Miner et al. 2014). However, carbon dioxide has longbeen recognized as a heat-trapping gas (Callendar 1949).Although the impacts and solutions for global climatechange are debated, the continued extraction andcombustion of otherwise permanently sequestered fossilcarbon has been clearly identified as a significantcontributor to increasing atmospheric carbon dioxideconcentrations (Solomon et al. 2009, Oliver et al. 2014).The use of renewable energy such as solar, wind,hydroelectric, and biomass not only increases domesticenergy production, it also decreases fossil carbon emittedto the earth’s atmosphere (Jones et al. 2010, Puettman andLippke 2012, Loeffler and Anderson 2014). Also, Tilmanet al. (2009) noted that sustainably harvested wood andforest residues not only have very low carbon impacts, butcan substantially displace fossil fuels. As a result,
increasing renewable energy production has become amajor objective in the United States as evidenced in theBiomass Research and Development Act of 2000, theEnergy Policy Act of 2005, and the Paris Agreement of2015.
The authors are, respectively, Economist, College of Forestry andConservation, Univ. of Montana, Missoula ([email protected][corresponding author]); Research Forester, Rocky MountainResearch Sta., USDA Forest Serv., Missoula, Montana([email protected]); Director, Forest Industry Research,Bureau of Business and Economic Research, Univ. of Montana,Missoula ([email protected]); and Economist, Region 1,USDA Forest Serv., Missoula, Montana ([email protected]).This paper was received for publication in October 2015. Article no.15-00060.�Forest Products Society 2016.
Forest Prod. J. 66(5/6):326–337.doi:10.13073/FPJ-D-15-00060
326 LOEFFLER ET AL.

In this context, the sawmilling sector of the woodproducts industry contributes significantly to achievingrenewable energy targets. In 2010, sawmills were respon-sible for slightly less than half of the total wood productsindustry energy demand in the United States, consuming232 trillion British thermal units (Btu; US EnergyInformation Administration [EIA] 2013). A significantportion of total energy demand at sawmills is derived fromrenewable energy sources, mostly primary processingresidue from mill operations with some slash from loggingoperations (hereafter referred to as biomass) that is used asfuel for process heat and power (US Department of Energy[DOE] 2011). Of the 1,931 trillion Btu of wood energyconsumed in the United States in 2009, 211 trillion Btu wasconsumed by sawmills for lumber production (EIA 2011,2012). In 2007 the US Environmental Protection Agency(EPA) estimated that greater than 65 percent of total woodproduct manufacturing energy requirements was met bywood bioenergy, and in 2013 the American Wood Council(AWC) estimated that 58 percent of the energy requirementfor softwood lumber production came from wood bioenergy(EPA 2007, AWC 2013).
In the western United States, which has the largestsoftwood lumber–producing capacity in the country(Spelter et al. 2009), the forest products industry hasundergone substantial changes since 2002, particularly inthe southwestern states of Arizona, Colorado, and NewMexico. During 2002, 282.3 million board feet (MMBF)Scribner were harvested from forestlands in these states,and in 2012 harvest was 182.3 MMBF (Morgan et al. 2006,Sorenson et al. 2016). Additionally, the number ofsawmills declined from 82 to 62 during that time, andsawmill production capacity declined from 470 to 348MMBF/yr. The origin of harvested timber also shiftedsignificantly. In 2002 the majority of timber harvested wasfrom private and tribal timberland, whereas in 2012approximately 75 percent of harvested timber came fromlands managed by the US Forest Service (Sorenson et al.2016). Considering the recent changes in the woodproducts industry in these three states, together withincreasing recognition of the benefits of renewable energy,it is important that the industry, policymakers, and thepublic are aware of this industry’s energy requirements,carbon footprint, and potential for expanding renewableenergy usage to displace fossil fuels (Database of StateIncentives for Renewables & Efficiency 2016).
There are many reasons why accurate data describing theenergy consumption and emissions associated with thesawmill industry in the southwestern United States areneeded. In 2012, a total of 3,550 trillion Btu of primaryenergy was consumed in the southwestern states of Arizona,Colorado, and New Mexico, or about 3.7 percent of total USenergy (EIA 2015a). The vast majority of energy producedand consumed in these three states is derived from fossilsources, except that Arizona has substantial nuclear powergenerating capacity. Only 7.8 percent of total energyconsumption was produced from renewable sources in thethree states (EIA 2015a). In regions outside the Southwest,the wood products industry is both a major producer andconsumer of renewable energy (Loeffler et al. 2016). Incontrast, a significant portion of the industry’s energy needsin the Southwest are met by nonrenewable sources. On thebasis of scale, energy intensity, and generation of biomassby-products, the wood products industry in the Southwest is
a logical area in which to develop new bioenergy capacity(EIA 2015b).
A basic understanding of current energy requirements forsawmill operations in the Southwest is lacking, as are datadescribing the emissions generated by the industry duringproduction of sawn products. There is no availableinformation describing the current status of Southwestsawmills’ energy consumption and emissions at scales thatcan adequately inform decision making and public policy.Although firm-level audits of energy consumption atsawmills are often conducted to guide internal decisionmaking, results are typically proprietary, and rarelyaggregated in ways that make industry-level informationavailable to the public, policymakers, and other stakehold-ers. Furthermore, results are representative of specific milloperations and do not account for efficiency and operationalvariations among sawmills. Because the structure andproductivity of wood products industries varies from regionto region, simply applying or extrapolating national- orregional-level energy estimates to other regions is notappropriate.
Objectives
Presently there is a lack of information describingsouthwestern energy consumption and emissions generatedfrom the sawmilling industry. Analysis at this scale is mostimportant to regional and state policymakers, especially inareas where the wood products industry has experiencedsignificant change. Specifically, empirical energy consump-tion data and high-resolution profiles of energy use andemissions are needed to identify opportunities for energyefficiency gains, industrial bioenergy expansion, andpotential fossil fuel displacement in the sawmill industry.In addition, generating estimates of emissions associatedwith the industry provides baseline information from whichanalysis of emissions reductions or displacement can occurthrough expanded renewable energy production.
In this effort, we begin to address these knowledge gapsby providing aggregated energy consumption and selectedemissions data and analysis for sawmills in the southwest-ern states of Arizona, Colorado, and New Mexico using asurvey of 2012 operations. It is worth noting that 2012lumber production in the three states was about 68 percentof 2002 production (Sorenson et al. 2016), and thisrepresents substantial upheaval in the industry. Given that20 sawmills have closed since 2002 in a region with lowsawmill capacity compared with its forested area, thesawmills that remain in production have weathered thedeep market downturn of the Great Recession of 2007 to2009, and are under market pressure to remain competitivein national and global markets, especially by reducingcosts and increasing efficiency (Woodall et al. 2012).Moreover, national and state policies demand that moreenergy derived from renewable sources be utilized todisplace fossil fuels and reduce additions to atmosphericcarbon and greenhouse gas concentrations. Aggregatingenergy consumption at this level is detailed enough toallow individual firms to gauge energy efficiency relativeto their competitors, yet broad enough to afford policy-makers a solid basis for decision making by characterizingan economically important manufacturing industry at thestate and sector levels.
FOREST PRODUCTS JOURNAL Vol. 66, No. 5/6 327

Methods
This study focused on the sawmill industry of the woodproduct manufacturing sector in the southwestern states ofArizona, Colorado, and New Mexico, and generally followsthe methods of Loeffler et al. (2016). To address theknowledge gaps that exist between regional and nationalenergy and emissions assessments, and to better understandfuels, energy needs, and emissions associated with sawmills,we compiled energy consumption information for sawmillsoperating in these states during calendar year 2012. Thisyear was selected because detailed sawmill production datawere being collected by the authors in conjunction withanother research effort (Sorenson et al. 2016). Energyconsumption is quantified by fuel type and renewable ornonrenewable designation, and presented in units of bothtotal energy consumption and per unit production. Selectedemissions are presented in total emissions, per unitproduction, and potentially avoided fossil fuel emissions.We further present results in light of production trends in theindustry.
Study area
The geographic boundaries for this analysis are the statesof Arizona, Colorado, and New Mexico (Fig. 1). Ranging inelevation from 70 to 13,161 feet, the forests of Arizona andNew Mexico are dominated by primarily pinyon-juniper(Juniperus spp., Pinus edulis, and Pinus monophylla),ponderosa pine (Pinus ponderosa), woodland hardwoods,and to a much lesser extent the dry mixed conifer foresttype, which is composed primarily of Douglas-fir (Pseu-dotsuga menziesii), white fir (Abies concolor), white pine(Pinus monticola), and blue spruce (Picea pungens).Ranging in elevation from 3,315 to 14,413 feet and athigher latitude, Colorado generally has more diverse forestecosystems. Pinyon-juniper dominates lower elevations andcomprises the majority of forestland in the state; the fir–spruce–mountain hemlock (Abies spp., Picea spp., andTsuga mertensiana) vegetation group is the second-mostcommon type by area; and the aspen-birch (Populustremuloides and Betula spp.) group also has significantacreage in Colorado. To a lesser yet still significant extent,hardwoods, lodgepole pine (Pinus contorta), ponderosapine, and Douglas-fir are present throughout Colorado.Across all ownerships, these states have a combined total of66.3 million acres of forestland, with Arizona containing18.6 million acres, Colorado containing 22.9 million acres,and New Mexico containing 24.8 million acres. Of thisamount, the US Forest Service manages approximately 26.7million acres, or 35 percent of total forestland in the threestates. Four million acres of these Forest Service lands arereserved and timber harvesting is prohibited on reservedlands (US Department of Agriculture [USDA] 2013).
Working with university and state cooperators, the USForest Service has monitored the sawmilling industry inArizona, Colorado, and New Mexico since at least 1967(Wilson and Spencer 1967, Setzer and Wilson 1970). Inthese states the number of forest products mills, employ-ment, volume of timber harvested, timber processingcapacity, and volume of lumber produced has declinedsubstantially from historical highs in the 1960s and 1980s(Hayes et al. 2012, Sorenson et al. 2016). Despite thedecline, the industry has remained an important outlet forwoody material produced by public, private, and tribal
forestland owners and managers. Whether managementgoals are to reduce the risk and impacts of wildfire, generaterevenue, or restore functioning ecosystems, sawmillscontinue to be the leading purchasers and users of timberharvested, accounting for 65 to 80 percent of the timberharvested or processed in the three states. However, othertimber products, particularly industrial fuelwood, haveincreased as a proportion of the total harvest volume(Sorenson et al. 2016). As sawmilling infrastructure hasdeclined, management activities have increasingly focusedon removing smaller-diameter trees for forest restorationand fire hazard reduction (Reynolds et al. 2013). In 2012there were 110 wood product manufacturers in the threestates that converted timber into lumber, house logs, postand poles, vigas and latillas (i.e., roof and ceiling timbers),log furniture, pellets, animal bedding, and fuelwood. Sixty-one of these facilities were sawmills, which employed 475people (Bureau of Labor Statistics 2015, Sorenson et al.2016).
Survey
Statewide censuses of timber processing facilities areperiodically conducted as part of a national effort to collectand report timber products output (TPO) information for theUS Forest Service Forest Inventory and Analysis Program.The censuses are intended to collect and report utilization oftimber harvest, quantify primary forest products firmsoperating at the time of the census and their sources ofraw material, and quantify the outputs and sales values offinished products and residues (Sorenson et al. 2016). In2013 an energy questionnaire was designed to coincide withthe TPO census of timber processors in Arizona, Colorado,and New Mexico for calendar year 2012 activities to collectsawmill energy consumption information for the same year.The questionnaire collected information about each saw-mill’s 2012 energy consumption by energy source using aseries of open-ended questions grouped in three distinctsections: fuel for equipment, nonelectric heat and steam, andelectricity. Mailing was paired with follow-up phone calls toincrease participation in the survey.
The questionnaire asked specifically for consumption ofdiesel, gasoline, and propane for on-site rolling stock;consumption of wood/hog fuel, natural gas, heating oil, andpropane for thermal needs, including both heat and steam;and consumption of electricity, including grid power andon-site generation (e.g., a stand-alone generator), withassociated consumption of wood/hog fuel, natural gas,diesel, gasoline, and propane for on-site power generation.In all cases, ‘‘other’’ and ‘‘other fuel’’ options wereprovided, with space for description, and the questionnairealso included a question asking for a description of any on-site biomass system that was operational but not used in2012. For grid electricity, each respondent’s electricityprovider was identified, and this information was used todetermine the proportion of each sawmill’s grid electricitygenerated from different sources on the basis of theelectricity provider’s portfolio. Portfolios in this regioninclude variable combinations of power from nuclear,natural gas, coal, solar, wind, and hydro. Clarification ofquestionnaire responses was made using follow-up phoneinterviews. As previously discussed, the sawmill industryhas enough facilities in this region to protect proprietarydata for individual firms, ensure an adequate number ofresponses, and produce results that are comparable with
328 LOEFFLER ET AL.

other regional- and national-level figures. This analysis
includes 22 of the 61 sawmills active in 2012, which is a
response rate of 36 percent, and these 22 sawmills
accounted for 35 percent of 2012 lumber production in the
three-state area.
As a frame of reference, a Bergman and Bowe (2008)
study on the environmental impact of hardwood lumber
production was based on 20 mills, which accounted for 6.5
percent of production in the region. This is within the 5
percent requirement for data quality recommended by the
Consortium for Research on Renewable Industrial Materials
(Consortium for Research on Renewable Industrial Materi-
als 2001). Further, the fact that the average lumber
production of respondent mills is roughly equal to the
average lumber production of nonresponding mills decreas-
es the likelihood of nonresponse bias in our sample.
Characteristics of respondents compared with nonrespon-
dents—mill size in this case—are among the strongest
predictors of the relationship between response rate and
nonresponse bias (Groves 2006, Groves and Peytcheva
2008).
In this article, we analyze only energy consumption onthe premises of each sawmill and exclude energy used inother segments of the supply chain, including transportationof raw materials and finished goods. Likewise, emissionsestimates are based upon on-site energy consumption and donot include emissions from energy consumed off-site, suchas diesel fuel used in harvesting and transportation, forexample. Emissions associated with the electricity generatedoff-site but consumed on-site at sawmills are included. Datafrom the survey are aggregated and summarized to protectconfidentiality.
Fuel consumption and energy
The unit of energy reported in this analysis is the Britishthermal unit, which is the amount of energy needed to raisethe temperature of 1 pound of water at maximum densitythrough 18F. We express energy consumption in orders ofmagnitude of British thermal units, where each ‘‘M’’represents 103 Btu. Though not an accepted internationalsystem (SI) unit, the British thermal unit is a commonenergy measurement in the United States, and is used by theindustry in the Southwest. For comparison with SI units, we
Figure 1.—Location of all sawmills in Arizona, Colorado, and New Mexico in 2012.
FOREST PRODUCTS JOURNAL Vol. 66, No. 5/6 329

note that 1 Btu is equivalent to 1.055 kJ. Lumber productionand associated compound units are presented in thousandboard feet (MBF) lumber tally, which is the standard unit ofproduction used in the region.
The sawmills in this study all had different mixes of fuelsused on-site for lumber manufacturing, which we categorizeas either nonrenewable (generated from fossil fuels ornuclear reaction) or renewable (generated from nonfossiland nonnuclear sources). In this analysis, on-site wood andbark combustion and those portions of electricity producedfrom hydroelectric dams, solar energy, and wind areconsidered renewable. No sawmills in this study had on-site solar, wind, or geothermal capacity.
Woody biomass
Although electricity production using steam turbinesoccurs at some forest products mills, wood and bark areprimarily used to fire boilers to generate steam to supplyheat to lumber-drying kilns, which are very energy intensive(Wengert and Meyer 1992, Bond 2008). In fact, lumberdrying is typically the most intensive energy requirement atsawmills, followed by sawing and material handling(Wengert and Meyer 1992, Forest Products Laboratory[FPL] 1999). Biomass energy in the form of wood and barkconsumed at sawmills in regions other than the Southwest isalmost exclusively supplied from on-site mill residue.Because of the ambient atmospheric heat and aridity ofthe southwestern United States, and low equilibriummoisture contents (FPL 1999), very few sawmills in theregion require drying kilns, and only one sawmill in thisanalysis reported operating a lumber-drying kiln. As aresult, on-site sawmill demand for residue is very low, andas discussed below, residue markets are well established.There is, however, significant biomass in the form oflogging residue associated with harvesting the timberprocessed by sawmills.
Logging residue is generated when timber products areharvested. Estimates of potentially available quantities oflogging residue associated with the timber processed by the22 sawmills in this analysis were developed using the samemethods used in the TPO database (USDA 2015). Estimatesof logging residue attributable only to the timber processedby sawmills in this analysis were derived using acombination of logging utilization studies (Morgan andSpoelma 2008, Simmons et al. 2014, Bureau of Businessand Economic Research [BBER] 2015) and a whole treevolume study (Van Hooser and Chojnacky 1983). Thelogging utilization studies provided information for calcu-lating bole residue associated with sawlog harvest, and thewhole tree volume study provided information for calculat-ing residue from limbs and tops. Substantial quantities oflogging residue in excess of the quantities associated withsawmill timber use in this analysis exist in the region. Forexample, the TPO database shows that more than 7 millionft3 (105,000 dry tons) of logging residues were generatedfrom 2012 timber harvests in Arizona, Colorado, and NewMexico (USDA 2015).
The length of time that logging residue remains in theforest is highly variable and can affect the quality of theresidue for use as fuel, most notably by changes in moisturecontent. Substantial drying will occur over time, andmoisture content has a significant impact on the heatingvalue of wood and bark (Jenkins et al. 1998). There isgeneral consensus that a linear relationship exists between
moisture content and higher and lower heating values ofwood and bark (Shelton 1942, Bowyer et al. 2007).However, sawmills in this analysis did not use anymeasureable wood and bark for energy. To estimatepotential energy substitution and emissions, we estimatedmoisture contents for each of the four most commonlyharvested species—ponderosa pine, lodgepole pine, Engel-mann spruce (Picea engelmannii), and Douglas-fir—whichtogether constituted 90 percent of the total 2012 timberharvest in the three states (Sorenson et al. 2016). This wasdone using moisture contents for different portions of woodand bark reported in Wilson et al. (1987, 2010). The averageof the four species’ moisture contents was used to determinethe higher heating values used in this analysis (Table 1).Using species-specific higher heating values (HHV) forcombinations of wood and bark found in Wilson et al.,energy contents were weighted on the basis of each species’proportion of the four species combined total: 53 percentponderosa pine, 26 percent lodgepole pine, 11 percentEngelmann spruce, and 10 percent Douglas-fir. Last,weighted average energy contents were adjusted to reflectthe average moisture contents on the basis of the followingequation:
Energy content
¼ HHV 3 1� percent moisture content ðwet basisÞ100
� �
Results were used to inform the amount of loggingresidues that would be needed to offset alternative energysources, as well as determine the associated emissions trade-offs. Because we cannot predict the moisture contents ofwood and bark at the time of combustion, our estimates arebased upon the highest likely moisture content in biomass.Therefore, less biomass would be required for equivalentenergy substitution with further drying and lower biomassmoisture content.
Fossil fuels and electricity
Energy content for fossil fuels consumed on-site atsawmills in these states in 2012 were obtained from the EIA(2015c) and are displayed in Table 2. The energy productionportfolio of each sawmill’s electricity provider was used todetermine the portion of electrical energy attributable torenewable and nonrenewable sources. Electricity productionin the Southwest United States is quite different fromproduction in other regions, such as the Northeast andSoutheast United States (Milota et al. 2005; Bergman andBowe 2010, 2012). Many sawmills in this analysispurchased power from cooperatives supplied by a large
Table 1.—Assumed moisture contents and higher heatingvalues for wood and bark.a
Species
Percent moisture
content (wet basis)
Higher heating
value (Btu/dry lb)
Wood Bark Wood Bark
Douglas-fir 33.7 51.6 8,759 10,109
Engelmann spruce 44.1 47.6 8,653 9,018
Lodgepole pine 49.8 46.0 8,600 10,035
Ponderosa pine 52.4 33.1 9,120 9,516
Avg. 45.0 44.6 8,783 9,670
a Source: Wilson et al. (1987, 2010).
330 LOEFFLER ET AL.

generation and transmission association. Nine of the 14electricity suppliers in this analysis obtained most or all oftheir power from the association, which in 2012 had anenergy production portfolio that was 67 percent from coal-fired power plants, 16 percent from hydroelectric dams, 14percent from contract sources, and the remaining 3 percentwas obtained from a combination of wind, solar energy, andnatural gas. The origin of contract power is unverifiable andconsidered nonrenewable in this analysis. Effectively, theassociation’s energy portfolio was 18 percent renewable in2012. Although a portion of contract electricity is likely tobe renewable in this region, this cannot be verified.Therefore, the categorization of contract sources asnonrenewable in this study means the distribution ofrenewable and nonrenewable sources should be viewed asa minimum renewable scenario.
Emissions
In this analysis we report emissions of CO2, CH4, NOx
(nitrogen oxides), SOx (sulfur oxides), and PM10 (particulatematter � 10 lm). The emissions reported in this analysis arefrom fuels consumed on-site at the sawmills, and whenpossible from the fuels consumed off-site for generatingelectricity used by sawmills. As previously noted, the mostenergy-intensive component of lumber production through-out the country is drying sawn products in a kiln, andbecause only one sawmill in this analysis operated a dryingkiln during 2012, overall energy consumption, and thereforeemissions from energy use, are likely much lower atsawmills in the Southwest than for other regions of thecountry. For the fuels consumed on-site, emissions wereestimated using a combination of fuel energy contents(Table 2) and emission factors obtained from the EPA. Forelectricity production, emission estimates were obtainedfrom literature evaluating life-cycle inventories of bothnatural gas and coal-fired power plants. Emission factorsand related references are displayed in Table 3. Althoughthere are likely emissions associated with electricityproduction from solar energy, wind, and hydropower,
typically from operations and maintenance of thesefacilities, to our knowledge there are no estimates of theseemissions in the literature. Similarly, we were unable tolocate estimates of operational emissions associated withnuclear power production. Last, because the sources ofcontract power are unidentifiable, we do not estimateemissions associated with contract power production, andfurther note that overall emissions reported here areunderestimated because of these data constraints.
After almost any type of mechanical forest operation inthe western United States, forest land managers continue tostruggle with disposing of logging residue (i.e., biomass) bymeans other than burning on-site (Morgan et al. 2011). Anabundance of time, energy, and financial resources havebeen devoted to researching and demonstrating value-addedalternatives to open burning, most notably, removal forenergy production at facilities close to the treatment site(Loeffler et al. 2010). However, if biomass is not used, itfrequently must be disposed to meet federal or state laws forfire hazard reduction and other silvicultural requirements.Emissions associated with biomass burning in the woods arein different mixes and quantities than when burned in acontrolled combustion environment such as a boiler(Loeffler and Anderson 2014). Table 3 displays emissionfactors for open-burning biomass.
Results and Discussion
Production and energy consumption
During 2012, total lumber production at sawmills inArizona, Colorado, and New Mexico was 169 MMBF, or 49percent of production capacity, accounting for less than 1percent of total 2012 US lumber production, and slightlymore than 1 percent of all western US lumber production(Zhou 2013). This analysis includes 22 of the 61 regionalsawmills active in 2012, accounting for 36 percent of totalregional lumber production, or 58.5 MMBF lumber tally.Annual production by sawmills in this analysis ranged from0.1 to 9 MMBF, with average production of 2.7 MMBF. Forcomparison, nonrespondent sawmills averaged 2.8 MMBFin annual production. Total 2012 residue production atsawmills in the three states was 83,000 bone dry tons(BDT), of which 15,500 BDT was bark. Sixty-three percentof mill residue was used to make other products, 36 percentwas used for energy (including firewood), and the remainderwas unused. Table 4 displays the volumes and distributionof residue from the 22 sawmills in this analysis (Sorenson etal. 2016). In addition to sawmill residue production, 25,300BDT of logging residue associated with the timberprocessed by the 22 sawmills was generated, which does
Table 2.—Assumed energy contents per unit of fuel.
Fuel Unit MMBtu/unita
Diesel Gallon 0.1374
Gasoline Gallon 0.1205
Propane Gallon 0.0913
Electricity Kilowatt hour 0.0034
a MMBtu¼million British thermal units.
Table 3.—Factors used to estimate emissions from southwestern sawmill operations.
Fuel CO2 CH4 NOX PM10a SOX References
Diesel fuel (lb/gal) 22.530 0.0 0.6045 0.0430 0.0398 EPA 1995, EIA 2015c
Gasoline fuel (lb/gal) 18.533 0.0 0.1964 0.0120 0.0101 EPA 1995, EIA 2015c
Propane (lb/gal) 12.5 0.0002 0.0130 0.0007 0.0011 EPA 1995, EIA 2015c
Electricity (lb/kWh)b 1.7612 0.0037 0.469 0.1688 0.4107 Spath et al. 1999, Spath and Mann 2000
Biomass—burn on-site (lb/ton)c 2,175.22 7.58 3.89 8.25 2.35 Yokelson et al. 1996, Hardy et al. 2001, Urbanski 2010d
a PM10 ¼ particulate matter � 10 lm.b Weighted average of reported emissions from coal and natural gas-fired power plants based upon the proportion of electricity generated by coal and natural
gas reported by sawmills in this analysis.c Assume 30 percent moisture content at time of combustion and all but 5 percent of logging slash piles fully consumed.d Sean Urbanski, Missoula Fire Science Laboratory, personal communication, 2010.
FOREST PRODUCTS JOURNAL Vol. 66, No. 5/6 331

not include the smaller, nonmerchantable trees that mayhave been cut or killed during treatment.
Weighted average energy contents of wood and bark forthe four most commonly harvested species in 2012, adjustedto moisture contents of 45 percent for wood and 44 percentfor bark (wet basis), were determined to be 9.7 MMBtu/tonof wood and 10.9 MMBtu/ton of bark. Using the averagewood and bark energy content, 260,770 MMBtu iscontained in the calculated logging slash total. As withbiomass used for energy substitution, it is important to notethat the energy content of logging residues will vary on thebasis of moisture content, and that our results likelyrepresent the highest possible usage with the combustiontechnology appropriate for these moisture contents.
Fuel and associated energy consumption at sawmills inthe three states in 2012 are displayed in Figure 2 and Table5. The 22 southwestern sawmills in this study consumedapproximately 64,800 MMBtu of energy in 2012. Dieselfuel constituted the vast majority of energy consumption atsawmills, representing 64 percent of total energy. Electricitymade up 35 percent of total energy, gasoline made up 3percent, and propane and wood combined made up 1percent. All sawmills used a substantial amount of dieselfuel on-site. Four sawmills reported being off the electricgrid entirely, 12 reported using gasoline, and 6 reportedusing propane on-site. None of the respondent sawmillsreported using biomass for energy other than for woodstoveheat. As noted earlier, on-site sawmill demand for residuesis very low, primarily because of the prevalence of air-drying lumber. All gasoline, 94 percent of diesel, and 71percent of propane was reported as used for on-site supportequipment such as rolling stock (e.g., log loaders, forklifts).Three sawmills reported using diesel to power generators forelectricity production, and a small amount of diesel wasreported to fuel a drying kiln at the single sawmill thatreported operating a drying kiln in 2012.
Southwestern sawmills consumed a substantial amount ofgrid electricity in 2012, which provided 35 percent of totalenergy. Overall, the aggregate energy portfolio of south-western sawmills is tilted toward nonrenewable energysources; all sawmills that used grid electricity were suppliedby the association or cooperatives that either produced orobtained a major portion of power from coal or natural gaspower plants. Four sawmills obtained a portion of powerfrom nuclear sources; 15 obtained a portion of power fromcontract sources; and all but one sawmill obtained somepower from hydroelectric, solar, or wind sources. Foursawmills reported using no grid electricity. Of the total gridelectricity consumption, 84 percent was generated fromnonrenewable sources (coal, natural gas, nuclear, or contractsources) and 16 percent from renewable sources (hydro-electric, wind, or solar). Fifty-seven percent of gridelectricity consumed at sawmills in this analysis wasobtained from coal, 15 percent from contract sources, 12percent hydropower, 9 percent natural gas, 4 percentnuclear, and 3 percent wind or solar.
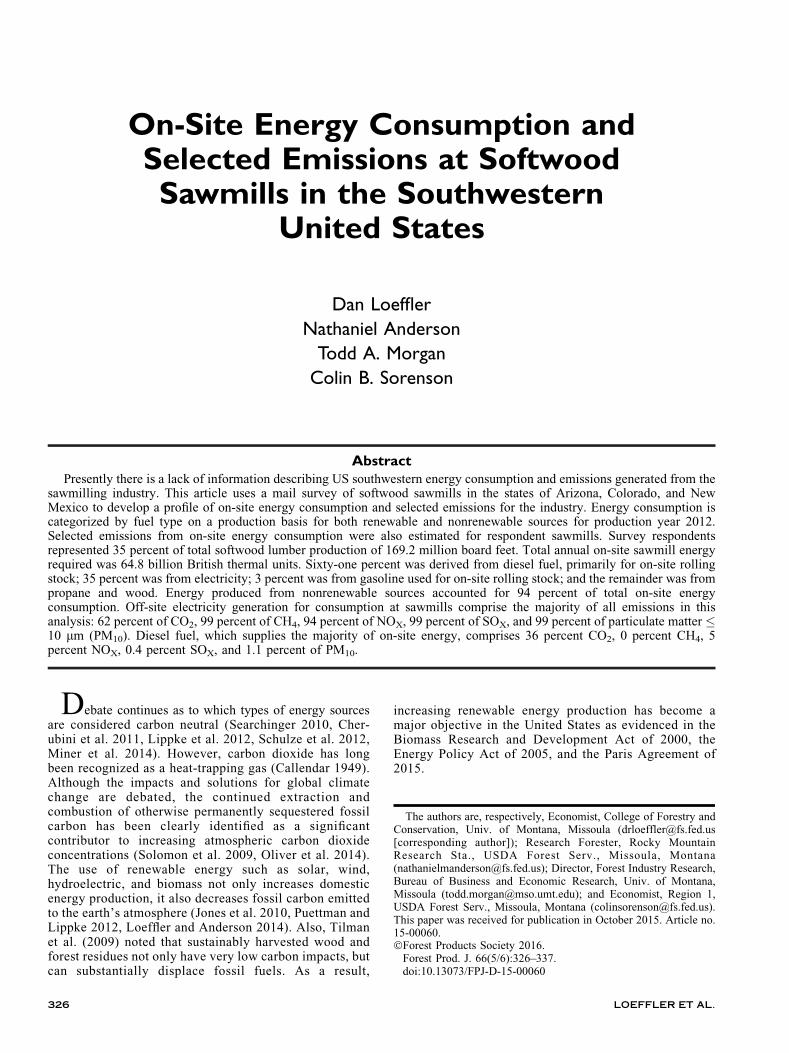
Table 6 displays the distribution of fuels used to generateelectricity off-site by the association and cooperatives.Figure 3 displays the distribution of fuels that theassociation and cooperatives used to generate grid electric-ity for each sawmill in the sample. Aside from solar, wind,natural gas, and contract sources, the percent distribution offuel sources to generate electricity off-site is similar to the
Table 4.—Distribution of sawmill residues in this analysis in2012.
Coarse Fine Bark Total
Residues sold for products (BDT)a 21,590 17,128 13,585 52,303
Residues used for energy (BDT) 27,484 1,324 970 29,777
Residues not used (BDT) 0 16 916 932
a One bone dry ton (BDT) equals 1 ton of residue at 0 percent moisture
content.
Figure 2.—Categorical distribution of energy consumed on-siteat sawmills in this analysis in Arizona, Colorado, and NewMexico in 2012.
Table 5.—Total fuel and energy consumption on-site at sawmills in this analysis in 2012, and fuel energy consumption on aproduction basis.a
Fuel Total fuel consumed Total MMBtu consumed on-site MMBtu percent of total MMBtu/MMBF of lumber
Diesel (gal) 286,593 39,375 60.7 673.1
Gasoline (gal) 16,827 2,027 3.1 34.7
Propane (gal) 4,860 444 0.7 7.6
Electricity, nonrenewable (kWh) 5,654,972 19,295 29.8 329.9
Electricity, renewable (kWh) 983,481 3,356 5.2 57.4
Wood, 45% moisture (ton) 60 311 0.5 5.3
Total from nonrenewable 61,154 94.3 1,045.5
Total from renewable 3,666 5.7 62.7
Grand total 64,821 100 1,108.2
a MMBtu¼million British thermal units; MMBF¼million board feet.
332 LOEFFLER ET AL.
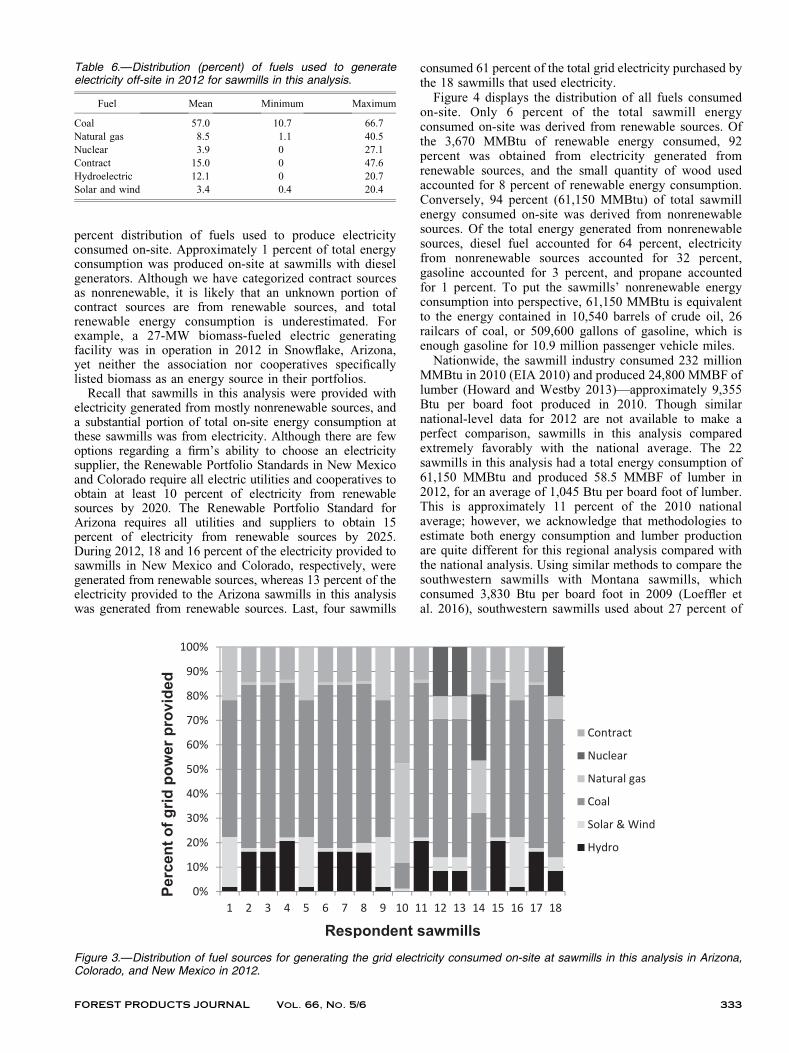
percent distribution of fuels used to produce electricityconsumed on-site. Approximately 1 percent of total energyconsumption was produced on-site at sawmills with dieselgenerators. Although we have categorized contract sourcesas nonrenewable, it is likely that an unknown portion ofcontract sources are from renewable sources, and totalrenewable energy consumption is underestimated. Forexample, a 27-MW biomass-fueled electric generatingfacility was in operation in 2012 in Snowflake, Arizona,yet neither the association nor cooperatives specificallylisted biomass as an energy source in their portfolios.
Recall that sawmills in this analysis were provided withelectricity generated from mostly nonrenewable sources, anda substantial portion of total on-site energy consumption atthese sawmills was from electricity. Although there are fewoptions regarding a firm’s ability to choose an electricitysupplier, the Renewable Portfolio Standards in New Mexicoand Colorado require all electric utilities and cooperatives toobtain at least 10 percent of electricity from renewablesources by 2020. The Renewable Portfolio Standard forArizona requires all utilities and suppliers to obtain 15percent of electricity from renewable sources by 2025.During 2012, 18 and 16 percent of the electricity provided tosawmills in New Mexico and Colorado, respectively, weregenerated from renewable sources, whereas 13 percent of theelectricity provided to the Arizona sawmills in this analysiswas generated from renewable sources. Last, four sawmills
consumed 61 percent of the total grid electricity purchased bythe 18 sawmills that used electricity.
Figure 4 displays the distribution of all fuels consumedon-site. Only 6 percent of the total sawmill energyconsumed on-site was derived from renewable sources. Ofthe 3,670 MMBtu of renewable energy consumed, 92percent was obtained from electricity generated fromrenewable sources, and the small quantity of wood usedaccounted for 8 percent of renewable energy consumption.Conversely, 94 percent (61,150 MMBtu) of total sawmillenergy consumed on-site was derived from nonrenewablesources. Of the total energy generated from nonrenewablesources, diesel fuel accounted for 64 percent, electricityfrom nonrenewable sources accounted for 32 percent,gasoline accounted for 3 percent, and propane accountedfor 1 percent. To put the sawmills’ nonrenewable energyconsumption into perspective, 61,150 MMBtu is equivalentto the energy contained in 10,540 barrels of crude oil, 26railcars of coal, or 509,600 gallons of gasoline, which isenough gasoline for 10.9 million passenger vehicle miles.
Nationwide, the sawmill industry consumed 232 millionMMBtu in 2010 (EIA 2010) and produced 24,800 MMBF oflumber (Howard and Westby 2013)—approximately 9,355Btu per board foot produced in 2010. Though similarnational-level data for 2012 are not available to make aperfect comparison, sawmills in this analysis comparedextremely favorably with the national average. The 22sawmills in this analysis had a total energy consumption of61,150 MMBtu and produced 58.5 MMBF of lumber in2012, for an average of 1,045 Btu per board foot of lumber.This is approximately 11 percent of the 2010 nationalaverage; however, we acknowledge that methodologies toestimate both energy consumption and lumber productionare quite different for this regional analysis compared withthe national analysis. Using similar methods to compare thesouthwestern sawmills with Montana sawmills, whichconsumed 3,830 Btu per board foot in 2009 (Loeffler etal. 2016), southwestern sawmills used about 27 percent of
Table 6.—Distribution (percent) of fuels used to generateelectricity off-site in 2012 for sawmills in this analysis.
Fuel Mean Minimum Maximum
Coal 57.0 10.7 66.7
Natural gas 8.5 1.1 40.5
Nuclear 3.9 0 27.1
Contract 15.0 0 47.6
Hydroelectric 12.1 0 20.7
Solar and wind 3.4 0.4 20.4
Figure 3.—Distribution of fuel sources for generating the grid electricity consumed on-site at sawmills in this analysis in Arizona,Colorado, and New Mexico in 2012.
FOREST PRODUCTS JOURNAL Vol. 66, No. 5/6 333

the energy per board foot consumed by Montana sawmills.This is likely owing to many factors, including sawmillequipment and configuration, number of operating shifts,species mix, fuels consumed, climate, and energy efficiency.Most notably, however, the prevalence of air-drying lumberin the Southwest eliminates the use of highly energy-intensive drying kilns, which is common in Montana andmost other regions.
The sawmill industry in the United States is a majorproducer and user of renewable energy. In contrast,renewable energy production and consumption on-site atthese sawmills is very low. Their reported renewable energyconsumption is very closely tied to the proportion of electricgrid power attributable to renewables. Given the favorableclimate conditions for air-drying, associated lack of drykilns, relatively small production capacity of most facilities,and low electricity use per thousand board feet, there doesnot seem to be much need or opportunity for biomass energyproduction on-site. However, the use of biomass boilerscould have an important connection to residue management.Sawmills and timber purchasers look for the most profitable,or least costly, ways to dispose of their residue. Localmarkets for sawmill residue are currently more limited inthe Southwest than in other regions because there are nopulp mills or reconstituted board plants. However, thesesawmills are small, low-volume producers and geographi-cally dispersed, which may allow them to sell effectivelyinto local bioenergy markets where possible and capitalizeon further market development, rather than use bark andother residue for on-site heat and power like many largesawmills in other regions. This is an interesting topic forfurther study in the context of distributed scale biomassenergy systems, including biomass heating and combinedheat and power systems for institutions, as well as small- tomedium-scale biomass power plants. This result alsosupports the importance of high-resolution state andregional analyses to complement sector-level and nationalstudies, which do not always account for important regionalvariability in the industry.
Emissions
Emissions of CO2, CH4, NOX, SOX, and PM10 generatedby sawmills in the southwestern United States have not been
documented generally or reported in the literature. Usingemission factors referenced in Table 3, total emissions fromsawmilling operations in the three states were estimated;Table 7 displays the total emissions produced by sawmills inthis analysis by fuel source. Off-site electricity generationfor consumption at sawmills constituted the majority of allemissions in this analysis: 62 percent of CO2, 94 percent ofNOX, and 99 percent of CH4, SOX, and PM10. Diesel fuel,which supplies the majority of on-site energy, comprises 36percent CO2, 0 percent CH4, 5 percent NOX, 0.4 percentSOX, and 1.1 percent of PM10. Other CO2 emission sourcesare from gasoline (1.6%), wood (0.6%), and propane(0.3%). Diesel fuel combustion contributed 1.1 percent ofPM10 emissions, 5.3 percent of NOX emissions, and 0.4percent of SOX emissions. Gasoline fuel combustioncontributed 1.6 percent CO2, and only 0.1 percent of NOX
emissions, with no other notable emissions. Emissions fromelectricity generated on-site by diesel and gasoline fuelswere included in these estimates.
It is likely that the majority of logging residues associatedwith the timber processed by the 22 sawmills in this analysisrequired disposal of some kind for compliance with federalor state laws, and for other silvicultural purposes. Sawmillsincluded in this analysis processed slightly more than 49MMBF (Scribner) of timber, which when delimbed andprocessed in the forest, yielded 25,300 BDT of loggingresidues. Emissions associated with burning logging resi-dues in the forest were estimated using emission factorspresented in Table 3, and assuming 30 percent moisturecontent at the time of combustion and all but 5 percent ofthe logging slash burned being fully combusted. Table 8displays the estimates: 27,536 tons of CO2, 96 tons of CH4,49 tons of NOX, 104 tons of PM10, and 30 tons of SOX wereemitted from burning the 25,300 tons of logging slash.Emissions of CO2 and CH4 from pile-burning loggingresidues are significantly greater than the total emissionsfrom sawmilling the timber associated with the loggingresidues, at 65 and 87 percent, respectively. However, PM10,NOX, and SOX emissions from pile burning are substantiallyless than those from sawmilling operations.
Considering that the Renewable Portfolio Standards forthe three states require that a larger share of electricityproduction comes from renewable sources, and that themajority of electricity production comes from coal-firedpower plants, cofiring logging residues with coal may be aviable option to meet the Renewables Portfolio Standards.Loeffler and Anderson (2014) have modeled the emissionsreductions associated with cofiring residues with coal inColorado. The energy contained in the electricity consumedat sawmills in this analysis is equivalent to 2,200 tons oflogging residues, and if the 2,200 tons were cofired withcoal, this would displace 1,100 tons of coal. If all 25,300tons of logging slash were cofired immediately afteroperations, 12,300 tons of coal would be displaced, whichis equivalent to approximately 100 railcars of coal. Yet,often because of financial constraints, large quantities ofunutilized logging slash is burned on-site at logging unitsbecause the cost of logistics to process and deliver thematerial exceeds the delivered price of biomass fuel.Although the literature discussing this topic is vast (Loeffleret al. 2010), additional research is necessary to determinefinancially optimal methods for utilizing otherwise wastedwood resources, especially logging slash.
Figure 4.—Distribution of all energy consumed on-site atsawmills in this analysis in Arizona, Colorado, and New Mexicoin 2012.
334 LOEFFLER ET AL.

It is difficult to provide more detailed analysis whilemaintaining confidentiality, but even though overall south-western sawmill energy use is low, the energy mix of thesouthwestern sawmilling industry highlights a broader issuerelated to expansion of biomass energy and other renewableenergy sources. The markets for sawmill residues are wellestablished, and although markets fluctuate, in 2012 just 1.1percent of residues from sawmills in this analysis wentunused (Table 4). In 2012, 36 percent of residues fromsawmills in this analysis were converted to energy, mostlyin the form of firewood, with the remainder serving as rawmaterial for other products. The distribution of sawmillresidues displayed in Table 4 asserts that clean residueshave higher value than fuel. On the basis of the fact thatsawmill residues are already leveraged, additional bioenergycapacity at sawmills is likely to be fueled by logging slash,and not sawmill residues. Given that the majority of on-sitesawmill energy consumption comes from diesel fuel,specific sawmills are potential candidates for additionalon-site energy production in the form of combined heat andelectricity production. Although not addressed in thisresearch, financial analyses of the benefits and costs ofadditional heat and power production capacity is clearlywarranted.
Although opportunities for new bioenergy capacity atsawmills in this region appear limited, primarily because oflow heat demand and small sawmill size, these results showpotential emissions and renewable energy benefits fromusing logging slash produced by this industry rather thanburning it in the forest for disposal. Dedicated biomasspower plants like the 27-MW facility in Snowflake, Arizona,and the 11-MW plant in Gypsum, Colorado, are suitableoptions. Wood pellet production is also an option, althoughindustrial pellets are likely a stronger possibility thanresidential pellets because of the higher ash content in
logging residue when compared with roundwood. Suchfacilities may benefit from national and state incentives forrenewable energy. For example, there are facilities in allthree states that are presently qualified biomass conversionfacilities under the Biomass Crop Assistance Program,which provides matching payments on approved biomasscontracts. Such facilities can also contribute to meeting stateRenewable Portfolio Standards, and improve the financialviability of forest restoration and fuel treatments byproviding markets for treatment residues.
Furthermore, expanding the bioenergy industry in theSouthwest will only occur when feedstock markets aresecure. The southwestern states in this analysis are heavilyforested with many millions of acres in need of restoration,have very low lumber production energy requirements, andneed to expand renewable energy production. Consequently,this region is well positioned to restore forested landscapes,expand rural employment and bioenergy production, andsignificantly contribute to climate change mitigation.
Conclusions
Unlike the forest industry in much of the United States,we have found that the majority of energy used on-site atsawmills in Arizona, Colorado, and New Mexico is derivedfrom nonrenewable sources. This is primarily owing to bothon-site use of large quantities of diesel fuel and the largepercentages of grid-delivered electricity generated fromfossil fuels. Most of the industrial, commercial, andresidential energy demand in this region is met bynonrenewable sources, and individual wood productsfacilities have similar portfolios. In addition, southwesternsawmills generally do not use drying kilns, which consumelarge amounts of energy and are usually served by wood-fired boilers. In the short term, biomass is unlikely to be ableto displace the liquid fuels used at these sawmills, butincreasing social demand for renewable energy could lead toimproved markets for biomass energy from which regionalsawmills may be able to benefit. Increased biomass energyis also likely to have emissions benefits, especially iflogging residues are used as fuel. More broadly, regional-level information like this can help guide state and localenergy policy, as well as inform more detailed life-cycleinventories and other analyses that quantify environmentalcosts and benefits beyond the gates of wood productsfacilities.
Literature CitedAmerican Wood Council (AWC). 2013. North American softwood
lumber. http://www.awc.org/pdf/EPDs/Softwood_Lumber_EPD.pdf.
Accessed September 30, 2015.
Table 7.—Total selected emissions (lb) from southwestern sawmill operations in this analysis in 2012.a
Fuel CO2 CH4 NOX PM10 SOX
Diesel fuel 6,816,311 0 182,909 13,033 12,042
Gasoline fuel 312,318 0 3,310 202 170
Propane 60,750 1 63 4 5
Electricity 11,691,643 24,562 3,113,434 1,120,571 2,726,413
Wood 119,546 13 300 178 15
Total 19,000,569 24,576 3,300,017 1,133,957 2,738,645
lb/MBF 324.8 0.4 56.4 19.4 46.8
a PM10 ¼ particulate matter � 10 lm; MBF¼ thousand board feet.
Table 8.—Total selected emissions from pile-burning loggingresidues associated with timber processed by southwesternsawmills in 2012.a
Emission
Total logging residue
burning emissions (lb)
CO2 55,072,000
CH4 192,000
NOX 98,000
PM10b 208,000
SOX 60,000
a Assume 30 percent moisture content and all but 5 percent of the logging
slash fully combusted.b PM10 ¼ particulate matter � 10 lm.
FOREST PRODUCTS JOURNAL Vol. 66, No. 5/6 335

Bergman, R. and S. Bowe. 2012. Life-cycle inventory of manufacturing
hardwood lumber in southeastern U.S. Wood Fiber Sci. 44(1):71–84.
Bergman, R. D. and S. A. Bowe. 2008. Environmental impact of
producing hardwood lumber using life-cycle inventory. Wood Fiber
Sci. 40(3):448–458.
Bergman, R. D. and S. A. Bowe. 2010. Environmental impact of
manufacturing softwood lumber in northeastern and north central
United States. Wood Fiber Sci. 42(CORRIM special issue):67–78.
Bond, B. 2008. Sawmill and treating insights: Rein in escalating energy
costs. http://www.palletenterprise.com/articledatabase/view.
asp?articleID¼2648. Accessed August 14, 2015.
Bowyer, J. L., R. Shmulsky, and J. G. Haygreen. 2007. Forest Products
and Wood Science: An Introduction. Blackwell, Ames, Iowa. 558 pp.
Bureau of Business and Economic Research (BBER). 2015. Logging
utilization studies. Unpublished raw data. University of Montana,
Missoula.
Bureau of Labor Statistics (BLS). 2015. Quarterly census of employment
and wages. http://www.bls.gov/cew/data.htm. Accessed November 25,
2014.
Callendar, G. S. 1949. Can carbon dioxide influence climate? Weather
4(10):310–314.
Cherubini, F., G. Peters, T. Berntsen, A. Stromman, and E. Hertwich.
2011. CO2 emissions from biomass combustion for bioenergy:
Atmospheric decay and contribution to global warming. Glob. Change
Biol. Bioenergy 3(5):413–426.
Consortium for Research on Renewable Industrial Materials (CORRIM).
2001. Research Guidelines for Life-Cycle Inventories. University of
Washington, Seattle. 47 pp.
Database of State Incentives for Renewables & Efficiency (DSIRE).
2016. http://www.dsireusa.org. Accessed August 20, 2015.
Forest Products Laboratory (FPL). 1999. Air drying of lumber. General
Technical Report FPL-GTR-117. USDA Forest Service, Forest
Products Laboratory, Madison, Wisconsin. 62 pp.
Groves, R. M. 2006. Nonresponse rates and nonresponse bias in
household surveys. Pub. Opin. Q. 70(5):646–675.
Groves, R. M. and E. Peytcheva. 2008. The impact of nonresponse rates
on nonresponse bias: A meta analysis. Pub. Opin. Q. 72(2):167–189.
Hardy, C. C., R. D. Ottmar, J. L. Peterson, J. E. Core, and P. Seamon
(Eds.). 2001. Smoke management guide for prescribed and wildland
fire. 2001 ed. National Wildfire Coordinating Group. 223 pp.
Hayes, S. W., T. A. Morgan, E. C. Berg, J. M. Daniels, and M. T.
Thompson. 2012. The Four Corners timber harvest and forest products
industry, 2007. Resource Bulletin RMRS-RB-13. USDA Forest
Service, Rocky Mountain Research Station, Fort Collins, Colorado.
61 pp.
Howard, J. L. and R. M Westby. 2013. U.S. timber production, trade,
consumption and price statistics 1965–2011. Research Paper FPL-RP-
676. USDA Forest Service, Forest Products Laboratory, Madison,
Wisconsin. 99 pp.
Jenkins, B. M., L. L. Baxter, T. R. Miles, Jr., and T. R. Miles. 1998.
Combustion properties of biomass. Fuel Proc. Technol. 54:17–46.
Jones, G., D. Loeffler, D. Calkin, and W. Chung. 2010. Forest treatment
residues for thermal energy compared with disposal by onsite burning:
Emissions and energy return. Biomass Bioenergy 34(5):737–746.
Lippke, B., R. Gustafson, R. Venditti, P. Steele, T. A. Volk, E. Oneil, L.
Johnson, M. E. Puettmann, and K. Skog. 2012. Comparing life-cycle
carbon and energy impacts for biofuel, wood product, and forest
management. Forest Prod. J. 62(4):247–257.
Loeffler, D. and N. Anderson. 2014. Emissions tradeoffs associated with
co-firing forest biomass with coal: A case study in Colorado, USA.
Appl. Energy 113:67–77.
Loeffler, D., N. Anderson, T. A. Morgan, and C. B. Sorenson. 2016. On-
site energy consumption at softwood sawmills in Montana. Forest
Prod. J. 66(3/4):155–163.
Loeffler, D., J. Brandt, T. Morgan, and G. Jones. 2010. Forestry-based
biomass economic and financial information and tools: An annotated
bibliography. General Technical Report RMRS-GTR-244WWW.
USDA Forest Service, Rocky Mountain Research Station, Fort Collins,
Colorado. 52 pp.
Milota, M. R., C. D. West, and I. D. Hartley. 2005. Gate-to-gate life-
cycle inventory of softwood lumber production. Wood Fiber Sci.
37(CORRIM special issue):47–57.
Miner, R. A., R. C. Abt, J. L. Bowyer, M. A. Buford, R. W.
Malmsheimer, J. O’Laughlin, E. E. Oneil, R. A. Sedjo, and K. W.
Skog. 2014. Forest carbon accounting considerations in US bioenergy
policy. J. Forestry 112(6):591–606.
Morgan, T. A., J. P. Brandt, J. D. Baldridge, and D. R. Loeffler. 2011.
Use of financial and economic analyses by federal forest managers for
woody biomass removal. West. J. Appl. Forestry 26(1):5–12.
Morgan, T. A., T. Dillon, C. E. Keegan, A. L. Chase, and M. T.
Thompson. 2006. The Four Corners timber harvest and forest products
industry, 2002. Research Bulletin RMRS-RB-7. USDA Forest Service,
Rocky Mountain Research Station, Fort Collins, Colorado. 63 pp.
Morgan, T. A. and T. P. Spoelma. 2008. California logging utilization:
2004. West. J. Appl. Forestry 23(1):12–18.
Oliver, C. D., N. T. Nassar, B. R. Lippke, and J. B. McCarter. 2014.
Carbon, fossil fuel, and biodiversity mitigation with wood and forests.
J. Sust. Forestry 33:248–275.
Puettmann, M. E. and B. Lippke. 2012. Woody biomass substitution for
thermal energy at softwood lumber mills in the US inland northwest.
Forest Prod. J. 62(4):273–279.
Reynolds, R. T., A. J. Sanchez Meador, J. A. Youtz, T. Nicolet, M. S.
Matonis, P. L. Jackson, D. G. DeLorenzo, and A. D. Graves. 2013.
Restoring composition and structure in southwestern frequent-fire
forests: A science-based framework for improving ecosystem
resiliency. General Technical Report RMRS-GTR-310. USDA Forest
Service, Rocky Mountain Research Station, Fort Collins, Colorado. 76
pp.
Schulze, E., C. Korner, B. Law, H. Haberl, and S. Luyssaert. 2012.
Large-scale production of bioenergy from forest biomass is neither
sustainable nor greenhouse gas neutral. Glob. Change Biol. Bioenergy
4:611–616.
Searchinger, T. 2010. Biofuels and the need for additional carbon.
Environ. Res. Lett. 10 pp.
Setzer, T. S. and A. K. Wilson. 1970. Timber products in the Rocky
Mountain States, 1966. RB-INT-9. USDA Forest Service, Intermoun-
tain Forest and Range Experiment Station, Ogden, Utah. 93 pp.
Shelton, J. W. 1942. The Woodburners Encyclopedia: An Information
Source of Theory, Practice and Equipment Relating to Wood as
Energy. Vermont Crossroads, Waitsfield. 155 pp.
Simmons, E. A., T. A. Morgan, E. C. Berg, S. J. Zarnoch, S. W. Hayes,
and M. T. Thompson. 2014. Logging utilization in Idaho: Current and
past trends. General Technical Report RMRS-GTR-318. USDA Forest
Service, Rocky Mountain Research Station, Fort Collins, Colorado. 15
pp.
Solomon, S., G.-K. Plattner, and P. Friedlingstein. 2009. Irreversible
climate change due to carbon dioxide emissions. Proc. Natl. Acad. Sci.
U. S. A. 106:1704–1709.
Sorenson, C. B., S. W. Hayes, T. A. Morgan, E. A. Simmons, M. G.
Scudder, C. P. McIver, and M. T. Thompson. 2016. The Four Corners
timber harvest and forest products industry, 2012. Resource Bulletin
RMRS-RB-21. USDA Forest Service, Rocky Mountain Research
Station, Fort Collins, Colorado. 62 pp.
Spath, P. L. and M. K. Mann. 2000. Life cycle assessment of a natural
gas combined-cycle power generation system. National Renewable
Energy Laboratory, Golden, Colorado. 56 pp.
Spath, P. L., M. K. Mann, and D. R. Kerr. 1999. Life cycle assessment of
coal-fired power production. National Renewable Energy Laboratory,
Golden, Colorado. 172 pp.
Spelter, H., D. McKeever, and D. Toth. 2009. Profile 2009: Softwood
sawmills in the United States and Canada. Research Paper FPL-RP-
659. USDA Forest Service, Forest Products Laboratory, Madison,
Wisconsin. 55 pp.
Tilman, D., R. Socolow, J. A. Foley, J. Hill, E. Larson, L. Lynd, S.
Pacala, J. Reilly, T. Searchinger, C. Somerville, and R. Williams.
2009. Beneficial biofuels—The food, energy, and environment
trilemma. Science 325:270–271.
US Department of Agriculture (USDA). 2013. USDA Forest Service,
Forest Inventory Data Online. http://apps.fs.fed.us/fia/fido/index.html.
Accessed August 10, 2015.
U.S. Department of Agriculture (USDA). 2015. RPA-TPO Database.
http://srsfia2.fs.fed.us/php/tpo_2009/tpo_rpa_int1.php. Accessed Au-
gust 19, 2015.
US Department of Energy (DOE). 2011. US billion-ton update: Biomass
336 LOEFFLER ET AL.

supply for a bioenergy and bioproducts industry. ORNL/TM-2011/224. R. D. Perlack and B. J. Stokes (Leads). Oak Ridge NationalLaboratory, Oak Ridge, Tennessee. 227 pp.
US Energy Information Administration (EIA). 2010. Manufacturingenergy consumption survey. http://www.eia.gov/consumption/manufacturing/data/2010. Accessed August 20, 2015.
US Energy Information Administration (EIA) 2011. Annual energyreview. http://www.eia.gov/totalenergy/data/annual/index.cfm. Ac-cessed July 14, 2015.
US Energy Information Administration (EIA) 2012. Renewable andalternative fuels. http://www.eia.gov/renewable/data.cfm#biomass.Accessed July 14, 2015.
US Energy Information Administration (EIA) 2013. Manufacturingenergy consumption survey. http://www.eia.gov/consumption/manufacturing/data/2010. Accessed July 14, 2015.
US Energy Information Administration (EIA). 2015a. State energy datasystem. http://www.eia.gov/state/seds. Accessed July 13, 2015.
US Energy Information Administration (EIA). 2015b. State electricityprofiles. http://www.eia.gov/electricity/state. Accessed July 13, 2015.
US Energy Information Administration (EIA). 2015c. Energy explained.http://www.eia.gov/energyexplained/index.cfm?page¼about_energy_units. Accessed August 14, 2015.
US Environmental Protection Agency (EPA). 1995. Compilation of airpollutants emission factors. Vol. 1. Stationary point and area sources.EPA, Research Triangle Park, North Carolina.
US Environmental Protection Agency (EPA). 2007. Energy trends inselected manufacturing sectors: Opportunities and challenges forenvironmentally preferable energy outcomes. ICF International, Fair-fax, Virginia. 204 pp.
Van Hooser, D. D. and D. C. Chojnacky. 1983. Whole tree volume
estimates for the Rocky Mountain States. Resource Bulletin INT-29.
USDA Forest Service, Intermountain Forest and Range Experiment
Station, Ogden, Utah. 69 pp.
Wengert, G. and D. Meyer. 1992. Energy at the sawmill: Conservation
and cost reduction. Forest Facts. 8 pp.
Wilson, A. K. and J. S. Spencer, Jr. 1967. Timber resources and
industries in the Rocky Mountain States. Resource Bulletin INT-7.
USDA Forest Service, Intermountain Forest and Range Experiment
Station, Ogden, Utah. 67 pp.
Wilson, P. L., J. W. Funck, and R. B. Avery. 1987. Fuelwood
characteristics of northwestern conifers and hardwoods. Resource
Bulletin 60. Forest Research Laboratory, Oregon State University,
Corvallis. 47 pp.
Wilson, P. L., J. W. Funck, and R. B. Avery. 2010. Fuelwood
characteristics of northwestern conifers and hardwoods. Updated by
D. J. Parrent, J. W. Funck, J. Reeb, and A. M. Brackley (Eds.). General
Technical Report PNW-GTR-810. USDA Forest Service, Pacific
Northwest Research Station, Portland, Oregon. 50 pp.
Woodall, C. W., P. J. Ince, K. E. Skog, F. X. Aguilar, C. E. Keegan, C. B.
Sorenson, D. G. Hodges, and W. B. Smith. 2012. An overview of the
forest products sector downturn in the United States. Forest Prod. J.
61:595–603.
Yokelson, R. J., D. W. T. Griffith, and D. E. Ward. 1996. Open path
Fourier transform infrared studies of large scale laboratory biomass
fires. J. Geophys. Res. 101:21067–21080.
Zhou, X. 2013. Production, prices, employment, and trade in Northwest
forest industries, all quarters 2012. Resource Bulletin PNW-RB-265.
USDA Forest Service, Pacific Northwest Research Station, Portland,
Oregon. 163 pp.
FOREST PRODUCTS JOURNAL Vol. 66, No. 5/6 337