on patient flow in hospitals: a data-based queueing...
TRANSCRIPT

Stochastic Systems
ON PATIENT FLOW IN HOSPITALS: A DATA-BASEDQUEUEING-SCIENCE PERSPECTIVE
By Mor Armony∗, Shlomo Israelit†, Avishai Mandelbaum‡,Yariv N. Marmor§, Yulia Tseytlin¶, and Galit B. Yom-Tov‖
NYU∗, Rambam Hospital†, Technion‡,ORT Braude College & Mayo Clinic§, IBM Research¶, Technion‖
Hospitals are complex systems with essential societal benefits andhuge mounting costs. These costs are exacerbated by inefficiencies inhospital processes, which are often manifested by congestion and longdelays in patient care. Thus, a queueing-network view of patient flowin hospitals is natural, for studying and improving its performance.The goal of our research is to explore patient flow data through thelenses of a queueing scientist. The means is exploratory data analysis(EDA) in a large Israeli hospital, which reveals important featuresthat are not readily explainable by existing models.
Questions raised by our EDA include: Can a simple (parsimonious)queueing model usefully capture the complex operational reality ofthe Emergency Department (ED)? What time scales and operationalregimes are relevant for modeling patient length of stay in the Inter-nal Wards (IWs)? How do protocols of patient transfer between theED and the IWs influence patient delay, workload division and fair-ness? EDA also underscores the importance of an integrative view ofhospital units by, for example, relating ED bottlenecks to IW physi-cian protocols. The significance of such questions and our relatedfindings raises the need for novel queueing models and theory, whichwe present here as research opportunities.
Hospital data, and specifically patient flow data at the level of theindividual patient, is increasingly collected but is typically confiden-tial and/or proprietary. We have been fortunate to partner with ahospital that allowed us to open up its data for everyone to access.This enables reproducibility of our findings, through a user-friendlyplatform that is accessible through the Technion SEELab.
CONTENTS
1 Introduction . . . . . . . . . . . . . . . . . . . . . . . . . . . . . . . 31.1 Patient Flow Focus . . . . . . . . . . . . . . . . . . . . . . . . 41.2 Rambam hospital . . . . . . . . . . . . . . . . . . . . . . . . . 4
1.2.1 The ED+IW network . . . . . . . . . . . . . . . . . . 6
Keywords and phrases: Queueing Models, Queueing Networks, Healthcare, Patientflow, EDA, Emergency Departments, Hospital wards, Event logs
1imsart-ssy ver. 2013/03/06 file: Short_Patient*flow*main.tex date: June 2, 2014

2 ARMONY ET AL.
1.2.2 Data Description . . . . . . . . . . . . . . . . . . . . . 71.3 Apologies to the Statistician . . . . . . . . . . . . . . . . . . . 71.4 Paper structure . . . . . . . . . . . . . . . . . . . . . . . . . . 8
2 Some hints to the literature . . . . . . . . . . . . . . . . . . . . . . 82.1 A proof of concept . . . . . . . . . . . . . . . . . . . . . . . . 9
3 Emergency Department . . . . . . . . . . . . . . . . . . . . . . . . 103.1 Basic facts . . . . . . . . . . . . . . . . . . . . . . . . . . . . . 103.2 Exploratory Data Analysis . . . . . . . . . . . . . . . . . . . . 11
3.2.1 Time dependency . . . . . . . . . . . . . . . . . . . . . 113.2.2 Fitting a simple model to a complex reality . . . . . . 123.2.3 State dependency . . . . . . . . . . . . . . . . . . . . . 13
3.3 Research Opportunities . . . . . . . . . . . . . . . . . . . 153.3.1 Model granularity . . . . . . . . . . . . . . . . . . . . 163.3.2 Performance metrics . . . . . . . . . . . . . . . . . . . 163.3.3 Applications . . . . . . . . . . . . . . . . . . . . . . . 17
4 Internal Wards . . . . . . . . . . . . . . . . . . . . . . . . . . . . . 184.1 Basic facts . . . . . . . . . . . . . . . . . . . . . . . . . . . . . 184.2 EDA: LOS—a story of multiple time scales . . . . . . . . . . 19
4.2.1 Research Opportunities . . . . . . . . . . . . . . . 214.3 EDA: Operational regimes and economies of scale . . . . . . . 22
4.3.1 In what regime do IWs operate? Can QED- and ED-regimes co-exist? . . . . . . . . . . . . . . . . . . . . . 23
4.3.2 Research Opportunities . . . . . . . . . . . . . . . 244.3.3 Diseconomies of scale (or how ward size affects LOS) . 244.3.4 Research opportunities . . . . . . . . . . . . . . . . 26
5 The ED+IW Network . . . . . . . . . . . . . . . . . . . . . . . . . 265.1 ED-to-IW Transfer Process: Basic facts . . . . . . . . . . . . 265.2 Delays in transfer . . . . . . . . . . . . . . . . . . . . . . . . . 27
5.2.1 Research Opportunities . . . . . . . . . . . . . . . 285.3 Influence of transfer delays on the ED . . . . . . . . . . . . . 29
5.3.1 Research Opportunities . . . . . . . . . . . . . . . 305.4 Causes of delay . . . . . . . . . . . . . . . . . . . . . . . . . . 315.5 Fairness in the ED-to-IW process . . . . . . . . . . . . . . . . 33
5.5.1 Fairness towards patients . . . . . . . . . . . . . . . . 335.5.2 Research Opportunities . . . . . . . . . . . . . . . 345.5.3 Fairness towards staff . . . . . . . . . . . . . . . . . . 345.5.4 Research Opportunities . . . . . . . . . . . . . . . 35
5.6 A system view . . . . . . . . . . . . . . . . . . . . . . . . . . 365.6.1 Research opportunities . . . . . . . . . . . . . . . . 38
6 Discussion and concluding remarks . . . . . . . . . . . . . . . . . . 38
imsart-ssy ver. 2013/03/06 file: Short_Patient*flow*main.tex date: June 2, 2014

PATIENT FLOW IN HOSPITALS 3
6.1 Operational measures as surrogates to overall hospital perfor-mance, or queueing models reach beyond the operational . . . 396.1.1 Readmissions . . . . . . . . . . . . . . . . . . . . . . . 396.1.2 Capacity and Cost of Care . . . . . . . . . . . . . . . 40
6.2 Some concluding comments on data-based research—a greatopportunity but no less of a challenge . . . . . . . . . . . . . 40
References . . . . . . . . . . . . . . . . . . . . . . . . . . . . . . . . . . 41Acknowledgements . . . . . . . . . . . . . . . . . . . . . . . . . . . . . 47Appendix 1: A framework for OR/AP data-based research . . . . . . . 49Appendix 2: Accessing data repositories and EDA tools at the SEELab 49Author’s addresses . . . . . . . . . . . . . . . . . . . . . . . . . . . . . 51
1. Introduction. Health care systems in general, and hospitals in par-ticular, are major determinants of our quality of life. They also require asignificant fraction of our resources and, at the same time, they suffer from(quoting a physician research partner) “a ridiculous number of inefficiencies;thus everybody—patients, families, nurses, doctors and administrators arefrustrated.” In (too) many instances, this frustration is caused and exacer-bated by delays—“waiting for something to happen”; in turn, these delaysand the corresponding queues signal inefficiencies. Hospitals hence presenta propitious ground for research in Queueing Theory and, more generally,Applied Probability (AP) and Operations Research (OR). Such researchwould ideally culminate in reduced congestion (crowding) and its accom-panying important benefits: clinical, financial, psychological and societal.And for such benefits to accrue, it is critical that the supporting research isdata-based.
Unfortunately, however, operational hospital data is accessible to veryfew researchers, and patient-level data has in fact been publicly unavailable.The reasons span data nonexistence or poor quality, through concerns forpatient confidentiality, to proprietorial constraints or attitudes of the dataowners. We are thus humbly attempting, in this present work, to changethis landscape of data-based hospital OR and, in doing so, introduce a newstandard. Specifically, we identify and propose research opportunities andchallenges that arise from exploratory analysis of ample hospital data. Justas significantly, we also open up our data and make it universally accessi-ble at the Technion IE&M Laboratory for Service Enterprise Engineering(SEELab): the data can be either downloaded or analyzed online, through auser friendly platform (SEEStat) for Exploratory Data Analysis (EDA). Ourgoal is thus to provide an entry to and accelerate the learning of data-basedOR of hospitals; Interested researchers can reproduce our EDA, and use it
imsart-ssy ver. 2013/03/06 file: Short_Patient*flow*main.tex date: June 2, 2014

4 ARMONY ET AL.
as a trigger and a starting point for further data mining and novel researchof their own.
1.1. Patient Flow Focus. Of particular interest to both researchers andpractitioners is patient flow in hospitals: improving it can have a significantimpact on quality of care as well as on patient satisfaction; and restrictingattention to it adds a necessary focus to our work. Indeed, the medicalcommunity has acknowledged the importance of patient flow management(e.g. Standard LD.3.10.10, which the Joint Commission on Accreditation ofHospital Organizations (JCAHO, 2004) set for patient flow leadership). Thisacknowledgment is natural given that operational measures of patient floware relatively easy to track, and that they inherently serve as proxies forother quality of care measures (see Section 6.1). In parallel, patient flow hascaught the attention of researchers in OR in general, and Queueing Theory inparticular. This is not surprising: hospital systems, being congestion-prone,naturally fit the framework of Queueing Theory, which captures the tradeoffsbetween (operational) service quality vs. resource efficiency.
Our starting point is that a queueing network encapsulates the operationaldimensions of patient flow in hospitals, with the medical units being thenodes of the network, patients are the customers, while beds, medical staffand medical equipment are the servers. But what are the special featuresof this queueing network? To address this question, we study an extensivedata set of patient flow through the lenses of a queueing scientist. Our studyhighlights interesting phenomena that arise in the data, which leads to adiscussion of their implications on system operations and queueing modeling,and culminates in the proposal of related research opportunities.
However, patient flow, as highlighted by our title (“On Patient Flow . . .”),is still too broad a subject for a single study. We thus focus on the inter-wardresolution, as presented in the flow chart (process map) of Figure 1; this isin contrast to intra-ward or out-of-hospital patient flow. We further narrowthe scope to the relatively isolated ED+IW network, as depicted in Figure2 and elaborated on in §1.2.1.
1.2. Rambam hospital. Our data originates at the Rambam Medical Cen-ter, which is a large Israeli academic hospital. This hospital caters to a pop-ulation of more than two million people, and it serves as a tertiary referralcenter for twelve district hospitals. The hospital consists of about 1000 bedsand 45 medical units, with about 75,000 patients hospitalized annually. Thedata includes detailed information on patient flow throughout the hospital,over a period of several years (2004–2008), at the flow level of Figure 1,and the resolution level of individual patients. Thus, the data allows one to
imsart-ssy ver. 2013/03/06 file: Short_Patient*flow*main.tex date: June 2, 2014

PATIENT FLOW IN HOSPITALS 5
One
day
at th
e Ho
spita
l 32
6.0
31.7
28.4
11.8
29.1
18.3
18.3
19.3
37.44.
3
5.4
12.2
23.511
.84.
9 3.5
8.2
196.
7
7.1
3.7
1.3
1.2
2.5
1.4
2.7
9.7
2.0
5.0 6.
8
0.8
0.6
1.4
0.9
1.1 1.
9
2.0
0.9
2.9
0.8
1.3
2.3
4.3
0.3 4.
9
0.5
0.6
1.7
2.2
1.3
1.8
3.2
1.1
1.6
0.6 0.
2
0.3
0.6
0.2
0.3
0.1
0.1
0.6
0.2
0.4
Dece
ased
Disa
ppea
red
Disc
harg
edTr
ansf
erre
d
Ram
bam
Au
gust
200
4, A
vera
ge D
ay
Fig 1: Patient Flow (Process Map) at inter-ward resolution. (Data animationis available at SEEnimations). For example, during the period over whichthe flow was calculated (August 2004), 326 patients arrived to the ED perday on average, and 18.3 transferred from the ED to Surgery. (To avoidclutter, arcs with monthly flow below 4 patients were filtered out; Createdby SEEGraph, at the Technion SEELab.)
imsart-ssy ver. 2013/03/06 file: Short_Patient*flow*main.tex date: June 2, 2014
6 ARMONY ET AL.
follow the paths of individual patients throughout their stay at the hospital,including admission, discharge, and transfers between hospital units.
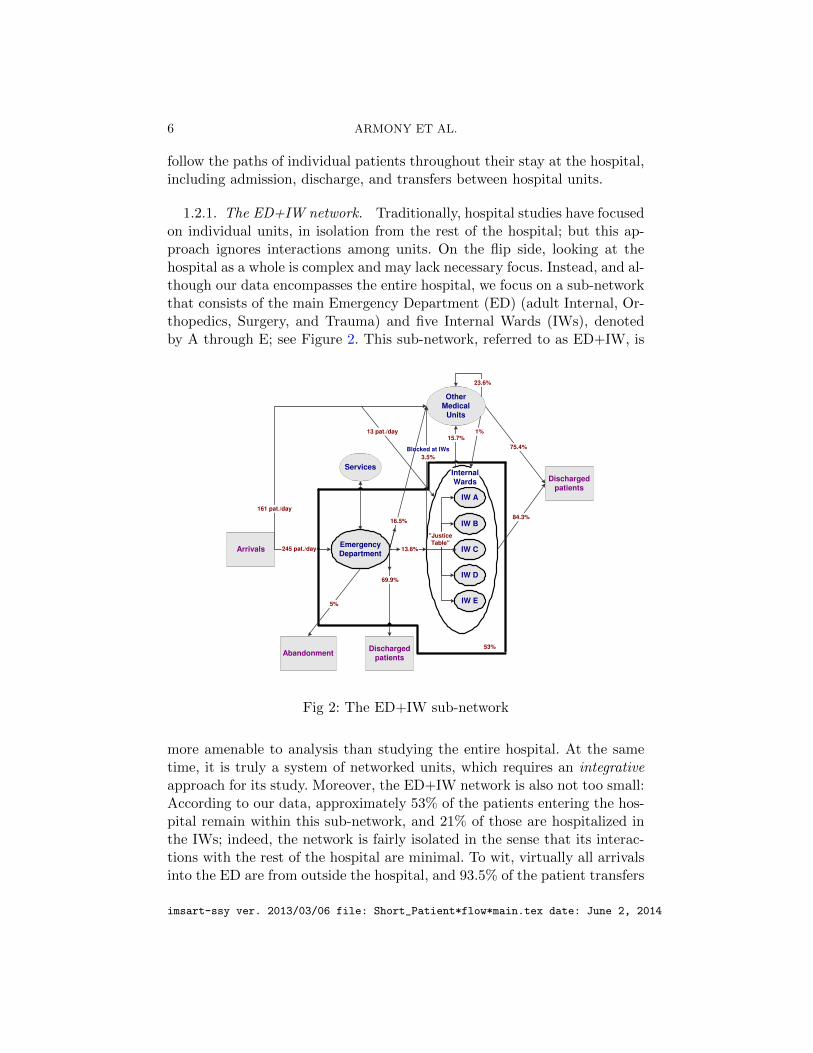
1.2.1. The ED+IW network. Traditionally, hospital studies have focusedon individual units, in isolation from the rest of the hospital; but this ap-proach ignores interactions among units. On the flip side, looking at thehospital as a whole is complex and may lack necessary focus. Instead, and al-though our data encompasses the entire hospital, we focus on a sub-networkthat consists of the main Emergency Department (ED) (adult Internal, Or-thopedics, Surgery, and Trauma) and five Internal Wards (IWs), denotedby A through E; see Figure 2. This sub-network, referred to as ED+IW, is
ArrivalsEmergencyDepartment
Abandonment
Services
IW A
IW C
IW B
IW D
IW E
Dischargedpatients
Dischargedpatients
InternalWards
OtherMedical
Units
53%
13.6%
"JusticeTable"
Blocked at IWs
3.5%
69.9%
5%
15.7%
23.6%
84.3%
75.4%
245 pat./day
161 pat./day
1%
16.5%
13 pat./day
Fig 2: The ED+IW sub-network
more amenable to analysis than studying the entire hospital. At the sametime, it is truly a system of networked units, which requires an integrativeapproach for its study. Moreover, the ED+IW network is also not too small:According to our data, approximately 53% of the patients entering the hos-pital remain within this sub-network, and 21% of those are hospitalized inthe IWs; indeed, the network is fairly isolated in the sense that its interac-tions with the rest of the hospital are minimal. To wit, virtually all arrivalsinto the ED are from outside the hospital, and 93.5% of the patient transfers
imsart-ssy ver. 2013/03/06 file: Short_Patient*flow*main.tex date: June 2, 2014

PATIENT FLOW IN HOSPITALS 7
into the IWs are either from outside the hospital or from within the ED+IWnetwork.
1.2.2. Data Description. Rambam’s 2004–2008 patient-level flow dataconsists of 4 compatible “tables”, that capture hospital operations as fol-lows. The first table (Visits) contains records of ED patients, including theirID, arrival and departure times, arrival mode (e.g. independently or by am-bulance), cause of arrival, and some demographic data. The second table(Justice Table) contains details of the patients that were transferred fromthe ED to the IWs. This includes information on the time of assignmentfrom the ED to an IW, the identity of this IW, as well as assignment can-celations and reassignment times when relevant. The third table (HospitalTransfers) consists of patient-level records of arrivals to and departures fromhospital wards. It also contains data on the ward responsible for each patientas, sometimes, due to lack of capacity, patients are not treated in the wardthat is clinically most suitable for them; hence, there could be a distinctionbetween the physical location of a patient and the ward that is clinicallyin charge of that patient. The last table (Treatment) contains individualrecords of first treatment time in the IWs. Altogether, our data consists ofover one million records.
1.3. Apologies to the Statistician. Our approach of learning from datais in the spirit of Tukey’s Exploratory Data Analysis (EDA) (Tukey, 1977),which gives rise to the following two “apologies”. Firstly, the goals of thepresent study, its target audience and space considerations render secondarythe role of “rigorous” statistical analysis (e.g. hypothesis testing, confidenceintervals, model selection).
Secondly, our data originates from a single Israeli hospital, operating dur-ing 2004–2008. This raises doubts regarding the generality of the scientificand practical relevance of the present findings, and rightly so. Nevertheless,other studies of hospitals in Israel (Marmor (2003); Tseytlin (2009) andSection 5.6 of EV) and in Singapore (Shi et al., 2012), together with otherprivately-communicated empirical research by colleagues, reveal phenomenathat are common across hospitals worldwide (e.g. the LOS distributions inFigure 9). Moreover, the present research has already provided the empiricalfoundation for several graduate theses, each culminating in one or severaldata-based theoretical papers (see §2.1). All in all, our hope is that read-ing the manuscript will dispel doubts concerning its broad relevance andsignificance.
imsart-ssy ver. 2013/03/06 file: Short_Patient*flow*main.tex date: June 2, 2014
8 ARMONY ET AL.
1.4. Paper structure. The rest of the paper is organized as follows: Westart with a short literature review in Section 2. We then proceed to dis-cuss the gate to the hospital—the ED—in Section 3, followed by the IWs(§4), and the ED+IW network as a whole (§5). We start each section withbackground information. Next, we highlight relevant EDA, and lastly wepropose corresponding research opportunities. In §6, we offer final commen-tary, where we also provide a broader discussion of some common themesthat arise throughout the paper. Finally, the Appendix covers data accessinstructions and documentation, as well as EDA logistics. We encourageinterested readers to refer to EV: a working paper that provides a moreelaborate discussion of various issues raised here, and that covers additionaltopics that are not included here due to focus and space considerations.
2. Some hints to the literature. Patient flow in hospitals has beenstudied extensively. Readers are referred to the papers in Hall (2013) andDenton (2013)—both also providing leads to many further references. Inthe present subsection, we merely touch on published work, along the threedimensions that are most relevant to our study: a network view, queueingmodels and data-based analysis. Many additional references to recent andongoing research, on particular issues that arise throughout the paper, willbe further cited as we go along. This subsection concludes with what can beviewed as “proof of concept”: a description of some existing research thatthe present work and our empirical foundation have already triggered andsupported.
Most research on patient flow has concentrated on the ED and how toimprove ED flows in within. There are a few exceptions that offer a broaderview. For example, Cooper et al. (2001) identifies a main source of ED con-gestion to be controlled variability, downstream from the ED (e.g. operating-room schedules). In the same spirit, de Bruin et al. (2007) observes that“refused admissions at the First Cardiac Aid are primarily caused by un-availability of beds downstream the care chain.” These blocked admissionscan be controlled via proper bed allocation along the care chain of Cardiacin-patients; and to support such allocations, a queueing network model wasproposed, with parameters that were estimated from hospital data. Broad-ening the view further, Hall et al. (2006) develops data-based descriptions ofhospital flows, starting at the highest unit-level (yearly view) down to spe-cific sub-wards (e.g. imaging). The resulting flow charts are supplementedwith descriptions of various factors that cause delays in hospitals, and thensome means that hospitals employ to alleviate these delays. Finally, Shi et al.(2012) develops data-based models that lead to managerial insights on the
imsart-ssy ver. 2013/03/06 file: Short_Patient*flow*main.tex date: June 2, 2014

PATIENT FLOW IN HOSPITALS 9
ED-to-Ward transfer process.There has been a growing body of research that treats operational prob-
lems in hospitals with Operations Research (OR) techniques. Brandeau,Sainfort and Pierskalla (2004) is a handbook of OR methods and appli-cations in health care; the part that is most relevant to this paper is itschapter on Health Care Operations Management (OM). Next, Green (2008)surveys the potential of OR in helping reduce hospital delays, with an em-phasis on queueing models. A recent handbook on System Scheduling is Hall(2012)—it includes chapters worth reading and additional leads on OR/OMand queueing perspectives of patient flow. Of special interest is Chapter 8,where Hall describes the challenging reality of bed management in hospitals.Jennings and de Vericourt (2008, 2011) and Green and Yankovic (2011) ap-ply queueing models to determine the number of nurses needed in a medicalward. Green (2004) and de Bruin et al. (2009) rely on queueing modelssuch as Erlang-C and loss systems, to recommend bed allocation strategiesfor hospital wards. Lastly, Green, Kolesar and Whitt (2007) survey and de-velop (time-varying) queueing networks that help determine the number ofphysicians and nurses required in an ED.
There is also an increased awareness of the significant role that data can,and often must, play in patient flow research. For example, Kc and Terwiesch(2009) is an empirical work in the context of ICU patient flow; it has inspiredthe analytical model of Chan, Yom-Tov and Escobar (2014) (see also Chan,Farias and Escobar (2014) on the correlation between patient wait and ICULOS). Another example is Baron et al. (2014) that does both modeling anddata analysis for patient flow in outpatient test provision centers. More onpatient flow in outpatient clinics and the need for relevant data is discussedin Froehle and Magazine (2013).
2.1. A proof of concept. The present research has provided the empiricalfoundation for several graduate theses and subsequent research papers: Mar-mor (2010) studied ED architectures and staffing (see Zeltyn et al. (2011)and Marmor et al. (2012)); Yom-Tov (2010) focused on time-varying modelswith customer returns to the ED (Yom-Tov and Mandelbaum, 2014) andthe IWs; Tseytlin (2009) investigated the transfer process from the ED tothe IWs (Mandelbaum, Momcilovic and Tseytlin, 2012); Maman (2009) ex-plored over-dispersion characteristics of the arrival process into the ED (Ma-man, Zeltyn and Mandelbaum, 2011); and Huang (2013) developed schedul-ing controls that help ED physicians choose between newly-arriving vs. in-process patients, while still adhering to triage constraints (Huang, Carmeliand Mandelbaum, 2011).
imsart-ssy ver. 2013/03/06 file: Short_Patient*flow*main.tex date: June 2, 2014
10 ARMONY ET AL.
3. Emergency Department. Patient flow in the Emergency Depart-ment (ED) is a complex process that involves a multitude of interrelatedsteps (e.g. Figure 1 in Zeltyn et al. (2011)). This process has been widelyinvestigated, both academically (Hall et al., 2006; Saghafian, Austin andTraub, 2014) and in practice (IHI, 2011; McHugh et al., 2011). We shallhence be content with its empirical macro view, which already turns outto be highly informative. Specifically, we view the ED as a black-box, andthen highlight interesting phenomena that relate to its patient arrivals, de-partures, and occupancy counts. Our EDA underscores the importance ofincluding time- and state-dependent effects in the ED—some of these arenot readily explained by existing queueing models. Yet, and albeit this de-pendence, it also reveals that a simple stationary model may provide a goodfit for patient-count during periods when the ED is most congested. Forlimited purposes, therefore, our EDA supports the use of simple stationarymodels for the ED, which has been prevalent in the literature (e.g. Greenet al. (2006) and de Bruin et al. (2009)).
3.1. Basic facts. The main ED has 40 beds and it treats on average 245patients daily: close to 60% are classified as Internal (general) patients andthe rest are Surgical/Orthopedic, excluding a few per day that suffer frommultiple trauma. The ED has three major areas: Trauma acute, Internalacute, and Surgical/Orthopedic acute; some of the patients in the latter twoare “Walking” patients that do not require a bed. While there are formally40 beds in the ED, this bed capacity is highly flexible and can be doubled andmore. Hence there is effectively no upper bound on how many patients cansimultaneously reside within the ED—either in beds or stretchers, chairs,etc. The hospital has other EDs, physically detached from the main onediscussed here—these are dedicated to other patient types such as Pediatricsor Ophthalmology. Throughout the rest of our paper, we focus on the mainED and simply refer to it as the ED. Furthermore, within the ED, we focus onInternal (general) patients, in beds or walking: they constitute the majorityof ED patients and give rise to most operational challenges.
During weekdays, the average length of stay (ALOS) of patients in theED is 4.25 hours: this covers the duration from entry until the decisionto discharge or hospitalize; it does not include boarding time, which is theduration between hospitalization decision to actual transfer. We estimateboarding time to be 3.2 hours on average (See Section 5.2). In addition,10% (5%) of weekday patients experience LOS that is over 8 (11) hours,and about 3–5% leave on their own (LWBS = left without being seen by adoctor, LAMA = left against medical advice, or Absconded = disappeared
imsart-ssy ver. 2013/03/06 file: Short_Patient*flow*main.tex date: June 2, 2014
PATIENT FLOW IN HOSPITALS 11
throughout the process and are neither LWBS nor LAMA). Finally, out ofthe 2004–2005 ED patients, around 37% were eventually readmitted; and,overall, 3%, 11%, and 16% of the patients returned within 2, 14, and 30days, respectively.
3.2. Exploratory Data Analysis. In this section we highlight some of ourEDA findings that relate to ED patient arrivals and patient-count distribu-tion.
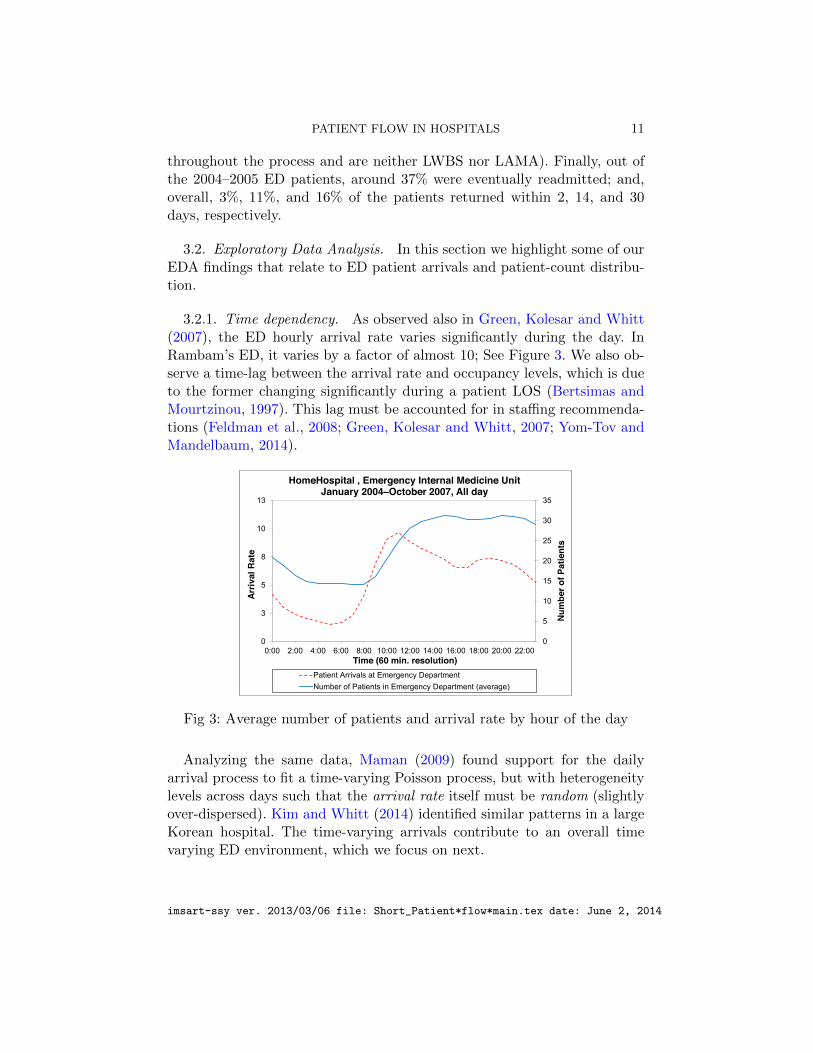
3.2.1. Time dependency. As observed also in Green, Kolesar and Whitt(2007), the ED hourly arrival rate varies significantly during the day. InRambam’s ED, it varies by a factor of almost 10; See Figure 3. We also ob-serve a time-lag between the arrival rate and occupancy levels, which is dueto the former changing significantly during a patient LOS (Bertsimas andMourtzinou, 1997). This lag must be accounted for in staffing recommenda-tions (Feldman et al., 2008; Green, Kolesar and Whitt, 2007; Yom-Tov andMandelbaum, 2014).
0
5
10
15
20
25
30
35
0
3
5
8
10
13
0:00 2:00 4:00 6:00 8:00 10:00 12:00 14:00 16:00 18:00 20:00 22:00
Num
ber o
f Pat
ient
s
Arriv
al R
ate
Time (60 min. resolution)
HomeHospital , Emergency Internal Medicine UnitJanuary 2004–October 2007, All day
Patient Arrivals at Emergency DepartmentNumber of Patients in Emergency Department (average)
Fig 3: Average number of patients and arrival rate by hour of the day
Analyzing the same data, Maman (2009) found support for the dailyarrival process to fit a time-varying Poisson process, but with heterogeneitylevels across days such that the arrival rate itself must be random (slightlyover-dispersed). Kim and Whitt (2014) identified similar patterns in a largeKorean hospital. The time-varying arrivals contribute to an overall timevarying ED environment, which we focus on next.
imsart-ssy ver. 2013/03/06 file: Short_Patient*flow*main.tex date: June 2, 2014

12 ARMONY ET AL.
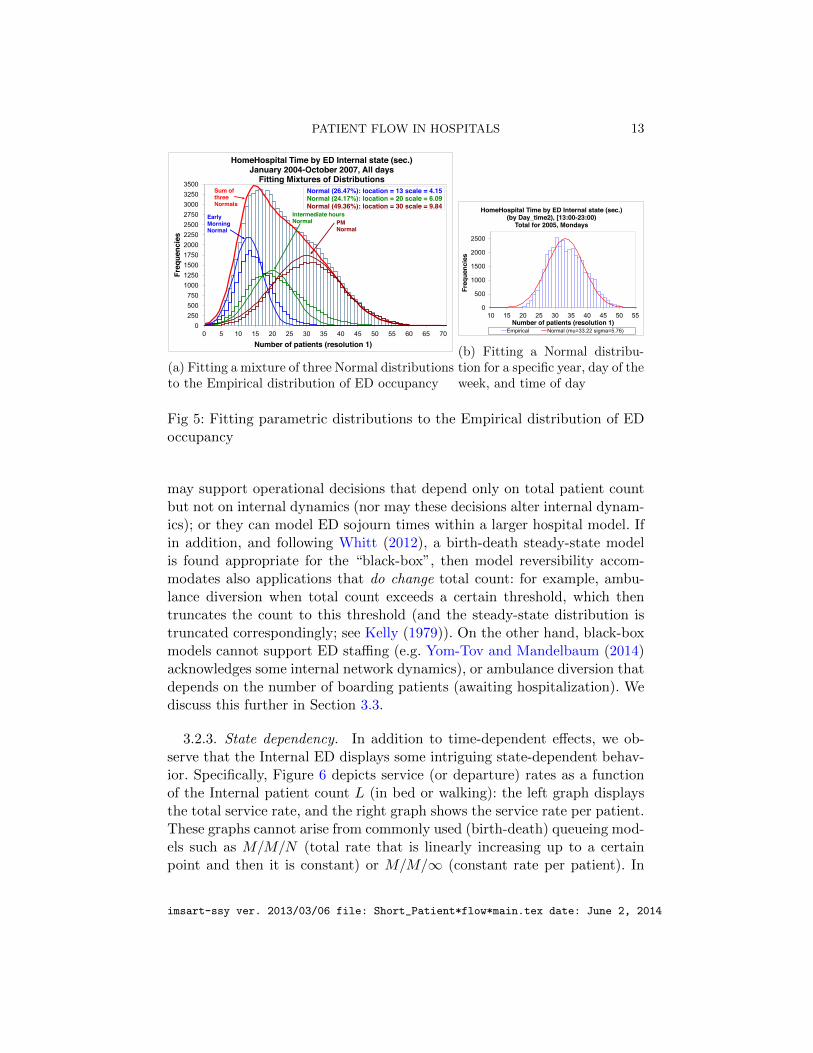
3.2.2. Fitting a simple model to a complex reality. Figure 4 (left) shows24 patient-count histograms for internal ED patients, each corresponding toa specific hour of the day, with reference (right) to mean patient count, alsoby hour of the day. (Similar shapes arise from total ED patient count—seeFigure 10 in EV.) The figure displays a clear time-of-day behavior: Thereare two distinct bell-shaped distributions that correspond to low occupancy(15 patients on average) during the AM (3–9AM), and high (30 patients)during the PM (12–11PM); with two transitionary periods of low-to-high(9AM–12PM) and high-to-low (11PM–3AM). We refer to these four periodsas the four “occupancy regimes”. Interestingly, when asking SEEStat to fit a
0 20 40 60 80
100 120 140 160 180 200 220 240 260 280 300 320 340
0 5 10 15 20 25 30 35 40 45 50 55 60 65 70
Freq
uenc
ies
Number of patients (resolution 1)
HomeHospital Time by ED Internal state (sec.) January 2004-October 2007, All days
[00:00 - 01:00) [01:00 - 02:00) [02:00 - 03:00) [03:00 - 04:00) [04:00 - 05:00) [05:00 - 06:00) [06:00 - 07:00) [07:00 - 08:00) [08:00 - 09:00) [09:00 - 10:00) [10:00 - 11:00) [11:00 - 12:00) [12:00 - 13:00) [13:00 - 14:00) [14:00 - 15:00) [15:00 - 16:00) [16:00 - 17:00) [17:00 - 18:00) [18:00 - 19:00) [19:00 - 20:00) [20:00 - 21:00) [21:00 - 22:00) [22:00 - 23:00) [23:00 - 24:00)
10
15
20
25
30
35
0 2 4 6 8 10 12 14 16 18 20 22
Aver
age
num
ber o
f cas
es
Time (60 min. resolution)
HomeHospital Number of Patients in Emergency Department (average), Emergency Internal Medicine Unit
January 2004-October 2007, All days
Fig 4: Internal ED Occupancy histogram (left) and Average Census (right),by hour of the day
mixture of three normal distributions to the ED occupancy distribution, thefit algorithm automatically detects the low, high and transitionary phases(See Figure 5a).
Further EDA (Figure 5b) reveals that, during peak times (PM), when con-trolling for factors such as day-of-the-week, patient type and calendar year,one obtains a good fit for the empirical distribution by a “steady-state” nor-mal distribution with equal mean and variance. Hence, one might speculatethat the underlying system dynamics can be modeled by an M/M/∞ queue,which has a Poisson steady-state (mean=variance). Alternatively, however,it may also be described as an M/M/N + M model with equal rates ofservice and abandonment (LWBS, LAMA, or Absconded). It follows thatone cannot conclusively select a model through its empirical steady-statedistribution—which is a trap that is easy to fall into and from which Whitt(2012) rescued us.
One is thus led to the relevance-boundary of “black-box” ED models: they
imsart-ssy ver. 2013/03/06 file: Short_Patient*flow*main.tex date: June 2, 2014
PATIENT FLOW IN HOSPITALS 13
0 250 500 750
1000 1250 1500 1750 2000 2250 2500 2750 3000 3250 3500
0 5 10 15 20 25 30 35 40 45 50 55 60 65 70
Freq
uenc
ies
Number of patients (resolution 1)
HomeHospital Time by ED Internal state (sec.) January 2004-October 2007, All days
Fitting Mixtures of Distributions Normal (26.47%): location = 13 scale = 4.15 Normal (24.17%): location = 20 scale = 6.09 Normal (49.36%): location = 30 scale = 9.84
Early Morning Normal
Intermediate hours Normal PM
Normal
Sum of three Normals
(a) Fitting a mixture of three Normal distributionsto the Empirical distribution of ED occupancy
0
500
1000
1500
2000
2500
10 15 20 25 30 35 40 45 50 55
Freq
uenc
ies
Number of patients (resolution 1)
HomeHospital Time by ED Internal state (sec.)(by Day_time2), [13:00-23:00)
Total for 2005, Mondays
Empirical Normal (mu=33.22 sigma=5.76)
(b) Fitting a Normal distribu-tion for a specific year, day of theweek, and time of day
Fig 5: Fitting parametric distributions to the Empirical distribution of EDoccupancy
may support operational decisions that depend only on total patient countbut not on internal dynamics (nor may these decisions alter internal dynam-ics); or they can model ED sojourn times within a larger hospital model. Ifin addition, and following Whitt (2012), a birth-death steady-state modelis found appropriate for the “black-box”, then model reversibility accom-modates also applications that do change total count: for example, ambu-lance diversion when total count exceeds a certain threshold, which thentruncates the count to this threshold (and the steady-state distribution istruncated correspondingly; see Kelly (1979)). On the other hand, black-boxmodels cannot support ED staffing (e.g. Yom-Tov and Mandelbaum (2014)acknowledges some internal network dynamics), or ambulance diversion thatdepends on the number of boarding patients (awaiting hospitalization). Wediscuss this further in Section 3.3.
3.2.3. State dependency. In addition to time-dependent effects, we ob-serve that the Internal ED displays some intriguing state-dependent behav-ior. Specifically, Figure 6 depicts service (or departure) rates as a functionof the Internal patient count L (in bed or walking): the left graph displaysthe total service rate, and the right graph shows the service rate per patient.These graphs cannot arise from commonly used (birth-death) queueing mod-els such as M/M/N (total rate that is linearly increasing up to a certainpoint and then it is constant) or M/M/∞ (constant rate per patient). In
imsart-ssy ver. 2013/03/06 file: Short_Patient*flow*main.tex date: June 2, 2014

14 ARMONY ET AL.
contrast, the per-patient service rate has an interval (11 ≤ L ≤ 20) whereit is increasing in L, which is between two intervals of decrease. (The noiseat the extremes, L ≤ 3 and L ≥ 55, is due to small sample sizes.) Note thatBatt and Terwiesch (2012) and Kc and Terwiesch (2009) also found evidencefor a state-dependent service rate.
0.0
5.0
10.0
15.0
20.0
25.0
0 5 10 15 20 25 30 35 40 45 50 55 60 65 70
Rate
s pe
r hou
r
Number of Patients (L)
HomeHospital, Internal ED state January 2004-October 2007, All days, 24 hours of day
0.1
0.2
0.2
0.3
0.3
0.4
0 5 10 15 20 25 30 35 40 45 50 55 60 65 70 Ra
tes
per h
our /
L
Number of Patients (L)
HomeHospital, Internal ED state January 2004-October 2007, All days, 24 hours of day
Fig 6: Service rate and service rate per patient as a function of L
What can cause this particular state-dependence of the service rate perpatient? We start with the “slowdown” (L ≥ 25) which, in a congested ED,is to be expected under any of the following scenarios:
• Multiple resource types with limited capacity: As the number of occu-pied beds increases, the overall load on medical staff and equipmentincreases as well. Assuming a fixed processing capacity, the service rateper bed must then slow down.• Psychological: Medical staff could become emotionally overwhelmed,
to a point that exacerbates slowdown (Sullivan and Baghat, 1992).• Choking: Service slowdown may also be attributed to so-called resource
“choking”: medical staff becomes increasingly occupied with caring forto-be-transferred (boarding) ED patients (who create work while theywait and, moreover, their condition could actually deteriorate), thatmight end up taking capacity away from the to-be-released patients,thereby “choking” their throughput (see Figure 13 in Section 5.3).The choking phenomenon is well known in other environments such astransportation (Chen, Jia and Varaiya, 2001) and telecommunications(Gerla and Kleinrock, 1980), where it is also referred to as throughputdegradation.• Time dependency and patient heterogeneity: Finally, slowdown as well
as speedup may be attributed to the combination of time dependentarrivals and heterogenous patient mix (Marmor et al., 2013). We now
imsart-ssy ver. 2013/03/06 file: Short_Patient*flow*main.tex date: June 2, 2014

PATIENT FLOW IN HOSPITALS 15
expand on this in the context of the speedup effect.
As opposed to the slowdown, the apparent speedup (10 ≤ L ≤ 25) turnsout to be an artifact of biased sampling due to patient-heterogeneity andtime-variability (as observed in Section 3.2.1). To see this, we further in-vestigate the departure rate per patient, as a function of the patient count,at four different time-of-day intervals (corresponding roughly to the fouroccupancy regimes identified in Figure 4). For each of these, we observe,in Figure 7, either a constant service rate or a slowdown thereof, but nospeedup.
0.05
0.15
0.25
0.35
0.45
0.55
0 5 10 15 20 25 30 35 40
Rate
s pe
r hou
r / L
Number of Patients (L)
HomeHospital, Internal ED state January 2004-October 2007, All days
03:00-08:59
0.05
0.15
0.25
0.35
0.45
0.55
0 5 10 15 20 25 30 35 40 45 50
Rate
s pe
r hou
r / L
Number of Patients (L)
HomeHospital, Internal ED state January 2004-October 2007, All days
09:00-11:59
0.05
0.15
0.25
0.35
0.45
0.55
0 5 10 15 20 25 30 35 40 45 50 55 60 65 70
Rate
s pe
r hou
r / L
Number of Patients (L)
HomeHospital, Internal ED state January 2004-October 2007, All days
12:00-21:59
0.05
0.15
0.25
0.35
0.45
0.55
0 5 10 15 20 25 30 35 40 45 50 55 60 65 70
Rate
s pe
r hou
r / L
Number of Patients (L)
HomeHospital, Internal ED state January 2004-October 2007, All days
22:00-02:59
Fig 7: Service rate per patient as a function of L by occupancy regime
Now the rate-per-patient in Figure 6 is a weighted average of the fourgraphs of Figure 7. But these weights are not constant as a function of thepatient count, as seen in Figure 8. Moreover, the service rate as a functionof patient count varies at different times of the day. It follows that, whatappears to be a speedup (increasing graph), is merely a weighted average ofnon-increasing graphs with state-dependent weights.
3.3. Research Opportunities. Our EDA leaves open questions for fur-ther data-based theoretical exploration. For example: What causes the par-ticular shape of time-dependent arrival-rates – the two local peaks in Figure3 – which is common in many service systems (including hospitals acrossthe globe and call centers)? What is the dominant cause for service-rateslow-down in Figure 6, and what can be done to alleviate this slowdown?
imsart-ssy ver. 2013/03/06 file: Short_Patient*flow*main.tex date: June 2, 2014

16 ARMONY ET AL.
0.06
0.16
0.26
0.36
10 12 14 16 18 20 Serv
ice
rate
s pe
r hou
r / L
Number of Patients (L)
HomeHospital, Internal ED state January 2004-October 2007, All days
Total - 24 hours of day 12:00 to 21:59 03:00 to 08:59 09:00 to 11:59 22:00 to 02:59
0.0
0.1
0.2
0.3
0.4
0.5
0.6
0.7
10 12 14 16 18 20
Rela
tive
Freq
uenc
y
Number of Patients (L)
HomeHospital, Internal ED state January 2004-October 2007, All days
12:00-21:59 03:00-08:59 09:00-11:59 22:00-02:59
Fig 8: Service rate as a function of 10 ≤ L ≤ 20 (left), and Relative frequency(weight) of occupancy regime per L (right)
How does one separate the effects of time- and state-dependency, which oneis the more dominant and under what circumstances?
In addition, the observations in this section also raise some broader re-search directions, within several (somewhat overlapping) model dimensions:granularity, performance metrics, and applications.
3.3.1. Model granularity. Our focus in this section has been on overallED (Internal) patient count. This aggregates ED dynamics into merely ar-rivals and departures which, as described in Subsection 3.2.2, yields a usefulblack-box model but with a limited applicability scope. In contrast to thismacro level, one could consider a detailed model (most likely simulation, asin Zeltyn et al. (2011)), which acknowledges explicitly micro-events at thelevel of individual patients and providers (physicians, nurses).
The macro- and micro-models are two extreme cases of model granular-ity, with a range of levels in between. Such intermediate levels could corre-spond, for example, to the overall design of ED patient-flow (Marmor et al.,2012); or to queueing models (Huang, Carmeli and Mandelbaum, 2011; Yom-Tov and Mandelbaum, 2014) that focus on phenomena (patients re-visitingphysicians) or function (physician staffing and scheduling). The granularitylevel to be used depends on the target application, data availability and ana-lytical techniques. Choosing the “right” level for an OR/queueing model hasbeen mostly art, which calls for systematizing this choice process. It couldstart with Whitt (2012) and (Dong and Whitt, 2014) that fit birth-deathmodels, and continue with existing and possibly novel statistical techniquesfor model selection (Burnham and Anderson, 2002).
3.3.2. Performance metrics. There are numerous ED performance met-rics that have not been discussed here or have merely been touched upon. Of
imsart-ssy ver. 2013/03/06 file: Short_Patient*flow*main.tex date: June 2, 2014
PATIENT FLOW IN HOSPITALS 17
special importance is time-till-first-consultation, which is often part of triageprotocols: e.g. following the Canadian Triage and Acuity Scale (Canadadian-Triage), 90% of Category 3 (Urgent) patients should be seen by a physicianwithin 30 minutes of arrival. Another measure that has gained recent promi-nence is readmission rates: it is being used as a proxy for clinical quality ofcare, and we further discuss it in Section 6.1.1.
Additional measures include length of stay (LOS), abandonment (LWBS,LAMA, absconded), workload and offered load, bed utilization, boardingtimes, staff-to-bed ratios, and customers who are blocked upon their EDarrival (e.g. ambulance diversion). These metrics are mostly related to EDcongestion (Hwang et al. (2011) lists over 70), and they have given rise toprevalent crowding indices (e.g. Bernstein et al. (2003); Hoot et al. (2007)).While such indices support daily ED management, they arose from ad-hocstatistical analysis that seeks to summarize (e.g. via regression) the state ofED congestion. OR and queueing models, on the other hand, constitute anatural systematic habitat for congestion indices. The models can thus helpvalidate existing indices or devise new ones, for example by solving controlproblems of patient flow that yields rigorous state-summaries and sufficientstatistics (Huang, Carmeli and Mandelbaum (2011)).
Unfortunately, useful metrics are often difficult or impossible to measurefrom data. One can then attempt to infer them from the measurable. Anexample is patients’ patience (the time a patient is willing to wait beforeabandoning the ED); while the overall abandonment proportion is observ-able, exact times till abandonment are not. Specifically, patients are eitherserved, in which case their waiting time provides a lower bound for their pa-tience, or they are discovered missing when called for service, which providesan upper bound. Statistical inference of ED (im)patience therefore requiresnovel models and methods: these would combine current-status (Sun, 2006)and survival-analysis (Brown et al., 2005)—in the latter, abandonment timesare observed, while they are not in the former.
3.3.3. Applications. Applications of queueing models to ED patient flowinclude the following categories: ED design (e.g., Marmor et al. (2012)),capacity sizing, staffing (e.g., Yom-Tov and Mandelbaum (2014)), and flowcontrol (e.g., Allon, Deo and Lin (2013); Dobson, Tezcan and Tilson (2013);Hagtvedt et al. (2009); Huang, Carmeli and Mandelbaum (2011)). Designchallenges cover, for example, operational (fast-track) vs. clinical priorities(see also Zeltyn et al. (2011)), physician-led triage vs. the prevalent nurse-led(Burstrom et al., 2012; Oredsson et al., 2011), and the creation of a dedi-cated sub-ED (e.g. for patients with chest-pain; Zalenski et al. (1998)). Ad-
imsart-ssy ver. 2013/03/06 file: Short_Patient*flow*main.tex date: June 2, 2014

18 ARMONY ET AL.
dressing these challenges, as well as delving into the other above-mentionedcategories, would require data beyond our present resolution and hence wedo not elaborate further.
4. Internal Wards. Internal Wards (IWs), often referred to as Gen-eral Internal Wards or Internal Medicine Wards, are the “clinical heart” of ahospital. Yet, relative to EDs, Operating Rooms and Intensive Care Units,IWs have received less attention in the Operations literature; this is hardlyjustified. IWs and other medical wards offer a rich environment in needof OR/OM research, which our EDA can only tap: It has revealed multipletime-scales of LOS, intriguing phenomena of scale-diseconomies and coexist-ing operational-regimes of multiple resource types (beds, physicians). Thesecharacteristics are attributed to IW inflow design, capacity management andoperational policies (e.g. discharge procedures, physician rounds).
4.1. Basic facts. Rambam hospital has five Internal Wards consisting ofabout 170 beds that accommodate around 1000 patients per month. WardsA through D are identical from a clinical perspective; the patients treated inthese wards share the same array of clinical conditions. Ward E is differentin that it admits only patients of less severe conditions. Table 1 summarizesthe operational profiles of the IWs. For example, bed capacity ranges from24 to 45 beds and Average LOS (ALOS) from 3.7 to 6 days.
Table 1Internal wards operational profile
Ward A Ward B Ward C Ward D Ward E
Average LOS (days) 6.0 3.9 4.9 5.1 3.7(STD) (7.9) (5.4) (10.1) (6.6) (3.3)
Mean occupancy level 97.7% 94.4% 86.7% 96.9% 103.2%
Mean # patients per month 206.3 193.5 209.7 216.5 178.7
Standard (maximal) 45 (52) 30 (35) 44 (46) 42 (44) 24capacity (# beds)
Mean # patients per bed 4.58 6.45 4.77 5.16 7.44per month
Readmission rate 10.6% 11.2% 11.8% 9.0% 6.4%(within 1 month)
Data refer to period May 1, 2006–October 30, 2007 (excluding the months1-3/2007, when Ward B was in charge of an additional 20-bed sub-ward).
IWs B and E are by far the smallest (least number of beds) and the“fastest” (shortest ALOS, highest throughput). The superior operationalperformance of IW E is to be expected as it treats the clinically simplest
imsart-ssy ver. 2013/03/06 file: Short_Patient*flow*main.tex date: June 2, 2014

PATIENT FLOW IN HOSPITALS 19
cases. In contrast, the “speed” of IW B is not as intuitive because this wardis assigned the same patient mix as IWs A,C, and D.
A shorter ALOS could reflect a more efficient clinical treatment or, al-ternatively, a less conservative discharge policy. Either must not arise fromclinically premature discharges of patients, which would hurt patients clinicalquality of care. To get a grasp on that quality, we use its operational (acces-sible hence common) proxy, namely patient readmission rate (proportion ofpatients who are re-hospitalized within a pre-specified period of time: onemonth in our case). In Table 1 we observe that the readmission rate of IWB is comparable to the other wards. Moreover, patient surveys by Elkin andRozenberg (2007) indicated that satisfaction levels do not differ significantlyacross wards. We conclude that IW B appears to be operationally superioryet clinically comparable to the other wards. This fact may be attributed tothe smaller size of IW B, which we return to in Section 4.3.3.
4.2. EDA: LOS—a story of multiple time scales. Next, we examine thedistribution of LOS in the IWs. While it is to be expected that clinicalconditions affect patients LOS, the influence of operational and managerialprotocols is less obvious. It turns out that some of this influence can beuncovered by examining the LOS distribution at the appropriate time scale.
Figure 9 shows the LOS distribution in IW A, in two time scales: daysand hours. At a daily resolution, the Log-Normal distribution turns out to fitthe data well. When considering an hourly resolution, however, a completelydifferent distribution shape is observed: there are peaks that are periodically24 hours apart, which correspond to a mixture of daily distributions. (Wefound that a normal mixture fits quite well, as depicted by the 7 normalmixture-components over the range of 0–150 hours in the right diagram ofFigure 9.)
0 1 2 3 4 5 6 7 8 9
10 11 12 13 14 15 16
0 1 2 3 4 5 6 7 8 9 10 11 12 13 14 15 16 17 18 19 20
Rela
tive
frequ
enci
es %
Time (1 day resolution)
HomeHospital Patient length of stay in Ward (days) (by ward_department), Internal Medicine A
January 2004-October 2007, All days
Empirical Lognormal (mu=1.38 sigma=0.83)
Empirical: N = 8934, mean = 5.7, std = 6.3 Lognormal: mean = 5.6, std = 5.6
0.0
0.1
0.2
0.3
0.4
0.5
0.6
0.7
0.8
0.9
1.0
1.1
0 24 48 72 96 120 144 168 192 216 240 264 288 312 336 360
Rela
tive
frequ
enci
es %
Time (1 hour resolution)
HomeHospital Patient length of stay in Ward (hours) (by ward_department), Internal Medicine A January 2004 - October 2007, all days
Fitting Mixtures of Distributions
Empirical Total Normal Normal Normal Normal Normal Normal Normal
Fig 9: LOS distribution of IW A in two time-scales: daily and hourly
imsart-ssy ver. 2013/03/06 file: Short_Patient*flow*main.tex date: June 2, 2014

20 ARMONY ET AL.
These two graphs reveal the impact of two operational protocols: Thedaily time scale represents physician decisions, made every morning, onwhether to discharge a patient on that same day or to extend hospitalizationby at least one more day. The second decision is the hour-of-day at which thepatient is actually discharged. This latter decision is made according to thefollowing discharge process: It starts with the physician who writes the dis-charge letters (after finishing the morning rounds); then nurses take care ofpaperwork, instructing patients on how to continue medical treatment afterdischarge, and then arranging for transportation (if needed). The dischargeprocedure is performed over “batches” of patients and, hence, takes a fewhours. The result is a relatively low variance of the discharge time, as mostpatients are released between 3pm and 4pm—see Figure 10; which provides
36
37
38
39
40
41
42
43
0.0
0.2
0.4
0.6
0.8
1.0
1.2
1.4
1.6
1.8
2.0
2.2
0:00 2:00 4:00 6:00 8:00 10:00 12:00 14:00 16:00 18:00 20:00 22:00Nu
mbe
r of P
atie
nts
Aver
age
num
ber o
f cas
es
Time (60 min. resolution)
HomeHospital , Internal Medicine AJanuary 2004-October 2007, Sundays
Patient Arrivals to Ward (by ward_department)Patient Discharges from Ward (by ward_department) TotalNumber of Patients in Ward (average) (by ward_department)
Fig 10: Arrivals, departures, and average number of patients in Internalwards by hour of day
an explanation for the observed peaks in the hourly LOS distribution thatare spaced 24 hours apart. The variation around these peaks is determinedby the arrival process: patients are hospitalized in IWs almost exclusivelyover a 12-hour period (10am–10pm), with a peak in arrival rate between3pm–7pm (Figure 10).
Note that the arrival process to the IWs couples almost exclusively withthe departure process from the ED, and hence the timing of its peak (3pm–7pm) is naturally coupled with IW discharge peaks (3pm–4pm). In otherwords, and as further discussed in Section 5.6, the discharge policy fromIWs significantly influences ED congestion. Similar observations in a Singa-pore hospital led Shi et al. (2012) to model an inpatient ward as a 2-time-scale system, and to consequently propose flow-stabilization as a means of
imsart-ssy ver. 2013/03/06 file: Short_Patient*flow*main.tex date: June 2, 2014
PATIENT FLOW IN HOSPITALS 21
reducing delays.
Who is the Server?: Operational time-resolutions, specifically days/hoursand hours/minutes for IWs, correspond to the time scale by which servicedurations are naturally measured which, in turn, identifies a correspondingnotion of “a server”. For example, IW LOS resolution in days corresponds toconceptualizing beds as servers. This is the setup in de Bruin et al. (2009)and Bekker and de Bruin (2010) who assume (hyper-) exponential LOS.(Log-Normal service durations are yet to be accommodated by queueingmodels.) Another IW resolution is hours, which is appropriate with serversbeing nurses, physicians or special IW equipment. Here service times aremeasured in minutes or parts of an hour, and offered load (workload) iscalculated (from arrival and service data) in units of, say, hours of workthat arrive per hour of the day.
4.2.1. Research Opportunities. We discuss here workload character-ization, protocol mining via LOS distributions, flow control and why Log-Normal.
Offered Load, or Workload: The offered load is the skeleton around whichcapacity (staffing in the case of personnel) is dimensioned (Green, Kolesarand Whitt, 2007). Consider nurses as an example. Their time-varying offeredload results from both routine and special care, and it varies during theday for at least two reasons (see Equation (1) in Mandelbaum, Momcilovicand Tseytlin (2012)): (a) routine care depends linearly on patient count,which varies over a day (Figure 10), and (b) admission and discharge ofpatients require additional work beyond routine, and it is more frequentduring some hours than others (Figure 10). Combining both of these timevariations, it is clear that staffing levels must (and actually do) vary duringthe day, hence the importance of observing and understanding the systemin hourly resolution. As mentioned above, some efforts to develop queueingmodels for nurse staffing in medical wards have been carried out by Jenningsand de Vericourt (2011), Green and Yankovic (2011) and Yom-Tov (2010).However, these works neither explain or incorporate the LOS distributionobserved in our data, nor do they distinguish between routine, admission,and discharge workload. Even such a distinction might not be rich enough:indeed, the hospital environment calls for a broader view of workload, whichwe discuss in Section 5.5.4.
LOS and Protocols: LOS or Delay distributions encapsulate important op-erational characteristics, and can hence be used to suggest, measure or trackimprovements. Consider, for example, the hourly effect of IW LOS (Figure9), which is due to IW discharge protocols. It calls for an effort in the direc-
imsart-ssy ver. 2013/03/06 file: Short_Patient*flow*main.tex date: June 2, 2014

22 ARMONY ET AL.
tion of smoothing IW discharge rates over the day (Shi et al., 2012). Takingan example from elsewhere at the hospital, consider the differences in shapeof LOS distribution between two Maternity wards (§4.2.1 in EV), which re-sult from differing patient mix; it suggests the redesign of routing protocolstowards a more balanced workload (Plonski et al., 2013). Queueing modelsare natural for analyzing the interplay between LOS distributions and oper-ational protocols. This leads to open data-based questions in two directions:first, incorporating protocols (e.g. patient priorities, resource scheduling)in queueing models and validating the theoretical LOS distribution againstdata (performance); second and conversely, mining protocols from data. Wenow give two examples, one for each of the two directions.
Flow Control: How will changes in the IW discharge process influencethe system? For example, would the balancing of discharges more uniformlyover the day benefit the entire hospital? How would such a change influencedelays of patients waiting to be transferred into the IW from the ED? Thisconnection between ED boarding and ward discharges was explored by Shiet al. (2012). We return to it in Section 5.6.
Why Log-Normal? A long-standing challenge is to explain the prevalenceof Log-Normal as a distribution of service durations (e.g. IW LOS in dayshere, or durations of telephone calls in Brown et al. (2005)). Is Log-normalitydue to service protocols? It is perhaps an inherent attribute of customer ser-vice requirements? Note that Log-Normal has an intrinsic structure that isboth multiplicative—its logarithm is a central limit, and additive—it is in-finitely divisible, being an integral against a Gamma process (Thorin, 1977).Can these properties help one explain the empirical Log-Normal service timedistribution?
4.3. EDA: Operational regimes and economies of scale. An asymptotictheory of many-server queues has been developed in recent years (Gans,Koole and Mandelbaum (2003) can serve as a starting point), which hashighlighted three main operational regimes: Efficiency Driven (ED), QualityDriven (QD) and Quality & Efficiency Driven (QED). The ED-regime pri-oritizes resource efficiency: servers are highly utilized (close to 100%), whichresults in long waits for service. In fact, waiting durations in the ED regimeare at least in the order of service times. In the QD regime, the emphasisis on the operational quality of service: customers hardly wait for service,which requires that servers be amply staffed and thus available to serve.Finally, the QED regime carefully balances service quality and server effi-ciency, thus aiming at high levels of both and achieving it in systems that arelarge enough. Under the QED regime, server utilization could exceed 90%
imsart-ssy ver. 2013/03/06 file: Short_Patient*flow*main.tex date: June 2, 2014

PATIENT FLOW IN HOSPITALS 23
while, at the same time, possibly half of the customers are served withoutdelay, and those delayed wait one order of magnitude less than their serviceduration. The QED regime also exhibits economies of scale in the sense that,as the system grows, operational performance improves.
Many-server queueing theory is based on asymptotic analysis, as the num-ber of servers grows indefinitely. Nevertheless, QED theory has been foundvaluable also for small systems (few servers) that are not exceedingly over-loaded. This robustness to system size is due to fast rates of convergence(Janssen, van Leeuwaarden and Zwart, 2011) and, significantly, it rendersQED theory relevant to healthcare systems (Jennings and de Vericourt,2011; Yom-Tov and Mandelbaum, 2014). One should mention that, prior tothe era of many-server theory, asymptotic queueing theory was mostly con-cerned with relatively small systems—that is few servers that are too over-loaded for QED to be applicable (e.g. hours waiting time for service times ofminutes). This regime is nowadays referred to as conventional heavy-traffic(Chen and Yao, 2001) and, at our level of discussion, it is convenient toincorporate it into the ED-regime.
In the following subsection, we seek to identify the operational regime thatbest fits the IWs. We then investigate (§4.3.3) the existence of economies-of-scale in the hospital environment. We shall argue that, although IW bedsplausibly operate in the QED regime, there is nevertheless evidence for dis-economies of scale.
4.3.1. In what regime do IWs operate? Can QED- and ED-regimes co-exist?. We start by identifying the operational regimes that are relevant toour system of IWs. This system has multiple types of servers (beds, nurses,physicians, medical equipment), and each must be considered separately.Here we focus on beds and physicians.
We argue that IW beds operate (as servers) in the QED regime. To sup-port this statement, we first note that our system of IWs has many (10’s)beds/servers. Next we consider three of its performance measures: (a) bedoccupancy levels; (b) fraction of patients that are hospitalized in non-IWswhile still being under the medical care of IW physicians (patients who wereblocked from being treated in IWs due to bed scarcity); (c) ratio betweenwaiting time for a bed (server) and LOS (service time).
Considering data from the year 2008, we find that 3.54% of the ED pa-tients were blocked, the occupancy level of IW beds was 93.1%, and patientswaited hours (boarding) for service that lasted days (hospitalization). Suchoperational performance is QED—single digit blocking probability, 90+%utilization and waiting duration that is one order of magnitude less than ser-
imsart-ssy ver. 2013/03/06 file: Short_Patient*flow*main.tex date: June 2, 2014

24 ARMONY ET AL.
vice. Preliminary formal analysis, carried out in Section 4.3.1 of EV, demon-strates that QED performance of a loss model (Erlang-B, as in de Bruin et al.(2009)) usefully fits these operational performance measures of the IWs.
Turning to physicians as servers, we argue that they operate in the EDregime (conventional heavy traffic). This is based on the following observa-tion: from 4pm to 8am on the following morning, there is a single physicianon duty in each IW, and this physician admits the majority of new patientsof the day. Therefore, patients that are admitted to an IW (only if there isan available bed) must wait until both a nurse and the physician on call be-come available. The admission process by the physician lasts approximately30 minutes, and waiting time for physicians is plausibly hours (it takes anaverage of 3.2 hours to transfer a patient from the ED to the IWs; see Section5.2). Performance of physicians is therefore Efficiency Driven.
4.3.2. Research Opportunities. We identified two operational regimes,QED and ED, that coexist within the ED+IW: waiting in the ED for IW ser-vice. What queueing models and operational regimes can valuably capturethis reality? Note that such models must accommodate three time scales:minutes for physician treatment, hours for transfer delays, and days for hos-pitalization LOS. Some questions that naturally arise are the following: Howdo the regimes influence each other? Can we assume that the “bottleneck”of the system is the ED resource (physicians)? Thus, can one conclude thatadding physicians is necessary for reducing transfer delays, while addingbeds would have only a marginal impact on these delays? How would achange of physician priority influence the system, say giving higher priorityto incoming patients (from the ED) over the already hospitalized (in theIWs)? Does the fact that physicians operate in the ED-regime eliminate theeconomies of scale that one expects to find in QED systems? Empirical ob-servations that will now be presented suggest that this might indeed be thecase.
4.3.3. Diseconomies of scale (or how ward size affects LOS). Our data(Table 1) exhibits what appears to be a form of diseconomies of scale: asmaller ward (IW B) has a relative workload that is comparable to the largerwards, yet it enjoys a higher turnover rate per bed and a shorter ALOS,with no apparent negative influence on the quality of medical care. Thephenomenon is reinforced by observing changes in LOS of IW B, when thenumber of beds in that ward changes. Figure 11 presents changes in ALOSand the average patient count, in IWs B and D over the years. During 2007,the ALOS of Ward B significantly increased. This was due to a temporarycapacity increase, over a period of two months, during which IW B was
imsart-ssy ver. 2013/03/06 file: Short_Patient*flow*main.tex date: June 2, 2014

PATIENT FLOW IN HOSPITALS 25
made responsible for 20 additional beds. We observe that, although the sameoperational methods were used, they seem to work better in a smaller ward.In concert with the latter observation, we note a reduction in ALOS of IWD, mainly from 2007 when ward size decreased as a result of a renovation.One is thus led to conjecture that there are some drawbacks in operatinglarge medical units—e.g. larger wards are more challenging to manage, atleast under existing conditions.
90
100
110
120
130
140
150
160
20
25
30
35
40
45
50
2004 2005 2006 2007 2008
Aver
age
leng
th o
f sta
y (A
LOS)
Aver
age
num
ber o
f pat
ient
s
Year
HomeHospital, January 2004-October 2007, All days
Number of Patients in Ward, Internal Medicine B (by physical location)Number of Patients in Ward, Internal Medicine D (by physical location)ALOS in Ward (hours, by physical location), Internal Medicine BALOS in Ward (hours, by physical location), Internal Medicine D
Fig 11: Average LOS and number of patients in Internal wards B and D byyear
Several factors could limit the blessings of scale economies:
• Staffing policy : It is customary, in this hospital, to assign an IW nurseto a fixed number of beds; then nominate one experienced nurse tobe a floater for solving emerging problems and help as needed. Thissetting gives little operational advantage to large units, if at all: thelarger the unit the less a single floater can help each nurse. The trade-off that is raised is between personal care (dedicated servers hence carecontinuity) vs. operational efficiency (pooling). This tradeoff has beenaddressed in call centers (Aksin, Karaesmen and Ormeci, 2007; Jouini,Dallery and Aksin, 2009), and in outpatient medical care (Balasubra-manian, Muriel and Wang, 2012; Balasubramanian et al., 2010), butinpatient healthcare will surely add its own idiosyncracies. Anothernatural tradeoff that arises is whether the floater should indeed be anexperienced nurse, or is it better to let more junior nurses be floatersso that they can learn from this broader experience.• Centralized medical responsibility : Ward physicians share the respon-
sibility over all patients. Every morning, the senior physicians, resi-
imsart-ssy ver. 2013/03/06 file: Short_Patient*flow*main.tex date: June 2, 2014

26 ARMONY ET AL.
dents, interns, and medical students examine every patient case to-gether (physicians’ rounds) and discuss courses of treatment. This isessential as Rambam hospital is a teaching hospital, and one of its cen-tral missions is the education and training of doctors. Naturally, thelarger the unit the longer its morning round and, consequently, lesscapacity is available for other tasks (e.g. admissions and discharges).
4.3.4. Research opportunities. In Section 4.3.2 of EV we provide ad-ditional plausible explanations for the observed diseconomies of scale. Thisphenomenon is important to model carefully and understand, as it can sig-nificantly affect decisions on unit sizing and operational strategy. WhileQueueing Theorist are well equipped to address the operational dimensionsof such decisions, they must collaborate with researchers from other dis-ciplines such as organizational behavior for complete comprehension. Nowsuppose one takes size differences among wards as a given fact (e.g. dueto space constraints that cannot be relaxed). Then the following questionarises: What protocol should be used to route patients from the ED to thewards, in order to fairly and efficiently distribute workload among them?This challenge is directly related to the process of transferring patients fromthe ED to the IWs, which is the topic of the next section.
5. The ED+IW Network. After discussing the ED and IWs sepa-rately, in this section we discuss the ED+IW network as a whole. We startwith the “ED-to-IW” process of transferring patients from the ED to theIWs. One may think of this process as the “glue” that connects the ED tothe IWs. We discuss delays in the transfer process (Sections 5.2-5.4) andfairness in this process towards both patients and medical staff (Section5.5). We conclude, in Section 5.6, with an integrative view of the interplaybetween the three components: ED, IWs, and ED-to-IW.
5.1. ED-to-IW Transfer Process: Basic facts. The “ED-to-IW” processcovers patient transfers from the ED to the IWs. We view this process in thecontext of flow or routing control. Routing in hospitals differs from routingin other service systems, for various reasons including incentive schemes,customers’ (patients’) limited control (or even helplessness), and the timingof the routing decision. Thus, although the transfer process involves routing-related issues similar to those that have been looked at extensively in thequeueing literature, our data indicate that unusual system characteristicssignificantly affect delays and fairness features in a hospital setting, whichcreates many research opportunities.
imsart-ssy ver. 2013/03/06 file: Short_Patient*flow*main.tex date: June 2, 2014

PATIENT FLOW IN HOSPITALS 27
A patient, whom an ED physician decides to hospitalize in an IW, is as-signed to one of five wards, according to a certain routing policy (describedmomentarily). If that ward is full, its staff may ask for reassignment withthe approval of the hospital’s Head Nurse. Once the assigned ward is set,the ward staff prepares for this patient’s arrival. In order for the transferto commence, a bed and medical staff must be available, and the bed andequipment must be prepared for the specific patient (including potential re-arrangement of current IW patients). Up to that point, the patient waits inthe ED and is under its care and responsibility. If none of the IWs is able toadmit the patient within a reasonable time, the patient is “blocked”, namelytransferred to a non-internal ward. Then the latter undertakes nursing re-sponsibilities while medical treatment is still obtained from an IW physician.
An integral component of the transfer process is a routing policy, or pa-tient assignment algorithm. As described in Section 4.2, Wards A–D providesimilar medical services, while Ward E treats only the less severe patients.The similarity between Wards A–D requires a systematic assignment schemeof patients to these wards. Rambam hospital determines the assignment viaa round-robin (cyclical) order among each patient type (ventilated, specialcare, and regular), while accounting for ward size (e.g. if Ward X has twiceas many beds as Ward Y, then Ward X gets two assignments per one as-signment of Y). This scheme is implemented by a computer software called“The Justice Table”. As the name suggests, the algorithm was designed bythe hospital to ensure fair distribution of patient load among wards, so thatstaff workload will be balanced. It is worth noting that a survey among 5additional hospitals in Israel (EV, Section 5.6) revealed that a cyclical rout-ing policy is very common; yet, some hospitals apply alternative assignmentschemes, for example, random assignment by patient ID. Interestingly, onlyone of the surveyed hospitals uses an assignment that takes into accountreal-time bed occupancy.
5.2. Delays in transfer. As is customary elsewhere, the operational goalof Rambam hospital is to admit ED boarding patients to the IWs withinfour hours from decision of hospitalization. However, the delays are oftensignificantly longer. The waiting-time histogram in Wards A–D, for the years2006-2008, is depicted in Figure 12. We observe significant delays: while theaverage delay was 3.2 hours, 25% of the patients were delayed for more than4 hours.
An interesting phenomenon is observed when analyzing transfer delaysby patient type. We note that, on average, ventilated patients wait muchlonger (8.4 hours) than regular and special care patients (average of 3 and
imsart-ssy ver. 2013/03/06 file: Short_Patient*flow*main.tex date: June 2, 2014

28 ARMONY ET AL.
!"#
$"#
%!"#
%$"#
&!"#
&$"#
'!"#
%# &# '# (# $# )# *# +# ,# %!#%%#%&#%'#%(#%$#%)#%*#%+#%,#
!"#$%&'"()*"+,
"-./(
0&1"(234,*56(
-./01230.4#
56.7132#839.#
:.;<239#
=>032#
Patient AVG % delay % delayType (STD) ≤ 4 h > 10 h
Regular 3.00 77% 2%(2.53)
Special 3.33 74% 5%Care (3.16)
Ventilated 8.39 41% 41%(6.59)
All Types 3.22 75% 4%(2.98)
Fig 12: Transfer time by patient type, in hours
* Data refer to period 5/1/06–10/30/08 (excluding the months 1–3/07, whenWard B was in charge of an additional sub-ward)
3.3 hours respectively)—see Figure 12. In particular, the delay distributionof these ventilated patients is bi-modal with 41% of such patients delayedby more than 10 hours. Ventilated patients must have the highest priorityin transfer but, in reality, many do not benefit from it.
How come do many of the ventilated patients experience such long delays?We observe that the shorter delays of the ventilated patients (≤ 4 hours)have a pattern that resembles that of the other two patient types. The longerdelays are harder to decipher. Possible explanations include: (a) Ventilatedpatients are hospitalized in a sub-ward inside the IW (A–D), often referredto as Transitional (intensive) Care Unit (TCU) (Armony, Chan and Zhu,2013). Each such TCU has only 4–5 beds. The average occupancy rate ofthe TCUs at Rambam is 98.6%; the combination of high occupancy with asmall number of beds results in long waits during overloaded periods. (b)Ventilated patients require a highly qualified staff to transfer them to theward. Coordinating such transfers takes longer.
5.2.1. Research Opportunities. Delays in transfer add opportunitiesto those arising from protocol mining, as discussed at the end of §4.2.1;relevant here is the specific challenge of deciphering a routing protocol fromdata such as in Figure 12. In addition, one would like to be able to analyzeand optimize patient-flow protocols in queueing models, specifically herefork-join networks (representing synchronization between staff, beds andmedical equipment) with heterogeneous customers. Such models, under theFCFS discipline, were approximated in Nguyen (1994). Their control wasdiscussed in Atar, Mandelbaum and Zviran (2012) and Leite and Fragoso(2013).
imsart-ssy ver. 2013/03/06 file: Short_Patient*flow*main.tex date: June 2, 2014

PATIENT FLOW IN HOSPITALS 29
The discussion above also raises the tension between pooling and continuity-of-care. The fact that Rambam chose to distribute TCU beds among fourIWs, instead of having one larger TCU, definitely increases waiting time fora TCU bed. Nevertheless, it is also advantageous from the quality-of-careperspective to have the TCU beds be part of an IW since, when patients’condition improve, they are transferred from the TCU in the IW to a regu-lar room in the same IW, while continuing treatment by the same medicalstaff (physicians and nurses). This continuity of care reduces the number ofhand-offs, which are prone to loss of information and medical errors. Thetradeoff between pooling and continuity-of-care is an interesting challengeto navigate using OR methods.
5.3. Influence of transfer delays on the ED. Patients awaiting transfer(boarding patients) overload the ED: beds remain occupied while new pa-tients continue to arrive, and the ED staff remains responsible for theseboarding patients. Therefore, the ED in fact takes care of two types of pa-tients: boarding patients (awaiting hospitalization) and in-process patients(under evaluation or treatment in the ED). Both types suffer from delays inthe transfer process.
Boarding patients may experience significant discomfort while waiting:the ED is noisy, it is not private and often does not serve hot meals. Inaddition, ED patients do not enjoy the best professional medical treatmentfor their particular condition, and do not have dedicated attention as inthe wards. Moreover, longer ED stays are associated with higher risk forhospital-acquired infections (nosocomial infections). Such delays may in-crease both hospital LOS and mortality rates, similarly to risks of delaysin ICU transfer (e.g. Chalfin et al. (2007); Long and Mathews (2012); Maa(2011)). Hence, the longer patients wait in the ED, the higher the likelihoodfor clinical deterioration and the lower is their satisfaction.
In-process ED patients may suffer from delays in treatment, as additionalworkload imposed by transfer patients on ED staff can be significant. Figure13 shows our estimates of the fraction of time that ED physicians spent car-ing for the transfer patients, assuming (the Rambam experience) that everysuch patient requires an average of 1.5 minutes of physician’s time every 15minutes. We observe that transfer patients take up to 11% of physician timein the ED. This extra workload for the ED staff, that occurs at times whentheir workload is already high, results in “wasted” capacity and throughputdegradation, as discussed in Section 3.2.3.
To summarize, by improving patient flow from the ED to the IWs, inparticular reducing transfer times, hospitals can improve the service and
imsart-ssy ver. 2013/03/06 file: Short_Patient*flow*main.tex date: June 2, 2014

30 ARMONY ET AL.
0
0.02
0.04
0.06
0.08
0.1
0.12
0.14
0.0 0.5 1.0 1.5 2.0 2.5 3.0 3.5 4.0 4.5 5.0
00:00 02:00 04:00 06:00 08:00 10:00 12:00 14:00 16:00 18:00 20:00 22:00
Frac
tion
of L
oad
Num
ber o
f Pat
ient
s
Time (15 min. resolution)
HomeHospital Number of Patients in ED-to-Ward transfer (average) (by physical location),
Department of Internal Medicine January 2004-October 2007, All days
Number of Patients in ED-to-Ward transfer Fraction of Physician Load
Fig 13: Number of patients in ED-to-IW transfer (A–E) and the fraction oftime that ED physicians devote to these patients
treatment provided to both transfer and in-process patients. In turn, reduc-ing the workload in the ED would improve response to arriving patients andcould, in fact, save lives.
5.3.1. Research Opportunities. The delays in transfer give rise to thefollowing research questions:
1. Modeling transfer queue: Transfer patients may be viewed as customerswaiting in queue to be served in the IW. Traditionally, in QueueingTheory, it has been assumed that customers receive service only oncethey reach a server, and not while waiting in queue. In contrast, herea waiting patient is “served” by both the ED and the IW. In theED, clinical treatment is provided: according to regulations, transferpatients must be examined at least every 15 minutes. In the ward,“service” actually starts prior to the physical arrival of the patient,when the ward staff, once informed about a to-be-admitted patient,starts preparing for the arrival of this specific patient. The above hasimplications on modeling the ED-to-IW process, and it affects staffing,work scheduling, etc. A natural modeling framework here would bequeueing networks with signals (Chao, Miyazawa and Pinedo, 1999).
2. Emergency Department architecture: As described, ED staff attends totwo types of patients: transfer and in-process. Each type has its ownservice requirements, leading to differing service distributions and dif-fering distribution of time between successive treatments. While trans-fer patients receive periodic service according to a nearly-deterministicschedule (unless complications arise), in-process service is random, in
imsart-ssy ver. 2013/03/06 file: Short_Patient*flow*main.tex date: June 2, 2014

PATIENT FLOW IN HOSPITALS 31
nature.One may consider two options for ED architecture: (a) treat transferand in-process patients together in the same physical location, as isdone at Rambam, or (b) move the transfer patients to a transitionalunit (sometimes called “delay room” or “observation room”), wherethey wait for transfer; this is done, for example, in a Singapore hospi-tal that we were in contact with. Note that using option (b) implieshaving dedicated staff, equipment and space for this unit. The follow-ing question then arises: Under what conditions is each of these EDarchitectures more appropriate?Note that the Singapore hospital architecture is even more complicatedthan (b) above, as the responsibility for the transfer patients is handedover to IW physicians after a two-hour ED boarding delay. This pro-vides the IW medical staff with an incentive to transfer the patients tothe ward, as soon as possible, where they can be comfortably treated.In EV, Section 5.6, we further discuss how different architectures arerelated to incentive schemes and, in turn, influence delay times.
5.4. Causes of delay. In order to understand the causes of long delays inthe ED-to-IW transfer, we interviewed hospital staff, conducted a time andmotion study, and further explored our data. We learned that delays arecaused not only by bed unavailability; patients often wait even when thereare available beds. Indeed, our data shows that the fraction of patients whohad an available bed in their designated ward, upon their assignment time,was 43%, 48%, 76%, 55%, for Wards A–D, respectively. However, as Figure12 shows, the probability to be admitted to the wards, immediately (orwithin a short time) after hospitalization decision, was much smaller. Infact, over the same period of time, only 4.9% of the patients were admittedto an IW within 30 minutes from their assignment to this ward. Our findingsidentify 13 plausible causes for delay, which are summarized in the Cause-and-Effect (Fishbone) diagram depicted in Figure 14. We elaborate here ontwo that have some interesting modeling aspects.
1. Timing of routing decision: Input-queued vs. Output-queued system.Recall that preparation for a transfer of a particular patient startsin the designated ward, prior to the actual transfer. This forces thehospital to adopt an output-queued scheme (Stolyar, 2005), where eachpatient is first assigned to an IW and then waits until the ward is ableto admit. This is in contrast to a scheme where patients are placedin a “common” queue, then routed to an IW only once at the headof the line and a bed in any of the IWs becomes available. The latter
imsart-ssy ver. 2013/03/06 file: Short_Patient*flow*main.tex date: June 2, 2014

32 ARMONY ET AL.
Delays in ED-IW transfers
ED-IW synchronization Work methods
Staff availability Equipment availability
Communicationproblems
Not consideringward occupancies
Allowing skipping
Delayed IWdischarges
Nursesavailability
Doctorsavailability
Stretcher bearersavailability
Nurse-in-chargeavailability
Beds availability
Medical equipmentavailability
Interference intothe Justice Table
Timing of routingdecisions
Incentive mechanism
Fig 14: ED-to-IW delays—Causes and effects chart
is referred to as an input-queued scheme. Figure 15 depicts the twoschemes.
Fig 15: Output- vs. Input-queued scheme
Output-queued schemes are inherently less efficient than their input-queued counterparts, because the routing decision is made at an earliertime with less information. Moreover, the output-queued scheme isinequitable towards patients because FCFS is often violated.The problem of customer routing in input-queued schemes has re-ceived considerable attention in the queueing literature (e.g. Armony(2005); Atar and Shwartz (2008); Gurvich and Whitt (2010); Man-delbaum and Stolyar (2004)). Similar issues in output-queued systemshave been generally overlooked. Exceptions include Stolyar (2005) and
imsart-ssy ver. 2013/03/06 file: Short_Patient*flow*main.tex date: June 2, 2014

PATIENT FLOW IN HOSPITALS 33
Tezcan (2008) who establish that the two systems have asymptoticallysimilar performance, in both the conventional and the many-serverheavy traffic regimes. This implies that inefficiencies, which arise inour ED-to-IW process due to the use of an output-queued scheme,become negligible in heavily loaded systems. More generally, insightsgained from studying the input-queued systems, as in the above ref-erences, may carry over to the output-queued systems. But how welldoes that insight translate to an environment such as a medical unit?This should be tested empirically; a first step was taken by Tseytlinand Zviran (2008).
2. Not considering ward occupancies: The role of information availabilityin routing. An additional important aspect of routing schemes, whichdirectly affects patient delays, is the availability of information on thesystem state, at the moment of the routing decision. On the one hand,hospitals may base the routing on no information, namely use a staticrouting policy like round robin (surprisingly, our experience suggeststhat this is a prevalent policy). On the other extreme, a full informationpolicy that takes into account current occupancy levels and projectedfuture dismissals and transfers is feasible, if the information system isaccurate and accommodating enough (See Chapter 8 in Hall (2012),which discusses bed management). It is important to understand theeffect of information availability on system performance and fairnesstowards patients and medical staff.
5.5. Fairness in the ED-to-IW process. Transfer policies may have rami-fications on fairness towards customers (patients) and towards servers (med-ical and nursing staff). We investigate both aspects next.
5.5.1. Fairness towards patients. In Section 5.4, we pointed out thatoutput-queued schemes lead to diminished patient fairness, as FCFS order isoften violated. (For references on the significance of FCFS in customer jus-tice perception, see Mandelbaum, Momcilovic and Tseytlin (2012).) Indeed,our Rambam data indicate that 45% of the ED-to-IW transfer patients were“overtaken” by another patient (see Table 2). Moreover, more than a thirdof those were overtaken by at least three other patients. Although this fig-ure includes overtaking between patient types, which may be due to clinicalpriorities, within each patient type there were significant FCFS violationsas well. Specifically, 31% were actually overtaken by at least one patient ofthe same type, most of them not within the same ward, and hence theseviolations are conceivably due to the output-queued scheme.
While output-queues are inherently inefficient and unfair, they are un-
imsart-ssy ver. 2013/03/06 file: Short_Patient*flow*main.tex date: June 2, 2014

34 ARMONY ET AL.
Table 2Percentage of FCFS violations per type within each IW
IW \ Type Regular Special care Ventilated Total
Ward A 7.57% 7.33% 0.00% 7.37%
Ward B 3.86% 5.72% 0.00% 4.84%
Ward C 7.09% 6.62% 0.00% 6.80%
Ward D 8.18% 7.48% 2.70% 7.81%
Total within wards 6.91% 6.80% 0.67% 6.80%
Total in ED-to-IW 31% 31% 5%
likely to change in Rambam hospital due to the practical/clinical consid-erations described above, as well as psychological consideration (e.g., earlyward assignment reduces uncertainty which in turn reduces anxiety for pa-tients and their families). The use of output-queues in the ED-to-IW processillustrates some idiosyncrasies of flow control in healthcare.
5.5.2. Research Opportunities. A natural question is how to bestmaintain patient fairness in the output-queued scheme: What routing poli-cies will keep the order close to FCFS? Is FCFS asymptotically maintainedin heavy-traffic?
What other fairness criteria should be considered? Assuming that patientshave preferences (clinical or prior experiences) for a specific ward, fairnessmay be defined with respect to the number of patients who are not assignedto their top priority. Related to this is the work of Thompson et al. (2009)that looks into minimizing the cost that reflects the number of “non-ideal”ward assignments; we propose to also look at the equity between patientsin this context. One may alternatively consider achieving equity in termsof blocking probability (recall the discussion in §4.3.1) or patient delay. Forthe latter, Chan, Armony and Bambos (2011) show that such fairness maybe achieved via Maximum Weighted Matching.
5.5.3. Fairness towards staff. In Section 5.4 we discussed the implica-tions of the routing policy on delays in the ED-to-IW process; in addition,routing also has a significant impact on wards’ workload. High workloadtends to cause personnel burnout, especially if work allocation is perceivedas unjust (references can be found in Armony and Ward (2010)). Rambamhospital takes fairness into consideration, as is implied from the name “Jus-tice Table”. However, is the patient allocation to the wards indeed fair?
There are many candidates for defining server “fairness”. One naturalmeasure is equity in the occupancy level. Since the number of nurses and
imsart-ssy ver. 2013/03/06 file: Short_Patient*flow*main.tex date: June 2, 2014

PATIENT FLOW IN HOSPITALS 35
doctors is typically proportional to the number of beds, equal occupancylevels imply that each nurse/doctor treats the same number of patients, onaverage. But does this imply that their workload is evenly distributed?
As mentioned in §4.2.1, staff workload in hospitals is not spread uniformlyover a patient’s stay, as patients admissions/discharges tend to be workintensive and treatment during the first days of a patient’s hospitalizationrequire much more time and effort from the staff than in the following days(Elkin and Rozenberg, 2007). Thus, one may consider an alternative fairnesscriterion: balancing the incoming load, or the “flux”—number of admittedpatients per bed per time unit, among the wards. In Table 1 we observe thatWard B has a high average occupancy rate. In addition, as it is both thesmallest and the “fastest” (shortest ALOS) ward, then (by Little’s law) ithas the highest flux among comparable IWs A–D. The workload of Ward Bstaff is hence the highest. We conclude that the most efficient ward is subjectto the highest load—that is, patient allocation appears unfair towards wardstaff.
Our data have already motivated some work on fair routing. Analyticalresults for input-queued systems were derived in Mandelbaum, Momcilovicand Tseytlin (2012), where both occupancy level and flux are taken intoaccount with respect to fairness. Tseytlin and Zviran (2008) perform a sim-ulation study of the output-queued system under various routing schemes.They propose a simulation-supported algorithm that balances a weightedfunction of occupancy and flux to achieve both fairness and short delays.
5.5.4. Research Opportunities. In the context of output-queued sys-tems, a more rigorous analytical study is needed to formalize the conclusionsof Tseytlin and Zviran (2008). Specifically, how to combine the occupancyand flux criteria into a single effective workload measure, which would bebalanced across wards. Even in the context of input-queued systems, it is ourview that Armony and Ward (2010); Mandelbaum, Momcilovic and Tseytlin(2012) and Ward and Armony (2013) have just taken the first steps towardsstaff fairness, as they do not fully account for the dynamic nature of work-load in healthcare. As patients progress in their hospital stay, their medicalneeds change (mostly reduce) and the accuracy in which one can predicttheir LOS increases. This information could be very useful in successfullybalancing workload.
The underlying definition of operational fairness, in our discussion thusfar, proposed equal workload division across medical staff. A prerequisitefor solving the “fairness problem” is then to define and calculate workloadappropriately. However, we argue that such calculations must include not
imsart-ssy ver. 2013/03/06 file: Short_Patient*flow*main.tex date: June 2, 2014
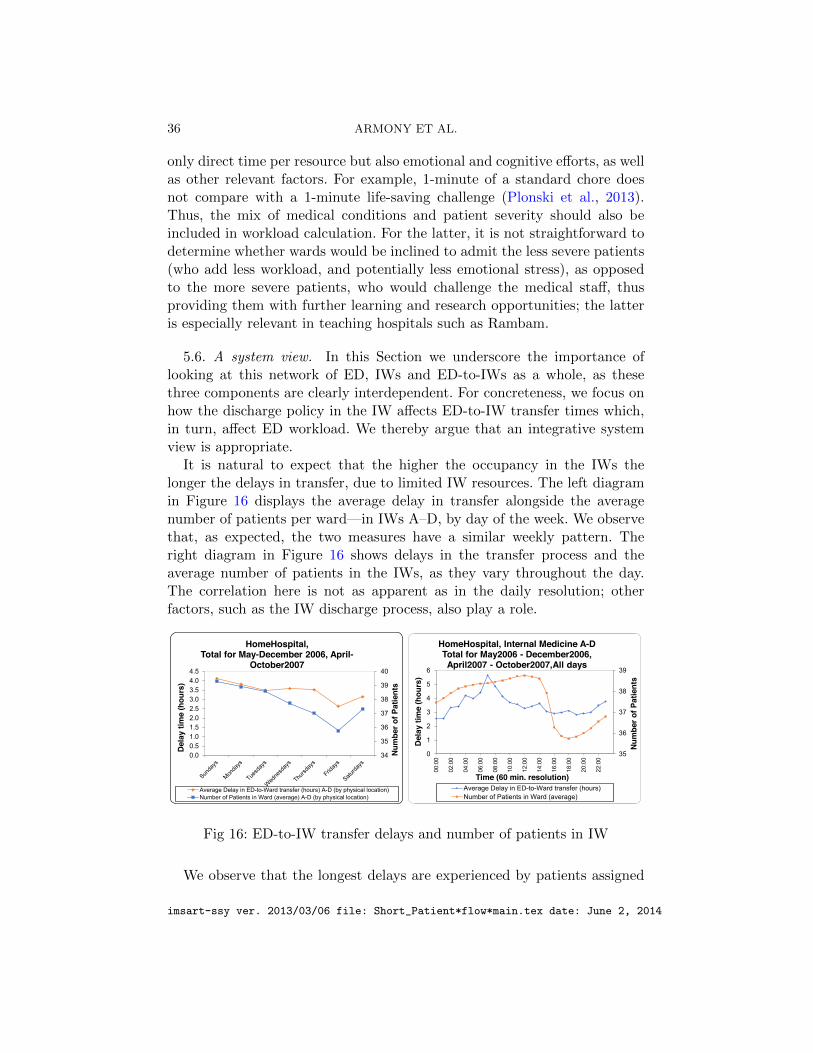
36 ARMONY ET AL.
only direct time per resource but also emotional and cognitive efforts, as wellas other relevant factors. For example, 1-minute of a standard chore doesnot compare with a 1-minute life-saving challenge (Plonski et al., 2013).Thus, the mix of medical conditions and patient severity should also beincluded in workload calculation. For the latter, it is not straightforward todetermine whether wards would be inclined to admit the less severe patients(who add less workload, and potentially less emotional stress), as opposedto the more severe patients, who would challenge the medical staff, thusproviding them with further learning and research opportunities; the latteris especially relevant in teaching hospitals such as Rambam.
5.6. A system view. In this Section we underscore the importance oflooking at this network of ED, IWs and ED-to-IWs as a whole, as thesethree components are clearly interdependent. For concreteness, we focus onhow the discharge policy in the IW affects ED-to-IW transfer times which,in turn, affect ED workload. We thereby argue that an integrative systemview is appropriate.
It is natural to expect that the higher the occupancy in the IWs thelonger the delays in transfer, due to limited IW resources. The left diagramin Figure 16 displays the average delay in transfer alongside the averagenumber of patients per ward—in IWs A–D, by day of the week. We observethat, as expected, the two measures have a similar weekly pattern. Theright diagram in Figure 16 shows delays in the transfer process and theaverage number of patients in the IWs, as they vary throughout the day.The correlation here is not as apparent as in the daily resolution; otherfactors, such as the IW discharge process, also play a role.
34
35
36
37
38
39
40
0.00.51.01.52.02.53.03.54.04.5
Num
ber o
f Pat
ient
s
Dela
y tim
e (h
ours
)
HomeHospital, Total for May-December 2006, April-
October2007
Average Delay in ED-to-Ward transfer (hours) A-D (by physical location)Number of Patients in Ward (average) A-D (by physical location)
35
36
37
38
39
0
1
2
3
4
5
6
00:0
0
02:0
0
04:0
0
06:0
0
08:0
0
10:0
0
12:0
0
14:0
0
16:0
0
18:0
0
20:0
0
22:0
0
Num
ber o
f Pat
ient
s
Dela
y tim
e (h
ours
)
Time (60 min. resolution)
HomeHospital, Internal Medicine A-DTotal for May2006 - December2006, April2007 - October2007,All days
Average Delay in ED-to-Ward transfer (hours)Number of Patients in Ward (average)
Fig 16: ED-to-IW transfer delays and number of patients in IW
We observe that the longest delays are experienced by patients assigned
imsart-ssy ver. 2013/03/06 file: Short_Patient*flow*main.tex date: June 2, 2014

PATIENT FLOW IN HOSPITALS 37
to the IWs in early morning (6am–8am)—these patients need to wait onaverage 5 hours or more. This is due to the fact that IW physicians performtheir morning rounds at this time and cannot admit new patients. Thenwe note a consistent decline in the transfer delay up until noon. Patientsassigned to the IWs during these times are admitted into the IWs between1–3pm. This is about the time when the physicians’ morning rounds arecomplete; staff and beds are starting to become available. Indeed, there isa sharp decline in the number of IW patients around 3–4pm when most ofthe IWs discharges are complete.
Further data analysis reveals that patients who are transferred to the IWsbefore 8am experience a significantly shorter LOS; Figure 17 shows that earlyhospitalization may reduce ALOS by more than 1 day. A correlation betweenhospitalization time and LOS was also reported by Earnest, Chen and Seow(2006): they observed that patients who are admitted in afternoon/nighthours have ALOS that is longer than patients admitted in the morning.In contrast, we differentiate between early- and late-morning admissions.Regardless, in both cases, the plausible explanation for the difference inALOS is the same: If patients are admitted to the ward early enough, thefirst day of treatment is more effective, as tests, medical procedures andtreatments start earlier, and hence LOS is reduced. Thus, we argue that itis important to shorten the ED-to-IW transfer process and improve the IWadmission process so that the first day of hospitalization is not “wasted”.More on that in the research opportunities that follow.
0
1
2
3
4
5
6
7
8
9
0:00 2:00 4:00 6:00 8:00 10:00 12:00 14:00 16:00 18:00 20:00 22:00
LOS
Mea
ns
Ward Admission Time (60 min. resolution)
HomeHospital Hospitalization LOS (days) vs. first ward admission time (by physical location)
January 2004 - October 2007, Weekdays
Total Internal Medicine A Internal Medicine B
Internal Medicine C Internal Medicine D
Fig 17: ALOS in IWs A through D, as a function of ward admission-time
In Section 5.3, we discussed how transfer delays impact physician work-load in the ED and hence may influence quality of care there. Thus, weobserve a chain of events in which the discharge policy in the IWs impactsthe delays in transfer, which in turn affects workload in the ED. In partic-
imsart-ssy ver. 2013/03/06 file: Short_Patient*flow*main.tex date: June 2, 2014

38 ARMONY ET AL.
ular, a system-view perspective is called for.
5.6.1. Research opportunities. Our discussion suggests that daily rou-tines (schedules) in the IWs have significant impact on transfer delays andthereby on ED workload. At the same time, these routines also affect IWLOS. The question arises as to if and how one might wish to change thesedaily routines in view of these effects. The question fits well within a queue-ing context. The present daily routine at Rambam may be viewed as apriority scheme where currently-hospitalized IW patients enjoy priority dur-ing morning physicians’ rounds; these patients become low-priority, as dis-charged patients obtain priority in the afternoon, then followed by newly-admitted patients. Is it possible to positively affect overall system perfor-mance by altering these priorities? (e.g. prioritizing newly-admitted andto-be discharged patient in the morning.) More broadly, the challenge fallswithin the uncharted territory of designing priority schemes for time-varyingqueueing networks.
Our discussion here brings us back to the broader issue—that is the needfor a system view, in order to understand and relieve delays in patient flow.Consider, for example, the boarding patients in EDs (Figure 16) or in ICUs(Long and Mathews, 2012). Delays in transferring these boarding patientsare often due to scarce resources or synchronization gaps (Zaied, 2011),which are rooted in parts of the system that differ from those where thedelays are manifested. For example, scarce resources in the IWs exacerbateED delays, and tardy processing of MRI results can prolong ICU LOS. Itfollows that a system view is required for the analysis of patient flow inhospitals.
When analyzing ED+IWs flows (§5), the wards operate naturally on atime-scale of days while the ED time scale is hours. Wards thus serve as arandom environment for the ED (Ramakrishnan, Sier and Taylor, 2005). Fig-ure 9 (§4.2) reveals that the hourly scale is also of interest for IWs. Theseempirical observations arise in a service system (hospital) that evolves inmultiple time scales, which are all natural and relevant for measuring andmodeling its performance. The mathematical manifestation of such scalesis asymptotic analysis that highlights what matters at each scale, while av-eraging out details that are deemed insignificant (e.g., Mandelbaum, Mom-cilovic and Tseytlin (2012), Shi et al. (2012), Gurvich and Perry (2012) andZacharias and Armony (2013)).
6. Discussion and concluding remarks. We have described researchopportunities that arose from EDA of operation patient flow data. We nowdiscuss the relationship between operational performance measures and over-
imsart-ssy ver. 2013/03/06 file: Short_Patient*flow*main.tex date: June 2, 2014

PATIENT FLOW IN HOSPITALS 39
all hospital performance, and conclude with comments on data-based ORresearch.
6.1. Operational measures as surrogates to overall hospital performance,or queueing models reach beyond the operational. Hospital performance ismeasured across a variety of dimensions: clinical, financial, operational, psy-chological (patient satisfaction) and societal. The most important measuresare clearly clinical but, practically, operational performance is the easiestto quantify, measure, track and react upon in real time. Moreover, opera-tional performance is tightly coupled with the other dimensions (e.g. rateof readmissions with quality of clinical care, or LOS and LWBS with finan-cial performance), which explains its choice as a “language” that capturesoverall hospital performance.
Operational performance measures are often associated with patient flow.Among these, we discussed LWBS (Section 3) and “blocking” (where pa-tients end up being hospitalized in a ward different from that which is med-ically best for them - Section 4.3.1); boarding (transfer) time from the EDto the appropriate medical unit; and measures related to LOS, in the EDor IWs, such as merely averages (or medians), or fractions staying beyonda desired threshold. Other measures that have not been mentioned requireintra-ward data, which is beyond our data granularity. Examples includethe time until triage or until a patient is first seen by an ED physician (Zel-tyn et al., 2011), the number of visits to a physician during an ED sojourn(Huang, Carmeli and Mandelbaum, 2011) and the time-ingredients of anED visit (treatment and waiting—for a resource, for synchronization or fora treatment to take its effect; see Zaied (2011) and Atar, Mandelbaum andZviran (2012)).
6.1.1. Readmissions. As already indicated in Sections 3.1 and 4.1, ourdata supports the analysis of readmissions (Mandelbaum et al., 2013). Wenow elaborate on this operational measure of performance since policy mak-ers are increasingly focusing on, as part of efforts to extend quality of caremeasures from within-hospital processes to after-hospital short-term out-comes (Medicare USA, 2013). As mentioned, the likelihood of readmissionto the hospital, within a relatively short time, is a natural indirect measurefor quality of care (similarly to first-call-resolution rates in call centers).Consequently, readmission rates are accounted for when profiling hospitals’quality and determining reimbursements for their services.
One should consider readmissions judiciously as some of them could bedue to factors outside the hospital control, or they may be an integral partof the treatment regiment. For example, returns within a few months to
imsart-ssy ver. 2013/03/06 file: Short_Patient*flow*main.tex date: June 2, 2014
40 ARMONY ET AL.
chemotherapy are typically planned and are unrelated to poor quality. Butthere are also unplanned chemotherapy returns after 1–2 weeks, which arisefrom complications after treatment. To properly incorporate readmissionsin a queueing model (such as in Yom-Tov and Mandelbaum (2014)) oneshould distinguish between these two readmission types by, for example,modeling planned (unplanned) readmissions as deterministic (stochastic)returns. Also note that readmissions should be measured in their naturaltime-scale. For example, readmission to an ED should be measured in atime scale of days-weeks, while readmissions to an IW have a natural time-scale of weeks-months.
6.1.2. Capacity and Cost of Care. Of utter importance to hospital man-agers and policy makers is hospital costing. Kaplan and Porter (2011) arguethat the mapping of patient / process flow, and the association of its activi-ties with their supporting resources, should constitute the first step in under-standing the cost of care. This is nothing but promoting a queueing-networkview for understanding and calculating cost-of-care. Indeed, (Kaplan andPorter, 2011) further submit that most hospital costs are mistakenly judgedas fixed while they ought to be viewed as variable costs; it follows thatthe corresponding resource levels are flexible, an observation that renderscontrollable most resources in a hospital.
This viewpoint naturally connects with the distinction between static anddynamic capacity, which we now explain. Capacity of a hospital or a ward iscommonly expressed in terms of the number of beds (or rooms, or physicalspace). However, it is also necessary to associate with a ward its process-ing capacity, which is determined by its human and equipment resources:nurses, physicians, support personnel, and medical apparatus. One thus dis-tinguishes between static capacity (e.g. beds) and dynamic (processing) ca-pacity of a resource. (Note that bed capacity plays the dual role of staticcapacity—capping the number of patients that can be simultaneously hos-pitalized, and dynamic capacity—serving as a proxy for the processing ca-pacity of medical personnel.). And this distinction connects back to costs inthat static capacity is thought of as fixed over the relevant horizon, hence itscost is fixed; processing capacity, on the other hand, is considered variablein that its level (and hence also cost) is flexible (controllable).
6.2. Some concluding comments on data-based research—a great oppor-tunity but no less of a challenge. The goal of the present work has beentwo-fold: first, to encourage and strengthen, through data and its EDA, thenatural link between queueing theory and its application to patient flow inhealthcare; and second, facilitate data-based learning for researchers who
imsart-ssy ver. 2013/03/06 file: Short_Patient*flow*main.tex date: June 2, 2014

PATIENT FLOW IN HOSPITALS 41
seek to reinforce this important link.While theory has been the comfort zone of Operations Research (OR) and
Applied Probability (AP), the situation dramatically differs when (big) datais brought into the picture. Fundamental changes are therefore essential—both within our OR/AP community as well as our potential healthcarepartners: changes in accessibility to healthcare data, in education (e.g. con-cerning the necessity of data-based OR research, importance and need topublish EDA, benefits of research reproducibility) and in funding priorities(e.g. for developing and sustaining the infra-structure that is a prerequisitefor a research such as the one reported here.)
But we are cautiously optimistic. Indeed, comprehensive data-collectionis becoming increasingly feasible, systematic and cheaper, for example viaReal-time Location Systems (RTLS), which will ultimately integrate withPersonal-Health and Financial Records. This will enable partnerships withproviders of healthcare services, that are based on multidisciplinary (clinical,operational, financial, psychological) tracking of complete care-paths. Also,tracking resolution and scope will be at the level of the individual patientand provider while covering the full cycle of care. The process of data-basedOR research in hospitals is thus only beginning.
REFERENCES
Aksin, O. Z., Karaesmen, F. and Ormeci, E. L. (2007). A Review of Workforce Cross-Training in Call Centers from an Operations Management Perspective. In WorkforceCross Training Handbook (D. Nembhard, ed.) CRC Press. 4.3.3
Allon, G., Deo, S. and Lin, W. (2013). Impact of Size and Occupancy of Hospitalon the Extent of Ambulance Diversion: Theory and Evidence. Operations Research 61544-562. 3.3.3
Armony, M. (2005). Dynamic Routing in Large-Scale Service Systems with Heteroge-neous Servers. Queueing Systems 51 287–329. 1
Armony, M., Chan, C. W. and Zhu, B. (2013). Critical Care in Hospitals: When toIntroduce a Step Down Unit? Working paper, Columbia University. 5.2
Armony, M. and Ward, A. (2010). Fair Dynamic Routing in Large-ScaleHeterogeneous-Server Systems. Operations Research 58 624–637. 5.5.3, 5.5.4
Armony, M., Israelit, S., Mandelbaum, A., Marmor, Y. N., Tseytlin, Y. andYom-Tov, G. B. (2013). Patient Flow in Hospitals: A Data-Based Queueing-SciencePerspective. An Extended Version (EV). 1.3, 1.4, 3.2.2, 4.2.1, 4.3.1, 4.3.4, 5.1, 2
Atar, R., Mandelbaum, A. and Zviran, A. (2012). Control of Fork-Join Networks inHeavy Traffic. Allerton Conference,. 5.2.1, 6.1
Atar, R. and Shwartz, A. (2008). Efficient Routing in Heavy Traffic under PartialSampling of Service Times. Mathematics of Operations Research 33 899–909. 1
Balasubramanian, H., Muriel, A. and Wang, L. (2012). The Impact of Flexibilityand Capacity Allocation on the Performance of Primary Care Practices. Flexible Servicesand Manufacturing Journal 24 422–447. 4.3.3
imsart-ssy ver. 2013/03/06 file: Short_Patient*flow*main.tex date: June 2, 2014

42 ARMONY ET AL.
Balasubramanian, H., Banerjee, R., Denton, B., Naessens, J., Wood, D. andStahl, J. (2010). Improving clinical access and continuity using physician panel redesign.Journal of General Internal Medicine 25 1109–1115. 4.3.3
Baron, O., Berman, O., Krass, D. and Wang, J. (2014). Using Strategic Idlenessto Improve Customer Service Experience in Service Networks. Operations Research 62123–140. 2
Batt, R. J. and Terwiesch, C. (2012). Doctors Under Load: An Empirical Study ofState Dependent Service Times in Emergency Care. Working paper. 3.2.3
Bekker, R. and de Bruin, A. M. (2010). Time-Dependent Analysis for Refused Ad-missions in Clinical Wards. Annals of Operations Research 178 45–65. 4.2
Bernstein, S. L., Verghese, V., Leung, W., Lunney, A. T. and Perez, I. (2003).Development and Validation of a New Index to Measure Emergency Department Crowd-ing. Academic Emergency Medicine 10 938–942. 3.3.2
Bertsimas, D. and Mourtzinou, G. (1997). Transient Laws of Non-stationary Queue-ing Systems and their Applications. Queueing Systems 25 115–155. 3.2.1
Brandeau, M. L., Sainfort, F. and Pierskalla, W. P., eds. (2004). OperationsResearch and Health Care: A Handbook of Methods and Applications. Kluwer AcademicPublishers, London. 2
Brown, L., Gans, N., Mandelbaum, A., Sakov, A., Shen, H., Zeltyn, S. andZhao, L. (2005). Statistical Analysis of a Telephone Call Center: A Queueing-SciencePerspective. Journal of the American Statistical Association 100 36–50. 3.3.2, 4.2.1
Burnham, K. P. and Anderson, D. R. (2002). Model Selection and Multimodal Infer-ence: a Practical Information-Theoretic Approach, 2nd Edition. Springer. 3.3.1
Burstrom, L., Nordberg, M., Ornung, G., Castren, M., Wiklund, T., En-gstrom, M. L. and Enlund, M. (2012). Physician-Led Team Triage Based on LeanPrinciples May be Superior for Efficiency and Quality? A Comparison of Three Emer-gency Departments with Different Triage Models. Scandinavian Journal Trauma, Resus-citation, and Emergency Medicine 20 20–57. 3.3.3
Canadadian-Triage, Admission of Paitents to over-capacity inpatient beds.Appendix A, http://www.calgaryhealthregion.ca/policy/docs/1451/Admission_
over-capacity_AppendixA.pdf. 3.3.2
Chalfin, D. B., Trzeciak, S., Likourezos, A., Baumann, B. M. andDellinger, R. P. (2007). Impact of Delayed Transfer of Critically Ill Patients fromthe Emergency Department to the Intensive Care Unit. Critical Care Medicine 35 1477–1483. 5.3
Chan, C., Armony, M. and Bambos, N. (2011). Fairness in Overloaded ParallelQueues. Working paper. 5.5.2
Chan, C., Farias, V. and Escobar, G. (2014). The Impact of Delays on Service Timesin the Intensive Care Unit. Working paper. 2
Chan, C., Yom-Tov, G. B. and Escobar, G. (2014). When to use Speedup: An Ex-amination of Service Systems with Returns. Operations Research 62 462?482. 2
Chao, X., Miyazawa, M. and Pinedo, M. (1999). Queueing Networks: Customers,Signals and Product Form Solutions. Wiley. 1
Chen, C., Jia, Z. and Varaiya, P. (2001). Causes and Cures of Highway Congestion.Control Systems, IEEE 21 26–33. 3.2.3
Chen, H. and Yao, D. D. (2001). Fundamentals of Queuing Networks: Performance,Asymptotics, and Optimization. Springer. 4.3
imsart-ssy ver. 2013/03/06 file: Short_Patient*flow*main.tex date: June 2, 2014

PATIENT FLOW IN HOSPITALS 43
Cooper, A. B., Litvak, E., Long, M. C. and McManus, M. L. (2001). EmergencyDepartment Diversion: Causes and Solutions. Academic Emergency Medicine 8 1108–1110. 2
de Bruin, A. M., van Rossum, A. C., Visser, M. C. and Koole, G. M. (2007).Modeling the Emergency Cardiac In-Patient Flow: An Application of Queuing Theory.Health Care Management Science 10 125–137. 2
de Bruin, A. M., Bekker, R., van Zanten, L. and Koole, G. M. (2009). Dimension-ing Hospital Wards using the Erlang Loss Model. Annals of Operations Research 17823–43. 2, 3, 4.2, 4.3.1
Denton, B. T., ed. (2013). Handbook of Healthcare Operations Management: Methodsand Applications. Springer. 2
Dobson, G., Tezcan, T. and Tilson, V. (2013). Optimal Workflow Decisions for In-vestigators in Systems with Interruptions. Management Science. Forthcoming. 3.3.3
Dong, J. and Whitt, W. (2014). On fitted birth-and-death queue models. Workingpaper, Columbia University. 3.3.1
Donoho, D. L., Maleki, A., Shahram, M., Rahman, I. U. and Stodden, V. (2009).Reproducible Research in Computational Harmonic Analysis. IEEE Computing in Sci-ence & Engineering 11 8–18. 6.2
Earnest, A., Chen, M. and Seow, E. (2006). Exploring if day and time of admissionis associated with average length of stay among inpatients from a tertiary hospital inSingapore: an analytic study based on routine admission data. BMC Health ServicesResearch 6 6. 5.6
Elkin, K. and Rozenberg, N. (2007). Patients Flow from the Emergency Departmentto the Internal Wards. IE&M project, Technion (In Hebrew). 4.1, 5.5.3
Feldman, Z., Mandelbaum, A., Massey, W. A. and Whitt, W. (2008). Staffingof Time-Varying Queues to Achieve Time-Stable Performance. Management Science 54324–338. 3.2.1
Froehle, C. M. and Magazine, M. J. (2013). Improving scheduling and flow in com-plex outpatient clinics. In Handbook of healthcare operations management: methods andapplications (B. T. Denton, ed.) 9 229–307. Springer. 2
Gans, N., Koole, G. and Mandelbaum, A. (2003). Telephone Call Centers: Tutorial,Review and Research Prospects. Manufactoring, Services and Operations Management5 79–141. 4.3
Gerla, M. and Kleinrock, L. (1980). Flow Control: A Comparative Survey. IEEETransactions on Communcations 28 553–574. 3.2.3
Green, L. (2004). Capacity Planning and Management in Hospitals. In Operations Re-search and Health Care: A Handbook of Methods and Applications (M. L. Brandeau,F. Sainfort and W. P. Pierskalla, eds.) 14–41. Kluwer Academic Publishers, London. 2
Green, L. V. (2008). Using Operations Research to Reduce Delays for Healthcare. InTutorials in Operations Research (Z.-L. Chen and S. Raghavan, eds.) 1–16. INFORMS.2
Green, L. V., Kolesar, P. J. and Whitt, W. (2007). Coping with Time-VaryingDemand When Setting Staffing Requirements for a Service System. Production and Op-erations Management 16 13–39. 2, 3.2.1, 4.2.1
Green, L. and Yankovic, N. (2011). Identifying Good Nursing Levels: A QueuingApproach. Operations Research 59 942–955. 2, 4.2.1
imsart-ssy ver. 2013/03/06 file: Short_Patient*flow*main.tex date: June 2, 2014

44 ARMONY ET AL.
Green, L., Soares, J., Giglio, J. F. and Green, R. A. (2006). Using Queuing The-ory to Increase the Effectiveness of Emergency Department Provider Staffing. AcademicEmergency Medicine 13 61–68. 3
Gurvich, I. and Perry, O. (2012). Overflow Networks: Approximations and Implica-tions to Call-Center Outsourcing. Operations Research 60 996–1009. 5.6.1
Gurvich, I. and Whitt, W. (2010). Service-Level Differentiation in Many-Server ServiceSystems via Queue-Ratio Routing. Operations Research 58 316–328. 1
Hagtvedt, R., Ferguson, M., Griffin, P., Jones, G. T. and Keskinocak, P. (2009).Cooperative Strategies To Reduce Ambulance Diversion. Proceedings of the 2009 WinterSimulation Conference 266 1085–1090. 3.3.3
Hall, R. W., ed. (2012). Handbook of Healthcare System Scheduling. Springer. 2, 2
Hall, R. W., ed. (2013). Patient Flow: Reducing Delay in Healthcare Delivery. Springer2nd edition. 2
Hall, R., Belson, D., Murali, P. and Dessouky, M. (2006). Modeling Patient FlowsThrough the Healthcare System. In Patient Flow: Reducing Delay in Healthcare Delivery(R. W. Hall, ed.) 1 1–45. Springer. 2, 3
Hoot, N. R., Zhou, C., Jones, I. and Aronsky, D. (2007). Measuring and ForecastingEmergency Department Crowding in Real Time. Annals of Emergency Medicine 49 747–755. 3.3.2
Huang, J. (2013). Patient Flow Management in Emergency Departments PhD thesis,National University of Singapore (NUS). 2.1
Huang, J., Carmeli, B. and Mandelbaum, A. (2011). Control of Patient Flow inEmergency Departments: Multiclass Queues with Feedback and Deadlines. Working pa-per. 2.1, 3.3.1, 3.3.2, 3.3.3, 6.1
Hwang, U., McCarthy, M. L., Aronsky, D., Asplin, B., Crane, P. W.,Craven, C. K., Epstein, S. K., Fee, C., Handel, D. A., Pines, J. M., Rath-lev, N. K., Schafermeyer, R. W., Zwemer, F. L. and Bernstein, S. L. (2011).Measures of Crowding in the Emergency Department: A Systematic Review. AcademicEmergency Medicine 18 527–538. 3.3.2
IHI, (2011). Patient First: Efficient Patient Flow Management Impact on theED. Institute for healthcare improvement. http://www.ihi.org/knowledge/Pages/
ImprovementStories/PatientFirstEfficientPatientFlowManagementED.aspx. 3
Janssen, A. J. E. M., van Leeuwaarden, J. S. H. and Zwart, B. (2011). RefiningSquare-Root Safety Staffing by Expanding Erlang C. Operations Research 56 1512–1522.4.3
JCAHO, (2004). JCAHO Requirement: New Leadership Standard on Managing PatientFlow for Hospitals. Joint Commission Perspectives 24 13–14. 1.1
Jennings, O. B. and de Vericourt, F. (2008). Dimensioning Large-Scale MembershipServices. Operations Research 56 173–187. 2
Jennings, O. B. and de Vericourt, F. (2011). Nurse Staffing in Medical Units: AQueueing Perspective. Operations Research 59 1320–1331. 2, 4.2.1, 4.3
Jouini, O., Dallery, Y. and Aksin, O. Z. (2009). Queueing Models for Full-FlexibleMulti-class Call Centers with Real-Time Anticipated Delays. International Journal ofProduction Economics 120 389–399. 4.3.3
Kaplan, R. S. and Porter, M. E. (2011). How to Solve the Cost Crisis in Health Care.Harvard Business Review 89 46–64. 6.1.2
imsart-ssy ver. 2013/03/06 file: Short_Patient*flow*main.tex date: June 2, 2014

PATIENT FLOW IN HOSPITALS 45
Karr, A. F. (2009). Secure Statistical Analysis of Distributed Databases, EmphasizingWhat We Don’t Know. Journal of Privacy and Confidentiality 1. http://repository.cmu.edu/jpc/vol1/iss2/5. 6.2
Kc, D. and Terwiesch, C. (2009). Impact of Workload on Service Time and PatientSafety: An Econometric Analysis of Hospital Operations. Management Science 55 1486–1498. 2, 3.2.3
Kelly, F. P. (1979). Markov Processes and Reversibility. Wiley. 3.2.2
Kim, S. H. and Whitt, W. (2014). Are Call Center and Hospital Arrivals Well Modeledby Nonhomogeneous Poisson Processes? Forthcoming at M&SOM. 3.2.1
Leite, S. C. and Fragoso, M. D. (2013). Diffusion Approximation for SignalingStochastic Networks. Stochastic Processes and their Applications 123 2957–2982. 5.2.1
Long, E. F. and Mathews, K. M. (2012). “Patients Without Patience”: A PriorityQueuing Simulation Model of the Intensive Care Unit. Working paper. 5.3, 5.6.1
Maa, J. (2011). The Waits that Matter. The New England Journal of Medicine. 5.3
Maman, S. (2009). Uncertainty in the Demand for Service: The Case of Call Centersand Emergency Departments. Master’s thesis, Technion—Israel Institute of Technology.2.1, 3.2.1
Maman, S., Zeltyn, S. and Mandelbaum, A. (2011). Uncertainty in the Demand forService: The Case of Call Centers and Emergency Departments. Working paper. 2.1
Mandelbaum, A., Momcilovic, P. and Tseytlin, Y. (2012). On Fair Routing FromEmergency Departments to Hospital Wards: QED Queues with Heterogeneous Servers.Management Science 58 1273–1291. 2.1, 4.2.1, 5.5.1, 5.5.3, 5.5.4, 5.6.1
Mandelbaum, A. and Stolyar, S. (2004). Scheduling Flexible Servers with ConvexDelay Costs: Heavy-Traffic Optimality of the Generalized cµ-Rule. Operations Research52 836–855. 1
Mandelbaum, A., Trofimov, V., Gavako, I. and Nadjhahrov, E. (2013). Home-Hospital (Rambam): Readmission Analysis. http://seeserver.iem.technion.ac.il/
databases/Docs/HomeHospital_visits_return.pdf. 6.1.1
Marmor, Y. N. (2003). Developing a Simulation Tool for Analyzing Emergency De-partment Performance. Master’s thesis, Technion—Israel Institute of Technology. 1.3
Marmor, Y. N. (2010). Emergency-Departments Simulation in Support of Service-Engineering: Staffing, Design, and Real-Time Tracking. PhD thesis, Technion—IsraelInstitute of Technology. 2.1
Marmor, Y. N., Golany, B., Israelit, S. and Mandelbaum, A. (2012). Design-ing Patient Flow in Emergency Departments. IIE Transactions on Healthcare SystemsEngineering 2 233–247. 2.1, 3.3.1, 3.3.3
Marmor, Y. N., Rohleder, T., Cook, D., Huschka, T. and Thompson, J. (2013).Recovery bed planning in cardiovascular surgery: a simulation case study. Health CareManagement Science 16 314–327. 3.2.3
McHugh, M., Van Dyke, K., McClelland, M. and Moss, D. (2011). Improv-ing Patient Flow and Reducing Emergency Department Crowding. Agency for health-care research and quality. http://www.ahrq.gov/research/findings/final-reports/ptflow/index.html. 3
Medicare USA, (2013). Hospital Compare: 30-Day Death and Readmission MeasuresData. http://www.medicare.gov/HospitalCompare/Data/RCD/30-day-measures.aspx.6.1.1
imsart-ssy ver. 2013/03/06 file: Short_Patient*flow*main.tex date: June 2, 2014
46 ARMONY ET AL.
Nadjhahrov, E., Trofimov, V., Gavako, I. and Mandelbaum, A. (2013). Home-Hospital (Rambam): EDA via SEEStat 3.0 to Reproduce “On Patients Flow inHospitals”. http://ie.technion.ac.il/Labs/Serveng/files/HHD/reproducing_flow_paper.pdf. 6.2, 6.2
Nestler, S. (2011). Reproducible (Operations) Research: A Primer on ReproducibleResearch and Why the O.R. Community Should Care About it. ORMS Today 38. 6.2
Nguyen, V. (1994). The Trouble with Diversity: Fork-Join Networks with HeterogeneousCustomer Population. The Annals of Applied Probability 1–25. 5.2.1
Oredsson, S., Jonsson, H., Rognes, J., Lind, L., Goransson, K. E., Ehren-berg, A., Asplund, K., Castren, M. and Farrohknia, N. (2011). A SystematicReview of Triage-Related Interventions to Improve Patient Flow in Emergency Depart-ments. Scandinavian Journal Trauma, Resuscitation, and Emergency Medicine July 1919–43. 3.3.3
Plonski, O., Efrat, D., Dorban, A., David, N., Gologorsky, M., Zaied, I., Man-delbaum, A. and Rafaeli, A. (2013). Fairness in Patient Routing: Maternity Ward inRambam Hospital. Technical report. 4.2.1, 5.5.4
Ramakrishnan, M., Sier, D. and Taylor, P. G. (2005). A Two-Time-Scale Model forHospital Patient Flow. IMA Journal of Management Mathematics 16 197–215. 5.6.1
Rambam, Rambam Health Care Campus, Haifa, Israel. http://www.rambam.org.il/Home+Page/. 1.2
RambamData, Rambam Hospital data repositories. Technion SEELab, http://
seeserver.iem.technion.ac.il/databases/. 6.2, 6.2
Saghafian, S., Austin, G. and Traub, S. J. (2014). Operations research contribu-tions to emergency department patient flow optimization: review and research prospects.Working paper. 3
SEELab, SEE Lab, Technion—Israel Institute of Technology. http://ie.technion.
ac.il/Labs/Serveng/. 1, 1, 6.2, 6.2
SEEServer, Server of the Center for Service Enterprise Engineering. http://
seeserver.iem.technion.ac.il/see-terminal/. 6.2
SEEStat, SEEStat documentation, Technion—Israel Institute of Technology. http:
//ie.technion.ac.il/Labs/Serveng/. 1, 6.2, 6.2
Shi, P., Chou, M. C., Dai, J. G., Ding, D. and Sim, J. (2012). Hopital InpatientOperations: Mathematical Models and Managerial Insights. Working paper. 1.3, 2, 4.2,4.2.1, 5.6.1
Stolyar, S. (2005). Optimal Routing in Output-Queued Flexible Server Systems. Prob-ability in the Engineering and Informational Sciences 19 141–189. 1, 1
Sullivan, S. E. and Baghat, R. S. (1992). Organizational Stress, Job Satisfaction,and Job Performance: Where Do We Go from Here? Journal of Management 18 353–375. 3.2.3
Sun, J. (2006). The Statistical Analysis of Interval-Censored Failure Time Data.Springer. 3.3.2
Tezcan, T. (2008). Optimal Control of Distributed Parallel Server Systems under theHalfin and Whitt Regime. Math of Operations Research 33 51–90. 1
Thompson, S., Nunez, M., Garfinkel, R. and Dean, M. D. (2009). Efficient Short-Term Allocation and Reallocation of Patients to Floors of a Hospital During DemandSurges. Operations Research 57 261–273. 5.5.2
imsart-ssy ver. 2013/03/06 file: Short_Patient*flow*main.tex date: June 2, 2014

PATIENT FLOW IN HOSPITALS 47
Thorin, O. (1977). On the Infinite Divisibility of the Lognormal Distribution. Scandi-navian Actuarial Journal 1977 121–148. 4.2.1
Tseytlin, Y. (2009). Queueing Systems with Heterogeneous Servers: On Fair Routingof Patients in Emergency Departments. Master’s thesis, Technion—Israel Institute ofTechnology. 1.3, 2.1
Tseytlin, Y. and Zviran, A. (2008). Simulation of Patients Routing from an Emer-gency Department to Internal Wards in Rambam Hospital. OR Graduate Project, IE&M,Technion. 1, 5.5.3, 5.5.4
Tukey, J. W. (1977). Exploratory Data Analysis. Addison Wesley. 1.3
Ward, A. and Armony, M. (2013). Blind Fair Routing in Large-Scale Service Systemswith Heterogeneous Customers and Servers. Operations Research 61 228–243. 5.5.4
Whitt, W. (2012). Fitting Birth-and-Death Queueing Models to Data. Statistics andProbability Letters 82 998–1004. 3.2.2, 3.3.1
Yom-Tov, G. B. (2010). Queues in Hospitals: Queueing Networks with ReEnteringCustomers in the QED Regime. PhD thesis, Technion—Israel Institute of Technology.2.1, 4.2.1
Yom-Tov, G. B. and Mandelbaum, A. (2014). Erlang-R: A Time-Varying Queue withReentrant Customers, in Support of Healthcare Staffing. M&SOM 16 283–299. 2.1,3.2.1, 3.2.2, 3.3.1, 3.3.3, 4.3, 6.1.1
Zacharias, C. and Armony, M. (2013). Joint Panel Sizing and Appointment Schedulingin Outpatient Care. Working paper. 5.6.1
Zaied, I. (2011). The Offered Load in Fork-Join Networks: Calculations and Applica-tions to Service Engineering of Emergency Department Master’s thesis, Technion—IsraelInstitute of Technology. 5.6.1, 6.1
Zalenski, R. J., Rydman, R. J., Ting, S., Kampe, L. and Selker, H. P. (1998).A National Survey of Emergency Department Chest Pain Centers in the United States.The American Journal of Cardiology 81 1305–1309. 3.3.3
Zeltyn, S., Marmor, Y. N., Mandelbaum, A., Carmeli, B., Greenshpan, O.,Mesika, Y., Wasserkrug, S., Vortman, P., Schwartz, D., Moskovitch, K.,Tzafrir, S., Basis, F., Shtub, A. and Lauterman, T. (2011). Simulation-Based Mod-els of Emergency Departments: Real-Time Control, Operations Planning and ScenarioAnalysis. Transactions on Modeling and Computer Simulation (TOMACS) 21. 2.1, 3,3.3.1, 3.3.3, 6.1
Acknowledgements. We dedicate our paper to the memory of the lateDavid Sinreich. As a professor at the Technion IE&M, David was a pioneerand an example-to-follow, in acknowledging the necessity and importanceof data- and simulation-based research in healthcare. In particular, the EDdata collection that he orchestrated in 8 Israeli hospitals served as a proof-of-feasibility for our EDA.
Our research, and its seed financial backing, started within the OCR(Open Collaborative Research) Project, funded by IBM and led jointly byIBM Haifa Research (headed by Oded Cohn), Rambam Hospital (DirectorRafi Beyar) and Technion IE&M Faculty (Former Dean Boaz Golany).
imsart-ssy ver. 2013/03/06 file: Short_Patient*flow*main.tex date: June 2, 2014

48 ARMONY ET AL.
Data analysis, maintenance of data repositories, and continuous adviceand support have been cheerfully provided by the Technion SEE Laboratoryand its affiliates: Valery Trofimov, Igor Gavako, Ella Nadjharov, ShimritMaman, Katya Kutsy, Nitzan Carmeli, and Arik Senderovic.
The authors, and the research presented here, owe a great deal to manyadditional individuals and institutions. This long list, which we can here ac-knowledge only in part, clearly must start with our host Rambam hospital—its capable management, dedicated nursing staff and physicians, and espe-cially: Rafi Beyar, Rambam Director and CEO, who invited us at the outsetto “use” the healthcare campus as our research laboratory; we gladly ac-cepted the invitation, and have been since accompanied and advised byZaher Azzam (Head of Rambam Internal Ward B), Sara Tzafrir (Head ofRambam Information Systems), and the OCR steering committee: HanaAdami (Head of Rambam Nursing), Yaron Barel (Rambam VP for Oper-ations), Boaz Carmeli (IBM Research), Fuad Basis (Rambam ED), DannyGopher (Technion IE&M), Avi Shtub (Technion IE&M), Segev Wasserkrug(IBM Research), Amir Weiman (Head of Rambam Accounting) and PninaVortman (IBM Research).
We are thankful to Technion students Kosta Elkin, Noga Rozenberg andAsaf Zviran: their projects and cooperation helped us analyze the ED-to-IWs process.
Financially, the research of YM, GY and YT was supported by graduatefellowships from Technion’s Graduate School and the Israel National Insti-tute for Health Services and Health Policy Research. The joint research ofMA and AM was funded by BSF (Bi-national Science Foundation) Grants2005175/2008480. AM was partially supported by ISF Grant 1357/08 andby the Technion funds for promotion of research and sponsored research.MA was partially funded by the Lady Davis Fellowship as a visitor at theTechnion IE&M faculty.
Some of AM’s research was funded by and carried out while visiting theStatistics and Applied Mathematical Sciences Institute (SAMSI) of the NSF;the Department of Statistics and Operations Research (STOR), the Uni-versity of North Carolina at Chapel Hill; the Department of Information,Operations and Management Sciences (IOMS), Leonard N. Stern Schoolof Business, New York University; and the Department of Statistics, TheWharton School, University of Pennsylvania – the hospitality of all theseinstitutions is acknowledged and truly appreciated.
Our paper greatly benefited from feedback by colleagues and a thoroughand insightful refereeing process. Ward Whitt discovered a flaw in our em-pirical analysis that led to the rewriting of the ED section. Jim Dai read
imsart-ssy ver. 2013/03/06 file: Short_Patient*flow*main.tex date: June 2, 2014

PATIENT FLOW IN HOSPITALS 49
carefully the first version and provided significant and helpful editorial feed-back. Last but certainly not least, we are grateful to the editor of Stochas-tic Systems, Peter Glynn, for leading and guiding us patiently and safelythrough the revision process.
Appendix 1: A framework for OR/AP data-based research. Thetraditional still prevalent model for data-based OR/AP research has beenone where an individual researcher, or a small group, obtains and analyzesdata for the sake of an isolated research project. Our experience is that such amodel cannot address today’s empirical needs. For example, hospital data istypically large, complex, contaminated and incomplete, which calls for a pro-fessional inevitably time-consuming treatment. Next, using data in a singleproject, or a few for that matter, is wasteful—on the other hand, data-reuseand sharing, across student generations or research groups, requires infras-tructure, documentation, maintenance and coordination. Finally, healthcaredata is often confidential and proprietary, and that prevents reproducibilityand slows down progress.
Towards a culture of reproducible research in empirical OR/AP. Data-based OR/AP research must strive for reproducibility of research outcomes—a fundamental principle in the traditional sciences. Reproducibility enablesscrutiny of analysis and recommendations. This yields credibility and trust,which is an absolute prerequisite for influencing hospital practices.
Reproducible (Operations) Research is discussed in Nestler (2011), whichis also a source for additional references and links. There have been some sys-tematic attempts to establish a reproducibility culture in research (Donohoet al., 2009). It ought to start with funding agencies and journal policies: e.g.the Editorial Statement of the Finance Department in Management Sciencereads: “Authors of empirical and quantitative papers should provide or makeavailable enough information and data so that the results are reproducible.”It can advance with research such as Karr (2009), that aims at statisticalanalysis of distributed (unsharable) databases (e.g. hospital data); it willideally culminate in a multitude of research labs, each providing free accessto its data and serving its own research community and beyond.
A feasible model. A model for such a lab is the Technion SEELab, wherereaders can access RambamData. Little effort will be then required to re-produce our present EDA and going beyond it. In fact, most of our figureswere created by SEEStat—a SEELab-developed user-friendly platform foronline (real-time) EDA—and readers can recreate this process by followingNadjhahrov et al. (2013).
imsart-ssy ver. 2013/03/06 file: Short_Patient*flow*main.tex date: June 2, 2014

50 ARMONY ET AL.
Appendix 2: Accessing data repositories and EDA tools at theSEELab. SEELab is a data-based research laboratory, residing at theIE&M Faculty of the Technion in Haifa, Israel. (SEE stands for “ServiceEnterprise Engineering”.) SEELab maintains a repository for transaction-level operational data (log-files) from large service operations. This data iscollected and cleaned, thus preparing it for research and teaching. Currently,SEELab databases include call-by-call multi-year data from 4 call centers,an internet academic website, 8 emergency departments (mainly their ar-rivals data) and 4 years of data from the Rambam Hospital—the latter isthe empirical foundation for the present paper.
The EDA environment of SEELab is SEEStat—a software platform thatenables real-time statistical analysis of service data at seconds-to-monthstime resolutions. SEEStat was used to create most of our figures. It imple-ments many statistical algorithms: parametric distribution fitting and selec-tion, fitting of distribution mixtures, survival analysis and more—with allalgorithms interacting seamlessly with all the databases. SEEStat also inter-acts with SEEGraph, a pilot-environment for structure-mining, on-demandcreation, display and animation of data-based process maps (e.g. Figure 1,and the animation of its underlying data).
Three SEELab data-bases are publicly accessible at the SEELab serverSEEServer: two from call centers and one from the Rambam hospital. Forexample, data from a U.S. banking call center covers the operational his-tory of close to 220 million calls, over close to 3 years; 40 million of thesecalls were served by (up to 1000) agents and the rest by a VRU (answeringmachine). The Rambam data is described in §1.2. Our analysis of the cur-rent data greatly benefitted from our call-center experience. Moreover, thecompleteness of call-center data provides an ideal to strive for, with the typ-ically partial hospital data - this gap is now narrowing with the increasingprevalence of real-time locating systems (RTLS) data.
SEEStat Online: The connection protocol to SEEStat, for any research orteaching purpose, is simply as follows: go to the SEELab webpagehttp://ie.technion.ac.il/Labs/Serveng;then proceed, either via the link SEEStat Online, or directly throughhttp://seeserver.iem.technion.ac.il/see-terminal, and complete theregistration procedure. Within a day or so, you will receive a confirma-tion of your registration, plus a password that allows you access to SEE-Stat, SEELab’s EDA environment, and via SEEStat to the above-mentioneddatabases. Note that your confirmation email includes two attachments: atrouble-shooting document and a self-taught tutorial that is based on call
imsart-ssy ver. 2013/03/06 file: Short_Patient*flow*main.tex date: June 2, 2014

PATIENT FLOW IN HOSPITALS 51
center data and the Rambam hospital data. We propose that you print outthe tutorial, connect to SEEStat and then let the tutorial guide you, hands-on, through SEEStat basics—this should take no more than 1.5 hours.
On data cleaning and maintenance. There were plenty of records thatwere flawed due to archiving or simply system errors. These were identifiedvia their inconsistency with trustable data and hence corrected or removed.But more challenging was the identification of records that had been includedin the data due to some regulations, rather than physical transactions. Forexample, some unreasonable workload profiles led to the discovery of a highfraction of “transfers” from the ED to a virtual ward, all occurring preciselyat 11:59pm; subsequent analysis managed to associate each of these transferswith a physical transfer, from the ED to some actual ward on the followingday. The reason for the inclusion of such virtual transfers was financial,having to do with regulations of insurance reimbursement. And this is justthe tip of the iceberg.
Reproducing our EDA and beyond. Rambam data is publicly available,either for downloading (RambamData consists of records per individual cus-tomers) or through SEEStat, as discribed above. The download link includesdata documentation. To facilitate reproducibility, the document Nadjhahrovet al. (2013) provides a detailed description of the creation process of ourEDA, which includes all figures (except for Figure 12) in the present paper.
Mor ArmonyStern School of Business, NYU44 West 4th StreetNew York, NY 10012E-mail: [email protected]
Shlomo IsraelitDirector, Emergency Trauma DepartmentRambam Health Care Campus (RHCC)6 Ha’Aliya StreetHaifa, Israel 31096E-mail: s [email protected]
Avishai MandelbaumFaculty of Industrial Engineering and ManagementTechnion—Israel Institute of TechnologyTechnion city, Haifa, Israel, 32000E-mail: [email protected]
Yariv N. MarmorDepartment of Industrial Engineering and ManagementORT Braude CollegeKarmiel, IsraelHealth Care Policy and Research DepartmentMayo Clinic200 First Street SWRochester, MN, USA, 55905E-mail: [email protected]
Yulia TseytlinIBM Haifa Research LabHaifa University CampusMount Carmel, Haifa, Israel, 31905E-mail: [email protected]
Galit B. Yom-TovFaculty of Industrial Engineering and ManagementTechnion—Israel Institute of TechnologyTechnion city, Haifa, Israel, 32000E-mail: [email protected]
imsart-ssy ver. 2013/03/06 file: Short_Patient*flow*main.tex date: June 2, 2014