on normative study of selected physical fitness components ... · pdf fileselected physical...
TRANSCRIPT

Final report
Of Minor Research Project
(Ref. NO.23-2490/10(WRO) dated 11/05/2011)
On
“Normative Study of Selected Physical Fitness Components of School Going Children Aged
from 7 to 13 Years”
In The Faculty of Physical Education
Submitted To
University Grant commission (WRO) Pune
By
Dr. Makarand Joshi Asst. Professor of Physical Education
M.S.M.’s. College of Physical Education, Aurangabad, Maharashtra, India.
February, 2014

DECLARATION
I hereby declare that the present work completed in the form
of Minor Research Project entitled, “Normative Study of
Selected Physical Fitness Components of School Going
Children Aged from 7 to 13 Years” is an original work and
has not been submitted, or published in any form for the
fulfillment of any other degree or any other similar to this or
any other university.
Dr. Makarand S. Joshi, PRINCIPAL Asst. Professor of Physical Education MSM’s College of Physical Education, Aurangabad, Maharashtra, India. Place: Aurangabad, Date: /02/2014
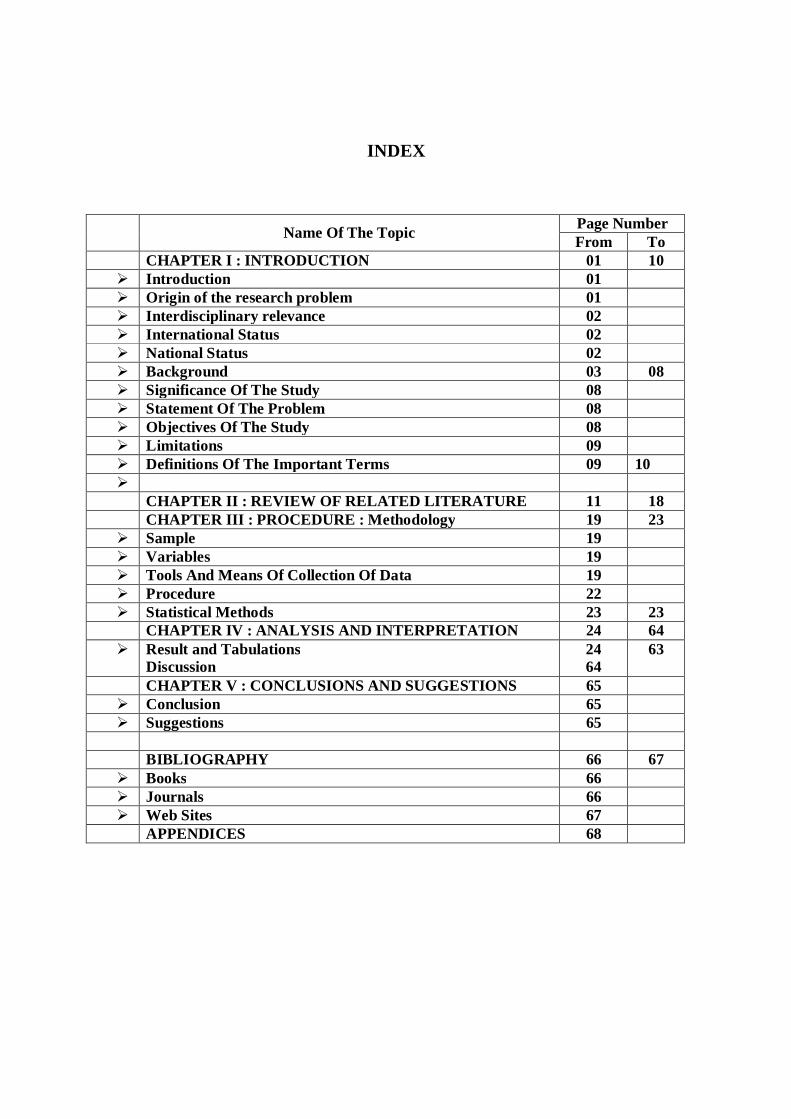
INDEX
Name Of The Topic Page Number From To
CHAPTER I : INTRODUCTION 01 10 Introduction 01 Origin of the research problem 01 Interdisciplinary relevance 02 International Status 02 National Status 02 Background 03 08 Significance Of The Study 08 Statement Of The Problem 08 Objectives Of The Study 08 Limitations 09 Definitions Of The Important Terms 09 10 CHAPTER II : REVIEW OF RELATED LITERATURE 11 18 CHAPTER III : PROCEDURE : Methodology 19 23 Sample 19 Variables 19 Tools And Means Of Collection Of Data 19 Procedure 22 Statistical Methods 23 23 CHAPTER IV : ANALYSIS AND INTERPRETATION 24 64 Result and Tabulations
Discussion 24 64
63
CHAPTER V : CONCLUSIONS AND SUGGESTIONS 65 Conclusion 65 Suggestions 65 BIBLIOGRAPHY 66 67 Books 66 Journals 66 Web Sites 67 APPENDICES 68

List of Tables
Table No. Content Page
No.
1 The mean values of physical fitness components of 7 to 9 years boys and girls. 25
2 Percentile scale of six different fitness test of 07 years boys 26 3 Percentile scale of six different fitness test of 07 years girls 26 4 Percentile scale of six different fitness test of 08 years boys 27 5 Percentile scale of six different fitness test of 08 years girls 27 6 Percentile scale of six different fitness test of 09 years boys 27 7 Percentile scale of six different fitness test of 09 years girls 28
8
Mean and SD of Physical fitness component of 10 to 12 years boys and girls
28
9 Mean and SD of Physical fitness component of 10 to 12 years boys and girls
29
10 The percentile values of 30M.Dash for different age group of boys 31 11 The percentile values of Standing Broad Jump for different age group
of boys 32
12 The percentile values of Flex Arm hang/Chin ups for different age group of boys
33
13 The percentile values of Ping-Pong test for different age group of boys 34 14 The percentile values of Ball throw and catch for different age group of
boys 35
15 The percentile values of Stork Stand/ balance for different age group of boys
36
16 The percentile values of 30M.Dash for different age group of girls 37 17 The percentile values of Standing Broad jump for different age group
of girls 38
18 The percentile values of Flex Arm Hang for different age group of girls 39 19 The percentile values of 20M. Ping-Pong Test for different age group
of girls 40
20 The percentile values of Ball throw and Catch for different age group of girls
41
21 The percentile values of Stork Stand /Balance for different age group of boys
42
22 Descriptive Analysis and Co-relations of 30M.Dash test of 7 to 9 years 43
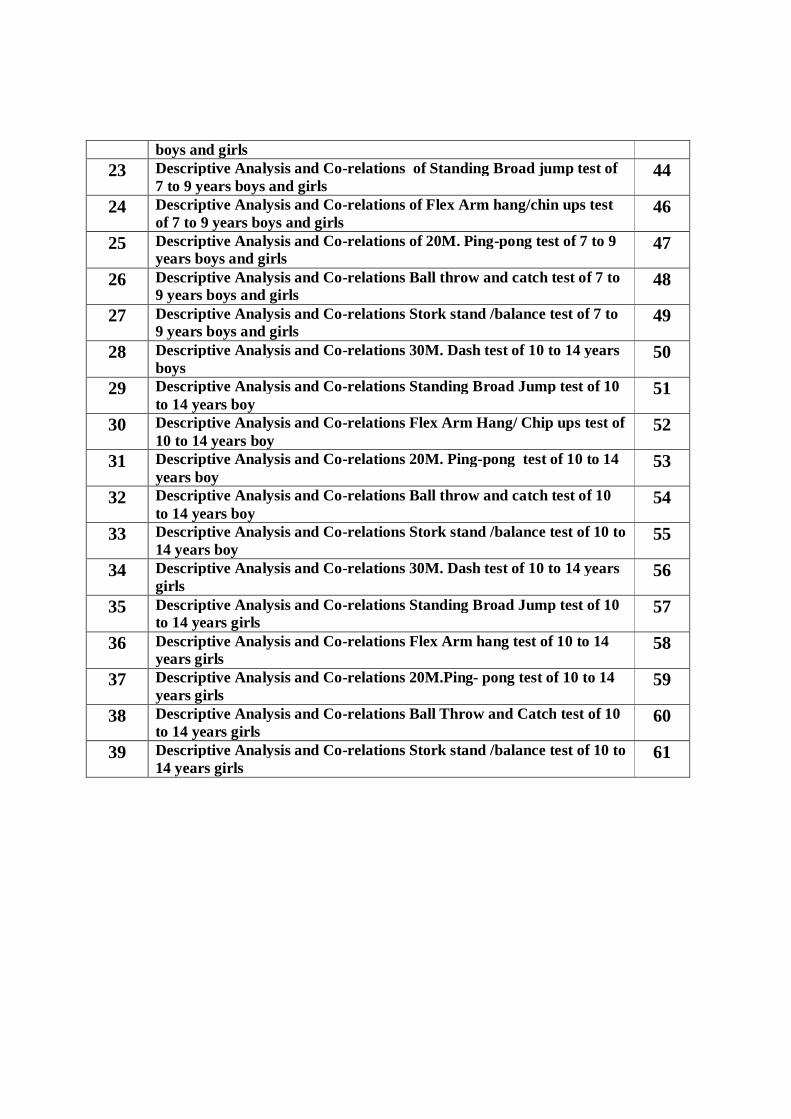
boys and girls 23 Descriptive Analysis and Co-relations of Standing Broad jump test of
7 to 9 years boys and girls 44
24 Descriptive Analysis and Co-relations of Flex Arm hang/chin ups test of 7 to 9 years boys and girls
46
25 Descriptive Analysis and Co-relations of 20M. Ping-pong test of 7 to 9 years boys and girls
47
26 Descriptive Analysis and Co-relations Ball throw and catch test of 7 to 9 years boys and girls
48
27 Descriptive Analysis and Co-relations Stork stand /balance test of 7 to 9 years boys and girls
49
28 Descriptive Analysis and Co-relations 30M. Dash test of 10 to 14 years boys
50
29 Descriptive Analysis and Co-relations Standing Broad Jump test of 10 to 14 years boy
51
30 Descriptive Analysis and Co-relations Flex Arm Hang/ Chip ups test of 10 to 14 years boy
52
31 Descriptive Analysis and Co-relations 20M. Ping-pong test of 10 to 14 years boy
53
32 Descriptive Analysis and Co-relations Ball throw and catch test of 10 to 14 years boy
54
33 Descriptive Analysis and Co-relations Stork stand /balance test of 10 to 14 years boy
55
34 Descriptive Analysis and Co-relations 30M. Dash test of 10 to 14 years girls
56
35 Descriptive Analysis and Co-relations Standing Broad Jump test of 10 to 14 years girls
57
36 Descriptive Analysis and Co-relations Flex Arm hang test of 10 to 14 years girls
58
37 Descriptive Analysis and Co-relations 20M.Ping- pong test of 10 to 14 years girls
59
38 Descriptive Analysis and Co-relations Ball Throw and Catch test of 10 to 14 years girls
60
39 Descriptive Analysis and Co-relations Stork stand /balance test of 10 to 14 years girls
61

NORMATIVE STUDY OF SELECTED PHYSICAL FITNESS COMPONENTS OF SCHOOL GOING CHILDREN BETWEEN 7
TO 13 YEARS
(i) Introduction:
Origin of the research problem:
The norms are prepared by the researchers in various fields of sports for evaluating the
standards by administering standardized tests. Motor abilities are one of the perquisites of
performance and here the research scholar is in pursuit to prepare the norms for selected physical
fitness components of the children between 7 to 13 years. The need to prepare the norms aroused
from the differences observed in growth and development with respect to geographical locations.
Aurangabad is one of the district place located on the 19.53 latitude and 75.23 longitudes
towards the central part of Marathwada region of Maharashtra, is one of the upcoming districts
of Maharashtra in Industrialization. The sports and physical education culture is witnessed right
from the post independence period and is still consistent.
The growth and development difference according to geographical location is
mismatching the already established norms to certain extent and hence the origin of the research
problem to establish local norms in physical fitness components so that exact growth and
development is interpreted. The norms may definitely help the local trainers, coaches, physical
education teachers to assess the level of physical fitness of their students in turn helping them to
channelize the potential according to the requirements of the sport.
Interdisciplinary relevance:
The established norms may surely help the educationalist to interpret and assess the
overall development of an individual. The age group norms will help the parents to keep a note
about their child and accordingly nutrition and other requirements may be provided at proper
time. The field of pediatric medicine may also get benefit of the norms which provides one of the
aspects of physical development at local level and according to geographical location.
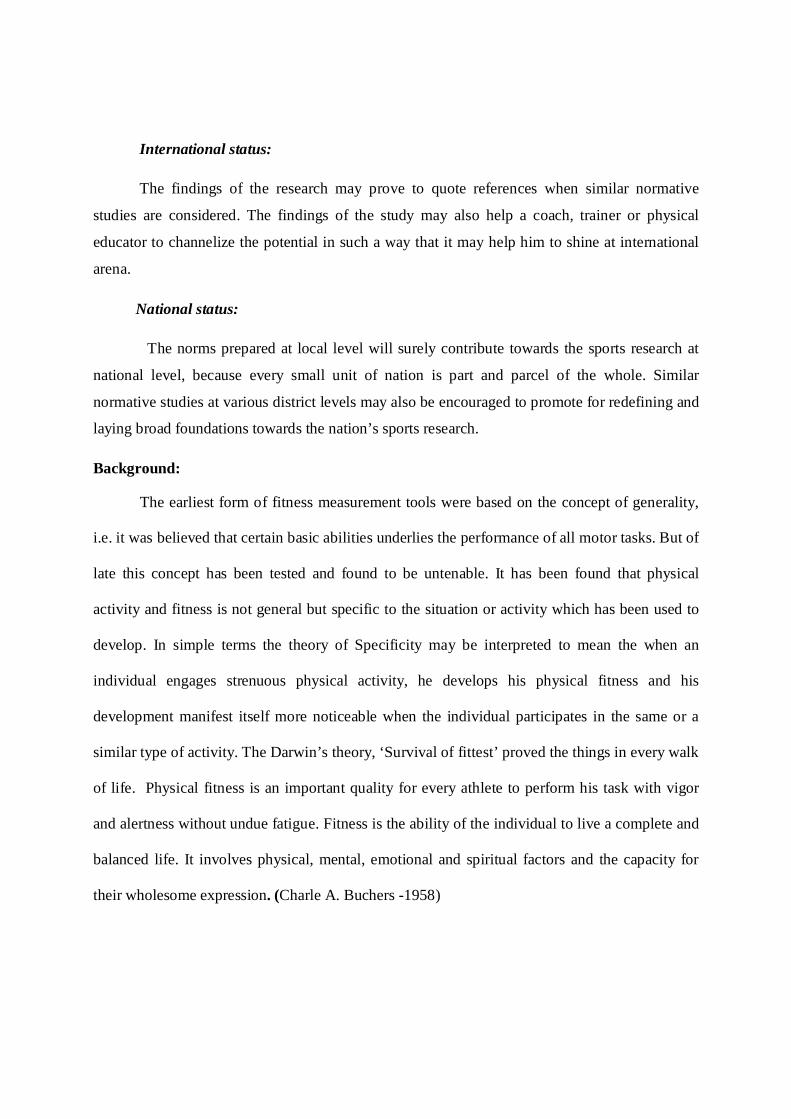
International status:
The findings of the research may prove to quote references when similar normative
studies are considered. The findings of the study may also help a coach, trainer or physical
educator to channelize the potential in such a way that it may help him to shine at international
arena.
National status:
The norms prepared at local level will surely contribute towards the sports research at
national level, because every small unit of nation is part and parcel of the whole. Similar
normative studies at various district levels may also be encouraged to promote for redefining and
laying broad foundations towards the nation’s sports research.
Background:
The earliest form of fitness measurement tools were based on the concept of generality,
i.e. it was believed that certain basic abilities underlies the performance of all motor tasks. But of
late this concept has been tested and found to be untenable. It has been found that physical
activity and fitness is not general but specific to the situation or activity which has been used to
develop. In simple terms the theory of Specificity may be interpreted to mean the when an
individual engages strenuous physical activity, he develops his physical fitness and his
development manifest itself more noticeable when the individual participates in the same or a
similar type of activity. The Darwin’s theory, ‘Survival of fittest’ proved the things in every walk
of life. Physical fitness is an important quality for every athlete to perform his task with vigor
and alertness without undue fatigue. Fitness is the ability of the individual to live a complete and
balanced life. It involves physical, mental, emotional and spiritual factors and the capacity for
their wholesome expression. (Charle A. Buchers -1958)
There are four basic components of the physical fitness:
1. Muscular fitness.
2. Flexibility fitness.
3. Aerobic fitness,
4. Body composition fitness. (Gide 1973)
Human being existence and effectiveness depend upon his Muscles. Muscular efficiency
including strength and endurance is essential to every individual and needs vigorous exercise for
growth and development. A muscle must be overload in order to be strengthened. If not it will
become weak and degenerate. It is a biological principle that function builds structure and
structure decides function (Peter V. Karpouich 1965). It is true that organs and muscles that are
used will develop and those that are not used will disappear. Human being needs a stronger body
than he has had, not only for specific tasks but to enable him to sustain the strain and stress of
living. Strength has become an important trait for an athlete to perform his task in the athletic
field. The value of strength in athletics is not a new idea. Hooks States “the good strong man will
always beat the good weak management (Hooks 1974). Strength is properly defined as maximal
force exerted at one time (Perry john son, 1971). By working the muscles at near its maximum
capacity against some resistance will develop the strength of the muscle. Strength is considered
as an important factor for all motor ability. (John Patrice al, 1959)
Physical fitness has been defined as a set of attributes or characteristics that people have or
achieve that relates to the ability to perform physical activity. The above definition is taken from
Physical Activity and Health: (A Report of the Surgeon General is the most common currently
used definition of physical fitness). Howley and Frank define fitness that provides additional
descriptive information is: Physical fitness is a state of well-being with low risk of premature
health problems and energy to participate in a variety of physical activities; most experts agree
that physical fitness is both multidimensional and hierarchical. In earlier, fitness was commonly
defined as the capacity to carry out the day’s activities without undue fatigue. However, as
automation increased leisure time, changes in lifestyles following the industrial revolution
rendered this definition insufficient. In current contexts, physical fitness is considered a measure
of the body’s ability to function efficiently and effectively in work and leisure activities, to
be healthy, to resist hypo kinetic diseases, and to meet emergency situation.
It has been seen that, we talk a lot about essential of physical fitness but we hardly
participate in physical activities. Therefore the researcher has made an attempt to find out some
physical fitness components level and established norms according to their age among the 7 to
13 years boys and girls. Also find out a relationship between ages and physical fitness
components of school going children.
Significance of the study:
1. The findings of the research may prove fruitful to the trainers, coaches and physical
educators at local level.
2. The growth and development and few physical components may be compared with
national status to assess our school going children.
3. The norms may help to divert and develop the children according to their potential.
(iii) Objectives:
1. To gather the test results in speed ability of the school going children between 7 to 13
years by administering standards tests.
2. To gather large data of endurance ability of the school going children between 7 to 13
years by administering standardized tests.
3. To gather large data on lower extremities explosive strength of the school going children
between 7 to 13 years by administering standardized tests.
4. To gather large data on strength endurance in upper extremity on the school going
children between 7 to 13 years by administering standardized tests.
5. To gather large data on coordinative ability of the school going children between 7 to 13
years by administering standardized tests.
6. To gather large data on balancing ability of the school going children between 7 to 13
years in administering standardized tests.
7. To prepare norms of the speed ability, endurance, lower extremity explosive strength,
strength in upper extremity, coordinative abilities and balancing ability from the data
collected by treating statistically.
8. Fitness measurements were executed by qualified testers of MSM college of Physical
Education, Aurangabad. The fitness data was used to generate normative tables by gender
and age group, so that people could compare their fitness performance with the overall
profile on their own.
9. To prepare age, sex wise norms, and co-relation matrix of selected physical fitness
components of school going children between 7 to 13 years.
10. According to the findings, suggestions concerning education and related supporting
policies were provided so as to raise Indian school going children’s physical fitness
component level and general fitness profile.

Methodology:-
The methodology for said study was used descriptive survey.
Sample:
The samples will be the school going boys and girls between 7 to 13 years of age from
different schools within the vicinity of the Aurangabad district jurisdiction. Around 10,000
children will be randomly selected for the standardized tests in few physical abilities.
Variables:
1. Independent Variables: Standardized tests related to physical fitness components.
2. Dependent Variables: Physical fitness components viz. Strength Endurance in upper
extremity, explosive strength in lower extremity, endurance, balancing ability, eye
hand coordination, and flexibility.
3. Intervening Variables: - Age, sex, and class.
Tools and Means:
Personal data bank: It was used to collect the information of an individual. Personal
data bank consists of the following aspect: Full name, name and address of the school, date of
birth and age, gender, class.
Standardized Physical Fitness Tests: (1) 30 meters dash for evaluating speed ability;
(2) Canadian fit test for endurance (VO2 max); (3) Standing broad jump for lower extremity
explosive strength; (4) Flex arm hang for girls and Chin-ups for boys to assess upper extremities
strength endurance; (5) Ball throw and catch for eye-hand coordination; (6) Stork stand for
balancing ability.
30 meters dash test:- Objective: To measure speed. Age: Ages six to seventeen.
Sex: Satisfactory to both boys & girls. Equipments: Stop watch, Suitable running area allows to 30 m. run plus extension for stopping is also required.
Test Administration: It is advised that one or two subjects run at the same time. Start from a standing position on starting line. The commands, “Ready? And “Go” are given. At the command to go the starter drops his arm so that the timer at the finish line can start the timing. The subjects run as fast as possible across the finishing line.
Scoring: Consider the elapsed time from the starting signal until the runner crosses the finishing line is measured to the two digits of second. Canadian fit test for endurance (VO2 max), or 20m. Shuttle run. Objective: T o measure endurance ((VO2 max). Age: Six to sixty. (In a medically fit condition) Sex: Suitable for both sexes. Equipments: i) a 20M. Area with markings on the ground.
ii) A cassette player.
iii) A 20M. Shuttle run audio cassette.
iv) Paper, pencil, etc.
Administration of test: This is very simple test used and recognized internationally and introduced in India by Armed force Sports Medicine centre, Pune. Just by means of simple Audio Cassette and a tape recorder, one can determine the (VO2 max) endurance of an athlete and identify real talent with better VO2 max. capacity amongst many participants. Simplicity of this test facilitates many people to be tested in a very short time. The test as such involves jogging and running at progressively increasing pace, over a 20mtrs. Course for as long as possible. The pace is given by the audio cassette. At every sound heard, you must have reached one of the 20mts lines and upon hearing the sound you should pivot and reverse your direction and run at the set pace to the opposite line in time for the next Audio –Signal. This way you run till your maximum capacity is reached. If twice in a row you can’t reach within 2 strikes of the line, you have reached your capacity and remember the last number announced on the cassette player. This is your stage level and equates this score from the score sheet attached to know your VO2 max. as per your age.
Reading your run score from the chart: i) The chart/ score sheet has been worked out from age group of 7 onwards to 18+ (which includes adults of all ages)- which has been put on the Horizontal Axis of the chart. ii) The 1st column vertically downwards shows the number of stages/ minutes you have run. Iii) The 2nd vertical column downwards shows your running speed in Kms/ hour. Iv) The columns thereafter are placed age-groups wise and divided into two sub-
sections vertically:- a) the first shows the METS- value ( MET is energy unit- & indicates the Aerobic fitness level. At rest it is one MET and during exercise it should be able to reach between 10-20 METS i.e., 10-20 times your resting level) b) the second sub-section shows the VO2 in ml/kg. The Table of prediction of MET/VO2 max. is given in the Armed forces sports Medicine centre, Pune.
Standing Board Jump:
Objective: To test the explosive power of logs in jumping horizontal Distance
Sex: Boys & Girls at 7 Year & above Equipment : Floor, mat or long jump pit, measurement Test admiration: Demonstration of the jump is given to the group of subject to be tested. Subject is then asked to stand behind the starting line with feet parallel to each other. Subject is instructed to jump as farthest as possible by bending keens & swinging arms to take off for the board jump in the forward direction. The subject is given three trials
Scoring: Distance between the starting line & nearest point at the landing provides the score of the test.
Flex Arm hang test / chin ups test:-
Objective: To measure the isometric strength endurance of the arm & shoulders girdle. Age: Seven to eighteen years. Sex: Satisfactory for boys (flex arm) up to 9 years, and chin ups for 10 to 18 years, and all age groups (flex arm hang) of girls. Equipments: Horizontal bar, stop watch, Magnesium powder (light), paper, pencil etc. Administration of test: 1) Subject is to asked to grip the Horizontal bar over grip manner.2) with the assistance of two helpers are in front & one in back of the subject. The subject’s body is raised of the floor to a certain position where the chin is above the bar without touching. Chin-up Test:- Objective: To measure strength endurance of Arm. Sex: - Seven to eighteen years, Equipment: - Horizontal bar, stop watch, paper, pencil magnesium powder (light) etc. Test administration:- 1. Subject is asked to hold the Horizontal Bar in over Grip position. 2. Subject is then asked to raise the body of the floor by pooling the arms to Attain chin-up
legs flex arm position mentioned in earlier test. 3. He then instructed to extend the arm to bring body towards floor and regain the initial
position. 4. Step 1, 2 &3 forms one chin-up.

Scoring: - Score of the subject is number of chip-ups performed in correct position mentioned above. Chin ups performed when chin is not raised over the bar will not counted.
. Ball Throw and catch/Transfer (Eye-Hand Coordination) Equipment and Materials: Two boxes or other containers large enough to hold at last five 10-inch play ground balls. Distance between boxes should be at least 15 feet. Directions: The child takes the balls out of the box one at a time on the left and places them in which he deposits the ball in the box depends on the nature and level of skill desired .The teacher may want the child to a) simply place the balls in the basket. b) Toss it from a specified distance’s. c) Toss is over barrier d) bounce it in e) bank it in, etc. The size and number of balls can be altered also.
Stork Stand Test:- Aim: - To Measure the Static Balance on the ball of the foot. Sex/Age: - Boys & Girls above 10 yrs. Equipment: - Horizontal Bar & stop Watch Test administration:- 1. The Subject is asked to stand on one foot of the dominant leg to place the ball of the other
foot on the inside of the supporting knee. 2. Subject is informed to place the hands on the respective sides of waist. 3. On start signal timer will start, subject is informed to stand on the toe of the Dominant leg
& maintain the same for longest possible time without moving ball of feet from its initial position .i.e. 1st step.
4. As soon as the subject losses the balance indicates either by touching heel to the floor or by movement of the foot from the initial possible, the administration will stop the work.
Scoring: - Total time for maintaining the correct balance position is the score of the subject. Procedure: A team of 12 trainees along with the principal investigator were visited to different schools selected for the administration of various tests in the vicinity of Aurangabad district. The subjects were selected boys and girls lying between 7 to 13 years. The subjects were asked to do warming-up before undergoing various tests. The status and health of the subjects were ensured before conducting the test. The large amount of data was collected from administering various selected tests on around 10,000 children. The data is than segregated according to age-wise and test-wise. On each segregated data statistical treatment is ensured for analysis and interpretation. The norms were prepared in the six physical fitness components for various age groups i.e., between 7 to 13 years for both sexes.

Collection of Data: The numerical data were collected for different six physical fitness components on school going boys as well as girls between 7 to 13 years. The data was arranged according to age, test and sex-wise for statistical applications. Statistical Methods: The collected data is than statistically treated by using co-relation matrix and percentile for preparing norms. After collecting the data from administrating physical fitness tests, the research team carried out statistical analyses, including descriptive statistics, sampling distribution, comparisons, and correlation analysis. The relationships between participants’ fitness levels and their exercise patterns as well as lifestyle habits and so on were investigated.
RESULTS & DISCUSSION:-
This scale has been standardized on approximately Ten thousand (9841) school going boys &
girls in each age group i.e. 7 years (633), 8 years (1320), 9 years(1265) 10 years (1623), 11 years
(1789), 12 years (1787), & 13 years (1368) respectively. Another 56 students were also taken for
the study because when the samples were taken out for test they were asked their date of birth for
classification of age groups. Many of them found above 13 years, thus, we put them in the age
group of 14 years and were tested in all said above physical fitness components. After collecting
the data from physical fitness test, the data was treated by using statistical analysis, including
descriptive statistics, sampling distribution, correlation analysis and percentile. The relationship
between participant’s fitness levels and their age and gender were investigated. Besides
preparing the norms six physical fitness test, a co-relation matrix was constructed for age, sex
and all six physical fitness component tests. Table number 1 to 3 shows mean and standard
deviation of six physical fitness component tests of 7 to 13 years boys and girls. Six different
physical fitness tests were used for percentile scale. However, percentile scale is not considered
as standard scale as mean and standard deviation are not used in constructing the scale and scores
are not constantly distributed. The distance on the base line are close together near the mean and
spread out at the extremities of the distribution. Zero is located at lowest value of the data, from
where the tables are constructed and 100 is placed at the top. All descriptive analysis was given
according to the test and sex wise.

Table no.:- 1
The mean values of physical fitness components were shown in the following table:
Physical fitness components
7 years Boys Girls M SD M SD
8 years Boys Girls M SD M SD
9 years Boys Girls M SD M SD
30M. Dash
6.84 0.95 7.36 0.94 6.47 0.78 7.16 0.82 6.24 0.66 6.91 0.70
Standing Broad Jump
0.98 0.20 0.89 0.16 1.06 0.18 0.95 0.17 1.13 0.20 1.00 0.15
Flexed Arm Hang
7.19 7.7 5.17 7.50 8.36 8.29 3.86 4.82 6.21 9.06 3.79 5.50
20M. Shuttle run
2.49 0.63 2.50 0.59 2.98 0.99 2.58 0.61 3.00 0.92 2.82 0.75
Ball Throw & Catch
4.40 5.02 1.10 2.52 7.85 5.99 2.65 4.16 11.32 5.68 4.93 5.27
Stork Stand 1.72 1.69 1.55 1.64 1.78 1.76 1.65 1.55 1.67 1.23 2.04 2.43 N= 341 292 714 606 680 585
In the present study, Pearson’s co-relation method was employed to find out the co-relation between different physical fitness test and age group and gender. Above table revealed that physical fitness components like speed, explosive strength of lower extremities, strength in upper extremities, VO2 Max. Cardio-vascular endurance, co-ordination and balance abilities were gradually increased as their age grew and gender difference was also found in all age groups. This reflected the growth spurt in physical development during childhood. Except flexed arm hang fitness component which showed irregularity development among all three age groups of boys and girls. This may found due to weight gaining and occurring physiological differences at the age of 9 in the girls.
1) 30M. Dash Physical fitness test revealed significant co-relation (r = 0.093) at 0.05 level was found between 9 years boys and 8 years boys.
2) Standing Broad Jump physical fitness test was found significant co-relation (r = 0.162, 0.147) at 0.05 and 0.01 level respectively among 7 years boys, 9 years boys and 9 years girls.
3) Flexed Arm hang physical fitness test was found significant co-relation (r = 0.172,0.131) at 0.05 and 0.01 level respectively among 7 years 8 years and 9 years girls.
4) 20M. shuttle run physical fitness test was found significant co-relation (r = -0.192,-0.202) at 0.05 level among 8 years boys, 9 years boys and 7 years girls.
5) Stork stand physical fitness test was found significant co-relation (r = 0.208,0.115) at 0.05 level among 7 years boys, 8 years boys and 8 years girls.
6) Ball throw and catch physical fitness test was only component didn’t found significant co-relation among all groups.

Table no.2 shows mean and SD of 10 to 12 years boys & girls physical fitness components
Physical fitness components
10 years Boys Girls M SD M SD
11 years Boys Girls M SD M SD
12 years Boys Girls M SD M SD
30M. Dash
6.09 .618 6.81 .757 5.88 .517 6.52 .663 5.74 .510 6.55 .741
Standing Broad Jump
1.22 .199 1.06 .168 1.32 .187 1.12 1.82 1.38 .202 1.13 1.87
Flexed Arm Hang(Boys chin-counts)
1.39 4.41 3.38 4.78 .812 1,85 4.72 6.31 .844 1.75 3.96 5.27
20M. Shuttle run
3.30 1.18 3.00 .863 3.83 1.31 3.16 .962 3.90 1.52 3.03 .940
Ball Throw & Catch
14.44 4.99 7.65 5.92 16.18 4.03 10.45 6.04 17.62 2.92 12.90 5.48
Stork Stand 2.03 2.03 2.82 3.19 2.63 2.67 3.25 3.73 3.15 3.29 3.28 3.97
N= 938 685 1623 969 820 1789 991 796 1787
Table no. 3 shows mean and SD of 13 and 14 years boys & girls physical fitness components.
Physical fitness components
13 years Boys Girls M SD M SD
14 years Boys Girls M SD M SD
30M. Dash
5.73 .477 6.85 .941 5.79 .369 7.32 .913
Standing Broad Jump
1.36 .227 1.14 .266 1.41 .193 0.947 .233
Flexed Arm Hang(Boy chin-counts)
1.12 1.84 3.22 3.59 2.21 2.29 .685 .952
20M. Shuttle run
3.90 1.61 3.53 1.31 3.88 1.61 2.76 .704
Ball Throw & Catch
17.46 3.34 12.83 5.28 12.92 6.31 8.62 8.78
Stork Stand 3.40 3.97 2.62 2.79 2.42 1.97 1.95 .514
N= 856 512 1368 37 19 56

In the present study, Pearson’s co-relation method was employed to find out the co-relation between different physical fitness test and age group and gender. Above table revealed that physical fitness components like speed ability was gradually improved as boys increased their age and also found correlation among some of the ages. Explosive strength of lower extremities was also improved as the age increased in boys. Table no. 10 & 11 shown that explosive strength of legs of each age group had gradually increased. Strength in upper extremities, VO2 Max. Cardio-vascular endurance, co-ordination and balance abilities were also gradually increased as their age grew and gender difference was also found in all age groups of boys. This reflected the growth spurt in physical development during childhood. Except flexed arm hang fitness component which showed irregularity development among all three age groups of boys and girls. This may found due to weight gaining and occurring physiological differences at the age of 9 in the girls.
1) The significant correlation was not found in any age group of boys in relation to Speed ability.
2) Significant co-relation (r = 0.88) at 0.05 level was found between 10years and 11years girls in 30M. Dash.
3) The significant correlation was not found in any age group of boys in relation to Explosive strength ability.
4) Significant correlations (r = 0.826 & 0.739) at 0.05 level were found among 11years, 13years and 14years girls in Standing Broad Jump.
5) The significant correlation was not found in any age group of boys in relation to Muscular strength endurance ability.
6) Significant correlations (r = 0.496 & 0.100) were found among 10years, 11years, and 13 years girls in Arm-hang test.
7) The significant correlation(r = -0.306) at 0.01 level was found between 12years and 13years boys in relation to Cardio-vascular endurance ability.
8) Significant correlations (r = 0.700 & 0.822) were found among 12years, 13years, and
14years girls in Shuttle run test /Canadian fit test.
9) The significant correlations (r = 0.143 & 0.475) at 0.01 level and (r = 0.241) at 0.05 level
were found among 10years, 11years, 12years,and 13years boys in coordination ability
10) The significant correlation was not found in any age groups of girls in relation to
coordination ability. 11) The significant correlation was not found in any age group of boys in relation to balance
ability. 12) The significant correlation was not found in any age groups of girls in relation to balance
ability.

The percentile values of stork stand for different age group of boys shown bellow:-
Table-4
30 Meter dash running / boys
Percentile 7 years 8 years
9 years
10 years
11 years
12 years
13 years
sec sec sec sec sec Sec Sec 100 5.68 5.42 5.41 5.28 5.13 5.04 5.11
95 5.98 5.6 5.54 5.42 5.28 5.15 5.18 90 6.21 5.76 5.63 5.52 5.39 5.25 5.24 85 6.37 5.86 5.73 5.6 5.46 5.33 5.36 80 6.44 5.95 5.8 5.7 5.54 5.4 5.46 75 6.5 6.11 5.9 5.78 5.61 5.45 5.5 70 6.6 6.18 5.98 5.86 5.68 5.51 5.58 65 6.66 6.26 6.06 5.92 5.73 5.58 5.61 60 6.73 6.34 6.14 5.98 5.79 5.63 5.68 55 6.83 6.41 6.22 6.05 5.84 5.69 5.74 50 6.9 6.5 6.29 6.12 5.91 5.76 5.79 45 7.02 6.59 6.38 6.19 5.96 5.81 5.84 40 7.12 6.69 6.42 6.27 6.02 5.86 5.85 35 7.2 6.77 6.5 6.36 6.07 5.91 5.9 30 7.37 6.85 6.59 6.46 6.16 6.04 5.98 25 7.42 7.02 6.71 6.56 6.27 6.14 6.11 20 7.49 7.19 6.82 6.66 6.38 6.24 6.23 15 7.87 7.47 7.01 6.77 6.5 6.37 6.3 10 8.37 7.73 7.32 6.99 6.78 6.62 6.53
5 8.85 9.36 8.5 8.83 8.44 8.14 7.01 0 0 0 0 0 0 0 0
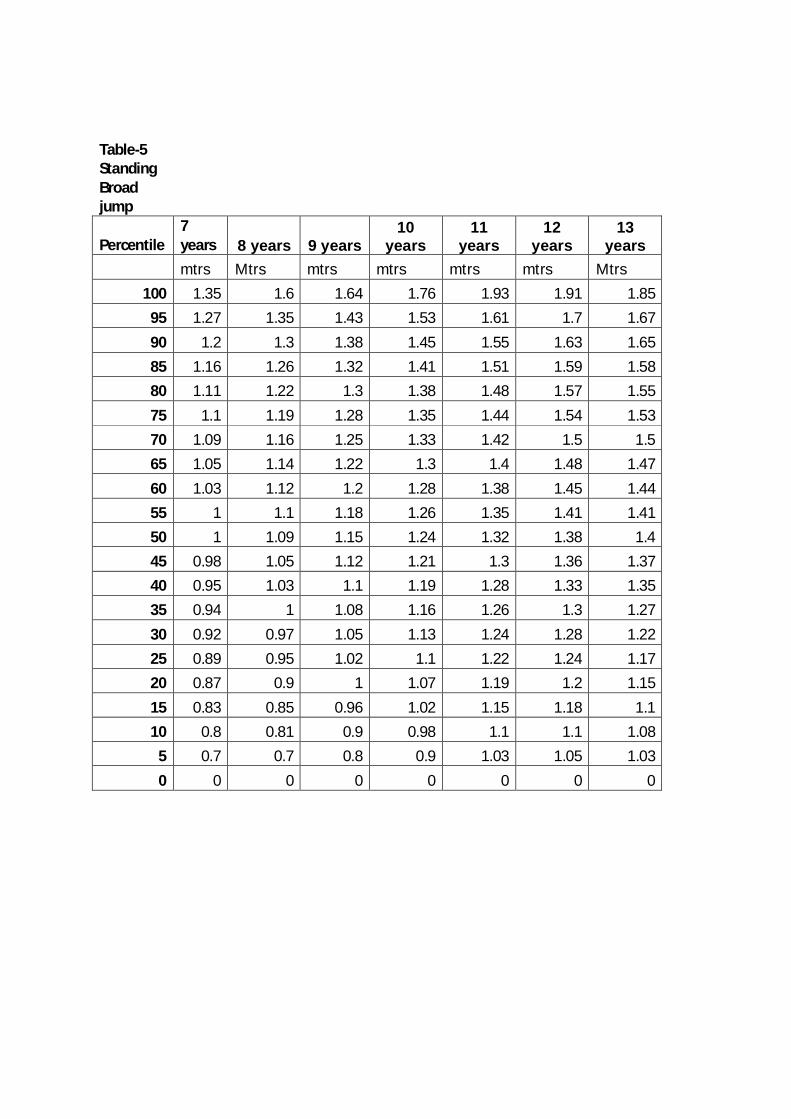
Table-5 Standing Broad jump
Percentile 7 years 8 years 9 years
10 years
11 years
12 years
13 years
mtrs Mtrs mtrs mtrs mtrs mtrs Mtrs 100 1.35 1.6 1.64 1.76 1.93 1.91 1.85
95 1.27 1.35 1.43 1.53 1.61 1.7 1.67
90 1.2 1.3 1.38 1.45 1.55 1.63 1.65 85 1.16 1.26 1.32 1.41 1.51 1.59 1.58 80 1.11 1.22 1.3 1.38 1.48 1.57 1.55
75 1.1 1.19 1.28 1.35 1.44 1.54 1.53 70 1.09 1.16 1.25 1.33 1.42 1.5 1.5 65 1.05 1.14 1.22 1.3 1.4 1.48 1.47
60 1.03 1.12 1.2 1.28 1.38 1.45 1.44 55 1 1.1 1.18 1.26 1.35 1.41 1.41 50 1 1.09 1.15 1.24 1.32 1.38 1.4 45 0.98 1.05 1.12 1.21 1.3 1.36 1.37 40 0.95 1.03 1.1 1.19 1.28 1.33 1.35 35 0.94 1 1.08 1.16 1.26 1.3 1.27
30 0.92 0.97 1.05 1.13 1.24 1.28 1.22 25 0.89 0.95 1.02 1.1 1.22 1.24 1.17 20 0.87 0.9 1 1.07 1.19 1.2 1.15
15 0.83 0.85 0.96 1.02 1.15 1.18 1.1 10 0.8 0.81 0.9 0.98 1.1 1.1 1.08
5 0.7 0.7 0.8 0.9 1.03 1.05 1.03
0 0 0 0 0 0 0 0
Table-6 Flexed arm hang/ chin ups
Percentile
7 years
8 years
9 years
10 years
11 years
12 years
13 years
sec Sec Sec no. no. no. no. 100 47.79 50.58 58.23 8 25 20 7
95 21.95 24.92 24.74 6 4 4 5.5 90 15.97 19.42 17.94 4 3 3 4 85 13.02 15.98 13.97 3 2 2 3 80 10.76 13.79 10.84 2 2 2 2 75 9.21 11.94 8.52 1 1 1 1 70 8.13 10.57 7.01 1 0 1 1 65 7.61 9.22 5.7 0 0 0 1 60 6.74 8.21 4.64 0 0 0 1 55 6.11 6.99 3.64 0 0 0 0 50 5.35 5.99 3 0 0 0 0 45 4.99 5.27 2 0 0 0 0 40 4.4 4.37 1.03 0 0 0 0 35 3.45 3.71 0 0 0 0 0 30 2.81 3.2 0 0 0 0 0 25 2.15 2.54 0 0 0 0 0 20 1.21 1.36 0 0 0 0 0 15 0 0 0 0 0 0 0 10 0 0 0 0 0 0 0
5 0 0 0 0 0 0 0 0 0 0 0 0 0 0 0

Table-7
20 Meter. ping-pong test / boys
Percentile 7 years
8 years
9 years
10 years
11 years
12 years
13 years
level Level level level level Level level 100 4.7 9.1 7.1 8.4 8.8 9.9 7.8
95 3.6 4.68 4.7 5.62 6.3 6.7 7.55 90 3.4 4.3 4.3 4.94 5.7 6.29 6.9 85 2.8 3.7 3.6 4.6 5.3 5.6 5.25 80 2.7 3.3 3.4 3.6 4.4 4.5 5.1 75 2.7 3.4 3.4 3.8 4.6 4.7 4.7 70 2.7 3.5 3.5 4.3 4.8 5.3 4.3 65 2.6 3.2 3.3 3.4 4.3 4.3 3.8 60 2.5 2.6 2.7 2.9 3.5 3.5 3.6 55 2.5 2.7 2.8 3.2 3.6 3.7 3.5 50 2.5 2.7 3.1 3.3 4.1 4.1 3.4 45 2.4 2.5 2.5 2.6 3.2 3.2 3.3 40 2.4 2.5 2.6 2.6 3.3 3.3 3.2 35 2.4 2.6 2.6 2.7 3.4 3.4 3.1 30 2.3 2.4 2.4 2.4 2.7 2.6 2.7 25 2.3 2.4 2.5 2.5 3.1 2.8 2.5 20 2.2 2.3 2.4 2.4 2.5 2.5 2.5 15 2.1 2.3 2.3 2.3 2.45 2.4 2.5 10 1.6 2.2 2.2 2.2 2.4 2.3 2.5
5 1.5 2.1 2.1 2.1 2.3 2.2 2.3 0 0 0 0 0 0 0 0

Table-8
Ball throw & catch / boys
Percentile
7 years
8 years
9 years
10 years
11 years
12 years
13 years
no. no. no. no. no. no. no. 100 20 20 20 20 20 20 20
95 14 18 20 20 20 20 20 90 12 16 18.9 20 20 20 20 85 10 15 18 20 20 20 20 80 9 14 17 19 19 20 20 75 8 13 16 18 19 20 20 70 7 12 15 18 19 20 20 65 7 10 15 17 18 19 19.5 60 5 10 14 17 18 19 19 55 3 8 13 16 18 19 19 50 3 8 12 16 17 18.5 19 45 2 7 11 15 17 18 18 40 0 5.6 10 15 17 18 18 35 0 5 9 14 16 17 17.5 30 0 3 8 13 16 17 17 25 0 2 7 12 15 17 17 20 0 1 6 10 14 16 16 15 0 0 4 8.2 12 15 15 10 0 0 3 7 10 14 11
5 0 0 1 5 8 11.55 10 0 0 0 0 0 0 0 0

Table-9
Percentile 7 years
8 years
9 years
10 years
11 years
12 years
13 years
sec Sec sec sec sec Sec sec 100 11.31 14.93 13.09 18.6 21.62 24.88 28.42
95 5.21 4.87 3.96 5.28 7.17 9.44 8.1 90 3.25 3.05 3.11 3.58 5.34 5.92 6.67 85 2.6 2.53 2.6 2.97 3.97 4.56 4.96 80 2.13 2.27 2.26 2.58 3.23 3.74 3.95 75 1.9 2.03 2.08 2.35 2.83 3.37 3.63 70 1.79 1.85 1.9 2.13 2.55 3 3.1 65 1.66 1.68 1.75 1.86 2.31 2.78 2.92 60 1.53 1.54 1.6 1.7 2.14 2.6 2.57 55 1.34 1.44 1.45 1.57 1.99 2.37 2.35 50 1.25 1.31 1.32 1.48 1.85 2.1 2.28 45 1.15 1.2 1.24 1.38 1.74 1.94 2.16 40 1.09 1.12 1.14 1.28 1.57 1.81 1.88 35 1 1.02 1.07 1.19 1.45 1.68 1.71 30 0.93 0.92 0.98 1.09 1.35 1.58 1.59 25 0.78 0.83 0.9 0.98 1.24 1.43 1.49 20 0.71 0.77 0.84 0.89 1.15 1.35 1.4 15 0.57 0.66 0.77 0.8 1.03 1.23 1.28 10 0.49 0.59 0.62 0.68 0.9 1.08 1.14
5 0.33 0.47 0.5 0.54 0.73 0.82 0.96 0 0 0 0 0 0 0 0

Table-10
The percentile values for different test of girls:-
30 Meter. dash running / girls
Percentile 7 years
8 years
9 years
10 years
11 years
12 years
13 years
sec sec sec sec sec Sec sec 100 6.16 6.04 5.87 5.73 5.5 5.52 5.56
95 6.28 6.26 6.03 5.99 5.76 5.77 5.8 90 6.5 6.4 6.2 6.1 5.9 5.89 6 85 6.54 6.51 6.33 6.2 6.02 5.99 6.12 80 6.59 6.61 6.44 6.31 6.16 6.08 6.2 75 6.81 6.7 6.49 6.4 6.22 6.19 6.29 70 6.98 6.8 6.59 6.48 6.31 6.25 6.38 65 7.08 6.9 6.67 6.54 6.37 6.31 6.5 60 7.18 6.98 6.72 6.62 6.42 6.43 6.53 55 7.28 7.07 6.82 6.69 6.5 6.51 6.72 50 7.32 7.19 6.94 6.81 6.55 6.59 6.91 45 7.49 7.25 7.06 6.88 6.63 6.67 6.98 40 7.56 7.35 7.15 6.99 6.7 6.73 7.16 35 7.7 7.47 7.26 7.08 6.78 6.83 7.33 30 7.83 7.56 7.36 7.21 6.84 6.9 7.48 25 7.93 7.71 7.48 7.38 6.97 6.99 7.5 20 8.15 7.88 7.62 7.56 7.05 7.17 7.66 15 8.48 8.15 7.8 7.83 7.33 7.35 7.93 10 8.95 8.61 8.25 8.09 7.6 7.7 8.64
5 11.81 11.94 8.96 10.4 9.33 11.57 8.96 0 0 0 0 0 0 0 0

Table-11
Standing broad jump / girls
Percentile
7 years
8 years
9 years
10 years
11 years
12 years
13 years
mtrs mtrs mtrs mtrs mtrs Mtrs mtrs 100 1.25 1.71 1.51 1.55 1.72 1.72 1.75
95 1.11 1.25 1.25 1.33 1.41 1.42 1.63 90 1.08 1.16 1.2 1.29 1.36 1.37 1.43 85 1.05 1.13 1.16 1.25 1.31 1.33 1.4 80 1 1.08 1.14 1.22 1.28 1.29 1.32 75 1 1.04 1.12 1.19 1.25 1.26 1.26 70 0.97 1.01 1.09 1.15 1.22 1.24 1.26 65 0.95 1 1.07 1.13 1.2 1.2 1.23 60 0.93 0.98 1.05 1.1 1.18 1.19 1.18 55 0.91 0.97 1.03 1.08 1.15 1.16 1.15 50 0.9 0.95 1 1.06 1.13 1.14 1.11 45 0.9 0.93 0.99 1.04 1.11 1.1 1.1 40 0.85 0.92 0.97 1.01 1.09 1.09 1.08 35 0.85 0.9 0.95 1 1.07 1.07 1.04 30 0.82 0.87 0.93 0.97 1.05 1.04 0.97 25 0.8 0.85 0.9 0.95 1.02 1 0.95 20 0.8 0.82 0.89 0.92 1 0.98 0.94 15 0.75 0.8 0.85 0.9 0.95 0.95 0.89 10 0.7 0.75 0.8 0.84 0.9 0.9 0.82
5 0.67 0.68 0.75 0.8 0.82 0.82 0.76 0 0 0 0 0 0 0 0

Table-12
Arm hang-chin ups / girls
Percentile 7 years
8 years
9 years
10 years
11 years
12 years
13 years
sec sec sec sec sec Sec sec 100 55.75 31.76 45.32 30.2 58.96 27.41 11.97
95 17.81 13.23 13.28 13.7 15.27 16.43 11.18 90 12.16 9.26 9.19 9.14 11.07 11.42 7.9 85 9.19 7.72 7.75 7.13 9 8.41 7 80 7.78 6.24 6.57 5.97 7.86 6.81 5.58 75 6.03 5.42 5.45 5.02 6.85 5.63 4.13 70 5.4 4.77 4.52 4.12 6.08 4.95 3.38 65 4.95 4.18 3.76 3.36 5.35 4.25 3.18 60 4.25 3.74 3.17 2.92 4.49 3.34 3.13 55 3.9 3.18 2.58 2.32 3.7 2.78 2.98 50 3.55 2.7 2.1 1.91 3.12 2.06 2.78 45 3.12 2.28 1.67 1 2.5 1.57 2.22 40 2.5 1.74 1.27 0 1.75 0.82 1.2 35 1.65 0.9 0 0 1 0 0.78 30 0.65 0 0 0 0 0 0.67 25 0 0 0 0 0 0 0 20 0 0 0 0 0 0 0 15 0 0 0 0 0 0 0 10 0 0 0 0 0 0 0
5 0 0 0 0 0 0 0 0 0 0 0 0 0 0 0
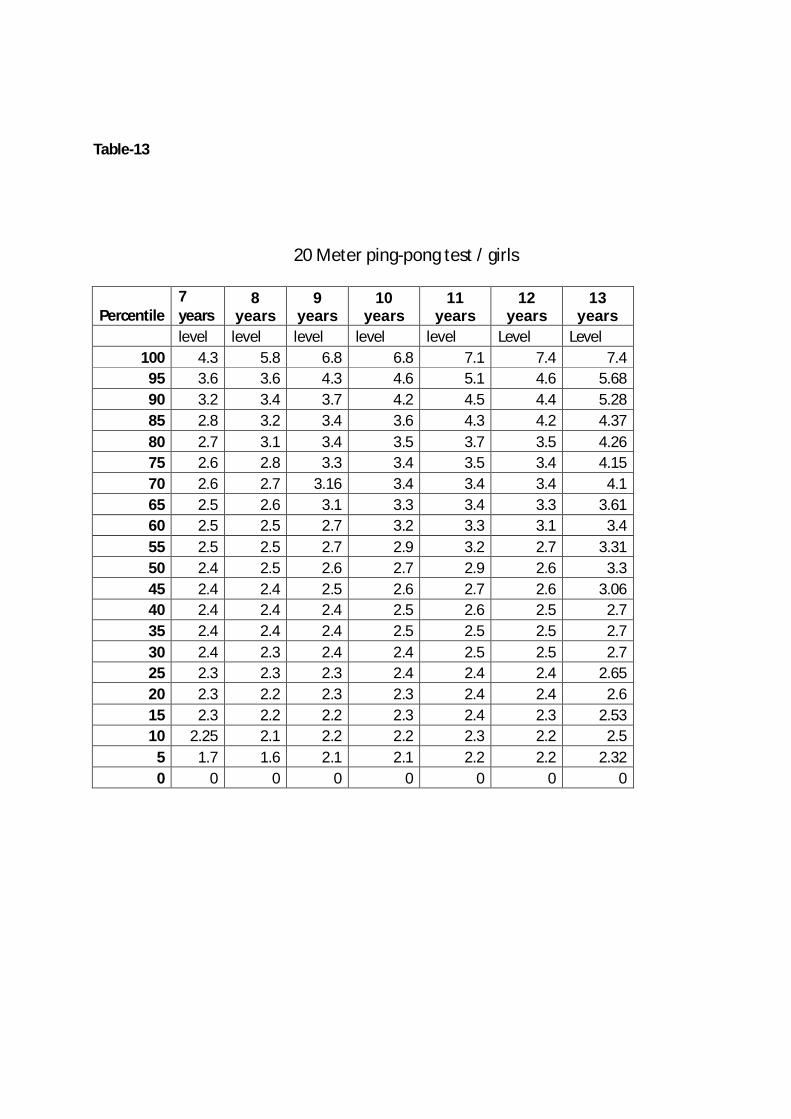
Table-13
20 Meter ping-pong test / girls
Percentile 7 years
8 years
9 years
10 years
11 years
12 years
13 years
level level level level level Level Level 100 4.3 5.8 6.8 6.8 7.1 7.4 7.4
95 3.6 3.6 4.3 4.6 5.1 4.6 5.68 90 3.2 3.4 3.7 4.2 4.5 4.4 5.28 85 2.8 3.2 3.4 3.6 4.3 4.2 4.37 80 2.7 3.1 3.4 3.5 3.7 3.5 4.26 75 2.6 2.8 3.3 3.4 3.5 3.4 4.15 70 2.6 2.7 3.16 3.4 3.4 3.4 4.1 65 2.5 2.6 3.1 3.3 3.4 3.3 3.61 60 2.5 2.5 2.7 3.2 3.3 3.1 3.4 55 2.5 2.5 2.7 2.9 3.2 2.7 3.31 50 2.4 2.5 2.6 2.7 2.9 2.6 3.3 45 2.4 2.4 2.5 2.6 2.7 2.6 3.06 40 2.4 2.4 2.4 2.5 2.6 2.5 2.7 35 2.4 2.4 2.4 2.5 2.5 2.5 2.7 30 2.4 2.3 2.4 2.4 2.5 2.5 2.7 25 2.3 2.3 2.3 2.4 2.4 2.4 2.65 20 2.3 2.2 2.3 2.3 2.4 2.4 2.6 15 2.3 2.2 2.2 2.3 2.4 2.3 2.53 10 2.25 2.1 2.2 2.2 2.3 2.2 2.5
5 1.7 1.6 2.1 2.1 2.2 2.2 2.32 0 0 0 0 0 0 0 0

Table-14
ball throw & catch / girls
Percentile 7 years
8 years
9 years
10 years
11 years
12 years
13 years
no. no. no. no. no. no. no. 100 16 20 20 20 20 20 19
95 5.2 13 16 18 19 20 19 90 3 9 14 16 18 19 18 85 2 6 11 15 17 18 7 80 2 4 9.2 14 17 18 18 75 1 4 8 12 16 17 17.4 70 1 3 7 11 15 17 16.25 65 0 2 6 10 14.05 16 16 60 0 2 5 9 13 15 15.95 55 0 1 4 8 12 15 15 50 0 1 3 7 11 14 15 45 0 0 2 6 10 13 14 40 0 0 2 5 9 13 13 35 0 0 1 4 7.95 12 13 30 0 0 0 3 6 10.9 12.05 25 0 0 0 2 5 10 10 20 0 0 0 2 4 8 10 15 0 0 0 1 3 7 9.6 10 0 0 0 0 2 4.3 8.45
5 0 0 0 0 0 2 6.6 0 0 0 0 0 0 0 1.75
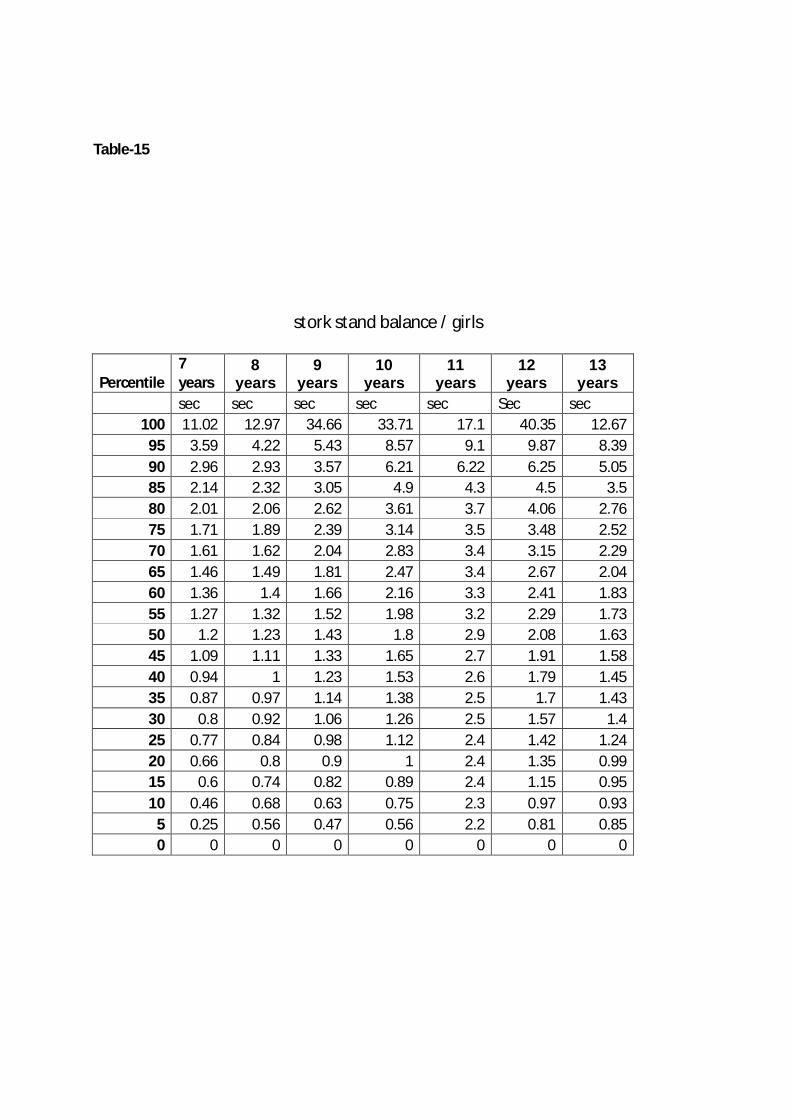
Table-15
stork stand balance / girls
Percentile
7 years
8 years
9 years
10 years
11 years
12 years
13 years
sec sec sec sec sec Sec sec 100 11.02 12.97 34.66 33.71 17.1 40.35 12.67
95 3.59 4.22 5.43 8.57 9.1 9.87 8.39 90 2.96 2.93 3.57 6.21 6.22 6.25 5.05 85 2.14 2.32 3.05 4.9 4.3 4.5 3.5 80 2.01 2.06 2.62 3.61 3.7 4.06 2.76 75 1.71 1.89 2.39 3.14 3.5 3.48 2.52 70 1.61 1.62 2.04 2.83 3.4 3.15 2.29 65 1.46 1.49 1.81 2.47 3.4 2.67 2.04 60 1.36 1.4 1.66 2.16 3.3 2.41 1.83 55 1.27 1.32 1.52 1.98 3.2 2.29 1.73 50 1.2 1.23 1.43 1.8 2.9 2.08 1.63 45 1.09 1.11 1.33 1.65 2.7 1.91 1.58 40 0.94 1 1.23 1.53 2.6 1.79 1.45 35 0.87 0.97 1.14 1.38 2.5 1.7 1.43 30 0.8 0.92 1.06 1.26 2.5 1.57 1.4 25 0.77 0.84 0.98 1.12 2.4 1.42 1.24 20 0.66 0.8 0.9 1 2.4 1.35 0.99 15 0.6 0.74 0.82 0.89 2.4 1.15 0.95 10 0.46 0.68 0.63 0.75 2.3 0.97 0.93
5 0.25 0.56 0.47 0.56 2.2 0.81 0.85 0 0 0 0 0 0 0 0
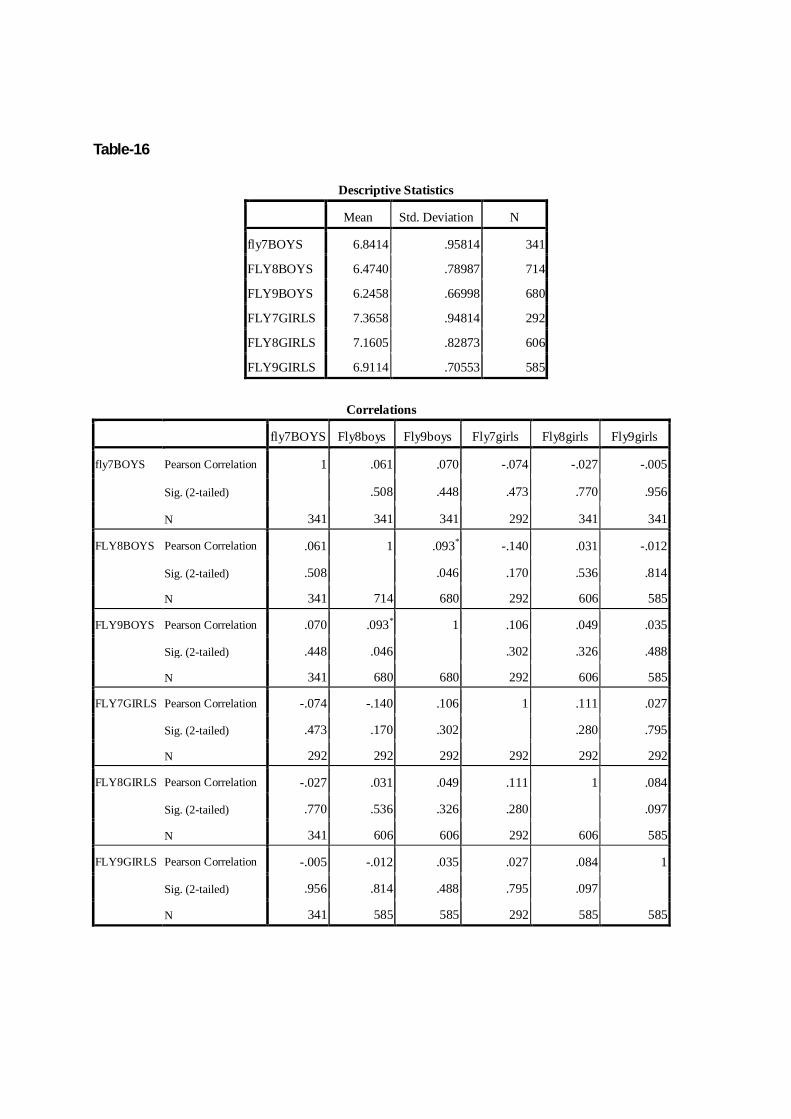
Table-16
Descriptive Statistics Mean Std. Deviation N
fly7BOYS 6.8414 .95814 341
FLY8BOYS 6.4740 .78987 714
FLY9BOYS 6.2458 .66998 680
FLY7GIRLS 7.3658 .94814 292
FLY8GIRLS 7.1605 .82873 606
FLY9GIRLS 6.9114 .70553 585
Correlations fly7BOYS Fly8boys Fly9boys Fly7girls Fly8girls Fly9girls
fly7BOYS Pearson Correlation 1 .061 .070 -.074 -.027 -.005
Sig. (2-tailed) .508 .448 .473 .770 .956
N 341 341 341 292 341 341
FLY8BOYS Pearson Correlation .061 1 .093* -.140 .031 -.012
Sig. (2-tailed) .508 .046 .170 .536 .814
N 341 714 680 292 606 585
FLY9BOYS Pearson Correlation .070 .093* 1 .106 .049 .035
Sig. (2-tailed) .448 .046 .302 .326 .488
N 341 680 680 292 606 585
FLY7GIRLS Pearson Correlation -.074 -.140 .106 1 .111 .027
Sig. (2-tailed) .473 .170 .302 .280 .795
N 292 292 292 292 292 292
FLY8GIRLS Pearson Correlation -.027 .031 .049 .111 1 .084
Sig. (2-tailed) .770 .536 .326 .280 .097
N 341 606 606 292 606 585
FLY9GIRLS Pearson Correlation -.005 -.012 .035 .027 .084 1
Sig. (2-tailed) .956 .814 .488 .795 .097
N 341 585 585 292 585 585
*. Correlation is significant at the 0.05 level (2-tailed). .
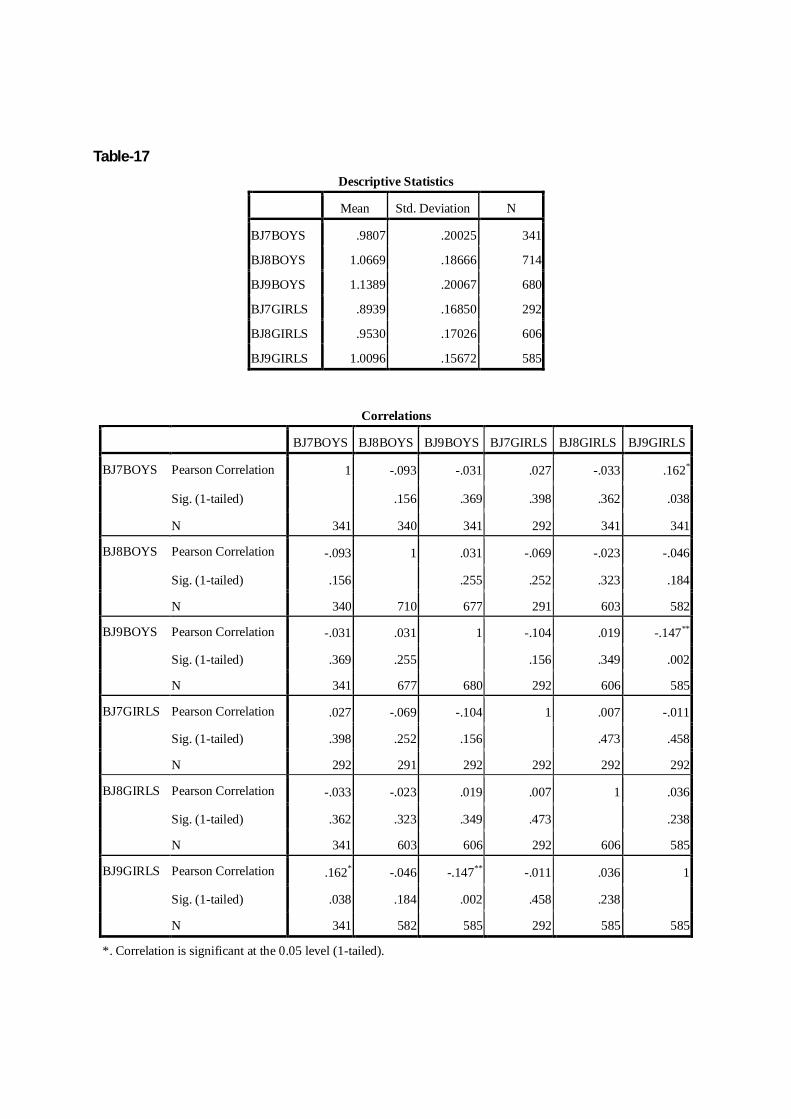
Table-17
Descriptive Statistics Mean Std. Deviation N
BJ7BOYS .9807 .20025 341
BJ8BOYS 1.0669 .18666 714
BJ9BOYS 1.1389 .20067 680
BJ7GIRLS .8939 .16850 292
BJ8GIRLS .9530 .17026 606
BJ9GIRLS 1.0096 .15672 585
Correlations BJ7BOYS BJ8BOYS BJ9BOYS BJ7GIRLS BJ8GIRLS BJ9GIRLS
BJ7BOYS Pearson Correlation 1 -.093 -.031 .027 -.033 .162*
Sig. (1-tailed) .156 .369 .398 .362 .038
N 341 340 341 292 341 341
BJ8BOYS Pearson Correlation -.093 1 .031 -.069 -.023 -.046
Sig. (1-tailed) .156 .255 .252 .323 .184
N 340 710 677 291 603 582
BJ9BOYS Pearson Correlation -.031 .031 1 -.104 .019 -.147**
Sig. (1-tailed) .369 .255 .156 .349 .002
N 341 677 680 292 606 585
BJ7GIRLS Pearson Correlation .027 -.069 -.104 1 .007 -.011
Sig. (1-tailed) .398 .252 .156 .473 .458
N 292 291 292 292 292 292
BJ8GIRLS Pearson Correlation -.033 -.023 .019 .007 1 .036
Sig. (1-tailed) .362 .323 .349 .473 .238
N 341 603 606 292 606 585
BJ9GIRLS Pearson Correlation .162* -.046 -.147** -.011 .036 1
Sig. (1-tailed) .038 .184 .002 .458 .238
N 341 582 585 292 585 585
*. Correlation is significant at the 0.05 level (1-tailed).

Correlations BJ7BOYS BJ8BOYS BJ9BOYS BJ7GIRLS BJ8GIRLS BJ9GIRLS
BJ7BOYS Pearson Correlation 1 -.093 -.031 .027 -.033 .162*
Sig. (1-tailed) .156 .369 .398 .362 .038
N 341 340 341 292 341 341
BJ8BOYS Pearson Correlation -.093 1 .031 -.069 -.023 -.046
Sig. (1-tailed) .156 .255 .252 .323 .184
N 340 710 677 291 603 582
BJ9BOYS Pearson Correlation -.031 .031 1 -.104 .019 -.147**
Sig. (1-tailed) .369 .255 .156 .349 .002
N 341 677 680 292 606 585
BJ7GIRLS Pearson Correlation .027 -.069 -.104 1 .007 -.011
Sig. (1-tailed) .398 .252 .156 .473 .458
N 292 291 292 292 292 292
BJ8GIRLS Pearson Correlation -.033 -.023 .019 .007 1 .036
Sig. (1-tailed) .362 .323 .349 .473 .238
N 341 603 606 292 606 585
BJ9GIRLS Pearson Correlation .162* -.046 -.147** -.011 .036 1
Sig. (1-tailed) .038 .184 .002 .458 .238
N 341 582 585 292 585 585
**. Correlation is significant at the 0.01 level (1-tailed). The significant correlation was not found in any age group of boys in relation to Explosive strength ability
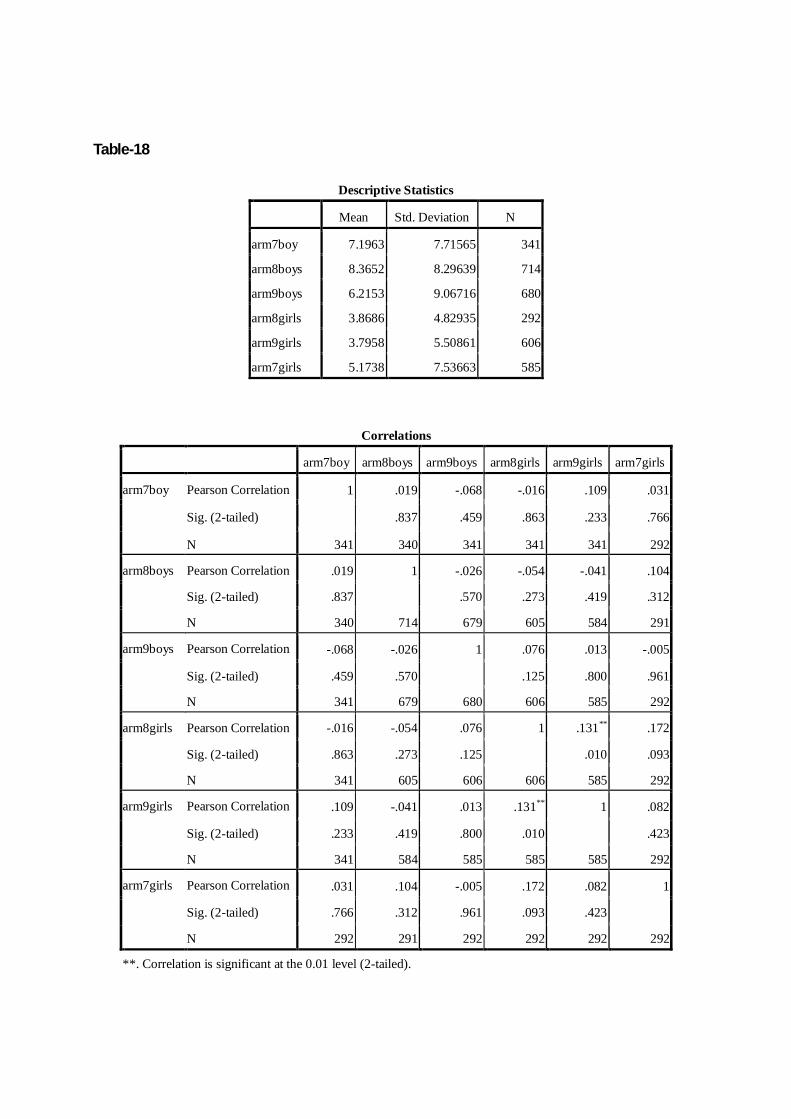
Table-18
Descriptive Statistics Mean Std. Deviation N
arm7boy 7.1963 7.71565 341
arm8boys 8.3652 8.29639 714
arm9boys 6.2153 9.06716 680
arm8girls 3.8686 4.82935 292
arm9girls 3.7958 5.50861 606
arm7girls 5.1738 7.53663 585
Correlations arm7boy arm8boys arm9boys arm8girls arm9girls arm7girls
arm7boy Pearson Correlation 1 .019 -.068 -.016 .109 .031
Sig. (2-tailed) .837 .459 .863 .233 .766
N 341 340 341 341 341 292
arm8boys Pearson Correlation .019 1 -.026 -.054 -.041 .104
Sig. (2-tailed) .837 .570 .273 .419 .312
N 340 714 679 605 584 291
arm9boys Pearson Correlation -.068 -.026 1 .076 .013 -.005
Sig. (2-tailed) .459 .570 .125 .800 .961
N 341 679 680 606 585 292
arm8girls Pearson Correlation -.016 -.054 .076 1 .131** .172
Sig. (2-tailed) .863 .273 .125 .010 .093
N 341 605 606 606 585 292
arm9girls Pearson Correlation .109 -.041 .013 .131** 1 .082
Sig. (2-tailed) .233 .419 .800 .010 .423
N 341 584 585 585 585 292
arm7girls Pearson Correlation .031 .104 -.005 .172 .082 1
Sig. (2-tailed) .766 .312 .961 .093 .423
N 292 291 292 292 292 292
**. Correlation is significant at the 0.01 level (2-tailed).
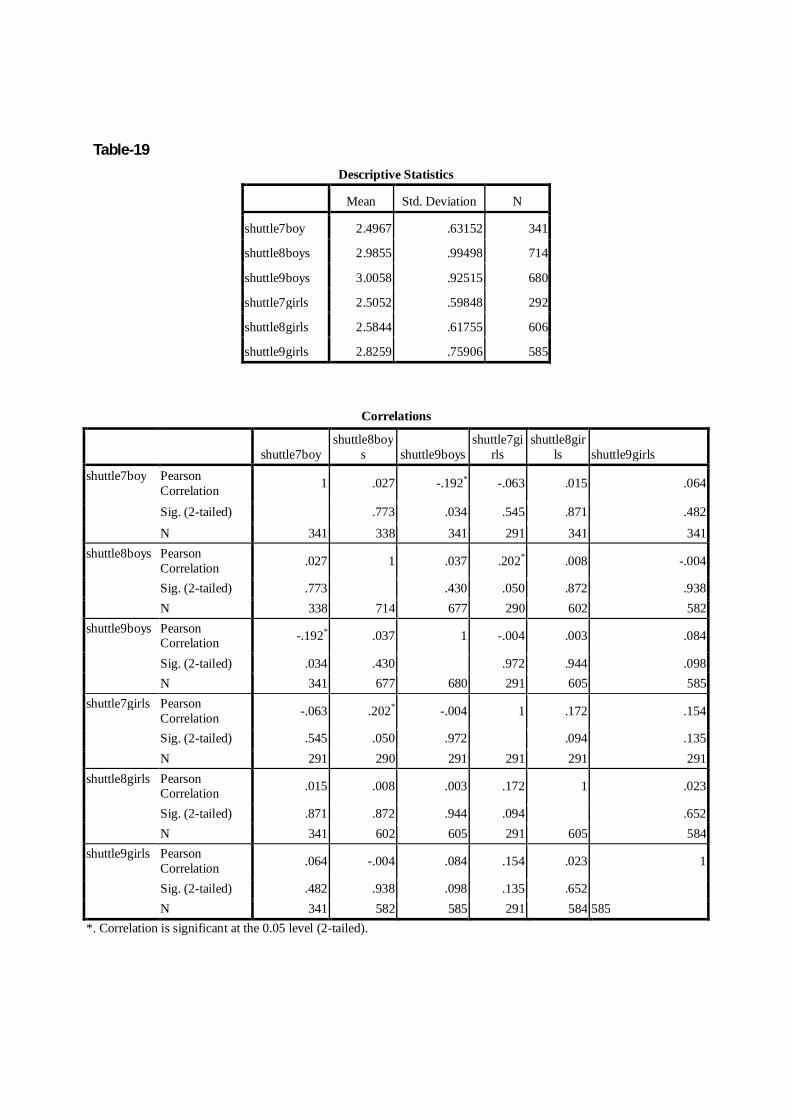
Table-19
Descriptive Statistics Mean Std. Deviation N
shuttle7boy 2.4967 .63152 341
shuttle8boys 2.9855 .99498 714
shuttle9boys 3.0058 .92515 680
shuttle7girls 2.5052 .59848 292
shuttle8girls 2.5844 .61755 606
shuttle9girls 2.8259 .75906 585
Correlations
shuttle7boy
shuttle8boys shuttle9boys
shuttle7girls
shuttle8girls shuttle9girls
shuttle7boy Pearson Correlation 1 .027 -.192* -.063 .015 .064
Sig. (2-tailed) .773 .034 .545 .871 .482 N 341 338 341 291 341 341
shuttle8boys Pearson Correlation .027 1 .037 .202* .008 -.004
Sig. (2-tailed) .773 .430 .050 .872 .938 N 338 714 677 290 602 582
shuttle9boys Pearson Correlation -.192* .037 1 -.004 .003 .084
Sig. (2-tailed) .034 .430 .972 .944 .098 N 341 677 680 291 605 585
shuttle7girls Pearson Correlation -.063 .202* -.004 1 .172 .154
Sig. (2-tailed) .545 .050 .972 .094 .135 N 291 290 291 291 291 291
shuttle8girls Pearson Correlation .015 .008 .003 .172 1 .023
Sig. (2-tailed) .871 .872 .944 .094 .652 N 341 602 605 291 605 584
shuttle9girls Pearson Correlation .064 -.004 .084 .154 .023 1
Sig. (2-tailed) .482 .938 .098 .135 .652 N 341 582 585 291 584 585
*. Correlation is significant at the 0.05 level (2-tailed).
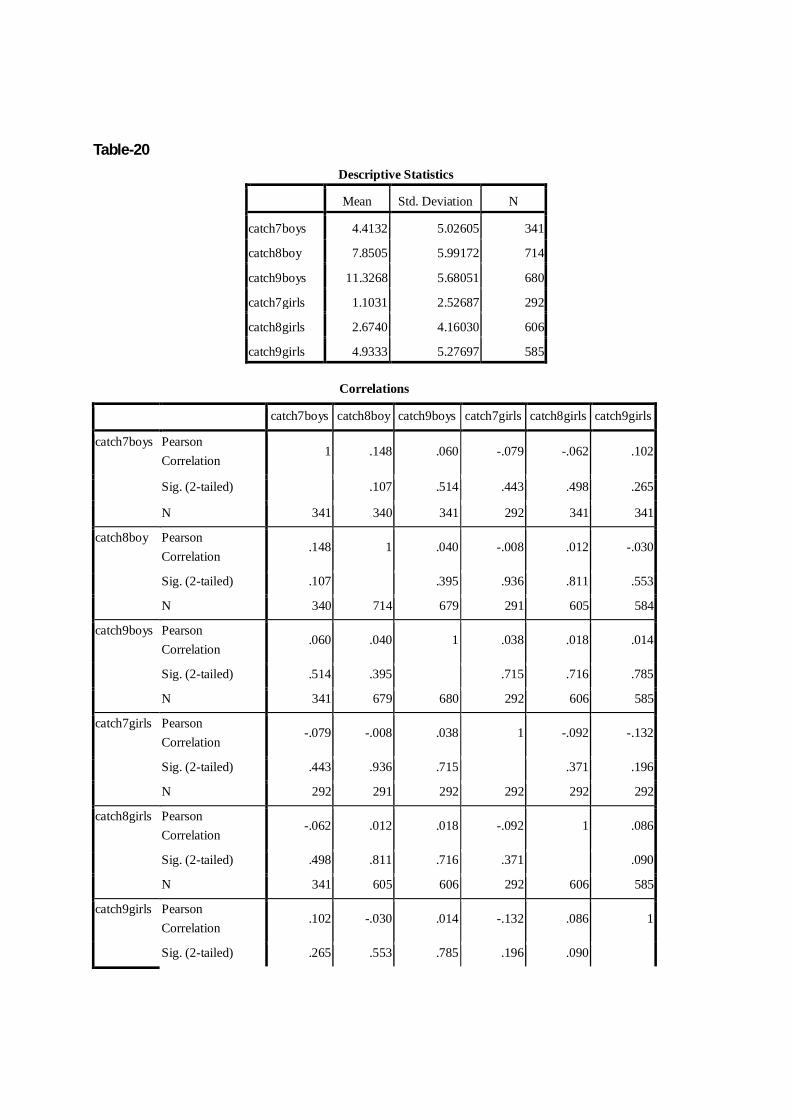
Table-20
Descriptive Statistics Mean Std. Deviation N
catch7boys 4.4132 5.02605 341
catch8boy 7.8505 5.99172 714
catch9boys 11.3268 5.68051 680
catch7girls 1.1031 2.52687 292
catch8girls 2.6740 4.16030 606
catch9girls 4.9333 5.27697 585
Correlations
catch7boys catch8boy catch9boys catch7girls catch8girls catch9girls
catch7boys Pearson Correlation
1 .148 .060 -.079 -.062 .102
Sig. (2-tailed) .107 .514 .443 .498 .265
N 341 340 341 292 341 341
catch8boy Pearson Correlation
.148 1 .040 -.008 .012 -.030
Sig. (2-tailed) .107 .395 .936 .811 .553
N 340 714 679 291 605 584
catch9boys Pearson Correlation
.060 .040 1 .038 .018 .014
Sig. (2-tailed) .514 .395 .715 .716 .785
N 341 679 680 292 606 585
catch7girls Pearson Correlation
-.079 -.008 .038 1 -.092 -.132
Sig. (2-tailed) .443 .936 .715 .371 .196
N 292 291 292 292 292 292
catch8girls Pearson Correlation
-.062 .012 .018 -.092 1 .086
Sig. (2-tailed) .498 .811 .716 .371 .090
N 341 605 606 292 606 585
catch9girls Pearson Correlation
.102 -.030 .014 -.132 .086 1
Sig. (2-tailed) .265 .553 .785 .196 .090
N 341 584 585
292
585 585
Table-21

Mean Std. Deviation N
balance7boys 1.7299 1.69587 341
balance8boys 1.7801 1.76401 714
balance9boys 1.6725 1.23096 680
balance7girls 1.5547 1.64749 292
balance8girls 1.6583 1.55856 606
balance9girls 2.0435 2.43449 585
Correlations
balance7boys
balance8boy
s
balance9boy
s balance7girls balance8girls
balance9girl
s
balance7boys Pearson Correlation 1 .208* -.117 .087 .030 .050
Sig. (2-tailed) .022 .202 .398 .741 .585
N 341 341 341 292 341 341
balance8boys Pearson Correlation .208* 1 .001 -.110 .115* .029
Sig. (2-tailed) .022 .981 .283 .020 .566
N 341 713 678 292 603 583
balance9boys Pearson Correlation -.117 .001 1 -.127 -.048 -.067
Sig. (2-tailed) .202 .981 .216 .336 .185
N 341 678 680 292 605 585
balance7girls Pearson Correlation .087 -.110 -.127 1 .032 -.016
Sig. (2-tailed) .398 .283 .216 .759 .878
N 292 292 292 292 292 292
balance8girls Pearson Correlation .030 .115* -.048 .032 1 .044
Sig. (2-tailed) .741 .020 .336 .759 .392
N 341 603 605 292 605 584
balance9girls Pearson Correlation .050 .029 -.067 -.016 .044 1
Sig. (2-tailed) .585 .566 .185 .878 .392
N 341 583 585 292 584 585
*. Correlation is significant at the 0.05 level (2-tailed).

Table-22
Descriptive Statistics Mean Std. Deviation N
Shuttle-run 10B 3.3091 1.18038 938
Shuttle-run 11B 3.8339 1.31881 969
Shuttle-run 12B 3.9090 1.52184 991
Shuttle-run 13B 3.9042 1.61506 856
Shuttle-run 14B 3.8857 1.61762 37
Correlations Ten boys Eleven boy Twelve boy Thirteen boys Fourteen boys
Shuttle-run 10B
Pearson Correlation 1 .024 -.051 .032 -.102
Sig. (2-tailed) .543 .305 .788 .729
N 938 969 991 868 37
Shuttle-run 11B
Pearson Correlation .024 1 -.042 .093 -.466
Sig. (2-tailed) .543 .395 .441 .093
N 969 969 991 868 37
Shuttle-run 12B
Pearson Correlation -.051 -.042 1 -.306** -.015
Sig. (2-tailed) .305 .395 .010 .959
N 991 991 991 868 37
Shuttle-run 13B
Pearson Correlation .032 .093 -.306** 1 .342
Sig. (2-tailed) .788 .441 .010 .232
N 868
868
868 868 37
Shuttle-run 14B
Pearson Correlation -.102 -.466 -.015 .342 1
Sig. (2-tailed) .729 .093 .959 .232
N 37 37 37 37 37
**. Correlation is significant at the 0.01 level (2-tailed).
The significant correlation was found between 12years and 13years boys in relation to Cardio-vascular endurance ability.

Table-23
Descriptive Statistics Mean Std. Deviation N
Ball T&C 10B 14.4499 4.99577 938
Ball T&C 11B 16.1818 4.03106 969
Ball T&C 12B 17.6286 2.92243 991
Ball T&C 13B 17.4648 3.34165 856
Ball T&C 14B 12.9286 6.31804 37
Correlations Tent boys Eleven boys Twelve boy Thirteen boys Fourteen boy
Ball T&C 10B Pearson Correlation 1 .143** .093 -.148 .321
Sig. (2-tailed) .000 .058 .218 .263
N 938 969 991 856 37
Ball T&C 11B Pearson Correlation .143** 1 .275** .241* .070
Sig. (2-tailed) .000 .000 .043 .812
N 969 969 991 856 37
Ball T&C 12B Pearson Correlation .093 .275** 1 .050 -.344
Sig. (2-tailed) .058 .000 .679 .229
N 991 991 991 856 37
Ball T&C 13B Pearson Correlation -.148 .241* .050 1 .433
Sig. (2-tailed) .218 .043 .679 .122
N 856 856 856 856 37
Ball T&C 14B Pearson Correlation .321 .070 -.344 .433 1
Sig. (2-tailed) .263 .812 .229 .122
N 37 37 37 37 37
**. Correlation is significant at the 0.01 level (2-tailed).
*. Correlation is significant at the 0.05 level (2-tailed).
The significant correlations were found among 10years, 11years, 12years, and 13years boys in coordination ability .

Table-24
Descriptive Statistics Mean Std. Deviation N
SST. 10B 2.0348 2.03111 938
SST.11B 2.6351 2.67866 969
SST.12B 3.1542 3.29294 991
SST. 13B 3.4085 3.97809 856
SST. 14B 2.4214 1.97200 37
Correlations Ten boys Eleven boy Twelve boy Thirteen boys Fourteen boy
SST. 10B Pearson Correlation 1 -.047 .001 .100 .111
Sig. (2-tailed) .233 .982 .407 .706
N 938 969 991 856 37
SST. 11B Pearson Correlation -.047 1 -.066 -.024 .312
Sig. (2-tailed) .233 .184 .841 .277
N 969 969 991 856 37
SST. 12B Pearson Correlation .001 -.066 1 .152 -.052
Sig. (2-tailed) .982 .184 .206 .860
N 991 991 991 856 37
SST. 13B Pearson Correlation .100 -.024 .152 1 -.127
Sig. (2-tailed) .407 .841 .206 .664
N 856 856 856 856 37
SST. 14B Pearson Correlation .111 .312 -.052 -.127 1
Sig. (2-tailed) .706 .277 .860 .664
N 37 37 37 37 37
The significant correlation was not found in any age group of boys in relation to balance ability.

Table-25
Descriptive Statistics
Mean Std.
Deviation N
30M. Dash 10G 6.8157 .75733 685
30M. Dash 11G 6.5207 .66358 820
30M. Dash 12G 6.5594 .74130 796
30M. Dash 13G 6.8558 .94123 512
30M. Dash 14G 7.3287 .91385 19
Significant co-relation was found between 10years and 11years girls in 30M. Dash
Correlations FR10G FR11G FR12G FR13G FR14G
30M. Dash 10G
Pearson Correlation 1 .088* .002 .197 -.199
Sig. (2-tailed) .042 .975 .357 .637
N 685 820 796 512 19
30M. Dash 11G
Pearson Correlation .088* 1 -.004 .252 -.461
Sig. (2-tailed) .042 .935 .235 .251
N 820 820 796 512 19
30M. Dash 12G
Pearson Correlation .002 -.004 1 .258 .317
Sig. (2-tailed) .975 .935 .223 .444
N 796 796 796 512 19
30M. Dash 13G
Pearson Correlation .197 .252 .258 1 .336
Sig. (2-tailed) .357 .235 .223 .416
N 512 512 512 512 19
30M. Dash 14G
Pearson Correlation -.199 -.461 .317 .336 1
Sig. (2-tailed) .637 .251 .444 .416
N 19 19 19 19 19
*. Correlation is significant at the 0.05 level (2-tailed).

Table-26
Descriptive Statistics
Mean Std.
Deviation N
Standing BJ10G 1.0640 .16885 685
Standing BJ11G 1.1299 .18298 820
Standing BJ12G 1.1351 .18713 796
Standing BJ13G 1.1438 .26624 512
Standing BJ14G .9475 .23341 19
Correlations BJ10G BJ11G BJ12G BJ13G BJ14G
Standing BJ10G
Pearson Correlation 1 .081 -.038 -.099 .212
Sig. (2-tailed) .061 .471 .644 .614
N 685 820 796 512 19
Standing BJ11G
Pearson Correlation .081 1 .047 .177 .826*
Sig. (2-tailed) .061 .382 .408 .012
N 820 820 795 512 19
Standing BJ12G
Pearson Correlation -.038 .047 1 .090 .618
Sig. (2-tailed) .471 .382 .677 .103
N 796 795 796 512 19
Standing BJ13G
Pearson Correlation -.099 .177 .090 1 .739*
Sig. (2-tailed) .644 .408 .677 .036
N 512 512 512 512 19
Standing BJ14G
Pearson Correlation .212 .826* .618 .739* 1
Sig. (2-tailed) .614 .012 .103 .036
N 19 19 19 19 19
*. Correlation is significant at the 0.05 level (2-tailed).
Significant correlations were found among 11years, 13years and 14years girls in Standing Broad Jump.
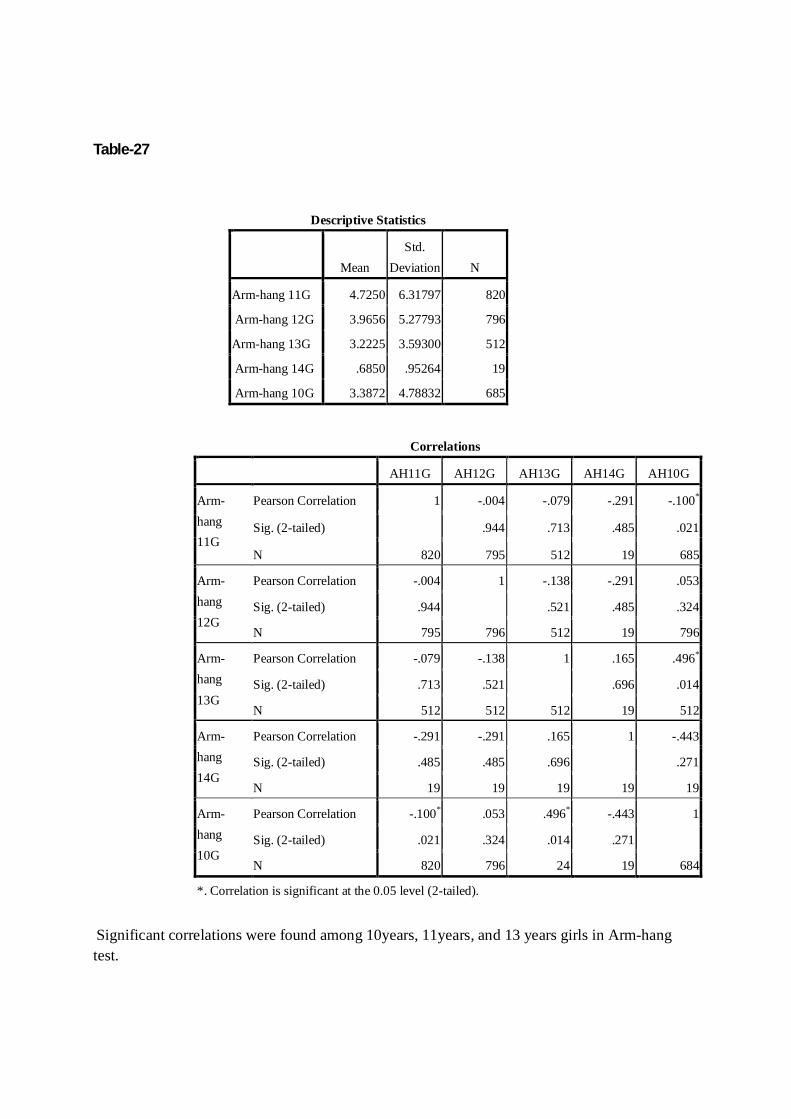
Table-27
Descriptive Statistics
Mean Std.
Deviation N
Arm-hang 11G 4.7250 6.31797 820
Arm-hang 12G 3.9656 5.27793 796
Arm-hang 13G 3.2225 3.59300 512
Arm-hang 14G .6850 .95264 19
Arm-hang 10G 3.3872 4.78832 685
Correlations AH11G AH12G AH13G AH14G AH10G
Arm-hang 11G
Pearson Correlation 1 -.004 -.079 -.291 -.100*
Sig. (2-tailed) .944 .713 .485 .021
N 820 795 512 19 685
Arm-hang 12G
Pearson Correlation -.004 1 -.138 -.291 .053
Sig. (2-tailed) .944 .521 .485 .324
N 795 796 512 19 796
Arm-hang 13G
Pearson Correlation -.079 -.138 1 .165 .496*
Sig. (2-tailed) .713 .521 .696 .014
N 512 512 512 19 512
Arm-hang 14G
Pearson Correlation -.291 -.291 .165 1 -.443
Sig. (2-tailed) .485 .485 .696 .271
N 19 19 19 19 19
Arm-hang 10G
Pearson Correlation -.100* .053 .496* -.443 1
Sig. (2-tailed) .021 .324 .014 .271
N 820 796 24 19 684
*. Correlation is significant at the 0.05 level (2-tailed).
Significant correlations were found among 10years, 11years, and 13 years girls in Arm-hang test.
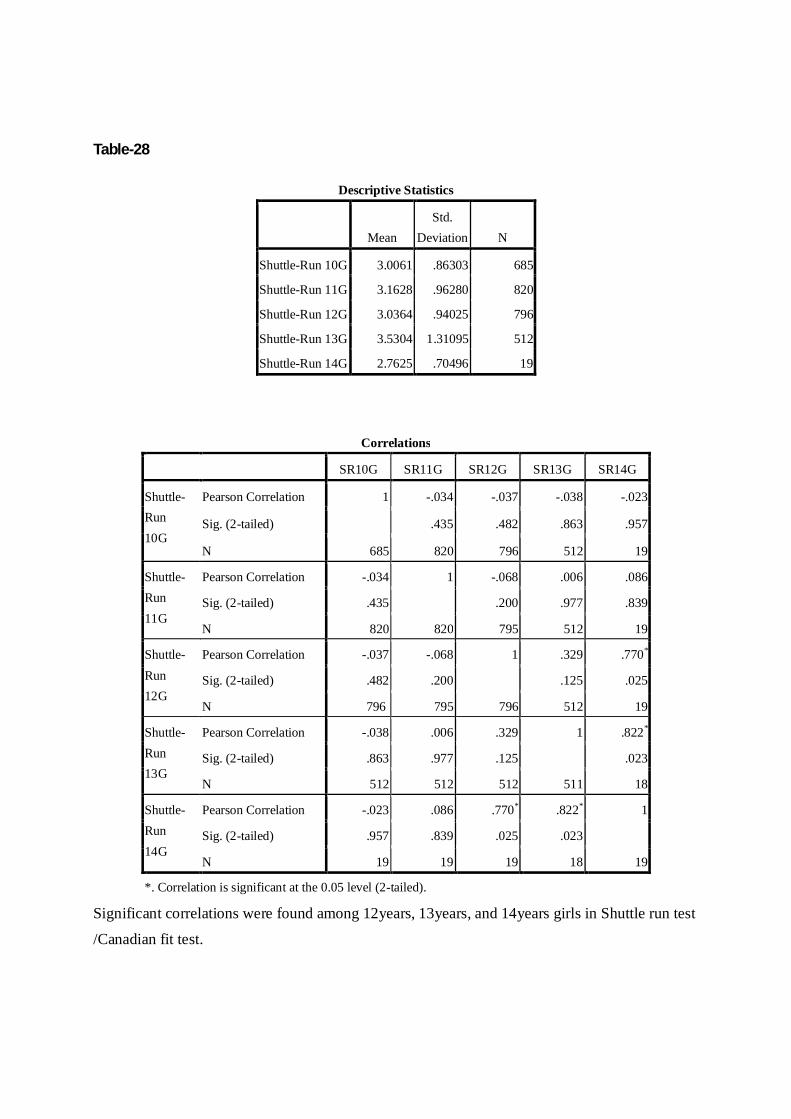
Table-28
Descriptive Statistics
Mean Std.
Deviation N
Shuttle-Run 10G 3.0061 .86303 685
Shuttle-Run 11G 3.1628 .96280 820
Shuttle-Run 12G 3.0364 .94025 796
Shuttle-Run 13G 3.5304 1.31095 512
Shuttle-Run 14G 2.7625 .70496 19
Correlations SR10G SR11G SR12G SR13G SR14G
Shuttle-Run 10G
Pearson Correlation 1 -.034 -.037 -.038 -.023
Sig. (2-tailed) .435 .482 .863 .957
N 685 820 796 512 19
Shuttle-Run 11G
Pearson Correlation -.034 1 -.068 .006 .086
Sig. (2-tailed) .435 .200 .977 .839
N 820 820 795 512 19
Shuttle-Run 12G
Pearson Correlation -.037 -.068 1 .329 .770*
Sig. (2-tailed) .482 .200 .125 .025
N 796 795 796 512 19
Shuttle-Run 13G
Pearson Correlation -.038 .006 .329 1 .822*
Sig. (2-tailed) .863 .977 .125 .023
N 512 512 512 511 18
Shuttle-Run 14G
Pearson Correlation -.023 .086 .770* .822* 1
Sig. (2-tailed) .957 .839 .025 .023
N 19 19 19 18 19
*. Correlation is significant at the 0.05 level (2-tailed).
Significant correlations were found among 12years, 13years, and 14years girls in Shuttle run test
/Canadian fit test.

Table-29
Ball throw & catch Descriptive Statistics Mean Std. Deviation N
TC10G 7.6581 5.92770 685
TC11G 10.4517 6.04010 820
TC12G 12.9023 5.48347 796
TC13G 12.8333 5.28876 512
TC14G 8.6250 8.78208 19
Correlations TC10G TC11G TC12G TC13G TC14G
TC10G Pearson Correlation 1 -.046 .021 -.213 -.220
Sig. (2-tailed) .291 .698 .317 .601
N 685 819 795 512 19
TC11G Pearson Correlation -.046 1 .023 .333 .034
Sig. (2-tailed) .291 .665 .112 .936
N 819 820 795 512 19
TC12G Pearson Correlation .021 .023 1 -.061 -.295
Sig. (2-tailed) .698 .665 .778 .478
N 795 795 796 512 19
TC13G Pearson Correlation -.213 .333 -.061 1 -.284
Sig. (2-tailed) .317 .112 .778 .495
N 512 512 512 512 19
TC14G Pearson Correlation -.220 .034 -.295 -.284 1
Sig. (2-tailed) .601 .936 .478 .495
N 19 19 19 19 19
The significant correlation was not found in any age groups of girls in relation to coordination ability.

Table-30
Stork stand Descriptive Statistics Mean Std. Deviation N
SST10G 2.8202 3.19672 685
SST11G 3.2544 3.73465 820
SST12G 3.2877 3.97626 796
SST13G 2.6200 2.79400 512
SST14G 1.9575 .51411 19
Correlations BT10G BT11G BT12G BT13G BT14G
SST.10G Pearson Correlation 1 -.032 .088 -.286 .271
Sig. (2-tailed) .462 .100 .176 .517
N 685 819 796 512 19
SST. 11G Pearson Correlation -.032 1 -.056 .165 -.468
Sig. (2-tailed) .462 .291 .440 .242
N 819 820 795 512 19
SST. 12G Pearson Correlation .088 -.056 1 -.112 .095
Sig. (2-tailed) .100 .291 .603 .824
N 795 795 796 512 19
SST.13G Pearson Correlation -.286 .165 -.112 1 .120
Sig. (2-tailed) .176 .440 .603 .777
N 512 512 512 512 19
SST. 14G Pearson Correlation .271 -.468 .095 .120 1
Sig. (2-tailed) .517 .242 .824 .777
N 19 19 19 19 19
The significant correlation was not found in any age groups of girls in relation to balance ability.

Table-31 Norms/Grade of Selected physical fitness component test for school going children aged from 7 to 13 years.
Girls 30 meters. dash running
Percentile 7 years 8 years 9 years 10 years 11 years 12 years 13 years sec Sec sec Sec sec sec Sec Poor 8.95above 8.61above 8.25above 8.09above 7.6above 7.70above 8.64above Average 8.94-7.83 8.60-7.56 8.24-7.36 8.08-7.21 7.59-6.84 7.69-6.90 8.63-7.48 Good 7.82-6.58 7.55-.6.61 7.35-6.44 7.20-6.31 6.83-6.16 6.89-6.08 7.47-6.20 Excellent 6.58bellow 6.61bellow 6.44bellow 6.31bellow 6.16bellow 6.08bellow 6.20bellow
Table-32 standing broad jump / girls
Percentile 7 years 8 years 9 years 10 years 11 years 12 years 13 years meters Meters meters Meters meters meters Meters Poor 0.67bellow 0.68bellow 0.75bellow 0.80bellow 0.82bellow 0.82bellow 0.76bellow Average 0.68-0.80 0.69-0.82 0.76-0.89 0.81-0.92 0,82-1.11 0.83-0.98 0.77-0.94 Good 0.81-1.00 0.83-1.07 0.90-1.14 0.93-1.22 1.12-1.28 0.99-1.29 0.95-1.31 Excellent Above1.01 Above1.08 Above1.15 Above1.23 Above1.29 Above1.30 Above1.32
Table-33 arm hang-chin ups / girls
Percentile 7 years 8 years 9 years 10 years 11 years 12 years 13 years Sec Sec sec Sec sec sec Sec Poor 0 0 0 0 0 0 0 Average 0.01-3.54 0.01-2.59 0.01-2.10 0.01-1.91 0.01- 3.12 0.01- 2.06 0.01-2.78 Good 3.55-6.03 3.00-5.42 2.11- 5.45 1.92-5.02 3.13-6.85 2.07- 5.63 2.79-4.13
Excellent Above6.04 Above 5.43 Above5.46 Above 5.03 Above 6.86 Above 5.64 Above 4.14

Table-34 20m. ping-pong test /girls Percentile 7 years 8 years 9 years 10 years 11 years 12 years 13 years level Level level Level level level Level Poor 1.7 bellow 1.6bellow 2.1bellow 2.1bellow 2.2bellow 2.2bellow 2.3bellow Average 1.8-2.3 1.7-2.2 2.2-2.4 2.2-2.3 2.3- 2.4 2.3-2.5 2.4-2.7 Good 2.4-2.6 2.3-2.7 2.5-3.1 2.4-3.4 2.5-3.4 2.6-3.4 2.8- 4.1 Excellent Above 2.7 Above2.8 Above3.2 Above3.5 Above3.5 Above3.5 Above 4.2
Table-35
ball throw & catch / girls
Percentile 7 years 8 years 9 years 10years 11 years 12 years 13 years no. no. no. no. no. no. no. Poor 0 0 0 0 0 2-10 6-10 Average 1 1 1 1-2 1-5 11-14 11-14 Good 2 2-4 2-8 3-12 6-16 15-17 15-24 Excellent Above 3 Above-5 Above 9 Above 13 Above 17 Above 18 Above 25
Table-36 Grade:- stork stand balance / girls
Percentile 7 years 8 years 9 years 10 years 11 years 12 years 13 years Sec Sec sec Sec sec sec Sec Poor 0.77 0.56 0.47 0.56 220 0.81 0.85 Average 0.78- 120 0.84-123 0.98-143 112-180 221-289 142-208 124-163 Good 130 -171 124-189 144-239 180-314 290-350 209-348 164-252 Excellent above172 above189 above239 above315 Above350 above349 above253
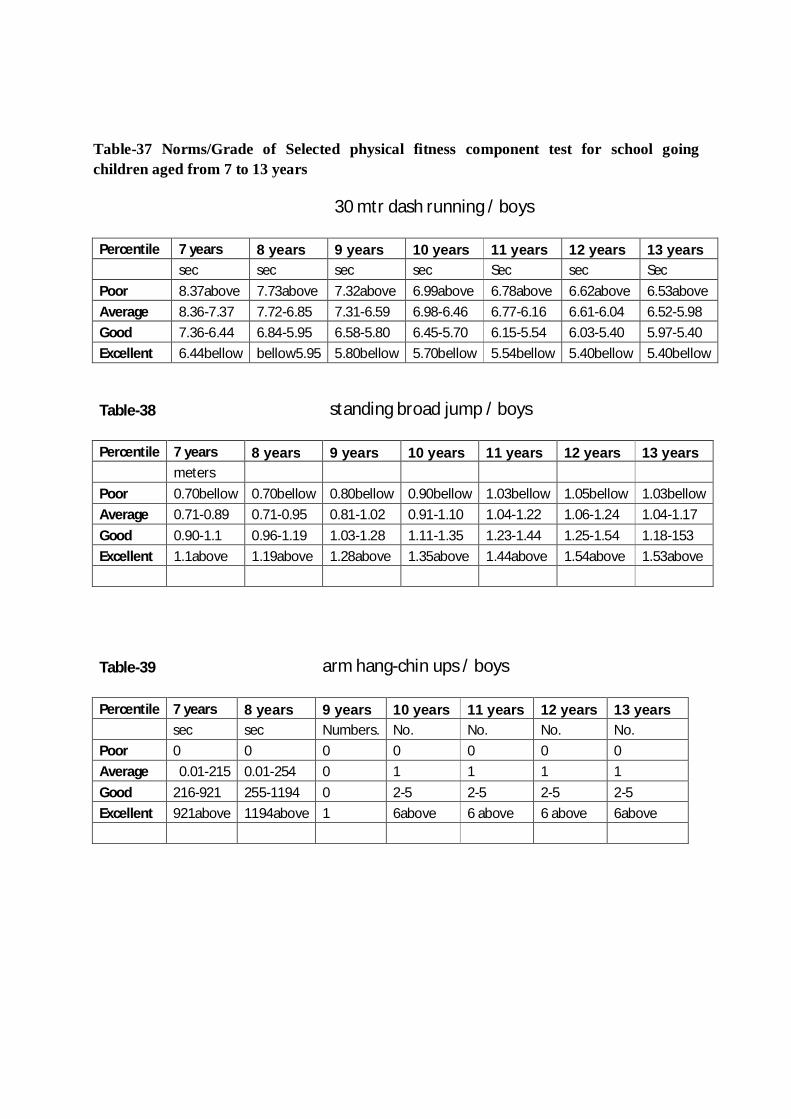
Table-37 Norms/Grade of Selected physical fitness component test for school going children aged from 7 to 13 years
30 mtr dash running / boys
Percentile 7 years 8 years 9 years 10 years 11 years 12 years 13 years sec sec sec sec Sec sec Sec Poor 8.37above 7.73above 7.32above 6.99above 6.78above 6.62above 6.53above Average 8.36-7.37 7.72-6.85 7.31-6.59 6.98-6.46 6.77-6.16 6.61-6.04 6.52-5.98 Good 7.36-6.44 6.84-5.95 6.58-5.80 6.45-5.70 6.15-5.54 6.03-5.40 5.97-5.40 Excellent 6.44bellow bellow5.95 5.80bellow 5.70bellow 5.54bellow 5.40bellow 5.40bellow
Table-38 standing broad jump / boys
Percentile 7 years 8 years 9 years 10 years 11 years 12 years 13 years meters
Poor 0.70bellow 0.70bellow 0.80bellow 0.90bellow 1.03bellow 1.05bellow 1.03bellow Average 0.71-0.89 0.71-0.95 0.81-1.02 0.91-1.10 1.04-1.22 1.06-1.24 1.04-1.17 Good 0.90-1.1 0.96-1.19 1.03-1.28 1.11-1.35 1.23-1.44 1.25-1.54 1.18-153 Excellent 1.1above 1.19above 1.28above 1.35above 1.44above 1.54above 1.53above
Table-39 arm hang-chin ups / boys
Percentile 7 years 8 years 9 years 10 years 11 years 12 years 13 years sec sec Numbers. No. No. No. No. Poor 0 0 0 0 0 0 0 Average 0.01-215 0.01-254 0 1 1 1 1 Good 216-921 255-1194 0 2-5 2-5 2-5 2-5 Excellent 921above 1194above 1 6above 6 above 6 above 6above

Table-40 20 M. ping-pong test / boys
Percentile 7 years 8 years 9 years 10 years 11 years 12 years 13 years level level level level Level level level Poor 1.5below 2.1bellow 2.1bellow 2.1bellow 2.3bellow 2.2 2.3bellow Average 1.6-2.3 2.2-2.4 2.2-2.4 2.2-2.4 2.4-2.7 2.3-2.6 2.4-2.7 Good 2.4-2.7 2.5-3.4 2.5-3.4 2.5-3.8 2.8-4.6 2.5-4.7 2.8-4.8 Excellent 2.7above 3.4above 3.4above 3.8above 4.6above 4.7above 4.8above
Table-41 ball throw & catch / boys
Percentile 7 years
8 years
9 years
10 years
11 years
12 years
13 years
no. no. no. no. no. no. no. Poor 0 0 1 5 8 11.55 10 Average 0 2 7 12 15 17 17 Good 3 8 12 16 17 18.5 19 Excellent 8 13 16 18 19 20 20
Table-42 stork stand balance / boys
Percentile 7 years
8 years
9 years
10 years
11 years
12 years
13 years
sec sec sec sec sec sec sec Poor 0.33 0.47 0.5 0.54 0.73 0.82 0.96 Average 0.78 0.83 0.9 0.98 1.24 1.43 1.49 Good 1.25 1.31 1.32 1.48 1.85 2.1 2.28 Excellent 1.9 2.03 2.08 2.35 2.83 3.37 3.63
5.21 4.87 3.96 5.28 7.17 9.44 8.1
DISCUSSION:
The present study is a sincere effort in establishing standards of the evaluation of physical fitness components of school going children between aged 7 to 13 years. For this purpose data was collected and statistical treatment was done on the collected data. Standard test were selected and testing the physical ability of students. All tests were included after ensuring content validity and reliability. All the scores were tested for normality before their norms were calculated. After which the scores were converted into norms by computing them into percentile and co-relation matrix using SPSS. From the analysis and raw score obtained grading scales of the selected physical fitness components tests were also prepared. The grading scale prepared using rank order method using the scores which were divided into four groups of 25% each and grading system was prepared, i.e. Excellent, Good, Average, and Poor.
The above table of co-relation metrics shows that the performances on 30 meter Dash, standing broad jump, 20M. Shuttle run, chin up hang/chin ups, ball throw and catch, and stork stand are significantly correlated with age and sex at 0.05 level where as other test performance on 30 meter Dash, standing broad jump, 20M. Shuttle run, chin up hang/chin ups, ball throw and catch are significantly correlated with boys ages at 0.01 level. It could be seen from above table speed ability and cardio-vascular endurance ability shown significantly correlated with age in both boys and girls age groups. But the stork stands i.e. static balance ability shown significant correlation in girls age groups between 7 to 11 years only at 0.05 level.
CONCLUSION:
The results showed that high to moderate correlation only existed between limited numbers of physical fitness components. In other words, every physical fitness components had its unique characteristics and measurement value. Girls also showed high percentile score as compared to boys in balance ability as their age increased. By using 6sigma percentile score norms are prepared for school going children aged from 7 years to 13 years in 6 physical fitness components for future study.
The selected physical fitness variables of school going children aged from 7 to 13 are measurable.
The norms developed can be used as criteria for testing the fitness of school going children.
The grading table prepared can be used to differentiate the children. A similar study can be conducted to assess and evaluate the physical fitness of different
sportspersons, other age group students, and other districts of Maharashtra, and India.

CONTRIBUTION TO THE SOCIETY:-
The knowledge evolved from this study seems to be new as far as norms of school going children is concerned and literature of Indian sports and physical education. In fact, it is directly helpful to the coaches of different games and sports, trainees, physical education teachers, doctors, and parents of the society. This could be an additional contribution of sports and physical education knowledge in the field of sports literature .

REFERENCES:
1. Liemohn W, Martin SB, Pariser G (1997). The effect of ankle posture on sit-and-reach test performance in young adults. Journal of Strength and Conditioning Research, 11, 239-241. YMCA of the USA (2000), YMCA Fitness Testing and Assessment Manual, 4th Edition, 158-160.
2. Kendrick KH, Titlow LW, Sherwwod N (2004). Concurrent Validity of the Beep Test in Male College Soccer Players. Research Quarterly for Exercise and Sport. 75(1) Supl, A-39-40.
3. Willgoose, C.E., Evaluation in Health Education and Physical Education, McGraw-Hill Book Company, Inc. 1961.
4. Franklin BA, Swantek KI, Grais SL, Johnstone KS, Gordon S, Timmis GC. Field test estimation of maximal oxygen consumption in wheelchair users. Arch Phys Med Rehabil. 1990;71:574-578.
5. American College of Sports Medicine, (2000) ACSM's Guidelines for Exercise Testing and Prescription, Sixth Edition, 84-85.
6. The Cooper Institute for Aerobics Research (1999). Common questions regarding physical fitness tests, standards, and programs in law enforcement. Dallas Texas, 5-6.
7. JANZ, K. F., J. D. DAWSON, and L. T. MAHONEY. Tracking physical fitness and physical activity from childhood to adolescence: the Muscatine study. Med. Sci. Sports Exerc., Vol. 32, No. 7, pp. 1250-1257, 2000.
8. Normative Physical Fitness Scores for Community-Dwelling Older Adults, Chen, Huey-Tzy; Lin, Chien-Hsun*; Yu, Li-Hui**, Journal of Nursing Research: March 2009 - Volume 17 - Issue 1 - pp 30-41
9. The peak oxygen uptake of healthy Turkish children with reference to age and sex: a pilot study Yeþim Gürsel, Birkan Sonel, Haydar Gök, Peyman Yalçýn Department of Physical Medicine and Rehabilitation, Ankara University Faculty of Medicine, Ankara, Turkey
WEBSITES:
WWW: http://fairtest.org/facts/readiness.html WWW: http://fitness.gov WWW: http:// sportstest.co.uk WWW: http:// righthealth.com WWW: http:// physical fitness.com WWW: http:// physical trained.com WWW: http:// exrx.net/testing/youth norms.html WWW: http:// Wikipedia.org/wiki/test.html WWW: http:// kidsdata.org
WWW: http://geocities.com/athnes/acropolis/7103/slacq.html
WWW: http://newswise.com/articles/1999/1/signlang.osu.html
WWW: http://nidcd.nih.gov/health/parents/speechandlanguage.html
WWW: http://polity.org.za/html/govdocs/discuss/curric1.html

WWW: http://www.aap.org/policy/00649.html
WWW: http://www.bris.ac.ukidoes/teaching/psy/psydeaf_lecture_10.html
WWW: http://www.ci.shrewsbury.ma.us/sps/schools/beal/readiness.html
WWW: http://www.ecrp.uiuc.edu/v2n2/saluja.html
WWW: http://www.epnet.com/citation.asp.html
WWW: http://www.geocities.com/babysigning/advantages.html.
WWW: http://www.geocities.com/babysigning/whysign.html
WWW: http://www.kidsource.com/kidsource/content/readiness_for_K.html
WWW: http://www.littlepeople.co.za/education_guide/article_01.html
WWW: http://www.suntimes.coza/2002/01/13/news/news05.asp.html
WWW: http://specialed.about.com/od/multipledisabilities/amultiple.htm 2006.
WWW: http://www.fairtest.org/facts/readiness.html 1982.