on-line monitoring for control of a pilot-scale sequencing ... · on-line monitoring for control of...
TRANSCRIPT

On-line monitoring for control of a pilot-scale sequencingbatch reactor using a submersible UV/VIS spectrometer
G. Langergraber*, J.K. Gupta**, A. Pressl*, F. Hofstaedter**, W. Lettl**, A. Weingartner** andN. Fleischmann***
* Institute for Sanitary Engineering and Water Pollution Control, University of Natural Resources and AppliedLife Sciences, Vienna, Muthgasse 18, A-1190 Vienna, Austria (E-mail: [email protected])
** s::can Messtechnik GmbH, Herminengasse 10, A-1020 Vienna, Austria (E-mail: [email protected])
*** hydrophil, Lerchenfeldergürtel 43, Top 6/3, A-1160 Vienna, Austria (E-mail: [email protected])
Abstract A submersible UV/VIS spectrometer was used to monitor a pilot-scale sequencing batch reactor(SBR). The instrument utilises the whole UV/VIS range between 200 and 750 nm. With just one singleinstrument nitrate, organic matter and suspended solids can be measured simultaneously. The spectrometeris installed directly in the reactor, measures in real-time, and is equipped with an auto-cleaning system usingpressured air. The paper shows the calibration results for measurements in the SBR tank, time series fortypical SBR cycles, and proposes possible ways for optimisation of the operation by using thesemeasurements.Keywords Control; in-situ; on-line; real-time; SBR; UV/VIS spectroscopy
IntroductionMonitoring and control of sequencing batch reactors (SBRs) is a very active field ofresearch nowadays. Several strategies have been applied to improve the performance ofSBR systems including: soft sensors (Zyngier et al., 2001), computer simulation (Mikoszet al., 2001), feedforward aeration control (Wett and Ingerle, 2001), and on-line control ofORP, pH and DO (Andreottola et al., 2001). This paper suggests using a submersibleUV/VIS spectrometer for on-line monitoring and control of a SBR.
The instrument used is a submersible spectrometer that utilises the whole UV/VIS rangebetween 200 and 750 nm. It is installed directly in the reactor and measures several param-eters simultaneously in real-time. Using nitrate nitrogen measurements it is possible tomonitor and control nitrification and denitrification. Suspended solids measurements canbe used to optimise settling times. The paper shows calibration results and time series fortypical SBR cycles.
Materials and methodsThe pilot-scale SBR
The pilot-scale SBR is located in the technical laboratory of the Institute for SanitaryEngineering and Water Pollution Control, Vienna University of Natural Resources andApplied Life Sciences, and has a maximum volume of 1.5 m3 with an exchange ratio of about30%. The SBR tank has a rectangular shape. The technical equipment consists of a stirrer, anair diffuser (rubber membrane), a water level control, and a swimming decant device. Theplant is automatically run by a computer and a LABVIEW®-programme. The typical opera-tion cycle of the pilot-scale SBR consists of the following phases: settling (30 min), with-drawal (ca. 5 min), filling and mixing (ca. 15 min), mixing (45 min), and aeration (180 min).Filling and withdrawal are controlled by water level. Usually the pilot-scale SBR is operatedwith this fixed time schedule. Additionally the SBR can be operated manually.
Water S
cience and Technology Vo
l 50 No
10 pp
73–80 © IW
AP
ublishing 2004
73

The technical laboratory is connected to a nearby sewer. Typical concentrations of themechanically pre-treated influent wastewater are as follows: 400 mg COD/l, 60 mg NH4-N/l and 8 mg TP/l.
The UV/VIS spectrometer
The submersible UV/VIS spectrometer (Figure 1, spectro::lyser by s::can Messtechnik,Vienna) has a length of about 0.6 m and a diameter of 44 mm. The instrument records lightattenuation in the wavelength region between 200 and 750 nm (256 pixel with a Xenonflash lamp as a light source). The length of the measurement path available is from 1 to 100mm opening a wide range of applications from ultra-pure waters (DOC > 10 µg/l) up to con-centrated wastewaters with a COD of several 1,000 mg/l. A path length of 1 mm was usedfor the measurements in the SBR tank. Spectrometric measurement methods are defined forsingle substances (e.g. nitrate, nitrite, benzene, phenol) as well as for surrogate parameters(e.g. SAC254, turbidity, TSSeq, CODeq, TOCeq, DOCeq).
A single measurement typically takes about 15 s. The results are displayed and/or com-municated in real-time. The measurement takes place directly in-situ without sampling orsample treatment. Thus, measurement errors due to sampling, transport, storage, dilutionetc. are not relevant. The instrument is equipped with an auto-cleaning system using pres-surised air that prevents film growth on the optical parts of the instrument. An ex-proof ver-sion is available for sewer and industrial applications in explosive atmosphere.
Up to now the instrument has been successfully applied for measurements in sewers(e.g. Hofstaedter et al., 2003; Lorenz et al., 2002), wastewater treatment plants for munici-pal and industrial wastewater (e.g. Winkler et al., 2002; Langergraber et al., 2004, 2003b),river water (e.g. Fleischmann et al., 2002), and groundwater (e.g. Langergraber et al.,2002).
Sensor calibration
For typical waters (e.g. municipal wastewater – raw and treated, river water, drinkingwater, . . .) a so-called “global calibration” is provided as default configuration of theinstrument. Usually high precision can be achieved using this standard parameter set. Formany purposes, such as plant control, precision is more important than trueness and theglobal calibration often delivers sufficient results. Using a second calibration step (localcalibration) improvements concerning trueness, precision and long-term stability of theresults can be achieved.
The global calibration is based on a partial-least-square (PLS) regression for the param-eters of concern. The broad range of available wavelengths allows high flexibility for thechoice of the best correlating wavelengths for the calibration function and the avoidance ofcross-sensitivities. This is an advantage compared to systems, which provide absorption
G. Langergraber et al.
74
lamp electronics withXenon flash lamp
256 pix array detector withµprocessor electronics
enla
rgin
g op
tics
colle
ctin
g op
tics
beam
alte
rnat
or
inse
rts
for
adap
tors
of
optic
al p
ath
clea
ning
nozz
les
measuring beam
reference beam
Figure 1 The submersible UV/VIS spectrometer
measurements of a single or two wavelengths only. A detailed description of the calibrationprocedure implemented is given in Langergraber et al. (2003a).
Due to the different composition of wastewaters, e.g. due to industrial inlets, a localcalibration can be required. The local calibration is based on grab samples analysed for theparameters of interest and can be performed without demounting of the probe. The localcalibration can be performed either by running a complete calibration procedure based onPLS regression (advanced local calibration) or by a simple change of the slope-intercept ofthe regression function that can be easily done by the user and most of the time this isenough to improve the correlation significantly.
Results and discussionCalibration results
The sampling for the local calibration was done at the end of the mixing period where lownitrate nitrogen concentrations occur. The settled sludge samples were mixed with a stan-dard nitrate nitrogen solution of 50 mg/l. The UV/VIS absorption spectra of these mixtureswere used for calibration. The results were obtained with advanced local calibration (PLSregression).
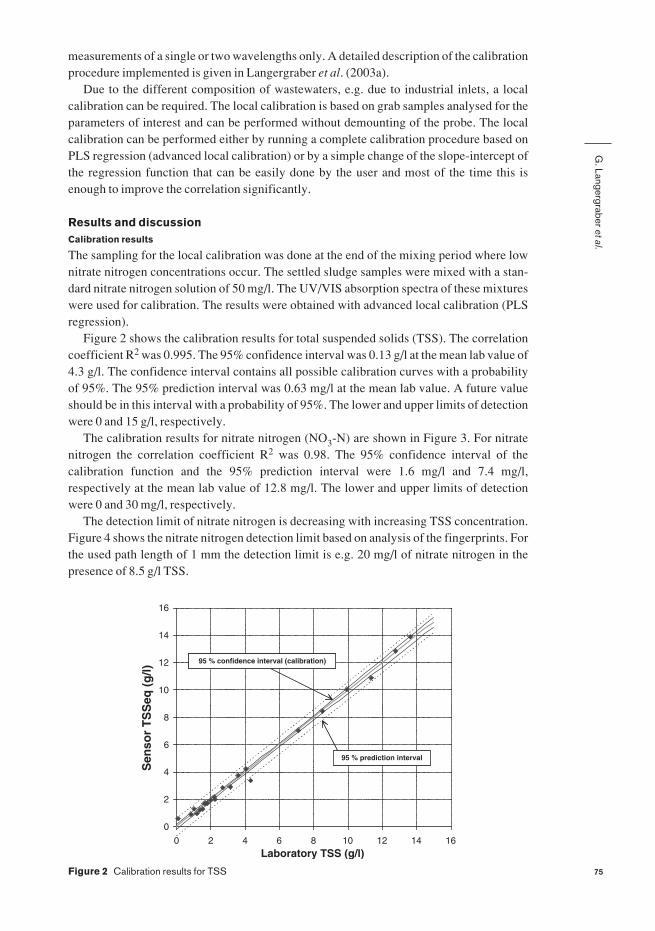
Figure 2 shows the calibration results for total suspended solids (TSS). The correlationcoefficient R2 was 0.995. The 95% confidence interval was 0.13 g/l at the mean lab value of4.3 g/l. The confidence interval contains all possible calibration curves with a probabilityof 95%. The 95% prediction interval was 0.63 mg/l at the mean lab value. A future valueshould be in this interval with a probability of 95%. The lower and upper limits of detectionwere 0 and 15 g/l, respectively.
The calibration results for nitrate nitrogen (NO3-N) are shown in Figure 3. For nitratenitrogen the correlation coefficient R2 was 0.98. The 95% confidence interval of thecalibration function and the 95% prediction interval were 1.6 mg/l and 7.4 mg/l,respectively at the mean lab value of 12.8 mg/l. The lower and upper limits of detectionwere 0 and 30 mg/l, respectively.
The detection limit of nitrate nitrogen is decreasing with increasing TSS concentration.Figure 4 shows the nitrate nitrogen detection limit based on analysis of the fingerprints. Forthe used path length of 1 mm the detection limit is e.g. 20 mg/l of nitrate nitrogen in thepresence of 8.5 g/l TSS.
G. Langergraber et al.
75
0
2
4
6
8
10
12
14
16
0 2 4 6 8 10 12 14 16Laboratory TSS (g/l)
Sen
sor
TS
Seq
(g
/l)
95 % confidence interval (calibration)
95 % prediction interval
Figure 2 Calibration results for TSS

Additionally a calibration was performed for filtered COD (CODf, Figure 5). Theobtained correlation coefficient R2 for CODf was 0.90, the 95% confidence interval of thecalibration function 24 mg/l at the mean lab value of 185 mg/l, and the 95% predictioninterval 93 mg/l. The lower and upper limits of detection were 20 and 540 mg/l, respective-ly. Although the focus of the experiments was on nitrate and suspended solids measurementand less data were available compared to the calibrations for NO3-N and TSS the resultsobtained for CODf were quite good.
Time series
Figure 6 shows a typical result obtained for a single SBR cycle. Five characteristic pointscan be observed:1. The TSS concentration drops rapidly after switching off the aeration. In this case the
instrument was installed 10 cm below the minimum water level (level after withdrawal)of the SBR. Once the low TSS concentration is reached settling is finished and withdraw-al can start. During settling and withdrawal the NO3-N concentration stays constant.
G. Langergraber et al.
76
-5
0
5
10
15
20
25
30
-5 0 5 10 15 20 25 30Laboratory NO3-N (mg/l)
Sen
sor
NO
3-N
eq (
mg
/l)
95 % confidence interval (calibration)
95 % prediction interval
Figure 3 Calibration results for NO3-N (o . . . outlier, TSS concentration too high)
0
5
10
15
20
25
30
0 5 10
TSS (g/l)
NO
3-N
(m
g/l)
Limit of detection
Fingerprints OK
Figure 4 Detection limit NO3-N
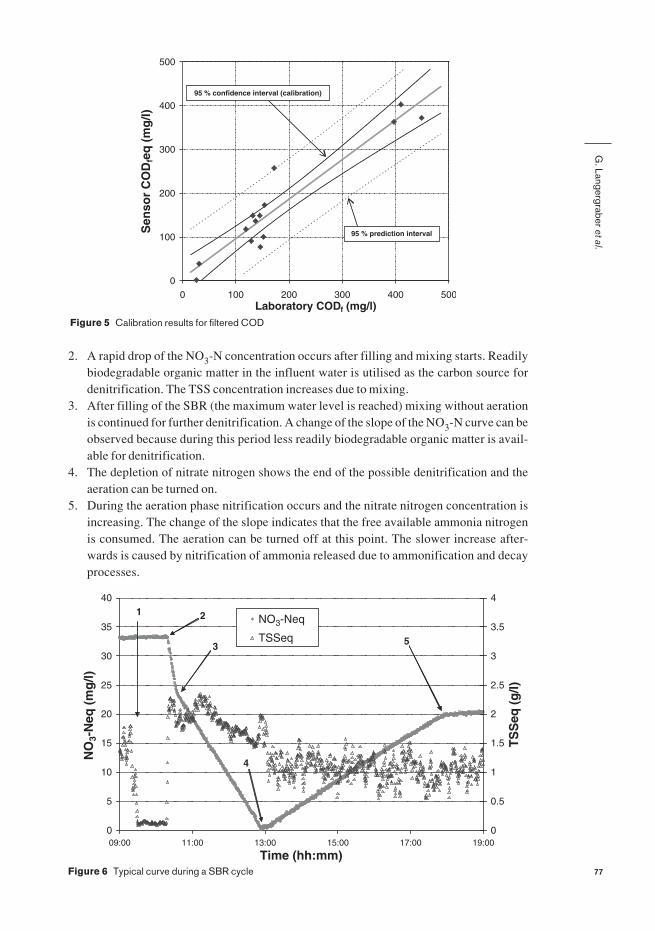
2. A rapid drop of the NO3-N concentration occurs after filling and mixing starts. Readilybiodegradable organic matter in the influent water is utilised as the carbon source fordenitrification. The TSS concentration increases due to mixing.
3. After filling of the SBR (the maximum water level is reached) mixing without aerationis continued for further denitrification. A change of the slope of the NO3-N curve can beobserved because during this period less readily biodegradable organic matter is avail-able for denitrification.
4. The depletion of nitrate nitrogen shows the end of the possible denitrification and theaeration can be turned on.
5. During the aeration phase nitrification occurs and the nitrate nitrogen concentration isincreasing. The change of the slope indicates that the free available ammonia nitrogenis consumed. The aeration can be turned off at this point. The slower increase after-wards is caused by nitrification of ammonia released due to ammonification and decayprocesses.
G. Langergraber et al.
77
0
100
200
300
400
500
0 100 200 300 400 500Laboratory CODf (mg/l)
Sen
sor
CO
Dfe
q (
mg
/l)
95 % confidence interval (calibration)
95 % prediction interval
Figure 5 Calibration results for filtered COD
0
5
10
15
20
25
30
35
40
09:00 11:00 13:00 15:00 17:00 19:00
Time (hh:mm)
NO
3-N
eq (
mg
/l)
0
0.5
1
1.5
2
2.5
3
3.5
4
TS
Seq
(g
/l)
NO3-Neq
TSSeq
1 2
4
53
Figure 6 Typical curve during a SBR cycle

The very high fluctuation of the TSS concentration during the aeration phase is mostprobably caused by air bubbles passing the measurement pathway and therefore influenc-ing the spectral measurement. The fluctuation is lower in the denitrification phase. Figure 7shows the same period as shown in Figure 6 but CODf instead of TSS. As for TSS high fluc-tuations occur for CODf. In contrast to TSS the fluctuations are of the same amplitude forboth the denitrification and nitrification phases. The results for TSS and CODf indicate that further investigations regarding the installation of the sensor in the reactor have to becarried out.
Figure 8 shows a comparison of spectrometric data and reference grab samples analysedfor nitrate nitrogen. The grab samples were taken close to the position where the instrumentwas installed to guarantee the identity of the samples. The reference analyses match the on-line data very well.
Possibilities for optimising the system
It is evident that by using the on-line measurements of NO3-N and TSS the time schedule ofa SBR cycle can be optimised compared to a fixed time schedule. The time needed for
G. Langergraber et al.
78
0
5
10
15
20
25
30
35
40
09:00 11:00 13:00 15:00 17:00 19:00
Time (hh:mm)
NO
3-N
eq (
mg
/l)
0
30
60
90
120
150
180
210
240
CO
Dfe
q (
mg
/l)
NO3-Neq
CODfeq
2
4
53
Figure 7 Time series for NO3-N and filtered COD during a typical SBR cycle
0
5
10
15
20
25
11:00 12:00 13:00 14:00 15:00 16:00 17:00
Time (hh:mm)
(mg
/l)
Sensor NO3-Neq
Reference grab samples NO3-N
Figure 8 Comparison of spectrometric with reference method
settling can be measured by the TSS concentration whereas the measured NO3-N con-centration determines the mixing and aeration time needed to guarantee denitrification andnitrification, respectively (points 4 and 5 in Figure 6). By minimising the times needed forsingle phases more cycles can be run and therefore higher amounts of water can be treated.
The amount of water withdrawn could be optimised by installing the sensor on theflexible part of the decanter. During withdrawal the sensor is moving downwards and with-drawal can continue until the TSS concentration increases indicating that the sensor isapproaching the sludge blanket level. Higher volumes of water can be withdrawn and there-fore treated by using such a system. No experiments regarding this optimisation strategyhave been carried out up to now.
Summary and conclusionsThe submersible UV/VIS spectrometer can be used for measurements in a SBR tank. Theinstrument measures in-situ directly in the reactor and communicates the results in real-time. The auto-cleaning system which is operated with pressured air prevents trends in thetime series due to film growth on the optical devices.
Compared to a conventional nitrate nitrogen analyser the instrument is able to measurein-situ. Therefore no sampling and sampling preparation (e.g. ultra-filtration) is needed.Additionally no chemicals are required. In addition to nitrate nitrogen also TSS and CODfcan be measured simultaneously with just a single instrument.
High correlation coefficients of R2 = 0.98 and 0.995 were obtained for NO3-N and TSS,respectively, by running an advanced local calibration. The measurement of NO3-N waspossible also for high TSS concentrations. However, for increasing TSS concentrations thedetectable maximum nitrate nitrogen concentration is decreasing. The obtained correlationcoefficient for CODf was lower (R2 = 0.90).
Several characteristic points of a SBR cycle could be monitored using on-line UV/VISspectrometry. Compared to a fixed time schedule the times for settling, denitrification andnitrification can be minimised and therefore the volumes of water that can be treated can bemaximised. By mounting the instrument on the flexible part of the decanter additionally theamount of withdrawn water could be increased.
Further tests have to be carried out regarding the optimal position for installation of theinstrument in the reactor and the implementation of an optimised control strategy. Theresults of the first investigations showed that the submersible UV/VIS spectrometer is apromising instrument for optimising the operation of a SBR.
ReferencesAndreottola, G., Foladori, P. and Ragazzi, M. (2001). On-line control of a SBR system for nitrogen removal
from industrial wastewater. Wat. Sci. Tech., 43(3), 93–100.
Fleischmann, N., Staubmann, K. and Langergraber, G. (2002). Management of sensible water uses with
real-time measurements. Wat. Sci. Tech., 46(3), 33–40.
Hofstaedter, F., Ertl, T., Langergraber, G., Lettl, W. and Weingartner, A. (2003). On-line nitrate monitoring
in sewers using UV/VIS spectroscopy. In: Wanner, J., Sykora, V. (eds): Proceedings of the 5th
International Conference of ACE CR ‘Odpadni vody – Wastewater 2003’, 13–15 May 2003, Olomouc,
Czech Republic, pp. 341–344.
Langergraber, G., Fleischmann, N., Van der Linden, F., Wester, E., Weingartner, A. and Hofstaedter, F.
(2002). In-situ measurement of aromatic contaminants in bore holes by UV/VIS-spectrometry; In: Breh,
W. et al. (eds): Field Screening Europe 2001, Kluwer, Dordrecht, The Netherlands, pp. 317–320.
Langergraber, G., Fleischmann, N. and Hofstaedter, F. (2003a). A multivariate calibration procedure for
UV/VIS spectrometric quantification of organic matter and nitrate in wastewater. Wat. Sci. Tech., 47(2),
63–71.
Langergraber, G., Fleischmann, N., Hofstaedter, F., Weingartner, A. and Lettl, W. (2003b). Detection of
(unusual) changes in wastewater composition using UV/VIS spectroscopy. In: Ruzickova, I., Wanner, J.
G. Langergraber et al.
79
(eds): Preprint of the 9th IWA conference on ‘Design, Operation and Costs of Large Wastewater
Treatment Plants’ – Poster papers, 1–4 September 2003, Prague, Czech Republic, pp. 135–138. (Water
Intelligence Online (2004) 2004 08010).
Langergraber, G., Fleischmann, N., Hofstaedter, F. and Weingartner, A. (2004). Monitoring of a paper mill
wastewater treatment plant using UV/VIS spectroscopy. Wat. Sci. Tech., 49(1), 9–14.
Lorenz, U., Dettmar, J. and Fleischmann, N. (2002). Adaptation of a new online probe for qualitative
measurements to combined sewer systems. In: Stricker, E.W., Huber, W.C. (eds): Proceedings of the 9th
International Conference on ‘Urban Drainage’, 8–13 September 2002, Portland, Oregon, USA, pp.
427–428.
Mikosz, J., Plaza, E. and Kurbiel, J. (2001). Use of computer simulation for cycle length adjustment in
sequencing batch reactor. Wat. Sci. Tech., 43(3), 61–68.
Wett, B. and Ingerle, K. (2001). Feedforward aeration control of a Biocos wastewater treatment plant. Wat.
Sci. Tech., 43(3), 85–92.
Winkler, S., Rieger, L., Thomann, M., Siegrist, H., Bornemann, C. and Fleischmann, N. (2002). In-line
monitoring of COD and COD-fractionation: Improving dynamic simulation data quality. In: IWA (ed.):
Preprints of the 3rd IWA International World Water Congress, April 7–12, 2002, Melbourne, Australia.
Zyngier, D., Araújo, O.Q.F., Coelho, M.A.Z. and Lima, E.L. (2001). Robust soft sensors for SBR
monitoring. Wat. Sci. Tech., 43(3), 101–106.
G. Langergraber et al.
80