on-line method for the analysis of sea-water for trace elements by inductively coupled plasma mass...
TRANSCRIPT

JOURNAL OF ANALYTICAL ATOMIC SPECTROMETRY, MARCH 1993, VOL. 8 279
On-line Method for the Analysis of Sea-water for Trace Elements by Inductively Coupled Plasma Mass Spectrometry* Plenary Lecture James W. McLaren, Joseph W. H. Lam and Shier S. Berman institute for Environmental Chemistry, National Research Council of Canada, Ottawa, Canada K 1 A OR6 Kunihiko Akatsuka Kitami institute of Technology, Hokkaido, Japan Maria Aparecida Azeredo Universidade Federal Rural do Rio de Janeiro, Rio de Janeiro, Brazil
A commercially available chelation concentration system for the on-line preconcentration of trace metals from saline solutions was modified to permit the simultaneous determination of Fe, Mn, Co, Ni, Cu, Zn, Cd and Pb in 5 ml sea-water samples in less than 10 min by inductively coupled plasma mass spectrometry. Modifications were necessary in order to obtain acceptably low blanks for several elements. The system was operated both with columns provided by the manufacturer and with columns containing silica-immobilized 8-hydroxyquinoline. Detection limits in sea-water ranged from 1.6 ng I-' (for Pb) to 55 ng I-' (for Ni) for the former columns, and from 0.3 ng I-' (for Cd) to 47 ng I-' (for Fe) for the latter. Accurate analyses of coastal and open-ocean sea-water certified reference materials were achieved with at least one of the column types for all elements except Fe and co. Keywords: Inductively coupled plasma mass spectrometry; sea-water analysis; trace elements; on-line concentration
The relatively high salt content of sea-water generally precludes its direct analysis by inductively coupled plasma mass spectrometry (ICP-MS). Even if the obvious problems of salt deposition on the torch, sampling interface or ion lenses can be avoided by the use of flow injection tech- niques instead of continuous nebulization, at least a 10-fold dilution is necessary in order to alleviate severe suppression of sensitivity by the high salt concentration. This unavoida- ble dilution places the concentrations of all but a few of the elements of environmental interest too low for accurate determination. Toole et al. determined uranium in marine sediment pore waters after a 20-fold dilution and Klin- khammer and Chan2 analysed marine waters for barium after a 100-fold dilution, but all reported methods for the determination of boron,3 a r ~ e n i c , ~ gold,5 rhenium,6 other transition m e t a l ~ , ~ p ~ - ~ ~ lead4q7**J0J2 and the rare earth ele- r n e n t ~ ' ~ J ~ have involved a chemical separation. A method for the ICP-MS determination of trace elements of environ- mental interest in sea-water that has been in use in this laboratory for several ~ e a r s ~ - ~ * * J * involves a separation of the analytes from the major sea-water ions by passage of a 500 ml sample through a small column of silica-immobil- ized 8-hydroxyquinoline (1-8-HOQ), followed by elution with 10 ml of an HCl-HN03 mixture.
There has been considerable interest recently in the development of new methods, or the adaptation of existing methods, for use 'on-line' with ICP-MS instrumenta- t i ~ n . ~ ~ ~ J 1~15-18 On-line procedures, when used in combina- tion with flow injection techniques, offer advantages in the reduction of both sample preparation time and required volumes. In addition, the risk of contamination from airborne sources in an open laboratory environment is reduced in a closed system. Plantz et al. l 1 described an on- line method for the separation and preconcentration of trace elements from high-salt matrices such as sea-water and urine based on adsorption of their neutral bis(carboxy-
*Presented at the Sixth Biennial National Atomic Spectroscopy Symposium (BNASS), Plymouth, UK, July 22-24, 1992.
methy1)dithiocarbamate complexes on a styrene-divinyl- benzene resin (XAD-4) at pH 3.5, followed by elution with 0.1 mol dm-3 ammonia solution. The pH change (from 3.5 to 11) caused by the weakly basic eluent results in the dissociation of the carboxylic acid groups of the complexing agent and release of the now anionic complexes from the column. Preconcentration factors of about 20 were achieved by using a 5.0 ml injection loop for sample loading. The feasibility of the method was illustrated by its application to the separation of Cr, Co and Ni from National Research Council of Canada (NRCC) Certified Reference Material (CRM) Coastal Seawater CASS- 1. Beauchemin and Berman9 adapted the off-line I-8-HOQ method used in our laboratory, and miniaturized by Nakashima et al.,19 for use on-line with ICP-MS. A small column containing about 80 mg of I-8-HOQ was placed in the sample stream; a poly(tetrafluoroethy1ene) (PTFE) sam- ple injection valve immediately downstream of the column allowed passage of the stream either to the nebulizer or to waste. Sample volumes of up to 10 ml were passed through the column prior to elution with 1 ml of a 2 moll-' HCl- 0.1 mol 1-' HN03 mixture. Sample volumes of only 1 ml sufficed for the determination of Mn and Cu in the NRCC CRM SLRS-1, River Water; 10 ml were sufficient for the determination of Co, Pb and U. The method was also applied to the determination of Mn, Mo, Cd and U in NRCC CRM NASS-2, Open Ocean Seawater. High blanks for Fe and Zn precluded their determination in either SLRS-1 or NASS-2. Heithmar et a1.15 employed a more elaborate device in which metals were adsorbed on a prototype macroporous iminodiacetate resin column devel- oped by Dionex for the 'IC/ICP' chelation concentration system. As water samples were normally acidified, they were first mixed on-line with an ammonium acetate buffer solution to adjust the pH to 5.5. After passage of up to 10 ml of the sample, the elution was performed with 1 mol dm-3 HN03. Effective separation of nine elements (Ti, V, Mn, Fe, Co, Ni, Cu, Cd and Pb) from potentially interfering elements such as Na, Ca and Mg, and good recoveries from spiked samples of synthetic sea-water and digested waste
Publ
ishe
d on
01
Janu
ary
1993
. Dow
nloa
ded
by B
row
n U
nive
rsity
on
25/1
0/20
14 2
1:01
:15.
View Article Online / Journal Homepage / Table of Contents for this issue

280 JOURNAL OF ANALYTICAL ATOMIC SPECTROMETRY, MARCH 1993, VOL. 8
waters were demonstrated. High blanks for Zn prevented its inclusion in the scheme. Boomer et all6 also used a commercially available column for on-line preconcentra- tion. A Dionex Ionpac cation guard cartridge was shown to be effective for the removal of Cu, Cd and Pb from aqueous solutions over the pH range 3-9. Solutions were loaded at a flow rate of 2.0 ml min-l; the eluent was 5% HN03 at 3.5 ml min-l. Detection limits were improved by a factor of 10-20 when 20 ml samples were passed through the column.
This paper describes modifications made to the now commercially available Dionex ‘IC/ICP’ chelation concen- tration system that permitted the simultaneous determina- tion of Mn, Ni, Cu, Zn, Cd and Pb in 5 ml sea-water samples in less than 15 min. Results obtained with standard MetPac CC-1 columns are compared with those obtained with I-8-HOQ columns.
Experimental ICP-MS Instrumentation A Perkin-Elmer SCIEX Elan 5000 inductively coupled plasma mass spectrometer with Version 1.04 software was used. The instrument, equipped with platinum-tipped sampler and skimmer cones, was operated as recommended by the manufacturer. Nebulizer gas flow and electrostatic ion lens voltages were adjusted daily for peak sensitivity. Some preliminary results were obtained with a SCIEX Elan 500 instrument.
Chelation Concentration System The Dionex ‘IC/ICP’ chelation concentration system con- sists of two major components: a microprocessor-controlled high-performance quaternary gradient pump module (GPM) and a sample concentration module (SCM), a schematic diagram of which is shown in Fig. 1. The SCM contains two single-piston-type Dionex QIC pumps, re- ferred to as the sample pump (SP) and carrier pump (CP), four 2000 psi (14 MPa) inert double-stack four-way slider valves identified as A, B, C and D, sample loops with volumes of 1 and 5 ml and a small ( 5 cm x 4 mm i.d.) column, known as a MetPac CC- 1 column, which contains a proprietary material for concentration of cationic transition metals from high ionic strength solutions by chelation with iminodiacetate functional groups immobilized on a styrene-divinylbenzene polymeric support. An external peristaltic pump (Gilson Minipuls 2) is used to load the
Carrier in
Off
o n
Fig. 1 Schematic diagram of the Dionex Sample Concentration Module. A, B and C controlled by GPM V5; D, controlled by GPM V6; PP, peristaltic pump; CP, carrier pump and SP, sample pump
sample loops. In the standard mode of operation, the contents of the 1 ml loop are passed directly to the ICP for direct determination of elements at relatively high concen- tration, and the contents of the 5 ml loop are passed through the MetPac column after an on-line pH adjustment achieved by mixing the sample with an acetic acid-ammon- ium acetate buffer solution in a mixing T-junction immedi- ately upstream of the column. For the sea-water analyses described here, the 1 ml loop was replaced with a very short length of tubing, as none of the elements of interest could be directly determined. The system was connected directly to the Elan 5000 nebulizer by means of a 1 m length of narrow- bore Teflon tubing.
Preparation of Buffer and Eluting Acid Solutions All reagents were purified prior to use. Concentrated nitric, hydrochloric and acetic acids were purified by sub-boiling distillation in a quartz still. An approximately 9 mol 1-l
aqueous ammonia solution was prepared by low-tempera- ture sub-boiling distillation of 1 5 mol 1-1 analytical-reagent grade ammonia solution. De-ionized, distilled water (DDW) was prepared by passage of laboratory distilled water through a NanoPure (Barnstead) water purification system. Buffer and eluting acid solutions were prepared in a Class 10 clean laboratory. Solutions were prepared in polyethylene bottles cooled in an ice-bath. Transfer of these solutions to the glass or plastic Dionex reservoir bottles, prior to transport to the ICP-MS laboratory, was also carried out in the clean laboratory to minimize the chance of contamination by airborne particulates.
A 1 mol 1-l acetic acid-ammonium acetate buffer solution was prepared by slow addition of 65 ml of saturated aqueous ammonia to 57.5 ml of acetic acid in a 1 1 polyethylene bottle. After adjustment of the pH to 5.4 & 0.1 by addition of acetic acid or ammonia solution as neces- sary, the volume was made up to 1 1. Similarly, the ammonia-ammonium chloride solution (1 mol 1-1 in NH,Cl) was prepared by addition of 208 ml of aqueous ammonia to 102 ml of concentrated hydrochloric acid, adjustment of the pH to 9.2 k 0.1 as required and dilution to 1 1.
System Operation The GPM programme recommended by Dionex for oper- ation of the system is shown in Table 1. The 2 moll-’ acetic acid-ammonium acetate buffer solution (El), 2 mol 1-l
nitric acid (E2) and DDW (E3) are supplied to the GPM from glass reservoir bottles; the 0.1 moll-’ HN03 ‘carrier’ solution which supplies the sample and carrier pumps is
Table 1 GPM programme for operation of the chelation concen- tration system with a MetPac CC-1 column
Flow Time/ rate/ml El* E2t E3$ min min-’ (O/O) (%) (O/o) V5 V6 0 2.0 2.0 2.0 5.0 4.0 6.2 4.0 6.3 4.0 6.7 2.0 6.9 2.0 8.3 2.0 8.4 0.0
100 0 I00 0 100 0 100 0
0 75 0 75 0 75 0 75
100 0
0 On Off 0 Off On 0 off off 0 off off 25 Off Off 25 Off Off 25 On On 25 On On 0 off off
*E1=2 mol 1 - I HOAc-NH,OAc buffer solution, pH 5.4. tE2= 2 mol 1 - I HN03. $E3 = DDW.
Publ
ishe
d on
01
Janu
ary
1993
. Dow
nloa
ded
by B
row
n U
nive
rsity
on
25/1
0/20
14 2
1:01
:15.
View Article Online

JOURNAL OF ANALYTICAL ATOMIC SPECTROMETRY, MARCH 1993, VOL. 8 28 1
Carrier in
Carrier GPM
Off
o n U I - T-j u nction I
Fig. 2 Schematic diagram of the Dionex sample concentration module, as modified in this work to incorporate a clean-up column. Symbols as in Fig. 1.
ICP
also in a glass container. At time t=O, valves A, B and C are on, while valve D is off. The peristaltic pump, operating at approximately 5 ml min-l, loads the sample loops, while the GPM pumps buffer solution through the column. At t=2.0 min, valves A, B and C are switched off and D is switched on. A 2.0 ml min-l flow of 0.1 moll-' HN03 from the carrier pump now passes through the 1 ml loop, transporting the previously loaded sample to the ICP. At the same time, a 2.0 ml min-l flow of 0.1 mol 1-l HN03 from the sample pump transfers the contents of the 5 ml loop towards the mixing T, where the sample is mixed with acetate buffer from the GPM before passing through the MetPac column and out to waste. At t= 5.0 min valve D is switched off. For the next 1.2 min, the column is washed with the buffer solution to elute selectively Ca and Mg, which are only weakly bound. At t=6.3 min, elution of the transition metals from the column with 1.5 mol 1-l HN03 at 4.0 ml min-l begins; the flow rate is decreased to 2.0 ml min-l at t=6.7 min. At t=6.9 min, all valves are switched on. The acid eluate containing the analytes is passed to the ICP, while the 5 ml sample loop is rinsed with 0.1 mol 1-l HN03. At t=8.4 min, all valves are switched off. The carrier pump now supplies 0.1 moll-' HN03 to the nebulizer until processing of the next sample is begun.
When the system was operated as described above, the blanks for many of the elements of interest were too high for sea-water analysis. Systematic investigation revealed that the acetic acid-ammonium acetate buffer solution was a major source of contamination, even when prepared from high-purity reagents, and that the glass reservoir bottles also contributed, particularly for zinc. These bottles were re- placed with 2 and 4 1 high-density polyethylene containers
Table 2 GPM programme for operation of the chelation concen- tration system with a second MetPac column for buffer clean-up
Flow Time/ rate/ml El* E2t E3$ min min-I (%) (O/O) (Yo) V5 V6 0 2.0 0 2.0 2.0 0 2.1 2.0 100 5.0 4.0 100 6.2 4.0 100 6.3 2.0 0 8.3 2.0 0 8.4 2.0 100
10.4 2.0 100
0 0 0 0 0
75 75 0 0
100 100
0 0 0
25 25 0 0
On Off On Off Off On off off off off On On On On off off off off
*El = 1 mol 1-1 HOAc-NH,OAc buffer solution, pH 5.4. tE2-2 mol 1-I HN03. SE3 = DDW.
(Dionex Part Nos. 39 163 and 39 164, respectively) that had been cleaned by HN03 leaching. In order to purify the buffer solution further before mixing with the sample, the SCM was modified as shown in Fig. 2 to permit the use of a second MetPac column as a clean-up column. The corre- sponding GPM programme is shown in Table 2. In this programme, conditioning of the MetPac column with the buffer solution is performed at the end of the cycle, rather than at the beginning. Although this results in a longer processing time (by 2 min), it avoids possible deleterious effects on ICP-MS stability by nebulization of the relatively concentrated buffer solution. From time t = O to 2 min, DDW is passed through the column to the ICP while the 5 ml sample loop is loaded. At t=2.1 min, valves A, B and C are switched off and valve D is switched on. The sample is transferred to the column after on-line pH adjustment to pH 5.4 by mixing with the buffer solution, which has been pumped through the clean-up column to the T-junction by the GPM. The carrier pump supplies 0.1 mol 1-l HN03 to the nebulizer. At t= 5.0 min, valve D is switched off and the flow of buffer solution through the column is increased to 4.0 ml min-l for selective elution of Ca and Mg. At t=6.3 min, all valves are switched on. Elution of the column with 1.5 mol 1-l HN03 from the GPM begins and continues for the next 2 min. At t= 8.4 min, reconditioning of the column with buffer solution begins; once again, valve A is switched off so that the flow path from the GPM passes through the clean-up column.
The chelation concentration system was also operated in the configurations shown in Figs. 1 and 2 after replacement of the standard MetPac CC-1 column(s) with laboratory- made columns containing silica-immobilized I-8-HOQ syn- thesized by the procedure of Sturgeon et aLZo Two column geometries were evaluated. Columns with dimensions identical with those of the MetPac column were prepared from empty column bodies supplied by Dionex. These columns have an internal volume of approximately 0.6 cm3, and therefore contain about 250 mg of 1-8-HOQ, with a capacity of about 1.25 x I 0-5 mol. A smaller mini-I-8-HOQ column, containing approximately 40 mg of 1-8-HOQ, was prepared from a short length of polyethylene-lined Tefzel tubing (1.57 mm i.d.x3.18 mm o.d., Dionex Part No. 40793).
Differences in the chelation chemistry of I-8-HOQ and the MetPac columns are reflected in the GPM programme shown in Table 3, which describes the sequence of oper- ations with an on-line clean-up of the buffer solution as shown in Fig. 2. For the MetPac material, with iminodiace- tate functional groups, the optimum pH for retention of the transition metals, without excessive retention of Ca and
Table 3 GPM programme for operation of the chelation concen- tration system with I-8-HOQ columns
Flow Time/ rate/ml El* E2t E3$ min min-I (Oh) (O/o) (%) V5 V6 0 2.0 0 2.0 2.0 0 2.1 2.0 50 5.0 2.0 50 5.1 4.0 0 6.0 4.0 0 6.1 2.0 0 8.5 2.0 0 8.6 2.0 0
11.5 2.0 0
0 100 On Off 0 100 On Off 0 50 Off On 0 50 Off On 0 100 off off 0 100 off off
100 0 On On 100 0 On On
0 100 On On 0 100 On On
*El = 1 rnol 1-I NH3-NH,Cl buffer solution, pH 9.2. tE2=2 mol 1-1 HC1-0.8 mol 1-I HN03. $ E3=DDW.
Publ
ishe
d on
01
Janu
ary
1993
. Dow
nloa
ded
by B
row
n U
nive
rsity
on
25/1
0/20
14 2
1:01
:15.
View Article Online

282 JOURNAL OF ANALYTICAL ATOMIC SPECTROMETRY, MARCH 1993, VOL. 8
20
c I v)
{ 1 5 - 3
8 7 10 .- 2 9!
- 5
n 0
v)
'- 5 -
Mg, is about 5.5. For 1-8-HOQ, however, a higher pH (about 8) is normally used to improve the retention of several elements, in particular manganese, for which the recovery at pH 5.5 is not quantitative. For this reason, an ammonia-ammonium chloride buffer solution (pH= 9.2) was used instead of the acetic acid-ammonium acetate buffer to perform the on-line pH adjustment. Also, previous experience with I-8-HOQ has shown that a mixture of hydrochloric and nitric acid is optimum for column elution. The first 5 min of the programme are the same as for the MetPac column except for the difference in the buffer. Column washing from t= 5.1 to 6.0 min is performed with DDW rather than with the buffer solution. Elution of the column with a 2 mol 1-l HC1-0.8 mol 1-l HN03 mixture takes place between t = 6.1 and 8.5 min. The column is then washed with DDW for 3 min prior to initiation of the next cycle.
-
A
-
. . . . . . . . P
i :,
Data Acquisition and Processing Intensity data for eight elements (Fe, Mn, Co, Ni, Cu, Zn, Cd and Pb) were acquired simultaneously with the graphics application of the Elan software in the continuous display mode. This mode permits a real-time display of the ion signals as a function of time for any six of the elements selected for monitoring, or recovery of data from a previous run for display. The isotopes chosen for monitoring were 55Mn, 57Fe, 59C0, 60Ni, 63Cu, 66Zn, lI4Cd and 208Pb. Dwell and replicate times were both set at 100 ms (i.e., each replicate consisted of a 100 ms dwell on each of the isotopes). The number of replicates was set to allow
35 A
0 100 200 300 400 500 LJ Timels
Fig. 3 On-line concentration profiles for a 1 ng ml-1 multi- element standard. MetPac CC-1 column: A, Fe; B, Ni; C, Zn; and D, Cd
25 I 1
Timels
Fig. 4 On-line concentration profiles for a 1 ng ml-I multi- element standard. MetPac CC-1 column: A, Mn; B, Co; C, Cu; and D, Pb
uninterrupted data acquisition throughout the run. All data were acquired in normal resolution (Le., peak width of 0.7-0.9 u at 10% of peak maximum). Synchronization of initiation of the GPM programme and of data acquisition was achieved by simultaneous manual triggering.
As Version 1 of the Elan 5000 software does not provide for the processing of transient signals to obtain peak height and/or peak area data, the raw data files were processed with a software package developed in-house for this purpose. This package includes Savitsky-Golay smoothing of the raw data.
0 100 200 300 400 500 600 Time/s
Fig. 5 On-line concentration profiles for a 1 ng ml-1 multi- element standard. I-8-HOQ column: A, Fe; B, Ni; C, Zn; and D. Cd
20
r I v)
15 3
8 c 10 .- 2
c =
n 0
v)
P) c, .- -
D
0 100 200 300 40( Time/s
iC
* 500 6 D
Fig. 6 On-line concentration profiles for a 1 ng ml-I multi- element standard. I-8-HOQ column: A, Mn; B, Co; C, Cu; and D, Pb
9 Timels
Fig. 7 On-line concentration profiles for a 5 ml sample of the IVRCC CRM CASS-2 Coastal Seawater. MetPac CC-1 column: A, 1Mn; B, Ni; C, Cu; and D, Zn
Publ
ishe
d on
01
Janu
ary
1993
. Dow
nloa
ded
by B
row
n U
nive
rsity
on
25/1
0/20
14 2
1:01
:15.
View Article Online

JOURNAL OF ANALYTICAL ATOMIC SPECTROMETRY, MARCH 1993, VOL. 8 283
0 100 200 300 400 500 600 Timels
Fig. 8 On-line concentration profiles for a 5 ml sample of the NRCC CRM CASS-2 Coastal Seawater. MetPac CC-1 column: A, Fe; B, Co; C, Cd; and D, Pb
100 200 300 400 500 600 700 800 Time/$
Fig. 9 On-line concentration profiles for a 5 ml sample of the CRM CASS2 Coastal Seawater. I-8-HOQ column: A, Mn; B, Ni; C, Cu; and D, Zn
Sea-water Analysis Performance of the system for on-line ICP-MS analysis of sea-water was evaluated with two NRCC CRMs, Coastal Seawater CASS-2 and Open Ocean Seawater NASS-3. These materials are acidified to pH 1.6 at the time of sampling. The CASS-2 sample has a salinity of 29.2°/~ (2.92Oh total dissolved solids), whereas the salinity of NASS-3 is 35.1Oh. Analyses were performed by external calibration. Peak height data for standard solutions of the analytes in 0.1 moll-' HN03 were used to construct a linear calibration. Blanks and standards were run at the beginning and end of each set of samples. For blanks runs, the sample loop was loaded with 0.1 moll-' HN03. Intensity data from the first blank run of the day were discarded as they were always higher than those for subsequent runs.
Results and Discussion Concentration Profiles for Standard Solutions On-line concentration profiles for a 1 ng ml-I multi- element standard solution are shown in Figs. 3-6. In these experiments, the sample loop that permits the direct introduction of a 1 ml sample was left in place. The peaks that appear at approximately 160 s arise from this direct injection, whereas those at 450-500 s arise from elution of the MetPac or I-8-HOQ column after passage of a 5 ml sample. For the MetPac column (Figs. 3 and 4), it can be seen that the eight analyte elements elute simultaneously, i.e., there is no chromatographic separation. For the I-8- HOQ column, copper, which is very strongly bound, elutes
more slowly than the other elements. The high background signal for iron, seen in Figs. 3 and 5 , is caused by &Ar160H, which is isobaric with 57Fe. The sharp reduction in this signal at about 400 s in Fig. 3 corresponds to the changeover from 0.1 mol 1-* HN03 carrier to the 1.5 mol 1 - I HN03 eluting acid. The decrease is smaller for the I-8-HOQ column, for which the changeover is from 0.1 moll-' HN03 to a 2 mol 1-l HC1-0.8 mol 1-I HNO,, mixture. The elevation of the background signal for manganese prior to peak elution, seen in Fig. 4, probably arises from 40Ar14NH isobaric interference. As the flow rate to the nebulizer is constant throughout the cycle (2 ml min-l), it can be concluded from a comparison of the peak widths for direct sample introduction with those for introduction after preconcentration that the analytes are removed from either the MetPac or I-8-HOQ column in less than 1 ml of acid eluent. From a similar comparison of peak heights, it can be concluded that an approximately 5-fold improvement in sensitivity is achieved. A slightly larger improvement might have been expected, given the ratio of the two sample loop volumes ( 5 ) and the observation that the analytes are apparently eluted in less than 1 ml. Two possible explana- tions for this are a less than quantitative retention of the analytes by the columns or, more probably, a lower ICP-MS sensitivity for the analytes in the relatively concentrated eluting acids than in 0.1 mol 1-l HN03.
Concentration Profiles for Sea-water Samples Typical on-line concentration profiles for 5 ml samples of the Coastal Seawater CRM CASS-2 are shown in Figs. 7-9.
Table 4 Absolute blanks (ng)
Metal MetPac* I-8-HOQ 1-8-HOQ* Mini-I-8-HOQ* Cd 0.030 0.162 0.018 0.018 c o 0.039 - 0.35 0.088 c u 0.057 0.724 0.06 1 0.039 Fe 1.1 1 9.92 3.06 0.20 Mn 0.2 1 0.26 0.04 1 0.036 Ni 0.5 1 0.37 0.045 0.046 Pb 0.053 0.42 0.048 0.027 Zn 0.680 6.7 0.62 0.40
*Plastic reservoir bottles, clean-up columns used.
Table 5 Detection limits (ng 1-l)
Metal MetPac* I-8-HOQ I-S-HOQ* Mini-I-S-HOQ* Cd 2.5 33.3 0.6 0.3 c o 2.6 - 14.1 4.8 c u 2.4 1 1 1 3.7 2.0 Fe 24.3 79.3 I02 47.3 Mn 12.4 21.7 3.1 6.1 Ni 54.5 11.0 3.7 2.8 Pb 1.6 25.6 1.4 1.1 Zn 36.0 232 28.4 8.3
*Plastic reservoir bottles, clean-up column in use.
Table 6 Absolute blanks and detection limits for the chelation concentration system with off-line pH adjustment. Values in parentheses are precision expressed as standard deviaton, n = 5
Detection limit/ Metal Blan Wng ng 1-I
Cd 0.032 & 0.005 3 c o 0.056 f 0.007 4 c u 0.34 -e 0.02 13 Mn 0.09 & 0.02 9 Ni 0.12 & 0.02 14 Pb 0.07 f 0.02 9 Zn 1.1 k0.13 80
Publ
ishe
d on
01
Janu
ary
1993
. Dow
nloa
ded
by B
row
n U
nive
rsity
on
25/1
0/20
14 2
1:01
:15.
View Article Online

284 JOURNAL OF ANALYTICAL ATOMIC SPECTROMETRY, MARCH 1993, VOL. 8
Table 7 Analysis of NRCC CRM CASS-2 Coastal Seawater
Concmtrationlpg 1-l ~
MetPac* Metal cc- 1 1-8-HOQ* Cd 0.045 f 0.00 1 0.020 f 0.00 1 c o 0.039 2 0.004 0.58 k0.23 c u 0.625 f 0.035 0.647 f 0.008 Fe 1.61 k0.14 4.55 f 0.19 Mn 3.8020.19 2.1 1 f 0.04 Ni 0.3 1 O f 0.03 1 0.3 13 f 0.028 Pb 0.02 1 f 0.005 0.0 12 k 0.004 Zn 5.55 2 0.66 2.08 k 0.05
*Precision expressed as the standard deviation of 5-6 replicates. tPrecision expressed as the 95% confidence interval.
Mini-I-S-HOQ* Certified valuet 0.023 f 0.003 0.0 19 f 0.004 0.087 f 0.003 0.025 k 0.006 0.664 k 0.004 0.675 +- 0.039 2.56 f 0.06 1.202 0.12 2.22 f 0.09 1.99 rt 0.15
0.305 f 0.008 0.298 +- 0.036 0.02 1 f 0.003 0.0 19 +- 0.006 2.22f0.10 1.97 +O. 12
In these experiments, the sample loop that permits the direct introduction of a 1 ml sample was replaced with a very short length of tubing. The peaks that appear at approximately 150 s arise from the direct injection of a small volume (< 100 pl) of sea-water. In most instances these peaks can be attributed to polyatomic species which are isobaric with the analyte. The apparent Cu peak at 150 s in Figs. 7 and 9 can be attributed to 40Ar23Na, while the apparent Fe peak in Fig. 8 arises from 40Ca160H. Smaller peaks arising from 44Ca'60 (isobaric with 60Ni) and from the combination of 42Ca160H and 43Ca160 (isobaric with 59C0) are also visible. These peaks illustrate a difficulty with the direct ICP-MS analysis of sea-water that will persist no matter how much the sample is diluted, and whether or not flow injection sample introduction is employed. In contrast, the peaks appearing at 450-500 s, after column elution, do arise from the analytes, which are separated from the major sea-water cations during the on-line processing. Although some of these peaks contain a significant blank contribu- tion, it was generally possible to use them to generate accurate results from a calibration based on simple aqueous standards.
Blanks and Detection Limits Absolute blanks, based on a 5 ml sample volume, for the system operated with MetPac CC- 1, I-8-HOQ and mini-I-8- HOQ columns are given in Table 4. For the full-size I-8- HOQ column, identical in size with the Dionex MetPac column, blank data are shown for operation with and without a clean-up column. Comparison of these data show that the use of a clean-up column reduced the blanks for all elements except iron by factors of 5-10. Comparable improvements, not shown in Table 4, were also observed for the MetPac column; the reduction in the Zn blank was especially dramatic, even when polyethylene reservoirs rather than glass bottles were used. In fact, Zn was the only element for which the glass bottles produced measurable contamination after several months of use. Absolute blanks are lower for Fe, and much lower for Co, for the MetPac column than for the I-8-HOQ column. The silica used in the synthesis of I-8-HOQ is known to contain an Fe impurity, which appears to be released by slight hydrolysis of the silica at pH 8 or higher;20 the Fe blank can be greatly reduced by passage of the sample at pH 3, at which Fe is still retained.l2v2O Absolute blanks for Mn and Ni were consider- ably lower for the I-8-HOQ than for the MetPac column, whereas roughly comparable results were obtained for Cd, Cu, Pb and Zn. Comparison of the data for the I-8-HOQ and mini-I-8-HOQ columns indicates significant differ- ences in the blanks only for Fe and Co, lending further support to the hypothesis that these two elements are released from the I-8-HOQ itself.
Detection limits, based on three times the standard deviation of the blank observed for a 5 ml sample of 0.1 mol 1-l HN03, for the system operated with the various columns, are given in Table 5. As in Table 4, data are presented for the full-size I-8-HOQ column with and without a clean-up column to emphasize the improvement resulting from this modification. As might be expected from the data in Table 4, the MetPac column gave better detection limits for Fe and Co than did the I-8-HOQ columns. The reverse was true for Cd, Mn and Ni, while roughly equivalent detection limits were observed for Cu, Pb and Zn. Comparison of the data for the I-8-HOQ and mini-I-8-HOQ columns shows an overall modest improve- ment in detection limits for the smaller column.
It is interesting to compare the data in Tables 4 and 5 with blanks and detection limits, shown in Table 6, obtained in earlier unpublished work with the chelation concentration system in which the on-line addition of a buffer solution was avoided by performing the pH adjust- ment off-line by addition of high-purity ammonia solution. This work was carried out with a full-size I-8-HOQ column before the installation of a clean-up column and plastic reservoirs. An older ICP-MS instrument (SCIEX Elan 500), with poorer detection limits than the Elan 5000, was used. By comparison of the data in Tables 4 and 6, it can be seen that the installation of a clean-up column and plastic reservoirs permits an on-line pH adjustment with no (degradation of the blanks. In fact, the I-8-HOQ blanks shown in the third column of Table 4 are lower for all (elements except Co; the higher Co blank probably reflects a (difference in the impurity level of two batches of I-8-HOQ. Detection limits for all elements except Co, shown in the third column of Table 5, are 3-5 times lower than were lachieved in the earlier work; this improvement results from 'both the lowering of the blanks and the improved instru- mental detection limits of the Elan 5000.
Table 8 Analysis of NRCC CRM CASS-2 Coastal Seawater with off-line pH adjustment
Concentration/pg 1-'
Metal 1-8-HOQ* Certified valuet Cd 0.0 19 k 0.005 0.0 19 f 0.004 c o 0.023 f 0.003 0.025 k 0.006
Ni 0.30 f 0.07 0.298 f 0.036 Pb 0.01 6 k 0.001 0.01 9 f 0.006 Zn 1.97 +_ 0.09 1.97 f 0.12
c u 0.70 k 0.10 0.675 f0.039 Mn 2.0 f 0.2 1.99 f 0.15
*Precision expressed as standard deviation of 6 replicates. *Precision expressed as 95% confidence interval.
Publ
ishe
d on
01
Janu
ary
1993
. Dow
nloa
ded
by B
row
n U
nive
rsity
on
25/1
0/20
14 2
1:01
:15.
View Article Online
JOURNAL O F ANALYTICAL ATOMIC SPECTROMETRY, MARCH 1993, VOL. 8 285
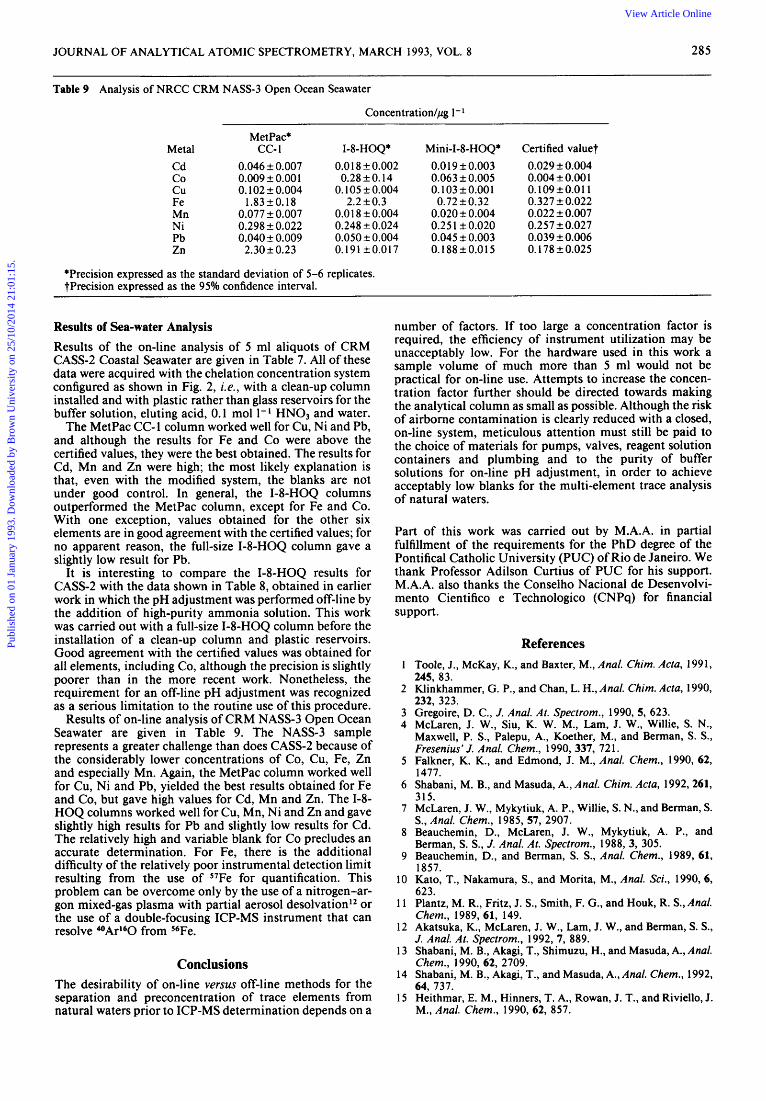
Table 9 Analysis of NRCC CRM NASS-3 Open Ocean Seawater
Concentration/pg 1-l
MetPac* Metal cc- 1 1-8-HOQ* Cd c o c u Fe Mn Ni Pb Zn
0.046 f 0.007 0.009 f 0.00 1 0.102 f 0.004
0.077 f 0.007
0.040 k 0.009 2.30f0.23
1.83 f 0.18
0.298 f 0.022
0.0 18 f 0.002 0.28 f 0.14
0.105 k 0.004 2.2 f 0.3
0.0 18 f 0.004 0.248 f 0.024 0.050 f 0.004 0.191 f0.017
*Precision expressed as the standard deviation of 5-6 replicates. tPrecision expressed as the 95Oh confidence interval.
Mini-I-8-HOQ* 0.0 19 f 0.003 0.063 is 0.005
0.72 f 0.32 0.020 k 0.004
0.045 k 0.003
0.103 k 0.00 1
0.25 1 k 0.020
0.188 f 0.01 5
Certified value? 0.029 k 0.004 0.004 f 0.00 1
0.022 f 0.007
0.109k0.011 0.327 f 0.022
0.257 k0.027 0.039 f 0.006 0.178 k 0.025
Results of Sea-water Analysis Results of the on-line analysis of 5 ml aliquots of CRM CASS-2 Coastal Seawater are given in Table 7. All of these data were acquired with the chelation concentration system configured as shown in Fig. 2, i.e., with a clean-up column installed and with plastic rather than glass reservoirs for the buffer solution, eluting acid, 0.1 mol 1-' HN03 and water.
The MetPac CC- 1 column worked well for Cu, Ni and Pb, and although the results for Fe and Co were above the certified values, they were the best obtained. The results for Cd, Mn and Zn were high; the most likely explanation is that, even with the modified system, the blanks are not under good control. In general, the I-8-HOQ columns outperformed the MetPac column, except for Fe and Co. With one exception, values obtained for the other six elements are in good agreement with the certified values; for no apparent reason, the full-size I-8-HOQ column gave a slightly low result for Pb.
It is interesting to compare the I-8-HOQ results for CASS-2 with the data shown in Table 8, obtained in earlier work in which the pH adjustment was performed off-line by the addition of high-purity ammonia solution. This work was carried out with a full-size I-8-HOQ column before the installation of a clean-up column and plastic reservoirs. Good agreement with the certified values was obtained for all elements, including Co, although the precision is slightly poorer than in the more recent work. Nonetheless, the requirement for an off-line pH adjustment was recognized as a serious limitation to the routine use of this procedure.
Results of on-line analysis of CRM NASS-3 Open Ocean Seawater are given in Table 9. The NASS-3 sample represents a greater challenge than does CASS-2 because of the considerably lower concentrations of Co, Cu, Fey Zn and especially Mn. Again, the MetPac column worked well for Cu, Ni and Pb, yielded the best results obtained for Fe and Co, but gave high values for Cd, Mn and Zn. The I-8- HOQ columns worked well for Cu, Mn, Ni and Zn and gave slightly high results for Pb and slightly low results for Cd. The relatively high and variable blank for Co precludes an accurate determination. For Fey there is the additional difficulty of the relatively poor instrumental detection limit resulting from the use of s7Fe for quantification. This problem can be overcome only by the use of a nitrogen-ar- gon mixed-gas plasma with partial aerosol desolvation' or the use of a double-focusing ICP-MS instrument that can resolve 40Ar160 from s6Fe.
Conclusions The desirability of on-line versus off-line methods for the separation and preconcentration of trace elements from natural waters prior to ICP-MS determination depends on a
number of factors. If too large a concentration factor is required, the efficiency of instrument utilization may be unacceptably low. For the hardware used in this work a sample volume of much more than 5 ml would not be practical for on-line use. Attempts to increase the concen- tration factor further should be directed towards making the analytical column as small as possible. Although the risk of airborne contamination is clearly reduced with a closed, on-line system, meticulous attention must still be paid to the choice of materials for pumps, valves, reagent solution containers and plumbing and to the purity of buffer solutions for on-line pH adjustment, in order to achieve acceptably low blanks for the multi-element trace analysis of natural waters.
Part of this work was carried out by M.A.A. in partial fulfillment of the requirements for the PhD degree of the Pontifical Catholic University (PUC) of Rio de Janeiro. We thank Professor Adilson Curtius of PUC for his support. M.A.A. also thanks the Conselho Nacional de Desenvolvi- mento Cientifico e Technologico (CNPq) for financial support.
1
2
3 4
5
6
7
8
9
10
11
12
13
14
15
References Toole, J., McKay, K., and Baxter, M., Anal. Chim. Acta, 1991, 245, 83. Klinkhammer, G. P., and Chan, L. H., Anal. Chim. Acta, 1990, 232, 323. Gregoire, D. C., J. Anal. At. Spectrom., 1990, 5, 623. McLaren, J. W., Siu, K. W. M,, Lam, J. W., Willie, S. N., Maxwell, P. S., Palepu, A., Koether, M., and Berman, S . S . , Fresenius' J. Anal. Chem., 1990,337, 72 1. Falkner, K. K., and Edmond, J. M., Anal. Chem., 1990, 62, 1477. Shabani, M. B., and Masuda, A., Anal. Chim. Acta, 1992,261, 315. McLaren, J. W., Mykytiuk, A. P., Willie, S. N., and Berman, S . S . , Anal. Chem., 1985, 57, 2907. Beauchemin, D., McLaren, J. W., Mykytiuk, A. P., and Berman, S . S., J. Anal. At. Spectrom., 1988, 3, 305. Beauchemin, D., and Berman, S . S. , Anal. Chem., 1989, 61, 1857. Kato, T., Nakamura, S., and Morita, M., Anal. Sci., 1990, 6, 623. Plantz, M. R., Fritz, J. S., Smith, F. G., and Houk, R. S . , Anal. Chem., 1989,61, 149. Akatsuka, K., McLaren, J. W., Lam, J. W., and Berman, S . S . , J. Anal. At. Spectrom., 1992, 7 , 889. Shabani, M. B., Akagi, T., Shimuzu, H., and Masuda, A., Anal. Chem., 1990,62, 2709. Shabani, M. B., Akagi, T., and Masuda, A., Anal. Chem., 1992, 64, 737. Heithmar, E. M., Hinners, T. A., Rowan, J. T., and Riviello, J. M., Anal. Chem., 1990, 62, 857.
Publ
ishe
d on
01
Janu
ary
1993
. Dow
nloa
ded
by B
row
n U
nive
rsity
on
25/1
0/20
14 2
1:01
:15.
View Article Online

286 JOURNAL OF ANAILYTICAL ATOMIC SPECTROMETRY, MARCH 1993, VOL. 8
16 Boomer, D. W., Powell, M. J., and Hipfner, J., Talunta, 1990, 37, 127.
17 Ketterer, M. E., Anal. Chern., 1990, 62, 2522. '
18 Mukai, H., Ambe, Y., and Morita, M., J. Anal. At. Spectrom., 1990, 5, 75.
19 Nakashima, S., Sturgeon, R. E., Willie, S. N., and Berman, S. S., Fresenius' J. Anal. Chem., 1988, 330, 592.
20 Sturgeon, R. E., Berman, S. S., Willie, S. N., and Desaulniers, J. A. H., Anal. Chem., 1981, 53, 2337.
Paper 2/04 00 9C Received July 27, 1992
Accepted October 12, I992
Publ
ishe
d on
01
Janu
ary
1993
. Dow
nloa
ded
by B
row
n U
nive
rsity
on
25/1
0/20
14 2
1:01
:15.
View Article Online