on global climate change: unnatural disasters global climate... · sea level changes are hard to...
TRANSCRIPT
On Global Climate Change:Unnatural Disasters
Norden E. Huang National Central University
Research Center for Adaptive Data Analysis
FuBang, Taipei 2011

Global warming will create hazards, of course; Should the hazard become disasters?
Let us look at the future.
So, we can conclude the following:
The Earth is warming relentlessly, though not as fast. The Earth has experienced high natural temperature.

Part III. The Future
How to face the consequences and avoid the unNatural disasters
The future• Climate Change had created considerable concerns and confusions.
Meanwhile, the Earth is undergoing an anthropogenic warming up slowly.
• Given the individual country’s conflicting interest, to limit the CO2 emission to the 2oC scenario given in IPCC AR4 is unlikely, if not impossible.
• Therefore, for the foreseeable future, the global warming would continue and even intensify.
• Rather than ranting against the hazards of global warming, we should think of what to do and how to live with its consequences.
• The strategy should be Sustainable Development coupled with prevention, mitigation relief and adaptation.

United Nations
& World Bank
2010
Recommended by 6 Nobel Economics
Laureates.

“Earthquakes, droughts, floods, and storms are natural hazards, but the unnatural disasters are deaths and damages that result from human acts of omission or commission.”
Natural hazards and un-Natural Disasters

The Reality
How serious is the 2oC limit?Where does it come from?

Equilibrium Climate Sensitivity30 years ago, Jules Charney took the average warming to a doubling of CO2 from two climate models:
2oC from Suki Manabe at GFDL and 4oC from Jim Hansen at GISS
To get the mean “climate sensitivity” of 3oC,and added 0.5oC to both sides of the error bar to obtained the range:1.5o-4.5oC.
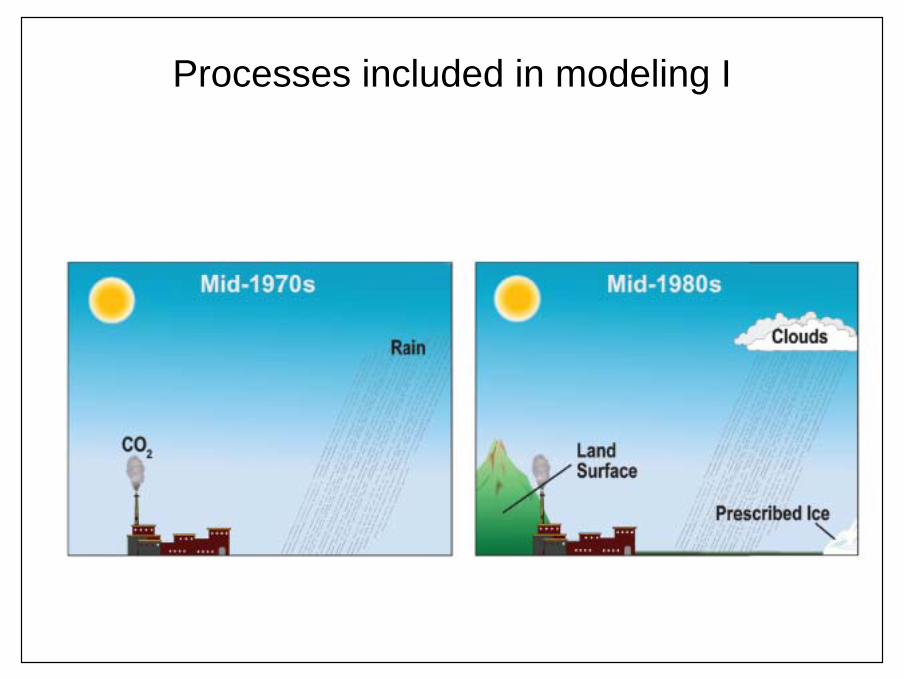
Processes included in modeling I

Processes included in modeling II

Processes included in modeling III

Extensive processes included in modeling

Model resolutions

A History of Climate Sensitivity Estimates


S. Schwartz, 2010

The 2oC Scenario• It is arbitrary to begin with.• In order to achieve this goal, we have to cut
emission by 2.8% per year to 2020, then double to 5.5% for 2020 TO 2035.
• It is too good to be true: To achieve it we have to reduce our carbon consumption to zero after 2100, which would be impossible!
• Therefore, there seems to be a consensus thatthe plan to limit carbon consumption to this level is over!

The 2oC ScenarioWorld Bank: Development and Climate Change 2010

Carbon Consumption: for selected countries
1750 1800 1850 1900 1950 2000 205010
1
102
103
104
105
106
107
T im e : Y e ar
Car
bob
Con
sum
ptio
n: 1
000
Ton
C arbon C onsum ption for Se le cte d C ountrie s
UKUSAC HINAGERM A NYJA PA NW EST ERN E-T RA DIT IONA LW EST ERN E-OA K RIDGEEA ST ERN E-OA K RIDGE

What will be the consequences?
If we breach the 2oC limit

Environmental Literacy CouncilPossible Consequences of Global Warming : 4 / 2008
• Rising sea levels: Island countries and the Netherlands
• Melting Arctic sea ice • Increasing ocean temperatures • Severe weather: hurricanes, floods and draughts
• Warmer winters• Agriculture• Human health implications: spread of diseases
• Other species: extinction due to lack of adaptation. Note the changes from Ice Age to Intergalactic Period were much more drastic!

Mean Winter Temperature - UK

Facing the Consequences
• Development, sustainable developmentand couple with the following measures:– Prevention– Mitigation– Relief– Adaptation
Natural Hazards UnNatural Disasters

Poverty and Over Population are the sure ways making people succumb to disasters
But to get out of poverty, we need economic growth and economic growth needs energy; history tells us that only economic growth could get us out of the
harm’s way.
Sustainable growth should be our goal;Sustainable growth should also include social justice.

全球人口增加趨勢

Number of disasters reported: 1900-2009

Number of people killed in disasters: 1900-2009


Damages Expand Middle-income Countries

Deaths Expand Africa

Per capita income/disaster
Life expectancy vs. incomeHappiness vs. income

富裕國家的人民災害傷亡較低
102
103
104
105
10-2
10-1
100
101
102
103
PPP Per Capita GDP : $
Cas
ualty
: Pe
rson
/Mill
ion
Casualty in Disasters
CN
TW
US

富裕國家的人民壽命較長
103
104
105
30
40
50
60
70
80
90
100
PPP Per Capita GDP : $
Life
Exp
ecta
ncy
: Yea
rLife Expectancy vs. PPP Per Capita GDP
CN
TWUS

Happiness Index Economist November 27, 2010

Carbon consumption pattern history

Per Country Greenhouse Emission, 2000

Per Capita Greenhouse Emission, 2000

GDP pattern : US vs. China

Energy demand pattern : US vs. China

CO2 emission pattern : US vs. China

Developed Countries: Carbon Consumption per GDP
1820 1840 1860 1880 1900 1920 1940 1960 1980 2000 20200
0.1
0.2
0.3
0.4
0.5
0.6
0.7
0.8
0.9
year
carb
on(1
000m
etric
tons
)per
GD
P(p
erm
illion
dolla
rs)
carbon emission per GDP value of selected developed countries
AUSTRALIAAUSTRIABELGIUMCANADADENMARKFINLANDFRANCEGERMANYHONGKONGISRAELITALYJAPANNETHERLANDSNORWAYSPAINSWEDENSWITZERLANDTAIWANUKUSA

Developing Countries: Carbon Consumption per GDP
1880 1900 1920 1940 1960 1980 2000 20200
0.1
0.2
0.3
0.4
0.5
0.6
year
carb
on(1
000m
etric
tons
)per
GD
P(p
erm
illion
dolla
rs)
carbo n em issio n per G D P value o f selected develo ping co untries
BRA Z ILC A RC HIL EC HINAC UBAINDIAJORDA NM EXIC OPOL A NDSA FRIC ASKOREAT HA IL A NDT URKEYUSSR

OPEC Countries: Carbon Consumption per GDP
1940 1950 1960 1970 1980 1990 2000 2010 20200
0.5
1
1.5
2
2.5
carb
on(1
000m
etric
tons
)per
GD
P(p
erm
illion
dolla
rs)
carbo n em iss io n per G D P value o f O P E C C O U N T R IE S
IRA NKUW A ITUA EA L GERIAA NGOL AGA BONIRA QINDONESIAL IBYANIGERIAQUA T A RSA UDIA RA BIAV ENEZ UEL A

Prevention, Mitigation, Relief and Adaptation
• Reduce Carbon emission, stress energy intensity or efficiency tomitigate the tension between growth and environment; transfer energy technology to developing countries.
• Improve infrastructures: flood control, transportation, public health, …
• Protect natural environment, forestation, … Protect natural habitats for all species.
• Control pollution of air, water, soil.
• Migrate and adaptation: change life style.
• Developing insurance industry.

Some examplesNatural Hazards

Sea Level Change


Delta Works
1B/year

Delta Works

Venice MOSE project : cost 4.727B euro

Sea Level Change Data : University of Colorado, Boulder

IMF Sea Level Change
0 1 0 0 2 0 0 3 0 0 4 0 0 5 0 0
2 8 0 5
2 2 4 4
1 6 8 3
1 1 2 2
5 6 1
0
IM F S e a L e v e l C h a n g e
T im e : 3 4 p o in ts /Y e a r

IMF Fitting 6
1 9 9 2 1 9 9 4 1 9 9 6 1 9 9 8 2 0 0 0 2 0 0 2 2 0 0 4 2 0 0 6 2 0 0 8 2 0 1 0-3 0
-2 0
-1 0
0
1 0
2 0
3 0
4 0
T im e : Y e a r
Sea
Leve
l Cha
nge
: mm
S e a L e v e l C h a n g e : D a ta a n d IM F (6 )
D a taIM F 6

Sea level Change : Various Fittings
1 9 9 2 1 9 9 4 1 9 9 6 1 9 9 8 2 0 0 0 2 0 0 2 2 0 0 4 2 0 0 6 2 0 0 8 2 0 1 0-3 0
-2 0
-1 0
0
1 0
2 0
3 0
4 0
T im e : Y e a r
Sea
Leve
l Cha
nge
: mm
S e a L e v e l C h a n g e s : T o p e x /J a s o n S a te llite D a ta
y = 3 .1 *x - 6 .1 e + 0 0 3
D a ta l in e a rH H T T re n d+ 9 5 %-9 5 %

Rate of Sea Level Change : Various Fittings
1 9 9 2 1 9 9 4 1 9 9 6 1 9 9 8 2 0 0 0 2 0 0 2 2 0 0 4 2 0 0 6 2 0 0 8 2 0 1 00
0 .5
1
1 .5
2
2 .5
3
3 .5
4
4 .5
5R a te o f S e a L e v e l C h a n g e
T im e : Y e a r
Rat
e Se
a Le
vel C
hang
e : m
m/y
ear
L in e a r T re n dH H T T re n d

Sea Level Change vs. ENSO Index
1990 1992 1994 1996 1998 2000 2002 2004 2006 2008 2010-3
-2
-1
0
1
2
3
Time : Year
Sign
al S
tren
gth
Data : ENSO Index and Sea Level IMF5
ENSO Index Sea level IMF5

Sea Level Change vs. ENSO Index
-200 -150 -100 -50 0 50 100 150 200
-0.5
-0.4
-0.3
-0.2
-0.1
0
0.1
0.2
0.3
0.4
0.5
Cross-Correlation between ENSO Index and IMF Sea Level
Lag Time : Year
Cro
ss-C
orre
latio
n C
oeffi
cien
t

Observations
• Comparison between the most recent 120 years seal level change data with Global Surface Temperature Anomaly data, the sea level increasing seems to be pretty constant without noticeable ‘acceleration’. But, sea level changes are hard to pin down.
• The most objective reference is the satellite data from Topex/Jason. Based on satellite data from 1992, the sea level change rate was not a constant: it was fast before 2005 at around 3 mm/year, and gradually settled down to near zero.
• Based on the limited data, the sea level change seems to have a weak correlation with ENSO phenomenon.

Hurricanes and Typhoons

Hurricane climatology: Top : Observed; bottom : model

Modeled Effect of Global WarmingOn Hurricane frequency

What does the real data indicate?
It seems that The trend is unclear.

US Hurricane Frequency: Y: TC; G: Named; R: >Category 3

US Hurricane Frequency ; Decadal Averaged + GSTA
1 8 4 0 1 8 6 0 1 8 8 0 1 9 0 0 1 9 2 0 1 9 4 0 1 9 6 0 1 9 8 0 2 0 0 0 2 0 2 00
5
1 0
1 5
2 0
2 5
3 0
3 5
T im e : Y e a r
# H
urric
ane
> C
ateg
ory
3
H u rr ic a n e F re q u e n c y : D e c a d a lly A v e ra g e d
H F D e c a d a lH F D e c a d a lG S T A

Hurricane Frequency Multi-Decadal vs. GSTA
1840 1860 1880 1900 1920 1940 1960 1980 2000 2020-0.4
-0.2
0
0.2
0.4
0.6
0.8
1Comparison between Multi-decadal IMFs : Hurricane and GSTA
Time : Year
Strn
gth
of IM
F
IMF5 Hurrance frequencyIMF5 GSTA Annual*2

X-Corr: Hurricane Frequency Multi-Decadal vs. GSTA
-150 -100 -50 0 50 100 150-0.8
-0.6
-0.4
-0.2
0
0.2
0.4
0.6Cross-Correlation between Multi-decadal IMFs : Hurricane and GSTA
Lag Time : Year
Cro
ss-C
orre
latio
n C
oeffi
cien
t

Observation of Tropical Cyclones JCL Chan & KS Liu J. Climate 2004

Is global warming the culprit?
• “NOAA News Releases” Thursday, February 21, 2008 12:27 PM
• Subject: NOAA: Increased Hurricane Losses Due to More People, Wealth Along Coastlines, Not Stronger Storms: A team of scientists have found that the economic damages from hurricanes have increased in the U.S. over time due to greater population, infrastructure, and wealth on the U.S. coastlines, and not to any spike in the number or intensity of hurricanes.

Is there a cycle in Hurricane frequency?
• From the hurricane frequency of all category 3 or stronger, there also seems to be 65 years cycles : maxima at 1880, 1950, 2010. This coincides with the GSTA maxima at the similar time periods at 1880, 1940 and 2010, very suggestive!?
• From the decadal averaged statistics, there seems to be a ~ 60 years cycle; with data showing a weak cross-correlation (~60%) between Hurricane frequency with GSTA.
• In spite of the NOAA announcement, there seems to be a slight trend of increasing hurricane frequency with global warming. And also a cycle correlated with the AMO scale again. Further studyshould be conducted to use the ocean surface temperature insteadof the global surface temperature.

The visible border between Haiti and the Dominican Republic

Floods caused by Tropical Storm Hanna in Gonaives, Haiti

Forestation 2010 : Economist 23 September 2010

Haitian earthquake one year later, 1/12/2011
One Year LaterThis is the presidential Palace, one year after.
Total casualty 230,000.Total debris removed 5%.
Total number lost home : 2MPeople still homeless : 1.5 M

Glacier Melting

“Soot gets everywhere. Even into the world’s highest mountains
causing the glacier to melt, not air
temperature rising.”
Economist:
18 November 2010

Do not believe in Authority! Examine and Analyze the data!!
Is there an increasing in death rate due to global warming?
Does heat wave kill?

Heat Waves killed 70,000 in 2003

Google Trends: Obituary

Total Number of US Death Rate : National Center for Health Statistics GMWHIV_2005
1999 2000 2001 2002 2003 2004 2005 20060.075
0.08
0.085
0.09
0.095
0.1
0.105Monthly US Death Rate : 1999:2005
Time : Year
Dea
th R
ate/
1000

Global Surface temperature Anomaly
1999 2000 2001 2002 2003 2004 20050.2
0.25
0.3
0.35
0.4
0.45
0.5Annual Mean Surface Temperature Anomaly: 1999-2005
Time : Year
Tem
pera
ture
: 0 C

US Death Rate : Summer Months National Center for Health Statistics GMWHIV_2005
1999 2000 2001 2002 2003 2004 20050.075
0.076
0.077
0.078
0.079
0.08
0.081
Time : Year
Dea
th R
ate/
1000
Summer Months US Death Rate : 1999:2005
JuneJulyAugust

Life Styles

Behavior modification potential

Carbon Consumption: US vs. ChinaCoal Efficiency: 2005 32% 2030 40%

Species extinction

物種滅絕: 全球暖化 或 生態破壞

物種滅絕: 全球暖化 或 生態破壞

Global Land Mass Distribution

Scientists should admit our limitations
• We do not have the scientific knowledge to model climate changes precisely because we do not know the ocean well enough.
• We do not have the understanding of the water vapor cycle (clouds), which is the key to radiation balance.
• We do not have data long enough to build probability for extreme event, which is key to disasters frequency determination.

We have been wrong before, and we will be wrong in the future too.
But, we should try to be right through continuous research.
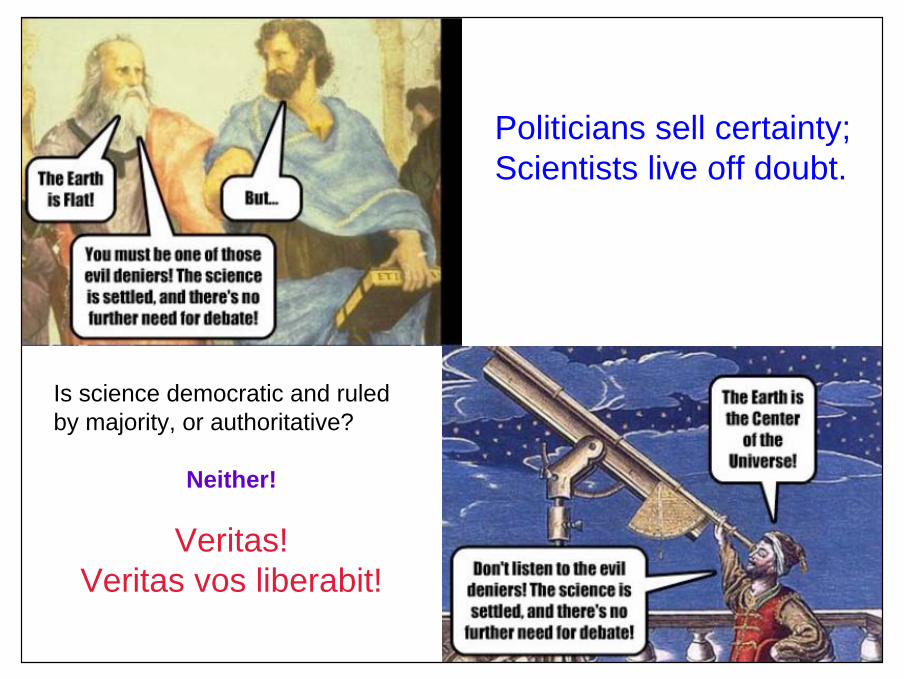
Politicians sell certainty; Scientists live off doubt.
Is science democratic and ruled by majority, or authoritative?
Neither!
Veritas! Veritas vos liberabit!

Paucity of data for extreme events statistics
We have hundred year precipitation almost every other year!
People thinking we are crying wolves!

Gallup Polls March 5-8, 2010

World Bank Findings• First, a disaster exposes the cumulative implications of
many earlier decisions, some taken individually, others collectively, and a few by default.
• Second, prevention is often possible and cost-effective.
• Third, many measures—private and public—must work well together for effective prevention.
• Fourth, the exposure to hazards will rise in cities, but greater exposure need not increase vulnerability.
• Develop disaster insurance to spread losses.

Adaptation
• Other than the material considerations and migration which are absolutely necessary for our survival, we should cultivate the right frame of mind.
• We have to keep our own inner space mentally if not physically: Like Tao Yuan-Ming,

Global Climate Change
• GCC is a scientific problem, but increasingly it has become– a political problem,– an economic problem, and – a societal problem.
• Let us work hard to understand it and plan to face its consequences before it becomes a religious problem.
I wish every one a warm and happy life!
Thank you!