omegawave: theory & practice - sport981 · omegawave: theory & practice ... first english...
TRANSCRIPT

Omegawave: Theory &
Practice
C.W. Morris

2
TABLE OF CONTENTS TABLE OF CONTENTS .............................................................................................................................. 2
INTRODUCTION ........................................................................................................................................ 3
THE TRAINING PROCESS ........................................................................................................................ 4
TRAINING THEORY: HISTORICAL PERSPECTIVE ............................................................................. 4
TRAINING THEORY: CRITICAL REVIEW ............................................................................................. 5
CONCLUSION ............................................................................................................................................. 8
OMEGAWAVE: MONITORING THE TRAINING PROCESS ................................................................. 9
FUNCTIONAL SYSTEMS THEORY ......................................................................................................... 9
DIRECT CURRENT POTENTIAL: THE BASICS ................................................................................... 10
HEART RATE VARIABILITY: THE BASICS ........................................................................................ 11
ENERGY SUPPLY STATE: THE BASICS .............................................................................................. 17
INDEX INTERPRETATION ..................................................................................................................... 18
ATHLETE READINESS: PHYSIOLOGICAL DASHBOARD ................................................................ 18
STATE OF AUTONOMIC TONE: FUEL FOR ADAPTATION ............................................................. 19
STRESS INDEX, FATIGUE, & ADAPTATION RESERVES ................................................................. 20
STATE OF CENTRAL NERVOUS SYSTEM: ADAPTATION HORSEPOWER .................................. 25
STATE OF ENERGY SUPPLY SYSTEM: ADAPTATION OCTANE ................................................... 26
PRESCRIPTION: WHAT ARE THE LIMITING FACTORS? ................................................................. 27
AUTONOMIC TONE: PARASYMPATHETIC DOMINANCE .............................................................. 29
AUTONOMIC TONE: SYMPATHETIC DOMINANCE ......................................................................... 30
CENTRAL NERVOUS SYSTEM: FUNCTIONAL STATE ..................................................................... 31
STATE OF ENERGY SUPPLY SYSTEMS .............................................................................................. 33
CONCLUSION ........................................................................................................................................... 35
REFERENCES ........................................................................................................................................... 36
ABOUT THE AUTHOR ............................................................................................................................ 37

3
INTRODUCTION
The Omegawave Team System provides an innovative approach to athlete preparation, one that
can be incorporated into any type of training program without radically changing the existing
methodology or representing a threat to the coach’s intuition. Omegawave’s approach centers on
the concept that the type, volume, or intensity of the training load should not be the primary
focus, but rather the timing of when the load is applied (5).
Omegawave’s technology is a synthesis of extensive research in the fields of neurophysiology,
cardiovascular physiology, and exercise physiology. The concepts put forth by this manual are
an extension of training theories established over 60 years ago, concepts which in their current
application are meant to provide objective feedback for analyzing and predicting how athletes
are adapting to their training sessions (4).
This manual is designed to answer the following questions for users of the Omegawave Team
solution:
- What foundation did modern training theory evolve from?
- What is the science behind Omegawave?
- What do all of these numbers actually mean?
- How do I use this information to help guide the training process?

4
THE TRAINING PROCESS
TRAINING THEORY: HISTORICAL PERSPECTIVE
In order to understand Omegawave’s approach towards athlete preparation, a quick overview of
the historical evolution of modern day training theory can be helpful. Training theory has roots
that stretch as far back as Ancient Rome; modern-day training theory, however, did not develop
until post-World War II. The following represents a timeline of the evolution of training theory:
- 1945: End of World War II
- 1948: Soviet Union creates committee dedicated towards research in physical work
culture aimed at increasing athletic talent selection and systematic athletic
development (6)
- 1952: First Soviet Union Olympic appearance post-research initiative, with the
country tying the USA in Olympic Games points (12)
- 1956: Soviet Union increased medal count nearly 40% and surpassed the USA in
total medal count (16)
- 1959: Nikolai N. Yakovlev introduces supercompensation theory, the fundamental
basis behind training theory (15)
- 1964: Soviet Union professor Lev Matveyev publishes The Fundamentals of Sport
Training (in Russian), the first introduction of training periodization (10)
- 1981: First English language translation of The Fundamentals of Sport Training (9)
- 1981: Foundation of the National Strength and Conditioning Association (NSCA)
- 1982: Michael Stone and colleagues adapt Matveyev’s periodization model for
strength and power athletes in the United States (13)
- 1982-Present: NSCA promotes training periodization in monthly research journals
and training periodization becomes the preferred method for many strength and
conditioning coaches nationwide
Soviet scientists made invaluable early contributions to the fields of exercise physiology and
athletic development. In practice, these training methods showed their effectiveness through the
nation’s considerable success in world sporting events; due to the Cold War and the Soviet
Union’s strict guidelines on international research collaboration, however, as the theories were
developed they rarely reached beyond the Eastern Bloc countries. In fact, many of the seminal
works of modern training theory remained untranslated until the 1980’s. At that same time, a
number of the training methods popular in the West were based on training as an art, an approach
that prioritized intuition and experience over hard science. The development of the NSCA and
the Journal of Strength and Conditioning Research promoted the efficacy of Soviet methods
based upon the science and technology available in the 1960’s. Supercompensation theory still
remains the backbone of most training regimens, while periodization continues to be the gold
standard of training methods utilized by strength and conditioning professionals.

5
TRAINING THEORY: CRITICAL REVIEW
While training periodization and supercompensation theory are still highly regarded and subject to a
considerable body of research among strength and conditioning professionals, both are open to a fresh
critical evaluation. The very backbone of training periodization may also be its biggest limitation.
Figure 1. Supercompensation Theory in Response to Training Load
Supercompensation Theory: Limitations & Contentions
1. Limitation in scope
The supercompensation model implies that the human organism will uniformly adapt to all training
stimuli regardless of training type (cardiovascular, strength, power, etc.). In this model, the only factors
that can influence the rate of supercompensation are the volume and intensity of the training session. This
theory portrays the human system as a whole, failing to recognize the individual systems that are depleted
during a given training session. In reality, supercompensation is better illustrated by the following figure:
MUSCLAR HORMONAL CARDIO-PULMONARY CNS ENERGY SUPPLY
Figure 2. Multi-System Supercompensation Model
Physiological State
Prior to Training
Stimulus
Alarm Stage
(Fatigue)
Compensation (Recovery)
Supercompensation
Training too easy
Training optimal
Training too hard
MUSCULAR HORMONAL CARDIO-PULMONARY CNS ENERGY SUPPLY

6
2. Not all slopes are created equal
The standard supercompensation curve is simple, straightforward, and linear. However, due
to the unique genetic makeup of each athlete and the differing situational stressors present at
the time of a training stimulus, the curves and durations of supercompensation can vary
drastically between individuals. Likewise, one system may achieve supercompensation while
at the same time others may fail to do so. For example: A student-athlete completes a high
intensity, power-speed workout on Monday, which stresses their central nervous system.
According to supercompensation theory, this athlete should be able to receive a similar type
of training stimulus 24-48 hours later. Assume, however, that the original workout was
followed by two important exams, with the tests scheduled during the recovery time frame.
The subsequent mental stress from the exams can disrupt supercompensation of the CNS,
hormonal, and muscular systems, delaying the timing in which the athlete can sufficiently
train and adapt to a similar training load.
Figure 3: Factors Affecting Time to Supercompensation Following Training Stimulus
3. Changing Times: Modern athletes train with different conditions and oversight
Soviet scientists made pioneering discoveries in the fields of exercise physiology and athletic
development, laying the foundation for many of the training theories prevalent today. Their
methods were revolutionary, leading to regular podium slots and high medal counts at the
Mental Stress
Financial Stress
Social Stress
Training Stress
Inadequate Sleep Stress
Nutritional Stress

7
Olympic Games. Many scholars, however, suggest that athletes behind the “Iron Curtain”
owed part of their success to financial incentives, pharmaceutical enhancements, and—most
importantly—lifestyles dedicated exclusively to training and recovery. The training theories
advanced by Soviet scientists, therefore, were based upon an ideal training environment, one
where the training process was subject to complete control. Environmental factors that might
limit supercompensation were minimized, while natural recovery was potentially enhanced
by pharmaceutical agents (which at that time were still legal).
Today’s competitors are exposed to a multitude of environmental stressors that did not exist
for those athletes studied over 60 years ago. Social media alone places both collegiate and
professional athletes under a ceaseless microscope, with a constant demand from both fans
and media outlets. Competitive seasons have grown longer, and the amount of travel has
multiplied significantly. While athletes face an increase in environmental stressors and time
demands, which vary widely from one individual to the next, the training process has
remained consistent, regardless of the athlete’s functional state.
Traditional periodization places the training volume and intensity as the point of control,
regardless of the athlete’s functional state. In contrast, Omegawave’s approach situates the
athlete as the object of control, adjusting their workout to accommodate their daily functional
state. Due to the vast genetic and environmental variability between athletes, it is crucial that
the training process remain fluid rather than fixed. The following figure represents the
conventional training approach, contrasted with our method of athletic development (5).
Figure 4. Traditional Approach (А) & Omegawave’s Approach (B) to Athlete Preparation.

8
CONCLUSION
Periodization and supercompensation are valid theories that have produced great athletes and
helped earn numerous Olympic medals, but the environment in which athletes are trained has
changed over time. Additionally, advances in science and technology have allowed us to
examine each athlete’s specific, individualized response to training loads.
It is not our intention to discredit the training theories established by the trailblazing scholars and
scientists who came before us. Instead, we seek to build upon this sturdy foundation and better
serve the athletes we train today. To borrow from Sir Isaac Newton (with a twist), “What the
Soviet Union’s scientists did was a good step… if we have seen farther, it is by standing on the
shoulders of Giants.”

9
OMEGAWAVE: MONITORING THE TRAINING PROCESS
FUNCTIONAL SYSTEMS THEORY
Functional System – a dynamic, self-regulating structure of biological components that work in
unison to achieve a useful adaptive result for the athlete (5)
The human organism is designed with one overpowering purpose: survival. That organism
doesn’t seek to win medals or earn recognition as a world class champion; instead, it works to
become the most efficient machine possible, accomplishing this innate goal by formulating
functional systems to reduce the physiological costs of external stressors.
Example: Let’s take an untrained individual, a blank canvas, who is seeking to become an
endurance athlete. The training process elicits the following physiological reaction, with the
creation of a specific functional system.
Figure 5. Formation of Functional System in Response to Aerobic Training Load (adapted
from Fomin, Nasedkin 2015)
Classic anatomy and physiology texts suggest that each biological system acts in isolation in
response to training demands; functional systems, however, recruit and bind subordinate systems
and individual organs to act as a single mechanism, reducing the physiological cost of exertion
and increasing the efficiency of the organism (2). In our example, the coordination and
collaboration of the selected biological systems decrease the time to aerobic stabilization; which,
in turn, decreases the reliance on glycolytic resources and thus decreases the overall
physiological costs (5).
ADAPTIVE RESULT USEFUL FOR THE ORGANISM

10
DIRECT CURRENT POTENTIAL: THE BASICS
Direct Current (DC) Potential of the Brain – brain biopotentials within a frequency range that is lower
than the EEG range (0-0.5 Hz), also referred to as the Omega potential (8).
DC potential is an integrative indicator of the functional state, representing the cumulative activity of all
functional systems in the central nervous system (8). The above example (of our novice endurance
runner) is just one of the thousands of functional systems a human organism can display. Functional
systems exist for skill acquisition and execution, such as learning and performing a squat, or completing a
high velocity change of direction. Additionally, functional systems are responsible for learning, memory,
psychological responses to stress and adversity, and—most importantly—the adaptive capability of the
organism. Thus, when the direct current potential is in a reduced state, the athlete’s ability to learn,
complete complex movements, and adapt are limited. Training in such a reduced state can lead to
maladaptation or even injury. The following represents a range of DC potential readings and the
corresponding functional state.
Figure 6. Direct Current Potential Curve Analysis
These curves represent a few of the DC potential readings your athletes will present. There may be
variations of the above curves, but there are several consistent factors to consider when interpreting the
DC potential curve.
1: Shape of the curve – The curve should initiate from an optimal value (45mV and higher) and progress
smoothly to stabilization within the optimal range.
2: Time to stabilization – Optimal time to stabilization should occur between 1-3 minutes
3: DC resting potential – Resting potential should stabilize within 9-45 mV
Reduced CNSOptimal CNS Strained CNS Unstable CNS Unstable CNS
Characteristics:- DC potential
initiation and stabilization within optimal ranges
- Time to stabilization within 1-3 minutes
Significance:- Optimal level of
adaptive capabilities
- Optimal level of skill acquisition and execution
Characteristics:- DC potential
stabilization below optimal range
Significance:- State of
exhaustion - Reduced ability to
execute adaptive processes
- Reduced ability to learn and execute previously learned movements
Characteristics:- DC potential
stabilization above optimal range
Significance:- State of tension - Reduced ability to
coordinate functional systems
- Think of a computer with a lot of applications running and you trying to open one document (Slow and Difficult)
Characteristics:- DC potential
failure to stabilizeSignificance:- State of tension- Reduced ability to
coordinate functional systems
- Typical of individuals with high levels of anxiety
- Prevalence of psycho-emotional stress
Characteristics:- DC potential
inversion Significance:- State of tension- Reduced ability to
coordinate functional systems
- Typical of individuals with spontaneous levels of anxiety
- Prevalence of psycho-emotional stress

11
HEART RATE VARIABILITY: THE BASICS
Heart rate variability (HRV) has become a widely used tool for evaluating the autonomic nervous system
(ANS) and assessing the functional state of athletes on a daily basis (3). With its two branches
(sympathetic and parasympathetic), the ANS regulates the homeostatic functions of the body. Since
human beings are in a perpetual cycle of homeostatic disturbance (sympathetic input), homeostatic
restoration (parasympathetic input), or homeostasis (autonomic balance), an analysis of the ANS through
HRV can be an effective method of monitoring the training status of your athletes. This simple, non-
invasive measurement provides information regarding the state of the autonomic nervous system by using
a mathematical analysis of the beat-to-beat, QRS complex (R-R) intervals as shown below.
Figure 7. Mathematical Analysis of R-R intervals Shown in Milliseconds
The Omegawave Team system provides a comprehensive analysis of HRV parameters, including five
parameters established by Russian scientists and the ten standard “time and frequency” parameters
established by the European Society of Cardiology and the North American Society of Electrophysiology
(4). These parameters can be found on the HRV1 tab of the team system and are highlighted in the picture
below. A glossary of parameter definitions can be found in the appendix.
R R R R R R R R
940 920 960 845 860 835 920
± 73.2ms

12
From a global perspective, the autonomic nervous system is responsible for maintaining the
body’s homeostatic environment. Any external influence that disrupts homeostatic equilibrium—
at any level—will activate the sympathetic nervous system, which in turn mobilizes resources to
fulfill the metabolic need. Once the need is satisfied, the parasympathetic nervous system slows
down the metabolism and brings the body back to its baseline. Both of these systems work
together to act as the gas (sympathetic) and brake (parasympathetic) pedals in supplying the
body’s metabolic fuel.
Figure 8. Homeostatic Equilibrium in the Internal Environment
In a perfect world, environmental stressors would be kept to a minimum while sleep, nutrition,
and training would be the predominant focus for all of our athletes. Following WW II, athletes in
the Soviet Union were trained in this type of environment and enjoyed notable success at the
Olympic level. Many of the training methods we employ today are based upon those
foundational theories; today’s training environment, however, is far from identical. The
following figures represent what supercompensation theory is intended to reflect based upon
Soviet methods, as well as supercompensation theory corrected for environmental stressors.
HomeostasisInternal Environment Internal Environment
External Influences
Homeostatic reactions
Homeostatic DisturbancesSympathetic Activation
Homeostatic RestorationParasympathetic Activation
Any external influence that disrupts homeostatic equilibrium is a stress

13
Figure 9. Ideal Mechanism of Adaptation Following Intense Muscular Exercise
Figure 10. The Effect of Environmental Stressors on Recovery Following Intense Muscular
Exercise
There will be times in which athletes will indeed recover as indicated in Figure 9; subsequently, they will
be able to complete the next training session as planned. There will also be days (or even weeks), during
which life presents extra challenges in the form of exams, financial struggles, relationship disputes, or
social media pressure, all of which will affect the athlete’s recovery mechanisms and compromise their
ability to positively adapt to certain training loads.
WORK RECOVERY
Loading Unloading
Homeostatic Restoration
Non-specific mechanism of adaptation to intense muscular exercise
Intense Muscular Work
Tissue Protein Depletion
Accumulation of Metabolites
Homeostatic Disturbance
Restful Nights Sleep
Elimination of Metabolites
Protein Re-sythensis
Homeostatic Restoration
Homeostatic Disturbances
WORK RECOVERY
Loading Unloading
Homeostatic Restoration
Non-specific mechanism of adaptation to intense muscular exercise
Intensive Muscular Work
Tissue Protein Depletion
Accumulation of Metabolites
Homeostatic Disturbance
Restful Nights Sleep
Elimination of Metabolites
Protein Re-sythensis
Homeostatic Restoration
Homeostatic Disturbances

14
Using the Omegawave Team system and its HRV indexes, strength coaches have the ability to track the
evolving functional states of their athletes. HRV assesses the current internal load and should be viewed
as a barometer or fuel gauge for adaptation. The following figure represents the spectrum within which
HRV and autonomic tone should be interpreted.
Figure 11. Work-Recovery Autonomic Cycle Following Intense Training Session
It cannot be assumed that this cycle progresses in a time-independent manner as presented in training
periodization and supercompensation theory. Using HRV as a guide will allow you to choose a load
which the athlete can handle on a given day, loads which can be targeted for specific Windows of
Trainability (or “openings” in which an athlete can positively adapt to training loads directed toward a
range of physical qualities). These Windows will open and close in varying degrees throughout the Work-
Recovery Cycle, reiterating the idea that the timing of the training stimulus should take precedent over
training load or volume.
These concepts (and the actual statistical and spectral analysis) reflect the principles of HRV most widely
accepted by the European Society of Cardiology and the North American Society of Electrophysiology.
Though a good representation of Hans Selye’s “General Adaptation Syndrome” and the autonomic
systems neurohumoral regulation of homeostasis, these concepts reflect a Western-based view of HRV
analysis and negate an extensive body of Soviet space medicine research. It is important to understand the
role of functional systems theory and biological cybernetics as it will become useful when discussing
index interpretation.
WORK – RECOVERY AUTONOMIC CYCLE

15
Biological Cybernetics – the study of the controlling or governing mechanisms of homeostasis
The functional system responsible for the regulation of blood flow is a multi-circuit, hierarchical, self-
organizing system in which the dominant role of the individual components is determined by the current
need in the body (Baevskii, 2002). The biological cybernetic approach presents a two-circuit model for
heart rhythm regulation including central and autonomic components. The scheme of the two-circuit
model is shown in figure 12.
The functional system of blood flow regulation and biological cybernetic representation of the two-circuit
model of heart rhythm is a more comprehensive method of understanding the complexity of HRV
analysis. The neurohumoral regulation of functions, as presented earlier, only takes into consideration the
ANS effects on blood flow, which was referred to as the gas (sympathetic) and brake (parasympathetic)
model. The cybernetic approach is more holistic and recognizes the importance of the central circuit in
blood flow regulation.
The cybernetic model can be thought of as a hybrid vehicle, a two-circuit model in supplying energy/fuel
to the working parts of the car via electric and traditional gas circuits. When energy demand is low (i.e.
cruising speeds), the electric supply system is able to accommodate the need; when the need to accelerate
quickly arises, however, it prompts a shift in circuits. The shift towards the gas circuit is the first step in
supplying the demand, the autonomic shift towards central circuits. If the supply does not meet the
demand (i.e. you are drag racing in a Prius), then different gears must be activated to achieve the end
goal. This is both an example of functional systems theory (the car reorganizing its fuel system to meet a
demand) and biological cybernetics (the two circuit model of the hybrid vehicle).

16
Figure 12. The scheme of a two-circuit model of heart rhythm regulation (Adapted from Baevskii, 2002)

17
ENERGY SUPPLY STATE: THE BASICS
Throughout the 1960’s and into the late 1980’s, Professor S.A. Dushanin made monumental discoveries
by examining the bioelectrical activity of the heart as it correlates to the body’s energy supply state. His
methods were utilized during the early development of Omegawave when the energy supply state was
examined using a multi-lead ECG; this method, however, proved to be impractical for analysis in the field
as laboratory conditions were required. Over the past decade, Omegawave has expanded upon Dushanin’s
methods based upon our extensive and diverse athletic database. The use of the Omegawave method
provides a practical assessment of the energy supply state with the use of a single lead ECG.
Although our methods have deviated from Dushanin’s, the strong correlation between cardiac and skeletal
muscle energy supply is still fundamental. Since skeletal and cardiac muscle share similar structures and
common biochemical reactions, longitudinal training adaptations to specific training modalities elicit
correlative changes in both (as was observed throughout the studies performed on members of the
Swedish cyclic sport teams) (14). This relationship allows for the analysis of specific characteristics of the
QRS complex, which provide an assessment of the energy supply state at the cardiovascular and skeletal
muscle level.
In simple terms: This assessment does not refer to the ability to generate power or force, but instead
reflects the body’s ability to efficiently supply the range of energy demands during exercise. Imagine, for
example, a vehicle that has a clogged fuel injector. The ability to supply fuel to the engine is limited,
which causes a decrease in performance and an increase in fuel consumption. The vehicle will run and
likely make it from point A to B; the cost of the trip, however, will be much more significant than it
would with a vehicle running with an efficient fuel supply. The following figure represents two athletes
with contrasting energy supply systems:
Figure 13. Energy Supply System Comparison
The energy supply system analysis is a snapshot of the previous 14+ years of the athlete’s development
and cannot be interpreted as an acute condition—thus, a longitudinal approach must be considered.
Strength and conditioning professionals will inherit athletes with vastly different energy supply systems:
these systems are developed over the course of many years and are influenced by a host of factors ranging
from genetics to sport specificity to personal lifestyle. Even though an athlete might present an inefficient
energy supply system, that doesn’t mean they will not perform at a high level—it simply reflects the
potential costs of the specific training.
Efficient Energy Supply System Inefficient Energy Supply System

18
INDEX INTERPRETATION
ATHLETE READINESS: PHYSIOLOGICAL DASHBOARD
The Athlete Readiness tab of the Omegawave Team system can be thought of as the athlete’s
physiological dashboard. Much like the dashboard in your vehicle, it displays the status of the critical
components that drive the physiological processes behind training and adaptation.
All of the information displayed on the Athlete Readiness page is a summary of the HRV assessment,
Omega Assessment, and the QRS complex amplitude-frequency assessment. The majority of training
adjustments can be based upon the information displayed here; in addition, however, a comprehensive
analysis is provided in the respective tabs located above the Athlete Readiness data.
Current State of the Cardiac System:
The Stress Index, Fatigue, and
Adaptation Reserves are based upon the
HRV assessment. Additionally, the
assessment reflects the current state of
the Autonomic Nervous System function.
This is the fuel gauge for adaptation and
displays the potential resources needed to
complete the adaptation process.
Current State of the Regulatory
Mechanism: The CNS, Gas Exchange
System, Detoxification System, and
Hormonal System parameters are based upon
the first and second Omega (DC Potential)
assessment. These systems are the engine
that drive adaptation and this parameter
reflects the “horsepower” of the engine.
Current State of Energy Supply Systems: The Metabolic Reaction Index reflects the overall
effectiveness and coordination of the metabolic system to support training loads. This parameter
reflects the “octane,” indicating the speed in which metabolic reactions occur to supply the energy
needed during training sessions.

19
STATE OF AUTONOMIC TONE: FUEL FOR ADAPTATION
In the interests of science and to better explain the sensitivity of HRV parameters, the following data is
offered to show a picture of the cardiac system following a night spent celebrating the completion of a
doctoral program. These results (hopefully) represent a worst-case scenario, but serve to illustrate how the
Stress Index, Fatigue, and Adaptation Reserves are impacted by real-life events. Based on the Athlete
Readiness screen alone, it is obvious that the state of the cardiac system and autonomic function are
limiting factors and training modification must be considered.
Looking deeper at the comprehensive analysis in the HRV1 & HRV2 tabs, the screens indicate how the
parameters for the Stress Index, Fatigue, and Adaptation Reserves parameters are calculated (with the
final numbers based upon the theories outlined previously, with the five Russian-influenced parameters,
and the ten time/frequency domain parameters set forth by the European Society of Cardiology and the
North American Society of Electrophysiology) (1). The following section represents an analysis of
athletes who are in optimal states of readiness as compared to those who are in states of sympathetic or
parasympathetic dominance.

20
STRESS INDEX, FATIGUE, & ADAPTATION RESERVES
Optimal State of Readiness Non-Optimal Sympathetic Dominant
Stress – the level of tension on the cardiac system in response to physical and mental loads. How stressed is the body today?
Fatigue – the state of excessive or prolonged stress in response to physical and mental loads. How tired are the regulatory systems?
Adaptation Reserves – a reflection of the adaptation “fuel” to physical and mental loads. How much can I handle today?
21
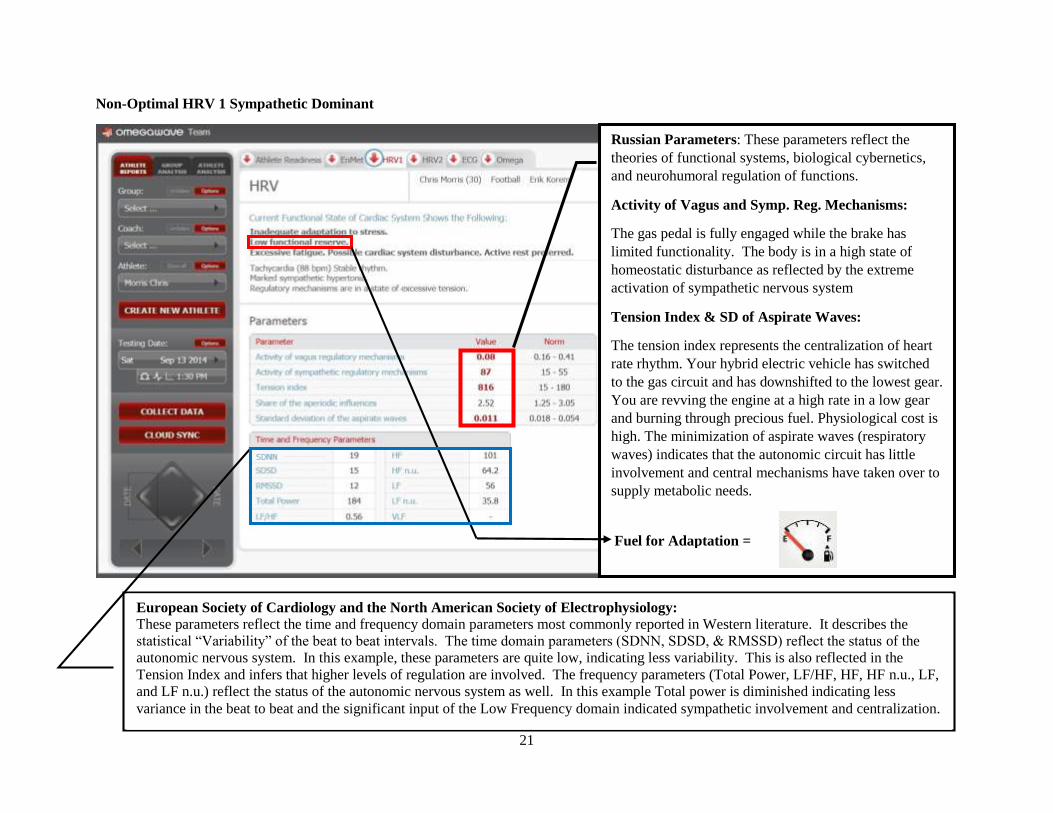
Non-Optimal HRV 1 Sympathetic Dominant
Russian Parameters: These parameters reflect the
theories of functional systems, biological cybernetics,
and neurohumoral regulation of functions.
Activity of Vagus and Symp. Reg. Mechanisms:
The gas pedal is fully engaged while the brake has
limited functionality. The body is in a high state of
homeostatic disturbance as reflected by the extreme
activation of sympathetic nervous system
Tension Index & SD of Aspirate Waves:
The tension index represents the centralization of heart
rate rhythm. Your hybrid electric vehicle has switched
to the gas circuit and has downshifted to the lowest gear.
You are revving the engine at a high rate in a low gear
and burning through precious fuel. Physiological cost is
high. The minimization of aspirate waves (respiratory
waves) indicates that the autonomic circuit has little
involvement and central mechanisms have taken over to
supply metabolic needs.
Fuel for Adaptation =
European Society of Cardiology and the North American Society of Electrophysiology:
These parameters reflect the time and frequency domain parameters most commonly reported in Western literature. It describes the
statistical “Variability” of the beat to beat intervals. The time domain parameters (SDNN, SDSD, & RMSSD) reflect the status of the
autonomic nervous system. In this example, these parameters are quite low, indicating less variability. This is also reflected in the
Tension Index and infers that higher levels of regulation are involved. The frequency parameters (Total Power, LF/HF, HF, HF n.u., LF,
and LF n.u.) reflect the status of the autonomic nervous system as well. In this example Total power is diminished indicating less
variance in the beat to beat and the significant input of the Low Frequency domain indicated sympathetic involvement and centralization.

22
Non-Optimal HRV 2 Sympathetic Dominant
Rhythmogram & Histogram:
These two figures complement each other
and clearly indicate the significance of
functional systems theory and biological
cybernetics. A straight arrow was placed
to illustrate the ridged heart rate rhythm
and lack of respiratory waves. As
mentioned previously, the lack of sinus
arrhythmia indicates that higher levels of
regulation have been activated due to a
prolonged homeostatic disturbance.
The Histogram illustrates the % of HR
counts occurring at certain time intervals
(ms). In this example roughly 90% of the
beat to beat intervals are identical in time.
Further supporting the ridged appearance
of the rhythmogram and the activation of
higher regulation levels.
Spectral Analysis:
The HF spectrum represents activity of the
parasympathetic nervous system while VLF (Hormonal)
and LF (Vasomotor) spectrum have origins in the
sympathetic nervous system. In this example there is
significant influence from the sympathetic nervous
system indicating high homeostatic disturbance.
Scattergram:
The X-axis of the scattergram plots the duration of one beat to
beat interval, while the Y-axis represents the time from the
preceding beat to beat interval. The tightness of the plot
indicates the time between successive beats are very similar as
supported by the histogram and rhythmogram. Higher levels
of regulation have been recruited and the sympathetic nervous
system activated due to prolonged homeostatic disturbance.

23
Russian Parameters: These parameters reflect the
theories of functional systems, biological cybernetics,
and neurohumoral regulation of functions.
Activity of Vagus and Symp. Reg. Mechanisms:
The physiological brake is pressed as the body is still
compensating for prior homeostatic loads. The
cardiovascular system will struggle to meet high
demands due to the limited functionality of the gas
pedal.
Tension Index & SD of Aspirate Waves:
The lack of tension in the cardiovascular system
indicates that higher levels of regulation are not
involved and the significant input of aspirate waves
reflect complete automatization of blood flow via the
autonomic circuit. Too much parasympathetic input is
noted, which is non-optimal when working at high
cardiovascular loads.
Fuel for Adaptation =
European Society of Cardiology and the North American Society of Electrophysiology:
As mentioned previously, these parameters reflect the “Variability’ in the heart rate rhythm and provide information regarding the status
of the ANS. In this example, the time domain parameters are significantly elevated when compared to those in sympathetic dominant
states, indicating significantly more variability in the beat to beat time intervals. The frequency analysis indicates significant
involvement of the low frequency spectrum, however the low frequency spectrum is believed to have both sympathetic and
parasympathetic input. Parasympathetic input originates in the vasomotor center which is the lowest level of central regulation. To
determine which branch of the ANS is active, refer to the rhythmogram in the HRV2 tab. The presence of aspirate waves indicates the
LF spectrum is modulated by parasympathetic input.

24
Non-Optimal HRV 2 Parasympathetic Dominant
Rhythmogram & Histogram:
In parasympathetic dominant states there
will be a significant amount of variability
in the beat to beat intervals. It is best
illustrated by the variance around the mean
beat to beat time interval represented by the
black arrow. The taller lines are reflective
of the dominant parasympathetic input and
take on a wave-like appearance.
The histogram further supports the
increased variability by the distribution of
times between beat to beat intervals. Due to
the increased parasympathetic input, the
cardiovascular system will struggle to
adapt to loads of high intensity or volume.
Just like a vehicle, adapting to external
loads is limited when you try to press the
gas with the brake still engaged.
Spectral Analysis:
This message is common when significant
parasympathetic dominant states are observed. As
indicated by the significant amount of variability present
in the rhythmogram and histogram.
Scattergram:
The pattern displayed in the scattergram is typical in
parasympathetic dominant states. Referred to as the “four
corner” pattern, it is indicative of the strong presence of
aspirate waves and is reflected in the HRV1 tab. This is just
one of several parasympathetic patterns. Training implications
will be consistent regardless of the parasympathetic pattern.

25
STATE OF CENTRAL NERVOUS SYSTEM: ADAPTATION HORSEPOWER
Optimal Direct Current Potential Curve
Omega Resting Potential:
The Omega resting potential
represents the activation level of
the cumulative activity of all
functional systems.
The following are the current
ranges of functionality for the
central regulatory system:
Fatigued: < 9.0 mV
Ideal: >9.0 mV<45.0 mV
Tension: >45.0 mV
Training within the ideal range
ensures the body’s ability to
achieve useful adaptive results.
Time to Stabilization:
The time to stabilization reflects the efficiency in which the central regulatory
system achieves adaptive results. Optimal time to stabilization should occur
within 1-3 minutes. Delayed states of stabilization or the lack of stabilization
indicates states of fatigue in the CNS.
Shape of DC Potential Curve:
The shape of the curve reflects the
stability of the CNS and its ability to
regulate adaptive results. Optimal
curves should begin at a level of
active wakefulness (LAW) and
descend in a smooth curve linear
path to a level of operative rest
(LOR).
Deviations in this pattern indicate
instability of the CNS and could
reflect tension, anxiety, or stress in
your athletes.

26
STATE OF ENERGY SUPPLY SYSTEM: ADAPTATION OCTANE
An examination of the two contrasting energy systems will demonstrate how the QRS complex is indicative of the energy supply system. The
Omegawave Team system incorporates the basic principles established by Dushanin and his colleagues, modifying the parameters based upon the
company’s years of research and extensive database in elite athletic populations. Consider the following parameters based upon the examples
above:
Metabolic Reaction Index: Reflects the overall effectiveness and coordination of the metabolic system to support planned training loads,
measured over extended periods of time. As athletes train, they develop specific adaptations within the cardiovascular and muscular system in
response to imposed training demands. Specific functional systems are cultivated to increase the efficiency with which the athlete generates the
energy required for their given sport. The rate and amplitude of the individual waves of the QRS represent the cumulative metabolic reaction. As
athletes train, these rates and amplitudes should increase—provided the training process is being properly managed.
Aerobic Status Index: Reflects the current state of the aerobic metabolic pathway and the ability to perform aerobic work in training. This
parameter relies heavily on the rate and amplitude of the R & S waves. The R-wave represents ventricular depolarization, while the S-wave
represents depolarization of the Purkinje fibers. Athletes with robust aerobic systems will have large R-wave rates and amplitudes due to the
increased ventricular filling and eccentric hypertrophy. The amplitude and rate are a direct response to the strength of the stretch during ventricular
filling. Likewise, the depolarization intensity of Purkinje fibers is decreased due to the accommodating stretch-reflex generated during ventricular
depolarization. Large S-waves are indicative of ventricular hypertrophy due to increased peripheral resistance, a situation often seen in strength
athletes.
Anaerobic Status Index: Reflects the current ability to perform muscle work using the glycolytic energy system while withstanding a high level
of lactate in the blood. Extensive anaerobic training leads to increased lactate and decreased pH in the blood for extended periods of time, which is
evidenced by alteration in the T-wave. Using the T-wave as an indicator of blood acidity allows for an assessment of the individual’s tolerance for
anaerobic exercises during which lactate levels will be elevated.
Efficient Energy Supply System Inefficient Energy Supply System

27
PRESCRIPTION: WHAT ARE THE LIMITING FACTORS?
The Athlete Readiness screen provides a snapshot of the individual’s physiological state: think of it as the
engine status as you start your car. Your vehicle will notify you if a major system is not functioning
properly, indicating this by displaying a warning message. A mechanic can then investigate further,
assessing the severity of the limiting factor and prescribing a solution to fix the problem. As a strength
and conditioning professional, you are the “mechanic” who must diagnose limiting factors and prescribe
exercise, recovery, nutrition, and other modalities to keep your athletes in a state of optimal function.
The Athlete Readiness Overall indicator is the “Check Engine” light. The color
scale will indicate if one or more regulatory systems are insufficient.
Further analysis will reveal which system is the limiting factor. It is important
to remember that the HRV analysis reveals limitations in the adaptation “fuel
tank,” while the CNS represents the status of the “engine” driving all functional
systems (including adaptation).

28
As a strength and conditioning professional, there are a limited number of factors under your direct
control, with these conforming to the classic FITT acronym:
F: Frequency – the frequency of the programmed training sessions is a balance between work and rest.
Mismanagement of the work-rest ratio can lead to states of non-functional overreaching or overtraining.
Using Omegawave allows the coach to determine if the athlete has recovered from prior training loads.
I: Intensity – refers to either the % of heart rate maximum or % of one-repetition maximum of weight
lifted. Training in higher heart rate zones will produce greater levels of fatigue, depleting a significant
amount of fuel for adaptation. Weight training at high intensities will elicit neural adaptations, but can
lead to CNS fatigue if mismanaged. Using Omegawave allows the coach to determine appropriate
training intensities based upon the fuel tank (HRV) and engine (CNS) status.
T: Type – the type of training determines which physiological adaptation one is seeking with the
prescribed training session. Using Omegawave and its Windows of Trainability, the coach will be able to
choose which training modality is appropriate for any given day.
T: Time – refers to the duration of the training session, but can be likened to the volume of a given
exercise. Using Omegawave will allow the coach to determine how much of a given training load the
athlete will be able to sufficiently handle.
Beyond these training factors, specific modalities can be prescribed to expedite the recovery process. The
following are suggestions for exercise prescription and recovery modalities when faced with
physiological limiting factors. The most common limitations are found via the HRV and CNS assessment,
with athletes presenting sympathetic or parasympathetic nervous system dominant states or reduced
capabilities of the CNS and its ability to coordinate functional system activity.
Recommendations will be made on the four basic training adaptations as represented by the Windows of
Trainability: Endurance, Speed & Power, Strength, and Coordination & Skill.

29
AUTONOMIC TONE: PARASYMPATHETIC DOMINANCE
Training Recommendations & Recovery Modalities
When the functional state of the cardiac system is the limiting factor, the fuel tank for adaptation will be limited. The volume of training is the
biggest consideration when dealing with reduced fuel or states of fatigue. Volume is equal to reps x sets x intensity (weight or HRmax%), so any
one of those three variables can be manipulated to accommodate athletes with insufficient recovery.
Endurance: As indicated by the Windows of Trainability, endurance is the only “window” that is fully open to receive the maximum training
effect. Training for aerobic development does not incur a significant physiological cost, provided total duration is kept within reason and the HR
intensity is held below 85% of HRmax. Even in slightly fatigued states, athletes can still train for endurance without jeopardizing recovery.
Speed & Power: Volume considerations for speed and power development should focus on reducing reps or sets. Provided the CNS is not a
cofounding limiting factor, intensity can still be maintained. Depending on where the athlete falls on the state of fatigue spectrum (Refer to HRV1
tab), reductions can range anywhere from 10-60% in total volume.
Strength: Similar to speed & power, strength is predominately neural. The volume of workloads, however, may produce fatigue beyond the
athlete’s Adaptation Reserves. Consider reducing volume in the accessory work, while maintaining your core working sets.
Coordination & Skill: Coordination & skill are adversely affected by states of fatigue and should be the focus of development in parasympathetic
states. Training in fatigued states will likely produce altered mechanics and create poor functional systems.
Recovery: Anything the affects recovery can be a possible intervention. Increasing sleep and nutritional intake are the first steps. If these fail to
produce a significant result, consider using contrast bath therapy, intensive massage, or active recovery modalities.

30
AUTONOMIC TONE: SYMPATHETIC DOMINANCE
Training Recommendations & Recovery Modalities
Sympathetic dominance indicates the body is in a state of moderate to severe fatigue and is currently in a state of homeostatic
disturbance Adding additional stressors would only increase the time and resources needed to recover.
Endurance: In this state, this is the only training modality that may provide a moderate training effect. The intensity of the training session must
be kept below 60% of maximum heart rate to provide recovery stimulation while keeping fatigue to a minimum.
Speed & Power: In controlled settings, such as the weight room, athletes may perform up to 1 working set of 85% 1RM to maintain neural drive.
All other resistance training modalities should be eliminated as the fuel gauge for adaptation is nearing empty.
Strength: The same applies for strength: work up to 1 set of 85% 1RM to maintain neural drive, but limit all accessory work. Again, use the
spectrum of sympathetic dominance to determine the reduction in volume. Typical volume reductions should be anywhere from 50-85%.
Coordination & Skill: Practicing coordination and skill in states of extreme fatigue is not advisable. Mechanics will be severely affected, which
can lead to the development of poor functional systems. Also, the risk of injury is significantly higher when training in fatigued states.
Recovery: Depending on the athlete and the situation, the recovery modality can differ. Acute sympathetic states can be caused by mental stress or
anxiety, and the recover modality will be specific to the individual and what that person views as relaxing. Meditation/mindfulness and slow
rhythmic exercise have shown a lot of promise for those who are chronically sympathetic.

31
CENTRAL NERVOUS SYSTEM: FUNCTIONAL STATE
Training Recommendations & Recovery Modalities
The functional state of the CNS represents the status of the athlete’s engine: the CNS drives all functional systems, ranging from skill acquisition
and execution, to adaptation. Is the athlete running on a 4-cylinder engine, like in the example above, or is the athlete cranking out 500 horsepower
from a V-12 sports car? This metric represents the speed and efficiency of the CNS’s ability to communicate across neurons and coordinate
functional system activity.
Endurance: Endurance training requires the coordination of many functional systems to supply the metabolic needs of the numerous organs and
tissues activated during training. When the CNS is reduced, the ability to coordinate optimally is compromised; consequently, the cost of training
is increased, regardless of the functional state of the cardiac system. Volume and intensity should be held to moderate levels.
Speed & Power: Speed and Power development should be held to moderate levels, with the volume of work being the primary consideration.
Activities should be limited to the weight room, where skill and coordination can be controlled. Accessory work can be incorporated with
moderate volume considerations.
Strength: The same applies for strength: athletes may work up to a working set of 85% 1 RM, but multiple working sets are not advisable.
Accessory work can be added in moderate amounts—stimulate, don’t annihilate.

32
Coordination & Skill: All skill and coordination activities should be kept to a minimum, due to the extensive involvement of the CNS in the
execution of such activities. Skill acquisition will be hindered and the development of non-optimal functional systems may ensue. The risk of
injury is significantly elevated when performing skills at high velocities and should not be performed while in reduced CNS states.
Recovery: Typically, the functional state of the CNS is affected by stimuli that is very strong and/or lasting in long duration. Long periods of
regulation, mental strain, or traumatic events will have significant impacts on the DC potential. Promising literature suggest grounding technique
such as barefoot walking can help re-establish CNS readiness. Other techniques include mindfulness, meditation, deprivation chambers, and yoga.
Remember to keep training modifications and reductions in training load on a spectrum of slightly reduced functional states to severe functional
states. In the example below, the functional state of the CNS is reduced compared to the previous example, however it is mild rather than severe.
The corresponding Windows of Trainability reflect this difference (still, limits remain based on this diminished functional state). The coach must
always evaluate the Readiness of the athlete and ask “What can my athlete adapt to today?”

33
STATE OF ENERGY SUPPLY SYSTEMS
Training Recommendations
When examining the state of the energy supply system, it is best to view changes on a longitudinal basis. The chart below is an example taken
from an American football team as the squad prepared for their upcoming season. The focus here is not to isolate the individual weeks, but to look
at the linear trends of adaptation. A large variety of factors will affect the QRS complex on any given day or week, so it is important to look at the
longitudinal result of the training adaptation. This data can be viewed within the Team software under “Athlete Analysis,” or the data can be
exported to a CSV file in Excel, where appropriate charts can be constructed.
0.00
50.00
100.00
150.00
200.00
250.00
300.00
350.00
110.00
115.00
120.00
125.00
130.00
135.00
140.00
145.00
150.00
MR
I
AE
RO
BIC
& A
NA
ER
OB
IC
ST
AT
US
Pre-Season Longitidunal Energy Supply State
Average of Metabolic reaction index Average of Aerobic status index2 Average of Anaerobic status index3
0.00
50.00
100.00
150.00
200.00
250.00
300.00
350.00
110.00
115.00
120.00
125.00
130.00
135.00
140.00
145.00
150.00
MR
I
AE
RO
BIC
& A
NA
ER
OB
IC
ST
AT
US
Pre-Season Longitudinal Energy Supply State
Average of Metabolic reaction index Average of Aerobic status index2 Average of Anaerobic status index3

34
Based upon the chart above, one can assume that positive adaptations were made throughout the pre-season preparatory period. However, as we
examine the in-season trends in the chart below, it is evident that the adaptations achieved in the off-season begin to taper off. Compared to
aerobic status, decrements in the anaerobic system were less pronounced, most likely due to the dominant anaerobic stimulus during practice.
By evaluating the long-term trends, strength and conditioning professionals can intervene with specific training stimuli to maintain energy supply
at a sufficient level. If the trends continue unchecked, the cost of the training sessions will increase while the athletes’ capacities for supplying
energy will decrease. Again, these parameters should not dictate daily training modalities in the same manner that HRV and DC potential analysis
do; instead, they should be viewed on a longitudinal basis to assure that positive training adaptations are maintained.
0.00
50.00
100.00
150.00
200.00
250.00
300.00
350.00
110.00
115.00
120.00
125.00
130.00
135.00
140.00
145.00
150.00
MR
I
AE
RO
BIC
& A
NA
ER
OB
IC
ST
AT
US
In-Season Longitudinal Energy Supply State
Average of Metabolic reaction index Average of Aerobic status index2 Average of Anaerobic status index3
Week 2 Week 3 Week 4 Week 5 Week 6 Week 7 Week 8 Week 9 Week 10 Week 11 Week 12Week 1

35
CONCLUSION
Due to the vast genetic variability between athletes, it is essential to monitor the individual response to
training using objective physiological feedback. Without this information, it is likely that training
modalities employed today are effective for 68% of our athletic population, while 16% are overtrained
and 16% undertrained as illustrated below.
Figure 14. Normal distribution of training effects
Using the Omegawave Team system allows strength professionals to identify athletes who fall outside the
68%, and will assist with the individualization of training. By selecting the appropriate Window of
Trainability, as well as individualizing the appropriate volume and intensity of training, coaches can guide
their athletes toward efficient training adaptations with minimal costs. This method has been proven to be
successful as evidenced by recent publications, where daily training modifications were made based upon
the functional state of the individual(11) (7). By keeping physiological costs low, athletes can allocate
more resources towards skill mastery—the ultimate adaptation.

36
REFERENCES
1. Heart rate variability: standards of measurement, physiological interpretation and clinical use.
Task Force of the European Society of Cardiology and the North American Society of Pacing and
Electrophysiology. Circulation. 1996;93(5):1043-65.
2. Anokhin P. Nodular mechanism of functional systems as a self-regulating apparatus. Progress in
brain research. 1968;22:230.
3. Baevskii R. Analysis of heart rate variability in space medicine. Human physiology.
2002;28(2):202-13.
4. Fomin RN, Nasedkin, V. V. Effective Management of Athlete Preparation: A Comprehensive
Approach to Monitoring of Athlete's Individual Readiness White Paper 2013:32.
5. Fomin RN, Nasedkin, V. V. . Windows of Trainability: The Professional Coach's Handbook -
Electronic Publication. 2014.
6. Guttmann A. The Cold War and the Olympics. International Journal. 1988:554-68.
7. Heikura I. Individual Adaptation to Endurance Training Guided by Heart Rate Variability. 2015.
8. Ilyukhina V. Continuity and prospects of research in systemic integrative psychophysiology of
functional states and cognitive activity. Human physiology. 2011;37(4):484-99.
9. Matveev LP, Zdornyj AP. Fundamentals of sports training. Progress; 1981.
10. Matveyev LP. Periodization of sports training. Moscow, Russia: Fiscultura I Sport. 1966.
11. Morris CW. The Effect of Fluid Periodization on Athletic Performance Outcomes in American
Football Players. 2015.
12. Riordan J. Soviet sport and Soviet foreign policy. Europe‐Asia Studies. 1974;26(3):322-43.
13. Stone MH, O'Bryant H, Garhammer J, McMillan J, Rozenek R. A Theoretical Model of Strength
Training. Strength & Conditioning Journal. 1982;4(4):36-9.
14. Sylvén C, Jansson E, Olin C. Human myocardial and skeletal muscle enzyme activities: creatine
kinase and its isozyme MB as related to citrate synthase and muscle fibre types. Clinical
Physiology. 1983;3(5):461-8.
15. Viru A. Early contributions of Russian stress and exercise physiologists. Journal of Applied
Physiology. 2002;92(4):1378-82.
16. Wallechinsky D. The complete book of the Olympics. Aurum; 2000.

37
ABOUT THE AUTHOR
C. W. Morris holds a PhD in Exercise Science and currently
serves as the Applied Sport Scientist for the University of Texas
Athletics Department. Specializing in the area of sport
physiology, Morris is a certified Strength and Conditioning
Specialist and a member of the National Strength and
Conditioning Association.
RIGHTS & DISCLAIMER
Sole authorship for this text is credited to C.W. Morris; the information included in this manual is the
sole property of Omegawave Oy and is provided for informational purposes only.
All rights reserved. No parts of this text may be reproduced, copied, or transferred, in any form or by any
means, without the express written consent of Omegawave Oy.
The educational content contained in this manual is subject to change without notice.