oligotrophy as a major driver of mercury bioaccumulation ... · a ifremer, unit eochimie des...
TRANSCRIPT

lable at ScienceDirect
Environmental Pollution 233 (2018) 844e854
Contents lists avai
Environmental Pollution
journal homepage: www.elsevier .com/locate/envpol
Oligotrophy as a major driver of mercury bioaccumulation inmedium-to high-trophic level consumers: A marineecosystem-comparative study*
Tiphaine Chouvelon a, *, Pierre Cresson b, c, Marc Bouchoucha b, Christophe Brach-Papa a, b,Paco Bustamante d, Sylvette Crochet a, Françoise Marco-Miralles b, Bastien Thomas a,Jo€el Knoery a
a IFREMER, Unit�e Biog�eochimie et �Ecotoxicologie, Laboratoire de Biog�eochimie des Contaminants M�etalliques, Rue de l’Ile d’Yeu, BP 21105, 44311 NantesCedex 03, Franceb IFREMER, Unit�e Littoral, Laboratoire Environnement Ressources Provence Azur Corse, Zone portuaire de Br�egaillon, CS 20330, 83507 La Seyne sur MerCedex, Francec IFREMER, Unit�e Halieutique de Manche-Mer du Nord, Laboratoire Ressources Halieutiques de Boulogne, 150 quai Gambetta, 62200 Boulogne sur Mer,Franced Littoral Environnement et Soci�et�es (LIENSs), UMR 7266 CNRS-Universit�e de La Rochelle, 2 rue Olympe de Gouges, 17042 La Rochelle Cedex 01, France
a r t i c l e i n f o
Article history:Received 2 August 2017Received in revised form2 October 2017Accepted 4 November 2017
Keywords:Biomagnifying metalBioaccumulationTrophic statusEcosystem productivityTemperate systems
* This paper has been recommended for acceptanc* Corresponding author.
E-mail address: [email protected] (T.
https://doi.org/10.1016/j.envpol.2017.11.0150269-7491/© 2017 Elsevier Ltd. All rights reserved.
a b s t r a c t
Mercury (Hg) is a global contaminant of environmental concern. Numerous factors influencing its bio-accumulation in marine organisms have already been described at both individual and species levels(e.g., size or age, habitat, trophic level). However, few studies have compared the trophic characteristicsof ecosystems to explain underlying mechanisms of differences in Hg bioaccumulation and bio-magnification among food webs and systems. The present study aimed at investigating the potentialprimary role of the trophic status of systems on Hg bioaccumulation and biomagnification in temperatemarine food webs, as shown by their medium-to high-trophic level consumers. It used data fromsamples collected at the shelf-edge (i.e. offshore organisms) in two contrasted ecosystems: the Bay ofBiscay in the North-East Atlantic Ocean and the Gulf of Lion in the North-West Mediterranean Sea. Sevenspecies including crustaceans, sharks and teleost fish, previously analysed for their total mercury (T-Hg)concentrations and their stable carbon and nitrogen isotope compositions, were considered for a meta-analysis. In addition, methylated mercury forms (or methyl-mercury, Me-Hg) were analysed. Mediter-ranean organisms presented systematically lower sizes than Atlantic ones, and lower d13C and d15Nvalues, the latter values especially highlighting the more oligotrophic character of Mediterranean waters.Mediterranean individuals also showed significantly higher T-Hg and Me-Hg concentrations. Conversely,Me-Hg/T-Hg ratios were higher than 85% for all species, and quite similar between systems. Finally, thebiomagnification power of Hg was different between systems when considering T-Hg, but not whenconsidering Me-Hg, and was not different between the Hg forms within a given system. Overall, thedifferent parameters showed the crucial role of the low primary productivity and its effects ripplingthrough the compared ecosystems in the higher Hg bioaccumulation seen in organisms from oligotro-phic Mediterranean waters.
© 2017 Elsevier Ltd. All rights reserved.
e by Dr. Yong Sik Ok.
Chouvelon).
1. Introduction
Mercury (Hg) is released into the environment from both nat-ural and anthropogenic sources (e.g., volcanism, fuel and wastecombustion). It reaches marine waters through atmospheric de-positions and riverine inputs, the former being the main source ofHg for the surface ocean (Fitzgerald et al., 2007). Also, Hg is volatile
T. Chouvelon et al. / Environmental Pollution 233 (2018) 844e854 845
and as such it can be transported through the atmosphere over longdistances and deposited in areas away from its point sources. In theocean, trophic transfer represents the main pathway for the intakeand bioaccumulation of Hg by marine organisms. Hg exhibits aspecific behaviour compared to other trace metals, as it bio-magnifies through food webs in its organic methyl-Hg (Me-Hg)forms (Chen et al., 2008). Finally, Hg is of particular environmentalconcern because of its toxicity on the nervous, reproductive,immunological and hormonal systems, sometimes leading toharmful effects at the population level (Boening, 2000; Tan et al.,2009; Goutte et al., 2014).
The methylation of Hg by microorganisms into Me-Hg is thefundamental process giving this contaminant its bioaccumulationand biomagnification properties. In the marine environment, Hgmethylation occurs both in coastal and shelf sediments, and in sub-thermocline low-oxygen oceanic waters, at depths where organicmatter is intensively remineralized (Mason et al., 1995; Fitzgeraldet al., 2007; Blum et al., 2013; Cossa et al., 2017). In its methyl-ated forms, Hg passes through biological membranes easily and isincorporated into cellular cytoplasm (e.g., in phytoplankton), fromwhich it is assimilated very efficiently by higher trophic levels (LeFaucheur et al., 2014). Once incorporated in organisms, Hgstrongly binds with protein sulfhydryl groups (eSH). Due this af-finity, the elimination or the excretion of the bioaccumulated Hg isvery slow over time, sometimes equal to zero, like in the muscletissues (Wang and Wong, 2003; Maulvault et al., 2016). As aconsequence, Hg has been widely documented to bioaccumulatewith size or age in marine organisms (e.g., Monteiro and Lopes,1990; Cossa et al., 2012; Chouvelon et al., 2014a).
Several factors linked to Hg marine biogeochemical cycling andits chemical properties are known to influence Hg bioaccumulationin marine fauna. The concentrations of dissolved Me-Hg in ambientwaters or in the different habitats of species is a first factor. As anexample, mesopelagic species were shown to present higher Hgconcentrations than epipelagic ones (Monteiro et al., 1996; Choyet al., 2009; Chouvelon et al., 2012), due to the probably higherexposition of mesopelagic organisms to Me-Hg in these deep-pelagic layers of organic matter remineralisation (e.g., Cossa et al.,2009; Heimbürger et al., 2010). Time of exposure to Hg is a sec-ond factor that directly influences its bioaccumulation. It is gener-ally inferred by the size or the age of the organisms considered, andusually higher Hg concentrations are measured in older organisms(due to low elimination rates; see above). The trophic status and/ortrophic functioning of ecosystems is a third factor that may be putforward to explain different bioaccumulation rates (e.g., Chen andFolt, 2005). This “trophic factor” itself includes several aspects,some being intimately linked to the first two described above. Thefirst aspect of this trophic factor directly concerns system produc-tivity, through the “bio-dilution effect” (Pickhardt et al., 2002). Thebio-dilution effect suggests lower Hg bioaccumulation at all trophiclevels in mesotrophic areas compared to oligotrophic areas(Harmelin-Vivien et al., 2009; Cresson et al., 2014a). It is due to thehigher number and higher surface area/volume ratio (i.e. size) ofcells at the base of mesotrophic systems. This configuration is lessfavourable to an efficient uptake of Hg by cells, whose the lower Hgburden (in comparison with cells in oligotrophic area) is thentransferred to consumers. Moreover in oligotrophic areas, wherecells are thus less abundant and potentially contain higher Hgburden, primary consumers probably consume virtually all of them.A second aspect of the trophic factor is directly related to theoccurrence of specific planktonic communities at the base of foodwebs. Indeed, in oligotrophic environments, the higher proportionsof slowly sinking pico- and nanophytoplanctonic cells that arereadily degraded by bacteria within thewater column promote Me-Hg formation in the heterotrophic active layers of organic matter
remineralisation (e.g., Cossa et al., 2009; Heimbürger et al., 2010).This aspect is thus intimately derived from the first factor con-cerning the level of bioavailable Hg in ambient waters. A thirdaspect of the trophic factor concerns the “trophic chain length”, alsocorresponding to the number of “nodes” between the consideredorganisms and the primary producers. The trophic chains aresometimes considered to be longer in less productive environ-ments (i.e. due to the higher recycling of organic matter and bac-terial activity; e.g., Biddanda et al., 2001). In the case ofbiomagnifying contaminants such as Hg, it may therefore lead tohigher Hg concentrations measured in apex predators of oligotro-phic systems. Finally, we may hypothesize that the trophic statusand associated primary productivity of marine systems influencethe growth rate of organisms as well (i.e. lower grow rates in lessproductive or oligotrophic environments may be expected), hencealso influencing the rate of Hg bioaccumulation (e.g., Simoneauet al., 2005; Trudel and Rasmussen, 2006; Ward et al., 2010).
Following these three fundamental factors (i.e. environmentalconcentrations of Me-Hg in ambient waters; age or growth rate ofthe organisms considered in the different systems; trophic status ofsystems), which can be related to each other, the bioaccumulationand the biomagnification of Hg were proved to vary sometimesgreatly between marine ecosystems (e.g., Harmelin-Vivien et al.,2009; Cossa et al., 2012), or even between environments of asame marine ecosystem (e.g., between epipelagic and mesopelagicenvironments; Choy et al., 2009; Chouvelon et al., 2012; Cressonet al., 2014a). For instance, the Mediterranean Sea was found tobe a peculiar marine ecosystem, characterized by several factorsfavourable to Hg contamination yielding to the so-called “Medi-terranean Hg anomaly”, whereby organisms' Hg concentrationsreported are often higher in this sea than in others while seawaterconcentrations are comparable (Cossa and Coquery, 2005;Harmelin-Vivien et al., 2009; Cossa et al., 2012). However, rela-tively few ecosystem-comparative or meta-analysis studies existfor assessing the relative influence of the different factors describedabove (e.g, Lavoie et al., 2013), and the probable primary role ofoligotrophy onHg bioaccumulation; especially considering offshorespecies (i.e. expected to bemore affected by oligotrophic conditionsthan neritic species in any system), and/or considering severalspecies at a time (and not only a single species). Moreover, lakeecosystems are more documented (e.g., Chen and Folt, 2005; Kiddet al., 2012; Lavoie et al., 2013) than the marine environment (butsee Harmelin-Vivien et al., 2009; Cossa et al., 2012). Finally, thereasons for among-systems differences in Hg bioaccumulation andbiomagnification have been recently described as being yet notwell understood, especially those relative to ecosystems’ charac-teristics (Kidd et al., 2012; Lavoie et al., 2013).
In this context, the general objective of this study was tocompare and evaluate the influence of the trophic status fo systemsand of biological processes (i.e. over geochemical ones; e.g., Cossaand Coquery, 2005) on Hg bioaccumulation and biomagnificationin offshore species and food webs from the Bay of Biscay (BoB) inthe north-eastern (NE) Atlantic, and from the Gulf of Lions (GoL) inthe north-western (NW) Mediterranean. The species includedbenthopelagic crustaceans and fish (both teleost and cartilaginous)that are characteristic of the shelf-edge in both ecosystems. Theywere selected to avoid potential bias linked to direct water-discharge inputs of Hg and/or coastal processes on Hg cycling andbioaccumulation. Besides, the BoB in the NE Atlantic and the GoL inthe NW Mediterranean represent good candidates for suchcomparative study, firstly due their expected difference in terms oftrophic status, even offshore (one being open onto the Ocean, theother being a semi-enclosed Sea). Indeed, the NE Atlantic shelves(such as the Bay of Biscay) and the Mediterranean Sea are consid-ered distinct biogeochemical provinces for a long time (e.g.,
T. Chouvelon et al. / Environmental Pollution 233 (2018) 844e854846
Longhurst, 1998, 2007; Reygondeau et al., 2013). Moreover, themore oligotrophic character of the Mediterranean systemcompared to the Atlantic one has been previously documented,especially from the composition of the organic matter (e.g., pres-ence of diazotrophic organisms) sustaining food webs (Kerherv�eet al., 2001; Li�enart et al., 2017). Nonetheless, a number of speciescan be found in both ecosystems, allowing direct comparisons.Finally, both areas are major areas for fisheries (for which Hg bio-accumulation in commercial species may be of concern), and theyconstitute two out the three French façades considered andmonitored by the European Marine Strategy Framework Directive.
To fulfil its general objective, this ecosystem-comparative studyused comparable and analytically coherent data on total Hg (T-Hg)concentrations and carbon (C) and nitrogen (N) stable isotope ra-tios (as markers of food sources, trophic positions, and ecosystems’properties in terms of trophic status) analysed on the selectedspecies, as described separately by Chouvelon et al. (2012) for theBoB and by Cresson et al. (2014b) for the GoL. In addition, for thepresent study, analyses of Me-Hg were performed on the samples,to investigate whether the percentage of Me-Hg measured in theselected species may differ between systems. Indeed, while Me-Hgrepresents the bioaccumulated form of Hg, it is rarely measuredand is often considered to be nearly equal to 100% of total Hg (T-Hg), although this can vary between taxa and species (Bustamanteet al., 2006; Kehrig et al., 2010; Cossa et al., 2012; Briant et al., 2017).Finally, the present additional analysis of Me-Hg allowedcomparing the biomagnification rates of T-Hg and Me-Hg withineach system, and between the two contrasted systems for each Hgform. Overall, we hypothesized that the trophic status and espe-cially the oligotrophic character of Mediterranean waters shouldstrongly influence the bioaccumulation and/or biomagnification ofHg observed in medium-to high-trophic level consumers, due tothe lower productivity and consequently the lower growth rate andlower “bio-dilution effect” most probably generated at all trophiclevels in oligotrophic systems.
2. Material and methods
2.1. Sampling and sample preparation
The offshore (shelf-edge) benthopelagic species considered inthis study included the lesser-spotted dogfish Scyliorhinus caniculaand the blackmouth catshark Galeus melastomus as cartilaginousfish; the blackbelly rosefish Helicolenus dactylopterus, the four-spotmegrim Lepidorhombus boscii, the greater forkbeard Phycis blen-noides and the blue whiting Micromesistius poutassou as teleostfish; and finally the Norway lobster Nephrops norvegica as crusta-cean (Table 1). Organisms were collected during bottom-trawlinggroundfish surveys conducted by the French Institute for theExploitation of the Sea (IFREMER), in 2008 for the BoB and in 2012for the GoL (Fig. 1; Chouvelon et al., 2012; Cresson et al., 2014b).
After collection (N¼ 134 fishes in total considered in the presentmeta-analysis and comparative study), each individual wasmeasured (total length for fish, cephalothorax length for crusta-ceans), at least to nearest centimetre for fish or millimetre forcrustaceans. A piece of white muscle (without skin nor carapace)was taken for both Hg analyses and C and N stable isotope analysis(SIA), performed individually. All muscle samples were finallyfrozen at �20 �C, freeze-dried and ground into a fine powder untilfurther chemical analyses (Chouvelon et al., 2012; Cresson et al.,2014b).
The determination of the age of organisms could not be per-formed due to non-uniform sampling of otoliths for age lecture,although in any case, this age determination would have been onlypotentially possible for teleost fish (that is, for four of the seven
species considered here), if the otolith sampling had been doneuniformly. Thus, in the present study, only the individual sizes wereused as an indicator of the time of exposure to contaminant (i.e. as aproxy of organisms’ age within a species), and/or related to po-tential differences in the growth rate of all organisms betweensystems.
2.2. Stable isotope analyses
Muscle sub-samples for SIA (N ¼ 134) were prepared asdescribed by Chouvelon et al. (2012) and Cresson et al. (2014b).0.40± 0.05mg of powderwere finallyweighed in tin cups. Analyseswere performed with a Thermo Scientific Delta V Advantage massspectrometer coupled to a Thermo Scientific Flash EA1112elemental analyser. The results are presented in the usual d nota-tion relative to the deviation from international standards (Pee DeeBelemnite for d13C values, and atmospheric nitrogen for d15Nvalues), in parts per thousand (‰). Based on replicate measure-ments of internal laboratory standards (acetanilide), the experi-mental precision was <0.2‰ for both d13C and d15N. Moreover, aprevious study using the same instruments as in the present studyindicated no statistically significant difference for both d13C andd15N on duplicate measurements of a same sample (Chouvelonet al., 2014b), indicating highly reliable and precise values for theunique analysis of well-homogenized material such as the musclesamples used here.
2.3. Total and methyl-Hg analyses
As in the case of SIA, muscle sub-samples for T-Hg determina-tion (N ¼ 134) were prepared and analysed as described byChouvelon et al. (2012) and Cresson et al. (2014b). T-Hg analyseswere carried out on aliquots of powder (10e50 mg) with AdvancedMercury Analysers (ALTEC AMA-254, Altec Ltd). Through this mean,the determination of Hg is done in three steps: (1) combustion ofthe dedicated sub-sample (dried powder) and volatilization of Hg;(2) amalgamation of elemental Hg on a gold trap; and (3) spec-trophotometric atomic absorption measurement of the Hg sweptinto the flow cell following heating (800 �C) of the gold trap. All T-Hg analyses were run according to thorough quality control pro-grammes including the analysis of certified reference materials(CRMs): TORT-2 (lobster hepatopancreas, National ResearchCouncil Canada/NRCC), IAEA-142 (mussel homogenate, Interna-tional Atomic Energy Agency/IAEA), DORM-2 and/or DORM-4 (fishprotein, NRCC). CRM results were in good agreement with thecertified values in all cases, with recovery rates varying between95% and 102% (Chouvelon et al., 2012; Cresson et al., 2014b). Thelimit of quantification was �0.02 mg g�1 dry mass (dm).
Me-Hg determination was performed on a subsample of in-dividuals (n ¼ 75) according to the method described by Azemardand Vassileva (2015), which uses liquid-liquid extractions of Me-Hgin samples before analysis by automated Hg analysers such as AMA-254. Briefly, aliquots of powder (20e800 mg, depending on T-Hgconcentrations) were acidified with 5 mL of HCl (25%, v/v, preparedwith HCL 30% Suprapur) to solubilize Hg. A volume of toluene(10 mL) was added and both phases were homogenized. Aftercentrifugation, a fraction (5 mL) of the upper organic phase (i.e.toluene containing extracted Me-Hg) was transferred to a secondtube containing the same volume of a 0.002 M sodium thiosulfatesolution. This second tube was vigorously shaken and centrifuged.Finally, an aliquot of a known volume (100 or 200 mL) of the lowerphase, containing the back-extracted Me-Hg, was directly analysedwith AMA 254. As for T-Hg determination, Me-Hg analyses wererun according to a thorough quality control programme includingthe analysis of the CRM IAEA-436 (tuna fish flesh homogenate). The

Table 1Characteristics of fish and crustaceans considered in the NWMediterranean (Gulf of Lione GoL) and in the NE Atlantic (Bay of Biscaye BoB): sizes (in cm), stable isotope ratios(d13C and d15N values in‰) and muscle total Hg (T-Hg) concentrations (in mg g�1 dm) for the individuals analysed for the three parameters (N ¼ 134); sizes (in cm), methyl-Hg(Me-Hg) concentrations (in mg g�1 dm) andMeHg/T-Hg ratio (in %) for the subsample of individuals analysed for Me-Hg concentrations (n¼ 75). Thewater content (WC) of themuscle tissue (in %), either derived from dedicated individual measures (for five of the seven Atlantic species) or from the general literature (US EPA, 2011; in brackets) is alsoindicated, for further conversion of Hg concentrations in wet mass if needed (i.e. for comparison with seafood Hg standards). (nd) ¼ not determined.
Ecosystem N Size a
Mean ± SD(min, max)
d13CMean ± SD(min, max)
d15NMean ± SD(min, max)
T-HgMean ± SD(min, max)
WC, measuredMean ± SD(min, max)
WC,US EPA 2011Mean(“Raw” tissue) b
n Size a
(subsampling)Mean ± SD(min, max)
Me-HgMean ± SD(min, max)
Me-Hg/T-HgratioMean ± SD(min, max)
NW Mediterranean (GoL) 72 37Cartilaginous fishScyliorhinus canicula (Sc) 9 48 ± 5
(41, 57)�18.0 ± 0.2(e18.4, �17.8)
8.9 ± 0.2(8.7, 9.3)
10.85 ± 7.62(4.63, 27.01)
(nd) (73.6) 6 50 ± 5(41, 57)
11.61 ± 8.45(4.95, 27.07)
99 ± 5(93, 107)
Galeus melastomus (Gm) 15 46 ± 6(33, 56)
�18.0 ± 0.3(e18.4, �17.2)
8.9 ± 0.6(7.8, 10.2)
7.81 ± 4.02(3.37, 16.72)
(nd) (73.6) 6 48 ± 3(43, 51)
8.59 ± 3.94(3.44, 13.25)
101 ± 7(91, 112)
Teleost fishHelicolenus dactylopterus (Hd) 13 26 ± 3
(20, 31)�18.3 ± 0.5(e19.0, �17.5)
9.2 ± 0.8(7.9, 10.2)
7.83 ± 2.97(4.24, 12.92)
(nd) (79.3) 6 27 ± 3(22, 31)
7.20 ± 3.26(3.49, 11.46)
93 ± 7(82, 103)
Lepidorhombus boscii (Lb) 5 26 ± 5(20, 33)
�18.6 ± 0.2(e18.9, �18.4)
8.2 ± 0.3(7.9, 8.6)
4.96 ± 2.66(2.33, 9.30)
(nd) (79.1) 4 28 ± 4(24, 33)
5.13 ± 3.36(1.89, 9.59)
94 ± 12(81, 105)
Phycis blennoides (Pb) 15 27 ± 5(20, 38)
�18.8 ± 0.5(e19.8, �17.9)
9.4 ± 0.7(7.1, 10.1)
2.63 ± 1.03(1.14, 4.21)
(nd) (81.2) 6 29 ± 4(23, 34)
2.77 ± 0.57(2.25, 3.84)
93 ± 2(90, 96)
Micromesistius poutassou (Mp) 12 26 ± 3(22, 31)
�19.0 ± 0.6(e20.5, �18.3)
8.6 ± 0.4(8.0, 9.4)
1.53 ± 0.45(0.90, 2.41)
(nd) (80.3) 6 26 ± 3(23, 31)
1.36 ± 0.56(0.74, 2.27)
86 ± 5(81, 94)
CrustaceansNephrops norvegicus (Nn) 3 4.7 ± 0.4
(4.3, 5.0)�18.8 ± 0.4(e19.1, �18.3)
7.0 ± 0.3(6.7, 7.2)
3.11 ± 0.50(2.69, 3.66)
(nd) (76.8) 3 4.7 ± 0.4(4.3, 5.0)
2.86 ± 0.51(2.38, 3.40)
92 ± 3(89, 94)
NE Atlantic (BoB) 62 38Cartilaginous fishScyliorhinus canicula (Sc) 10 58 ± 3
(53, 63)�16.7 ± 0.2(e16.9, �16.3)
13.1 ± 0.3(12.6, 13.5)
2.12 ± 1.19(0.93, 4.63)
77.0 ± 0.6(76.0, 78.2)
(73.6) 6 57 ± 2(54, 60)
1.98 ± 0.74(1.18, 3.03)
94 ± 4(88, 98)
Galeus melastomus (Gm) 12 61 ± 7(50, 72)
�17.2 ± 0.2(e17.7, �16.8)
12.1 ± 0.6(11.2, 13.2)
2.19 ± 1.38(1.04, 5.12)
78.3 ± 0.4(77.7, 78.9)
(73.6) 6 63 ± 8(52, 72)
2.51 ± 1.56(0.95, 4.53)
94 ± 6(89, 105)
Teleost fishHelicolenus dactylopterus (Hd) 5 37 ± 2
(34, 40)�17.3 ± 0.1(e17.5, �17.2)
13.2 ± 0.3(12.7, 13.6)
4.77 ± 0.84(3.89, 6.13)
79.6 ± 0.6(78.7, 80.2)
(79.3) 5 37 ± 2(34, 40)
4.87 ± 0.81(4.09, 6.19)
102 ± 4(99, 107)
Lepidorhombus boscii (Lb) 5 30 ± 3(26, 34)
�16.8 ± 0.1(e17.0, �16.6)
11.5 ± 0.3(11.2, 11.9)
2.32 ± 1.80(0.82, 4.29)
(nd) (79.1) 5 30 ± 3(26, 34)
1.94 ± 1.40(0.79, 3.56)
88 ± 7(79, 97)
Phycis blennoides (Pb) 5 51 ± 7(44, 58)
�17.0 ± 0.3(e17.4, �16.7)
13.5 ± 0.1(13.3, 13.6)
0.96 ± 0.72(0.36, 1.80)
(nd) (81.2) 5 51 ± 7(44, 58)
0.97 ± 0.75(0.35, 1.83)
99 ± 4(93, 104)
Micromesistius poutassou (Mp) 20 25 ± 5(20, 33)
�18.1 ± 0.4(e19.1, �17.1)
11.5 ± 0.6(10.1, 13.0)
0.25 ± 0.22(0.08, 0.77)
78.4 ± 0.9(76.7, 79.8)
(80.3) 6 26 ± 5(21, 32)
0.30 ± 0.28(0.07, 0.66)
95 ± 6(84, 103)
CrustaceansNephrops norvegicus (Nn) 5 6.4 ± 0.7
(5.7, 7.4)�15.9 ± 0.2(e16.2, �15.6)
11.3 ± 0.2(11.1, 11.5)
0.62 ± 0.07(0.55, 0.69)
78.3 ± 1.3(76.9, 80.0)
(76.8) 5 6.4 ± 0.7(5.7, 7.4)
0.59 ± 0.06(0.51, 0.64)
94 ± 2(92, 96)
a Total length for fish, cephalothorax length for crustaceans.b Selected correspondence (closest) species in US EPA (2011): S. canicula and G. melastomus ¼ “Sharks, mixed species”; H. dactylopterus ¼ “Rockfish”; L. boscii ¼ “Flatfish,
Flounder, and Sole”; P. blennoides ¼ “Cod, Atlantic”; M. poutassou ¼ “Whiting, mixed species”; N. norvegicus ¼ “Lobster, northern”.
T. Chouvelon et al. / Environmental Pollution 233 (2018) 844e854 847
average recovery rates for the CRM varied from 81 to 90% betweenthe series of analyses (i.e. between the days of analyses), against92% on average expected by Azemard and Vassileva (2015) for thisCRM. However, within a same series or day of analyses, the varia-tion in the recovery rates of CRMs (2e3 CRMs analysed at eachseries/day of Me-Hg analyses) was very low (i.e. average standarddeviation of 2%). Therefore, the repeatability of the CRM results wasensured within a same series, and Me-Hg results for the samplescould be corrected from the average recovery rate of the CRMsanalysed during the same series/day of analyses. Finally, severalsamples were analysed twice (in two different series/day of ana-lyses). The mean difference observed between the two measure-ments, for the calculated percentage of Me-Hg relative to T-Hg (i.e.ratio of Me-Hg concentration/T-Hg concentration, in %), was of4 ± 2%.
2.4. Data treatment
All data submitted to statistical tests (and/or model residuals)were checked for normality, and for homogeneity of variances andlack of violation of independence when appropriate (Zuur et al.,
2007).For each species considered, differences between systems in
individual sizes, d13C and d15N values, T-Hg concentrations andpercentages of Me-Hg were thus tested by the parametric Studentt-test or the non-parametric Mann-Whitney-Wilcoxon test,depending on whether the data satisfied the conditions for para-metric statistics or not.
The correlation between T-Hg and Me-Hg concentrations (forthe subsample of individuals analysed for both parameters) wastested through the non-parametric Spearman correlation coeffi-cient test.
The relationship between T-Hg or Me-Hg concentrations andd15N values (i.e. as proxy of the individual trophic positions within agiven ecosystem) was investigated through Generalized LinearModels (GLMs). Indeed, data showed a marked departure fromnormality, preventing the application of classical multiple linearregressions. However, thorough data exploration suggested thelinearity of trends to be modelled, making the application ofGeneralized Additive Models e than can capture and model com-plex non-linear relationships e unnecessary. GLMs were thus fittedto log-transformed Hg concentrations with an identity link

Fig. 1. Maps of the sampling areas and of trawling stations in the NW Mediterranean (MED e Gulf of Lion) and in the NE Atlantic (ATL e Bay of Biscay).
T. Chouvelon et al. / Environmental Pollution 233 (2018) 844e854848
function, as it is generally the case when dealing with contaminantdata such as trace metals (e.g., Pierce et al., 2008; M�endez-Fernandez et al., 2013; Chouvelon et al., 2014a, 2017). Thisallowed estimating the effect of d15N values in explaining Hg con-centration variability. Moreover, such relationships allowed thebiomagnification power (BP) of T-Hg and Me-Hg to be determinedand to be compared between ecosystems (Chen et al., 2008; Borgået al., 2012; Lavoie et al., 2013). d15N values were treated as thesingle continuous explanatory variable in the models, while thefactor “Ecosystem” was treated as a categorical explanatory vari-able and added as a potential interaction term. The general form ofthe original models performed was:
Log10 [T-Hg] or Log10 [Me-Hg] ~ d15N þ Ecosystem [þ interactionterm d15N:Ecosystem].
Results (fitted values) of the models were plotted on observed(log-transformed) data. Final models’ parameters (estimates, p-values, etc.) and details on their interpretation are given in Table 2.For each model, we retained the variables that improved the rela-tive goodness of fit in the GLMs (i.e. most parsimonious models)based on the Akaike Information Criterion (AIC). When the AIC wasnot significantly different between the last two nested models, thesimplest model was preferred. Finally, a model validation wassystematically applied (Zuur et al., 2007), and the percentage of
total deviance explained (DE) was calculated as follows: Explaineddeviance ¼ ((Null model deviance - final model residual deviance)/Null model deviance)*100, with the null model that only containedthe intercept terms (M�endez-Fernandez et al., 2013; Chouvelonet al., 2017).
The same type of models (GLMs) was finally applied to testpotential significant difference in the slope of the relationships (i.e.in the BP) between T-Hg and Me-Hg (i.e. between the differentforms of Hg) within each system. d15N values were treated as thesingle continuous explanatory variable in the models, while thefactor “Hg form” was treated as a categorical explanatory variableand added as a potential interaction term. The general form of theoriginal models performed was:
Log10 [Hg] in the BoB or in the GoL ~ d15N þ Hg form [þ interactionterm d15N:Hg form].
The level of significance for statistical analyses was always set ata ¼ 0.05.
3. Results
In both systems, species-dependent patterns in Hg concentra-tions (either T-Hg or Me-Hg) were similar, with the two sharkspecies S. canicula and G. melastomus and the teleost fish

Table 2Results of the final GLM models explaining (log-transformed) T-Hg or Me-Hg concentrations’ variability in the muscle of the seven selected species. Akaike InformationCriterion (AIC) values and the total deviance explained (DE) by each model are indicated (see section 2.4). Estimates and significance (p-values) for each term included arealso given. *p < 0.05; **p < 0.01; ***p < 0.001.
Variables(equation terms) a
Estimates p-value
T-Hg (N ¼ 134) Log10 [T-Hg] ¼ d15N þ Ecosystem þ d15N:EcosystemAIC ¼ 138.8Total DE ¼ 53.8%Intercept (a) �4.4378 <0.001***d15N (b1) 0.3573 <0.001***MED-GoL (relative to ATL-BoB) 4.0925 <0.001***d15N:MED-GoL (relative to d15N:ATL-BoB) �0.2484 0.0034**
Me-Hg (n ¼ 75) Log10 [Me-Hg] ¼ d15N þ EcosystemAIC ¼ 78.0Total DE ¼ 44.7%Intercept (a) �2.5701 <0.001***d15N (b1) 0.2136 <0.001***MED-GoL (relative to ATL-BoB) 0.9858 <0.001***
a When the interaction term is not significant (i.e. model assuming that the form of the relationship between ecosystems is the same, for Me-Hg), the underlying model'sspecifications are:Log10 [Me-Hg]i ¼ a þ b1 *d15Ni þ Ecosystemi þ εi (1)When the interaction is significant (i.e. for T-Hg, form of the relationship different between ecosystems), the model's specifications are:Log10 [T-Hg]i ¼ a þ b1 *d15Ni þ Ecosystemi þ d15Ni:Ecosystemi *d15Ni þ εi (2)In equations (Eqs. (1) and (2)), the terms correspond to:- Log10 [T-Hg or Me-Hg]i ¼ the log-transformed concentration in T-Hg or Me-Hg for sample i;- a ¼ intercept for the relationship;- b1 ¼ the estimate for the continuous explanatory variable d15N;- d15Ni ¼ the d15N value for sample i;- Ecosystemi ¼ correction to apply for the ecosystem(s) of concern if necessary, here for MED-GoL (see below);- ε ¼ residuals (i.e. information not explained by the model).When the interaction is not significant in the model (i.e. for Me-Hg), predicted values (fitted model) derived from model outputs can thus be deduced as follow:- Log10 [Me-Hg]i for ATL-BoB (i.e. first modality of the factor Ecosystem) ¼ a þ b1 *d15Ni
- Log10 [Me-Hg]i for MED-GoL (i.e. second modality of the factor Ecosystem) ¼ a þ b1 *d15Ni þ estimate for MED-GoLWhen the interaction is significant, it is in the form (i.e. for T-Hg):- Log10 [T-Hg]i for ATL-BoB ¼ a þ b1 *d15Ni
- Log10 [T-Hg]i for MED-GoL ¼ a þ b1 *d15Ni þ estimate for MED-GoL þ estimate for the interaction term d15N:MED-GoL *d15Ni
In fact, in the model outputs of predicted values, the estimates for the first modality of the factor Ecosystem (i.e. ATL-BoB) are equal to 0 because the model uses this firstmodality as baseline (Zuur et al., 2007). Estimates for the modality MED-GoL thus correspond to the correction applying to this modality, relative to the modality ATL-BoB.
T. Chouvelon et al. / Environmental Pollution 233 (2018) 844e854 849
H. dactylopterus presenting the highest Hg concentrations, the twoteleost fish P. blennoides and L. boscii presenting intermediateconcentrations, and the teleost fish M. poutassou and the crusta-cean N. norvegica presenting the lowest Hg concentrations(Table 1).
Mediterranean individuals had significantly lower sizes thanthose from the NE Atlantic (BoB) for five out of the seven speciesconsidered (Table 1, Fig. 2a), along with significantly higher T-Hgconcentrations for all species except L. boscii (Table 1, Fig. 2b).However, although non significant for L. boscii, higher averagevalues were found in Mediterranean individuals of this species aswell (Table 1). Concomitantly, for all species considered, signifi-cantly lower d13C and d15N values weremeasured in Mediterraneanorganisms relative to Atlantic ones (Table 1, Fig. 2c).
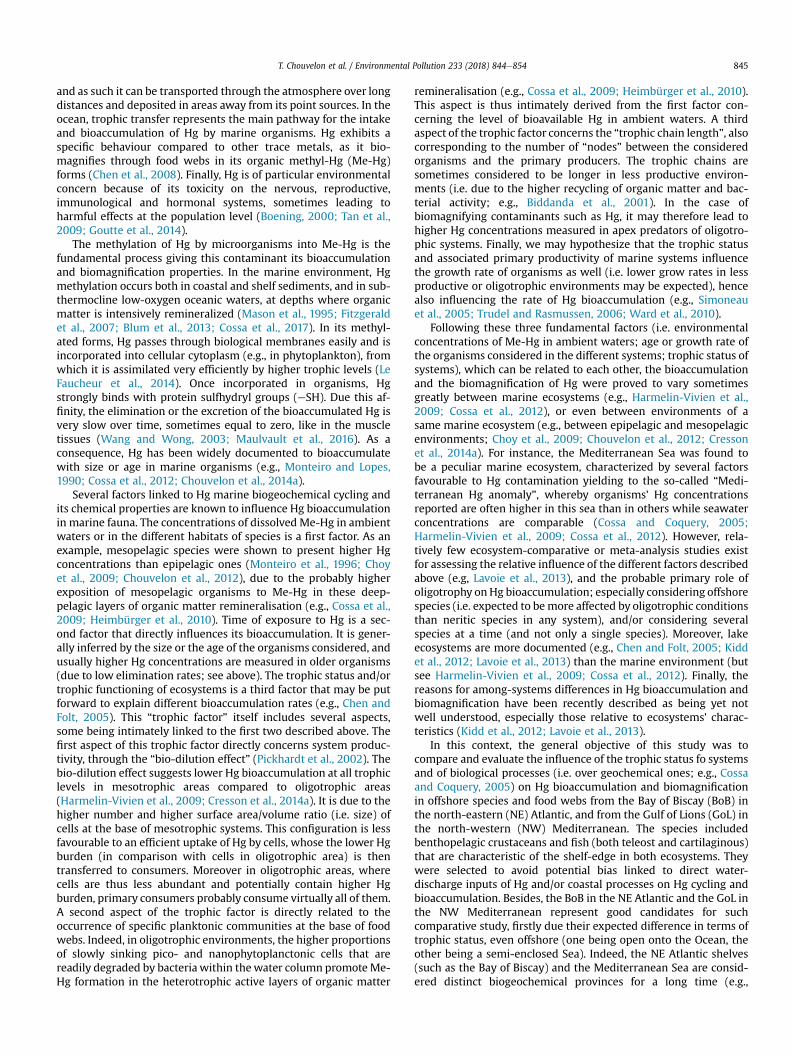
Me-Hg concentrations were strongly correlated with T-Hgconcentrations (Fig. 3), and the average percentage of Me-Hg(relative to T-Hg) was over 85% for all the considered species andin both systems (Table 1, Fig. 2d). This percentage of Me-Hg wassignificantly higher in Atlantic individuals relative to Mediterra-nean ones for only three out of the seven species considered (i.e. forH. dactylopterus, P. blennoides and M. poutassou), although slightly,and the difference was not significant for the four other species(Fig. 2d). Moreover, the standard deviations around average Me-Hg/T-Hg ratios were quite high (Table 1), and the recovery ofvalues between individuals from the different systems was quiteimportant (Fig. 2d).
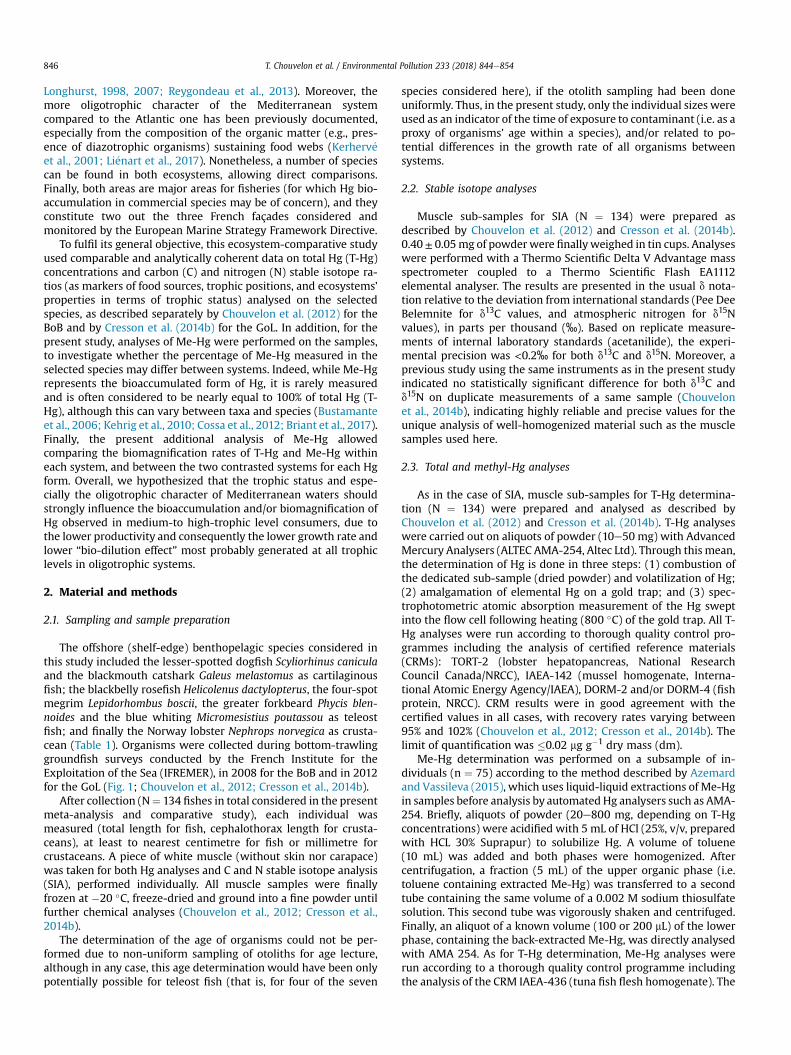
The effect of d15N values for explaining T-Hg or Me-Hg con-centrations’ variability was significant in all cases (i.e. significantrelationships between parameters), as well as the factor
“Ecosystem” (i.e. significant difference between Atlantic and Med-iterranean). The intercept was systematically higher for Mediter-ranean organisms than for Atlantic ones in all relationships(Table 2, Fig. 4). For Me-Hg, contrary to T-Hg, the interaction termwas not significant. As such, the model predicted similar slope/similar BP for Me-Hg in both ecosystems, at least at the scale of thespecies and food webs considered in the present study. Finally,when considering each system separately, the difference of slope/ofBP between T-Hg andMe-Hgwas not significant (i.e. no effect of thefactor “Hg form” on the relationships with d15N values within eachsystem), probably due to the high correlation between T-Hg andMe-Hg concentrations (Fig. 3).
4. Discussion
4.1. General trends and differences between systems
Results clearly showed a significantly higher Hg bio-accumulation by Mediterranean organisms, along with signifi-cantly lower C and N stable isotope ratios measured for all species,and lower individual sizes for most of them. Conversely, the per-centage of MeHg was similar between both systems for most of thespecies examined, although significantly slightly higher in Atlanticorganisms than in Mediterranean ones for some species. Whenconsidering Me-Hg, the BP was not significantly different betweensystems, but was significantly higher in the Atlantic food web thanin the Mediterranean one when considering T-Hg. Besides, withineach system, T-Hg and Me-Hg BPs appeared to not differsignificantly.

Fig. 2. a) Boxplots of sizes (total length for fish, cephalothorax length for crustaceans) for the seven species analysed in the NW Mediterranean e Gulf of Lion (MED e GoL) and inthe NE Atlantic e Bay of Biscay (ATL e BoB) (N ¼ 134); b) Boxplots of muscle total Hg (T-Hg) concentrations (N ¼ 134); c) Biplot of d13C and d15N values (N ¼ 134); d) Boxplots ofpercentages of Me-Hg (i.e. ratios Me-Hg/T-Hg, in %) in the muscle of the subsample of individuals analysed for Me-Hg concentrations (n ¼ 75).For boxplots (a, b, d), the box length represents the interquartile, the bar length represents the range, and the horizontal lines in bold are median values. For each species, thesignificant difference between systems is indicated (tested by Student t-test or Mann-Whitney-Wilcoxon test, depending on data satisfying conditions for parametric statistics ornot). *p < 0.05; **p < 0.01; ***p < 0.001; NS ¼ non significant. For the biplot (c), values are mean ± standard deviation per species. Abbreviations for species are specified in Table 1.
T. Chouvelon et al. / Environmental Pollution 233 (2018) 844e854850
Firstly, in terms of T-Hg concentrations, the species-dependentpattern observed was similar between systems. Moreover, it wasconsistent with the general diet and ecology documented for theconsidered species (www.sealifebase.org and associated refer-ences) and with the well-documented biomagnifying property ofHg in food webs (Boening, 2000). Indeed, the two shark speciesS. canicula and G. melastomus and the teleost fish H. dactylopterus(i.e. species presenting the highest Hg concentrations) are consid-ered high-trophic level consumersmainly feeding on awide varietyof prey, including both benthic and pelagic fish, cephalopods andcrustaceans. Compared with the others, these three species are alsomorphologically able to capture relatively large prey (i.e. ofpotentially high trophic level as well). Alternatively, P. blennoides isdocumented to feed mostly on crustacean and fish prey, andL. boscii on small bottom-living crustaceans, fish and squids. Thediet of the individuals of M. poutassou corresponding to the sizessampled here is mainly composed of small crustaceans such aszooplankton. Finally, the crustacean N. norvegica is consideredmainly scavenger, feeding on detritus, benthic crustaceans andworms (www.sealifebase.org and associated references).
Secondly, the different parameters considered in thisecosystem-comparative study (i.e. sizes of the organismscompared, d13C and d15N values, T-Hg and Me-Hg concentrations)showed the crucial role of the trophic status at the base of systemse especially oligotrophy e in the trophic transfer and in the bio-accumulation of Hg by high-trophic level consumers. Similarly toour study, higher concentrations in Mediterranean organisms thanin their counterparts in the Atlantic were recently described for theneritic food web of the European hake Merluccicus merluccius be-tween the GoL and the BoB (Cossa et al., 2012), being coherent withthe “Mediterranean Hg anomaly” (i.e. higher Hg bioaccumulationobserved in organisms from this system relative to other systems,despite comparable concentrations in seawaters from both areas;Aston and Fowler, 1985; Cossa and Coquery, 2005). However, to thebest of our knowledge, such comparison of systems as done in thepresent study was relatively rarely performed, especially on severalmedium-to high-trophic level species at a time, and on offshorespecies, which are potentially submitted to oligotrophic conditionse at least in part e in both systems (compared to neritic species).
The C and N stable isotope compositions (especially d15N values)
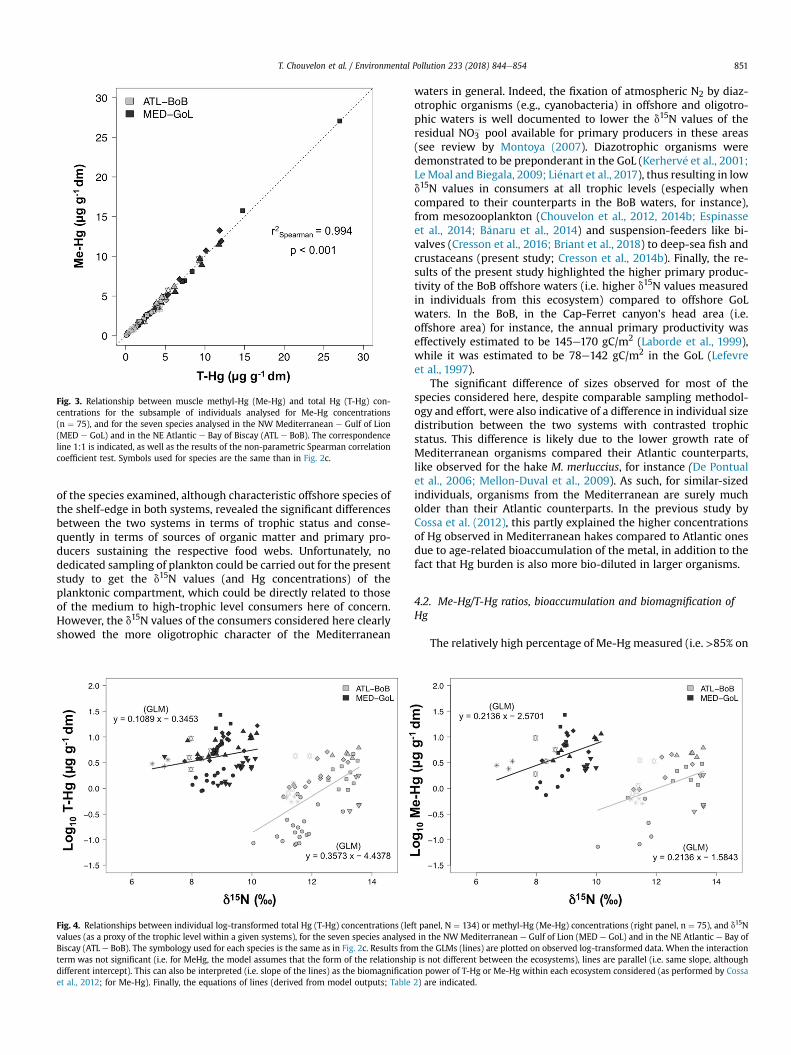
Fig. 3. Relationship between muscle methyl-Hg (Me-Hg) and total Hg (T-Hg) con-centrations for the subsample of individuals analysed for Me-Hg concentrations(n ¼ 75), and for the seven species analysed in the NW Mediterranean e Gulf of Lion(MED e GoL) and in the NE Atlantic e Bay of Biscay (ATL e BoB). The correspondenceline 1:1 is indicated, as well as the results of the non-parametric Spearman correlationcoefficient test. Symbols used for species are the same than in Fig. 2c.
T. Chouvelon et al. / Environmental Pollution 233 (2018) 844e854 851
of the species examined, although characteristic offshore species ofthe shelf-edge in both systems, revealed the significant differencesbetween the two systems in terms of trophic status and conse-quently in terms of sources of organic matter and primary pro-ducers sustaining the respective food webs. Unfortunately, nodedicated sampling of plankton could be carried out for the presentstudy to get the d15N values (and Hg concentrations) of theplanktonic compartment, which could be directly related to thoseof the medium to high-trophic level consumers here of concern.However, the d15N values of the consumers considered here clearlyshowed the more oligotrophic character of the Mediterranean
Fig. 4. Relationships between individual log-transformed total Hg (T-Hg) concentrations (lefvalues (as a proxy of the trophic level within a given systems), for the seven species analysedBiscay (ATL e BoB). The symbology used for each species is the same as in Fig. 2c. Results fromterm was not significant (i.e. for MeHg, the model assumes that the form of the relationshidifferent intercept). This can also be interpreted (i.e. slope of the lines) as the biomagnificatiet al., 2012; for Me-Hg). Finally, the equations of lines (derived from model outputs; Table
waters in general. Indeed, the fixation of atmospheric N2 by diaz-otrophic organisms (e.g., cyanobacteria) in offshore and oligotro-phic waters is well documented to lower the d15N values of theresidual NO3
� pool available for primary producers in these areas(see review by Montoya (2007). Diazotrophic organisms weredemonstrated to be preponderant in the GoL (Kerherv�e et al., 2001;LeMoal and Biegala, 2009; Li�enart et al., 2017), thus resulting in lowd15N values in consumers at all trophic levels (especially whencompared to their counterparts in the BoB waters, for instance),from mesozooplankton (Chouvelon et al., 2012, 2014b; Espinasseet al., 2014; B�anaru et al., 2014) and suspension-feeders like bi-valves (Cresson et al., 2016; Briant et al., 2018) to deep-sea fish andcrustaceans (present study; Cresson et al., 2014b). Finally, the re-sults of the present study highlighted the higher primary produc-tivity of the BoB offshore waters (i.e. higher d15N values measuredin individuals from this ecosystem) compared to offshore GoLwaters. In the BoB, in the Cap-Ferret canyon's head area (i.e.offshore area) for instance, the annual primary productivity waseffectively estimated to be 145e170 gC/m2 (Laborde et al., 1999),while it was estimated to be 78e142 gC/m2 in the GoL (Lefevreet al., 1997).
The significant difference of sizes observed for most of thespecies considered here, despite comparable sampling methodol-ogy and effort, were also indicative of a difference in individual sizedistribution between the two systems with contrasted trophicstatus. This difference is likely due to the lower growth rate ofMediterranean organisms compared their Atlantic counterparts,like observed for the hake M. merluccius, for instance (De Pontualet al., 2006; Mellon-Duval et al., 2009). As such, for similar-sizedindividuals, organisms from the Mediterranean are surely mucholder than their Atlantic counterparts. In the previous study byCossa et al. (2012), this partly explained the higher concentrationsof Hg observed in Mediterranean hakes compared to Atlantic onesdue to age-related bioaccumulation of the metal, in addition to thefact that Hg burden is also more bio-diluted in larger organisms.
4.2. Me-Hg/T-Hg ratios, bioaccumulation and biomagnification ofHg
The relatively high percentage of Me-Hg measured (i.e. >85% on
t panel, N ¼ 134) or methyl-Hg (Me-Hg) concentrations (right panel, n ¼ 75), and d15Nin the NW Mediterranean e Gulf of Lion (MED e GoL) and in the NE Atlantic e Bay ofthe GLMs (lines) are plotted on observed log-transformed data. When the interaction
p is not different between the ecosystems), lines are parallel (i.e. same slope, althoughon power of T-Hg or Me-Hg within each ecosystem considered (as performed by Cossa2) are indicated.

T. Chouvelon et al. / Environmental Pollution 233 (2018) 844e854852
average for all species and in both ecosystems) was expected, sincemuscle was the tissue examined, and since the trophic position ofthe species considered was quite elevated. Indeed, this percentagehas long been considered virtually equal to 100% in the muscle ofhigh-trophic level consumers such as fish and cephalopodmolluscs(e.g., Bloom, 1992), due to the high affinity of Hg for muscularproteins’ sulfhydryl groups, although it generally varies between 60and 90% depending on species and on their trophic level (e.g.,Bustamante et al., 2006; Kehrig et al., 2010; Cossa et al., 2012). Itmay be also elevated in some crustacean species, but it is clearlylower (generally largely <50%) in low-trophic level consumers suchas bivalve molluscs (e.g., Cossa et al., 2012; Briant et al., 2017).Opposite to the other parameters regarded (i.e. individual sizes,d13C and d15N values, raw T-Hg and Me-Hg concentrations), thepercentage of Me-Hg in the muscle of the selected organismsgenerally did not differ a lot between the BoB and the GoL organ-isms. These results are in agreement with those of Cossa et al.(2012) that observed no significant differences in the percentageof Me-Hg in Mediterranean vs. Atlantic hakes. The fact that onlymedium-to high-trophic levels were considered here may partlyexplain this absence of difference in the Me-Hg/T-Hg ratios be-tween organisms from the two systems. Indeed, when consideringorganisms at the top of food webs, potential differences that couldexist in the Me-Hg/T-Hg proportions at the basal levels (inseawater, and/or in low-trophic level organisms) may no longer bevisible.
In fact, water Me-Hg concentrations were shown to be compa-rable between the BoB and the GoL shelf-edge ecosystems (Cossaet al., 2012). However, the BoB has probably a deeper thermoha-locline than the GoL and consequently a deeper organic matterregeneration zone, where Hg is likely methylated (Heimbürgeret al., 2010; Blum et al., 2013; Cossa et al., 2017). As the speciesconsidered here are endemic of the shelf-edge and heads of can-yons, they may be therefore more exposed to Me-Hg in Mediter-ranean waters than in Atlantic ones (through the higher content ofMe-Hg in the lower trophic levels themselves). This hypothesis isalso supported by the lower percentage of Me-Hg measured forM. poutassou in the GoL in particular, relative to the other fishspecies examined. Indeed, the shallower foraging zone of thisspecies was previously proposed as an explanation of its lower T-Hgburdens (Cresson et al., 2014b), but this may also explain the lowerproportion of Me-Hg in the muscle of this species, in addition to itslower trophic level in comparison with other species.
The significant relationships between log-transformed Hg con-centrations and d15N values were in agreement with the species-dependent patterns previously observed (i.e. increasing concen-trations with increasing trophic levels), and were thus alsoconsistent with the well-documented property of Hg to biomagnifyin food webs (Boening, 2000). Furthermore, the equations of theserelationships allow to compare the BP of this metal across foodwebs, using the slope of the relationships as a measure of thebiomagnification rate, and the intercept as the baseline value forprimary producers in the different systems (Chen et al., 2008; Cossaet al., 2012; Lavoie et al., 2013). Then, the biomagnification power(BP) of Hg may be expected to differ between systems when thed15N values of plankton (i.e. low trophic levels) differ betweensystems, and/or when Hg concentrations in plankton differ be-tween systems. Besides, variations in the d15N values or Hg con-centrations of plankton are linked, at least part, to the compositionof plankton (some planktonic species being able to fix atmosphericnitrogen with peculiar N signature, for instance; Kerherv�e et al.,2001). As a consequence, the BP may be expected to differ be-tween systems with different trophic status, i.e. between systemswith different planktonic communities at the base of food webs.
Here, higher intercepts were found for the Mediterranean
ecosystem, indicating a probably higher Hg burden from the lowesttrophic levels in the GoL compared to BoB (i.e. lower “bio-dilution”effect in the GoL's low trophic levels than in those from the BoB).However, the intercept is intimately linked to the slope, and suchdirect link with Hg baseline values should be done with cautionwhen the lowest trophic levels (plankton) are not available (Borgået al., 2012), as it is the case for the present study. Biomagnificationslopes (i.e. BPs), were previously reported to range between 0.09and 0.22 for T-Hg (average 0.20 ± 0.10) and between 0.14 and 0.26for Me-Hg (average 0.22 ± 0.09) in marine ecosystems (Lavoie et al.,2013). When considering Me-Hg concentrations, the BPs measuredhere (0.21 for both BoB and GoL ecosystems, not significantlydifferent) are therefore within this range of values. Alternatively,when calculated from T-Hg concentrations, the BPs significantlydiffered between the BoB (0.35) and the GoL (0.11), with a lower BPestimated for the Mediterranean system. This differs from the re-sults of Cossa et al. (2012), for instance, which found a higher BP inthe hake food web from the GoL (Mediterranean) than in thosefrom the BoB (Atlantic). The consideration of different food websand organismsmay be at the origin of the discrepancy between ourstudy and those of Cossa et al. (2012) (i.e. consideration of theneritic hake food web by Cossa et al., 2012, including lower trophiclevels, vs. shelf-edge/offshore organisms and medium-to high-trophic levels only here). Moreover, the lower BP found here for theMediterranean ecosystemmay favour the hypothesis of potentiallyhigher basal Hg levels (i.e. in plankton) than in Atlantic for theshelf-edge food webs considered here (as suggested by thedifferent intercept as well), although the biomagnification potentialof Hg may be then not especially higher in the rest of the food web(as suggested by similar BPs when considering the bioavailable andbioaccumulable formMe-Hg). Finally, if our estimated BPs probablyremain comparable at the scale of our study between GoL and BoB,with the same species considered in both systems, they are notnecessarily comparable to other studies that would include other(non-fish) species and especially lower trophic levels (e.g., Signaet al., 2017).
Overall, the present study thus showed that the higher Hgbioaccumulation rate by Mediterranean organisms is likely linkedto the oligotrophic character of waters and associated lower pro-ductivity in this system. Indeed, compared to mesotrophic envi-ronments, oligotrophic conditions are likely associated with: i)increased formation of the bioavailable Me-Hg at the depths oforganic matter regeneration (i.e. where the shelf-edge/offshorespecies considered here likely live), due to greater proportions ofslowly sinking pico- and nanophytoplanctonic cells that are readilydegraded by bacteria there (Cossa et al., 2009; Heimbürger et al.,2010); ii) lower bio-dilution of Hg from the lower trophic levels(i.e. phytoplankton; Pickhardt et al., 2002), with the presence ofsmaller and less abundant cells that are then also much moreconsumed e including their high Hg burden e by higher trophiclevel organisms; iii) lower growth rate of consumer organisms andconsequently, lower bio-dilution of Hg burden in their tissues aswell and high Hg retention with the age of organisms, the elimi-nation rate of the bioaccumulated Hg being very low (Wang andWong, 2003; Maulvault et al., 2016).
Finally, the potential impact of temperature differences betweenGoL and BoB on Hg bioaccumulation is also interesting to address inthe context of global change. Higher temperatures are likely toenhance bacterial activity and consequently Me-Hg formation,which in our study case may also partly explain the higher Hgbioaccumulation observed in Mediterranean organisms. Indeed inthe GoL, the sea surface temperatures were shown to vary between14 and 20 �C and to remain relatively constant around 13 �C below100e200 m depth (Conan et al., 1998), while in the BoB, the seasurface temperatures are slightly colder. They vary between 11 and

T. Chouvelon et al. / Environmental Pollution 233 (2018) 844e854 853
20 �C (for the southern part, less in the northern one) and remainbelow 12 �C in depth (Koutsikopoulos and Le Cann, 1996). Inaddition, higher temperatures such as it is likely the case forMediterranean waters were proved to promote Me-Hg bio-accumulation and to hamper its elimination in fish tissues, forinstance (Maulvault et al., 2016), which is also in favour of higherpotential for Hg bioaccumulation in Mediterranean organisms.
5. Conclusion and perspectives
The effect of ecosystems’ characteristics on Hg bioaccumulationand biomagnification was already demonstrated in freshwaterecosystems (e.g., lakes) through comparative studies (e.g., Kiddet al., 2012). Such ecosystem-comparative or meta-analysisstudies remained rare for marine ecosystems. They were there-fore recently encouraged to be done for generating new testablehypotheses concerning Hg bioaccumulation and biomagnification(Lavoie et al., 2013).
Benefiting from archived samples from the GoL and the BoBshelf-edge/offshore ecosystems, our study showed the strong in-fluence of the trophic status and/or functioning of systems on Hgbioaccumulation in marine medium-to high-trophic level organ-isms, which are generally important commercial species. It alsoreinforced and confirmed the hypothesis made by Cossa andCoquery (2005) that biological processes dominate the geochem-ical ones in explaining the “Mediterranean mercury anomaly”.Furthering some previous studies focusing on the coastal or neriticspecies that are red mullets or hakes (Cossa et al., 2012; Cressonet al., 2014a, 2015), the present marine ecosystem-comparativestudy demonstrated the crucial role of oligotrophy and associatedlower productivity on Hg bioaccumulation, at both multi-speciesand multi-systems scales.
As the processes of bio-dilution and low elimination rates mayalso apply to other metals, we propose that the bioaccumulation ofother metals may be also determined by the trophic status of theconsidered ecosystems in a non-negligible part. Thus, it would beinteresting to examine other trace metals on the samples used inthe present study, to investigate whether oligotrophy may alsoinfluence their bioavailability, transfer and bioaccumulation, andwhether the patterns observed for Hg are also applicable or not forother trace elements (e.g., species-dependant patterns kept or notbetween the systems). Also, investigating the potential differencesin the energy content of prey species/lower trophic levels betweensystems (i.e. expected to be affected by oligotrophy in Mediterra-neanwaters, for instance) may be interesting. This would enable tomore globally apprehend the mechanisms involved in the transferof contaminants (especially the lipophilic ones) to higher trophiclevels, and their transfer in food webs in general. Finally, with re-gard to the high significance of the trophic status of systems on Hgbioaccumulation shown in the present study, further work on verylow trophic levels (i.e. plankton) would be also highly relevant.
Acknowledgments
Authors are particularly grateful to the “Agence de l’Eau RhoneM�editerran�ee Corse” (AERMC) for financial support of the Medi-terranean analyses and of the associated RETROMED project, aswell as to the “Conseil R�egional de Poitou-Charentes” and the“Contrat de projet Etat-R�egion” (CPER 2013) that supported theanalyses relative to the Bay of Biscay area during the PhD of T.Chouvelon. We are grateful to C. Churlaud from the "PlateformeAnalyses El�ementaires” of LIENSs for her assistance during Hg an-alyses and to G. Guillou, P. Richard and B. Lebreton from the "Pla-teforme de Spectrom�etrie Isotopique” of the LIENSs laboratory fortheir assistance during SIA analyses. Thanks are also due to M.C.
Fabri for its implication in the RETROMED project, and to F. Cha-vanon and C. Ravel for their help during sampling and laboratorywork. Finally, authors want to thank the chief scientists and thecrew of the R/V “Thalassa” and “L'Europe” for facilitating thesampling during EVHOE 2008 (https://doi.org/10.17600/8040120)and MEDITS 2012 (https://doi.org/10.17600/12060100) surveys.
Appendix A. Supplementary data
Supplementary data related to this article can be found athttps://doi.org/10.1016/j.envpol.2017.11.015.
References
Aston, S.R., Fowler, S.W., 1985. Mercury in the open Mediterranean: evidence ofcontamination? Sci. Total Environ. 43, 13e26.
Azemard, S., Vassileva, E., 2015. Determination of methylmercury in marine biotasamples with advanced mercury analyser: method validation. Food Chem. 176,367e375.
B�anaru, D., Carlotti, F., Barani, A., Gr�egori, G., Neffati, N., Harmelin-Vivien, M., 2014.Seasonal variation of stable isotope ratios of size-fractionated zooplankton inthe Bay of Marseille (NW Mediterranean Sea). J. Plankton Res. 36, 145e156.
Biddanda, B., Ogdahl, M., Cotner, J., 2001. Dominance of bacterial metabolism inoligotrophic relative to eutrophic waters. Limnol. Oceanogr. 46, 730e739.
Bloom, N.S., 1992. On the chemical form of mercury in edible fish and marineinvertebrate tissue. Can. J. Fish. Aquat. Sci. 49, 1010e1017.
Blum, J.D., popp, B.N., Drazen, J.C., Choy, C.A., Johnson, M.W., 2013. Methylmercuryproduction below the mixed layer in the north pacific ocean. Nat. Geosci. 6,879e884.
Boening, D., 2000. Ecological effects, transport, and fate of mercury: a general re-view. Chemosphere 40, 1335e1351.
Borgå, K., Kidd, K.A., Muir, D.C.G., Berglund, O., Conder, J.M., Gobas, F.A.P.C.,Kucklick, J., Malm, O., Powell, D.E., 2012. Trophic magnification factors: con-siderations of ecology, ecosystems, and study design. Integr. Envrion Assess.Manag. 8, 64e84.
Briant, N., Chouvelon, T., Martinez, L., Brach-Papa, C., Chiffoleau, J.F., Savoye, N.,Sonke, J., Knoery, J., 2017. Spatial and temporal distribution of mercury andmethylmercury in bivalves from the French coastline. Mar. Pollut. Bull. 114,1096e1102.
Briant, N., Savoye, N., Chouvelon, T., David, V., Rodriguez, S., Charlier, K., Sonke, J.,Chiffoleau, J.F., Brach-Papa, C., Knoery, J., 2018. Carbon and nitrogen elementaland isotopic ratios of filter-feeding bivalves along the French coasts: anassessment of specific, geographic, seasonal and multi-decadal variations. Sci.Tot Environ. 613e614, 196e207.
Bustamante, P., Lahaye, V., Durnez, C., Churlaud, C., Caurant, F., 2006. Total andorganic Hg concentrations in cephalopods from the North Eastern Atlanticwaters: influence of geographical origin and feeding ecology. Sci. Total Environ.368, 585e596.
Chen, C., Amirbahman, A., Fisher, N., Harding, G., Lamborg, C., Nacci, D., Taylor, D.,2008. Methylmercury in marine ecosytems: spatial patterns and processes ofproduction, bioaccumulation, and biomagnification. EcoHealth 5, 399e408.
Chen, C.Y., Folt, C.L., 2005. High plankton densities reduce mercury bio-magnification. Environ. Sci. Technol. 39, 115e121.
Chouvelon, T., Spitz, J., Caurant, F., M�endez-Fernandez, P., Autier, J., Lassus-D�ebat, A.,Bustamante, P., 2012. Enhanced bioaccumulation of mercury in deep-sea faunafrom the Bay of Biscay (North-East Atlantic) in relation to trophic positionsidentfied by analysis of carbon and nitrogen stable isotopes. Deep-Sea Res. I 65,113e124.
Chouvelon, T., Caurant, F., Cherel, Y., Spitz, J., Simon-Bouhet, B., Bustamante, P.,2014a. Species- and size-related patterns in stable isotopes and mercury con-centrations in fish help refine marine ecosystem indicators and provide evi-dence for distinct management units for hake in the Northeast Atlantic. ICES J.Mar. Sci. 75, 1073e1087.
Chouvelon, T., Chappuis, A., Bustamante, P., Lefebvre, S., Mornet, F., Guillou, G.,Violamer, L., Dupuy, C., 2014b. Trophic ecology of European sardine Sardinapilchardus and European anchovy Engraulis encrasicolus in the Bay of Biscay(North-East Atlantic) inferred from d13C and d15N values of fish and identifiedmesozooplanktonic organisms. J. Sea Res. 85, 277e291.
Chouvelon, T., Brach-Papa, C., Auger, D., Bodin, N., Bruzac, S., Crochet, S.,Degroote, M., Hollanda, S.J., Hubert, C., Knoery, J., Munschy, C., Puech, A.,Rozuel, E., Thomas, B., West, W., Bourjea, J., Nikolic, N., 2017. Chemical con-taminants (trace metals, persistent organic pollutants) in albacore tuna fromwestern Indian and south-eastern Atlantic Oceans: Trophic influence and po-tential as tracers of populations. Science of the Total Environment 596-597,481e495.
Choy, C.A., Popp, B.N., Kaneko, J.J., Drazen, J.C., 2009. The influence of depth onmercury levels in pelagic fishes and their prey. Proc. Natl. Acad. Sci. U. S. A. 106,13865e13869.
Cossa, D., Averty, B., Pirrone, N., 2009. The origin of methylmercury in open Med-iterranean waters. Limnol. Oceanogr. 54, 837e844.

T. Chouvelon et al. / Environmental Pollution 233 (2018) 844e854854
Conan, P., Pujo-Pay, M., Raimbault, P., Leveau, M., 1998. Variabilit�e hydrologique etbiologique du golfe du Lion. II. Productivit�e sur le bord interne du courant.Oceanol. Acta 21, 767e782.
Cossa, D., Coquery, M., 2005. The Mediterranean mercury anomaly, a geochemicalor a biological issue. In: Saliot, A. (Ed.), The Mediterranean Sea. Handbook ofEnvironmental Chemistry, vol. 5. Springer Berlin Heidelberg, pp. 177e208.
Cossa, D., Harmelin-Vivien, M., Mellon-Duval, C., Loizeau, V., Averty, B., Crochet, S.,Chou, L., Cadiou, J.F., 2012. Influences of bioavailability, trophic position, andgrowth on methylmercury in hakes (Merluccius merluccius) from NorthwesternMediterranean and Northeastern Atlantic. Environ. Sci. Technol. 46,4885e4893.
Cossa, D., Durrieu de Madron, X., Sch€afer, J., Lanceleur, L., Gu�edron, S., Buscail, R.,Thomas, B., Castelle, S., Naudin, J.J., 2017. The open sea as the main source ofmethylmercury in the water column of the Gulf of Lions (Northwestern Med-iterranean margin). Geochim. Cosmochim. Acta 199, 222e237.
Cresson, P., Bouchoucha, M., Miralles, F., Elleboode, R., Mah�e, K., Marusczak, N.,Thebault, H., Cossa, D., 2014a. Are red mullet efficient as bio-indicators ofmercury contamination? A case study from the French Mediterranean? Mar.Pollut. Bull. 91, 191e199.
Cresson, P., Fabri, M.C., Bouchoucha, M., Brach Papa, C., Chavanon, F., Jadaud, A.,Knoery, J., Miralles, F., Cossa, D., 2014b. Mercury in organisms from theNorthwestern Mediterranean slope: importance of food sources. Sci. Tot Envi-ron. 497e498, 229e238.
Cresson, P., Bouchoucha, M., Morat, F., Miralles, F., Chavanon, F., Loizeau, V.,Cossa, D., 2015. A multitracer approach to assess the spatial contaminationpattern of hake (Merluccius merluccius) in the French Mediterranean. Sci. TotEnviron. 532, 184e194.
Cresson, P., Ruitton, S., Harmelin-Vivien, M., 2016. Feeding strategies of co-occurringsuspension feeders in an oligotrophic environment. Food Webs 6, 19e28.
De Pontual, H., Groison, A.L., Pineiro, C., Bertignac, M., 2006. Evidence of underes-timation of European hake growth in the Bay of Biscay, and its relationship withbias in the agreed method of age estimation. ICES J. Mar. Sci. 63, 1674e1681.
Espinasse, B., Harmelin-Vivien, M., Tiano, M., Guilloux, L., Carlotti, F., 2014. Patternsof variations in C and N stable isotope ratios in size-fractionated zooplankton inthe Gulf of Lion, NW Mediterranean Sea. J. Plankton Res. 36, 1204e1215.
Fitzgerald, W.F., Lamborg, C.H., Hammerschmidt, C.R., 2007. Marine biogeochemicalcycling of mercury. Chem. Rev. 107, 641e662.
Goutte, A., Bustamante, P., Barbraud, C., Delord, K., Weimeskirch, H., Chastel, O.,2014. Demographic responses to mercury exposure in two closely-relatedAntarctic top predators. Ecology 95, 1075e1086.
Harmelin-Vivien, M., Cossa, D., Crochet, S., Banaru, D., Letourneur, Y., Mellon-Duval, C., 2009. Difference of mercury bioaccumulation in red mullets from thenorth-western Mediterranean and Black seas. Mar. Pollut. Bull. 58, 679e685.
Heimbürger, L.E., Cossa, D., Marty, J.C., Migon, C., Averty, B., Dufour, A., Ras, J., 2010.Methyl mercury distributions in relation to the presence of nano- and pico-phytoplankton in an oceanic water column (Ligurian Sea, North-westernMediterranean). Geochim. Cosmochim. Acta 74, 5549e5559.
Kehrig, H.A., Seixas, T.G., Baeta, A.P., Malm, O., Moreira, I., 2010. Inorganic andmethylmercury: do they transfer along a tropical coastal food web? Mar. Pollut.Bull. 60, 2350e2356.
Kerherv�e, P., Minagawa, M., Heussner, S., Monaco, A., 2001. Stable isotopes (13C/12Cand 15N/14N) in settling organic matter of the northwestern Mediterranean Sea:biogeochemical implications. Oceanol. Acta 24, S77eS85.
Kidd, K.A., Muir, D.C.G., Evans, M.S., Wang, X., Whittle, M., Swanson, H.K.,Johnston, T., Guildford, S., 2012. Biomagnification of mercury through lake trout(Salvelinus namaycush) food webs of lakes with different physical, chemical andbiological characteristics. Sci. Tot Environ. 438, 135e143.
Koutsikopoulos, C., Le Cann, B., 1996. Physical processes and hydrological structuresrelated to the Bay of Biscay anchovy. Sci. Mar. 60, 9e19.
Laborde, P., Urrutia, J., Valencia, V., 1999. Seasonal variability of primary productionin the Cap-Ferret Canyon area (Bay of Biscay) during the ECOFER cruises. Deep-Sea Res. II 2057e2079.
Lavoie, R.A., Jardine, T.D., Chumchal, M.M., Kidd, K.A., Campbell, L.M., 2013. Bio-magnification of mercury in aquatic food webs: a worldwide meta-analysis.Environ. Sci. Technol. 47, 13385e13394.
Le Faucheur, S., Campbell, P.G.C., Fortin, C., Slaveykova, V.I., 2014. Interactions be-tween mercury and phytoplankton: speciation, bioavailability, and internalhandling. Environ. Toxicol. Chem. 33, 1211e1224.
Lefevre, D., Minas, H.J., Minas, M., Robinson, C., Williams, P.J., Le, B.,
Woodward, E.M.S., 1997. Review of gross community production, primaryproduction, net community production and dark community respiration in theGulf of Lions. Deep-Sea Res. II 44, 801e832.
Le Moal, M., Biegala, I.C., 2009. Diazotrophic unicellular cyanobacteria in thenorthwestern Mediterranean Sea: a seasonal cycle. Limnol. Oceanogr. 54,844e855.
Li�enart, C., Savoye, N., Bozec, Y., Breton, E., Conan, P., David, V., Feunteun, E.,Grnag�er�e, K., Kerherv�e, P., Lebreton, B., Lefebvre, S., et al., 2017. Dynamics ofparticulate organic matter composition in coastal systems: a spatio-temporalstudy at multi-systems scale. Prog. Oceanogr. 156, 221e239.
Longhurst, A., 1998. Ecological Geography of the Sea, vol. 1. Academic Press, London,p. 560.
Longhurst, A., 2007. Ecological Geography of the Sea, vol. 2. Academic Press, Lon-don, p. 398.
Mason, R.P., Rolfhus, K.R., Fitzgerald, W.F., 1995. Methylated and elemental mercurycycling in surface and deep ocean waters of the North Atlantic. Wat Air SoilPollut. 80, 665e677.
Maulvault, A.L., Cust�odio, A., Anacleto, P., Repolho, T., Pous~ao, P., Nunes, M.L.,Diniz, M., Rosa, R., Marques, A., 2016. Bioaccumulation and elimination ofmercury in juvenile seabass (Dicentrarchus labrax) in a warmer environment.Environ. Res. 149, 77e85.
Mellon-Duval, C., de Pontual, H., M�etral, L., Quemener, L., 2009. Growth of Europeanhake (Merluccius merluccius) in the Gulf of Lions based on conventional tagging.ICES J. Mar. Sci. 67, 62e70.
M�endez-Fernandez, P., Pierce, G.J., Bustamante, P., Chouvelon, T., Ferreira, M.,Gonz�alez, A.F., L�opez, A., Read, F., Santos, M.B., Spitz, J., Vingada, J.V., Caurant, F.,2013. Ecological niche segregation among five toothed whale species off theNW Iberian Peninsula using ecological tracers as multi-approach. Mar. Biol. 160,2825e2840.
Monteiro, L.R., Costa, V., Furness, R.W., Santos, R.S., 1996. Mercury concentrations inprey fish indicate enhanced bioaccumulation in mesopelagic environments.Mar. Ecol. Prog. Ser. 141, 21e25.
Monteiro, L.R., Lopes, H.D., 1990. Mercury content of swordfish, Xiphias gladius, inrelation to length, weight, age, and sex. Mar. Pollut. Bull. 21, 293e296.
Montoya, J.P., 2007. Natural abundance of 15N in marine planktonic ecosystems. In:Michener, R., Lajtha, K. (Eds.), Stable Isotopes in Ecology and EnvironmentalScience. Blackwell Publishing, pp. 76e201.
Pickhardt, P.C., Folt, C.L., Chen, C.Y., Klaue, B., Blum, J.D., 2002. Algal blooms reducethe uptake of toxic methylmercury in freshwater food webs. Proc. Natl. Acad.Sci. U. S. A. 99, 4419e4423.
Pierce, G.J., Stowasser, G., Hastie, L.C., Bustamante, P., 2008. Geographic, seasonaland ontogenetic variation in cadmium and mercury concentrations in squid(Cephalopoda: teuthoidea) from UK waters. Ecotoxicol. Environ. Saf. 70,422e432.
Reygondeau, G., longhurst, A., Martinez, E., Beaugrand, G., Antoine, D., Maury, O.,2013. Dynamic biogeochemical provinces in the global ocean. Glob. Bio-geochem. Cy 27, 1e13.
Signa, G., Mazzola, A., Tramati, C.D., Vizzini, S., 2017. Diet and habitat use influenceHg and Cd transfer to fish and consequent biomagnification in a highlycontaminated area: augusta Bay (Mediterranean Sea). Environ. Pollut. 230,394e404.
Simoneau, M., Lucotte, M., Garceau, S., Laliberte, D., 2005. Fish growth ratesmodulate mercury concentrations in walleye (Sander vitreus) from eastern Ca-nadian lakes. Environ. Res. 98, 73e82.
Tan, S.W., Meiller, J.C., Mahaffey, K.R., 2009. The endocrine effects of mercury inhumans and wildlife. Crit. Rev. Toxicol. 39, 228e269.
Trudel, M., Rasmussen, J.B., 2006. Bioenergetics and mercury dynamics in fish: amodelling perspective. Can. J. Fish. Aquat. Sci. 63, 1890e1902.
US EPA, 2011. Exposure Factors Handbook 2011 Edition. Final Report. US Environ-mental Protection Agency, Washington, DC. EPA/600/R-09/052F.
Wang, W.X., Wong, R.S.K., 2003. Bioaccumulation kinetics and exposure pathwaysof inorganic mercury and methylmercury in a marine fish, the sweetlips Plec-torhinchus gibbosus. Mar. Ecol. Prog. Ser. 257, 257e268.
Ward, D.M., Nislow, K.H., Chen, C.Y., Folt, C.L., 2010. Reduced trace element con-centrations in fast-growing juvenile Atlantic salmon in natural streams. Envi-ron. Sci. Technol. 44, 3245e3251.
Zuur, A.F., Ieno, E.N., Smith, G.M., 2007. Analysing Ecological Data. Springer, NewYork (USA).