oligomers of the prion protein fragment 106-126 are likely assembled from ²-hairpins in solution
TRANSCRIPT

Oligomers of the Prion Protein Fragment 106-126 Are LikelyAssembled from �-Hairpins in Solution, and Methionine
Oxidation Inhibits Assembly without Altering the Peptide’sMonomeric Conformation
Megan Grabenauer,† Chun Wu,† Patricia Soto,†,‡ Joan-Emma Shea,†,§ andMichael T. Bowers*,†
Departments of Chemistry and Biochemistry and of Physics, UniVersity of California,Santa Barbara, California 93106, and Department of Physics, Creighton UniVersity,
Omaha, Nebraska 68178
Received July 7, 2009; E-mail: [email protected]
Abstract: A portion of the prion protein, PrP106-126, is highly conserved among various species and isthought to be one of the key domains involving amyloid formation of the protein. We used ion mobilityspectrometry-mass spectrometry (IMS-MS) in conjunction with replica exchange molecular dynamics(REMD) to examine the monomeric and oligomeric structures of normal PrP106-126 and two nonaggre-gating forms of the peptide, an oxidized form in which both methionine residues are oxidized to methioninesulfoxide and a control peptide consisting of the same amino acids as PrP106-126 in a scrambled sequence.Our ion mobility and simulation data indicate the presence of a population of �-hairpin monomers for thenormal and oxidized peptides. This is supported by our CD data indicating that a monomer solution of thenormal peptide contains ∼46% �-sheet and ∼23% �-turn content, in excellent agreement with our REMDsimulations. Oligomerization was seen by IMS-MS for the normal peptide only, not the oxidized peptideor the control sequence. Both our IMS-MS and CD data suggest that this oligomerization results from theassociation of ordered �-hairpin monomers rather than disordered monomers. Structural analysis showsthat the normal and oxidized peptides have similar secondary and tertiary structural properties, suggestingthat the inhibition of aggregation caused by methionine oxidation stems from mediating interpeptideinteractions rather than by altering the peptide’s monomeric conformation. In contrast, an increase in R-helicaland random coil structural components relative to the normal peptide might be responsible for the lack ofobserved aggregation of the control peptide.
Transmissible spongiform encephalopathies (TSEs) are afamily of diseases that infect many species including humans(Creutzfeldt-Jakob disease, CJD, and Gerstmann-Straussler-Scheinker disease, GSS), sheep and goats (scrapie), cattle(bovine spongiform encephalopathy, BSE), and deer and elk(chronic wasting disease, CWD). These diseases are all char-acterized by the accumulation of an abnormally folded form ofthe prion protein as �-sheet-rich amyloid fibrils in the brain.1
This abnormally folded form of the prion protein, PrPSc, hassignificantly more �-sheet and less R-helical content than thenormal cellular form, PrPC.2 It remains under debate when andhow monomers of PrPC assemble into �-sheets. A popular beliefis that ordered �-sheets are formed through a conformationtransition of disordered aggregates to �-structure after initialnucleation.3 Alternatively, it has been suggested that earlyordered oligomers are nucleated from �-structure-rich monomers
rather than unstructured coils. This idea is supported bytheoretical studies showing that a fragment of the amyloid-�peptide can adopt a �-hairpin-like fold in monomers and smalloligomers.4,5 The latter mechanism appears physically attractivesince it does not involve a drastic structural transition that isenergetically unfavorable (rearrangement of large disorderedaggregates at a late stage of amyloid fibril formation mustinvolve overcoming a significant free energy barrier), but it hasnot been experimentally verified in any system.
Methionine oxidation appears to be a common factor affectingfibril formation in amyloid diseases6 and has been shown toinhibit the pathogenic aggregation of amyloid-�,7 PrP,8 tran-sthyretin,9 and R-synuclein.10 The inhibition might be causedby (A) a change of interpeptide interactions upon oxidation or
† Department of Chemistry and Biochemistry, University of California.‡ Creighton University.§ Department of Physics, University of California.
(1) Prusiner, S. B. Science 1991, 252, 1515–1522.(2) Pan, K. M.; Baldwin, M.; Nguyen, J.; Gasset, M.; Serban, A.; Groth,
D.; Mehlhorn, I.; Huang, Z. W.; Fletterick, R. J.; Cohen, F. E.; Prusiner,S. B. Proc. Natl. Acad. Sci. U.S.A. 1993, 90, 10962–10966.
(3) Chiti, F.; Dobson, C. M. Annu. ReV. Biochem. 2006, 75, 333–366.
(4) Baumketner, A.; Shea, J. E. J. Mol. Biol. 2006, 362, 567–579.(5) Jang, S.; Shin, S. J. Phys. Chem. B 2006, 110, 19551958. Jang, S.;
Shin, S. J. Phys. Chem. B 2008, 112, 3479–3484.(6) Butterfield, D. A.; Kanski, J. Mech. Ageing DeV. 2001, 122, 945–
962.(7) Hou, L. M.; Kang, I.; Marchant, R. E.; Zagorski, M. G. J. Biol. Chem.
2002, 277, 40173–40176.(8) Breydo, L.; Bocharova, O. V.; Makarava, N.; Salnikov, V. V.;
Anderson, M.; Baskakov, I. V. Biochemistry 2005, 44, 15534–15543.(9) Maleknia, S. D.; Reixach, N.; Buxbaum, J. N FEBS J. 2006, 273,
5400–5406.
Published on Web 12/18/2009
10.1021/ja905595k 2010 American Chemical Society532 9 J. AM. CHEM. SOC. 2010, 132, 532–539

(B) a change of intrapeptide interactions upon oxidation, leadingto a conformation change of the peptide monomer. Again, adefinitive answer is impeded by a lack of detailed informationon the structures of monomers and early oligomerization statesof normal and oxidized peptides. Binger et al.11 made a seriesof single and double methionine-glutamine substitutions onhuman apolipoprotein C-II (an amyloid fibril forming proteincontaining two methionines) to mimic the effect of oxidationand found no significant difference in the secondary structurebetween the wild type and glutamine-substituted mutants.Therefore, their data support mechanism A. However, sinceglutamine is not identical to an oxidized methionine and thesame secondary structure could have a quite different tertiarystructure, a direct study on the effects of oxidation at an atomiclevel is necessary. To address this issue, we used a combinedexperimental and theoretical approach to study monomerstructures of a key fragment of PrP and its early oligomerizationprocess.
A portion of the protein, PrP106-126, corresponding toresidues 106-126 of the human PrP sequence(K106TNMKHMAGAAAAGAVVGGLG126), is highly con-served among various species and is thought to be one of thekey domains involved in amyloid formation and the conforma-tional change from the normal cellular form of the protein, PrPC,to the �-sheet rich form, PrPSc.12 The synthetic PrP106-126peptide shares many similarities with PrPSc; it is highlyamyloidogenic,13 protease resistant,13,14 and neurotoxic both invivo15,16 and in vitro.16,17 Similarly to PrPSc, the neurotoxicityof this peptide requires the expression of PrPC,18 providing astrong indication that the toxicity of this fragment reflects thepathogenic mechanism of PrPSc. Oxidation of the two methion-ine residues (Met109 and Met112) has been shown to inhibitPrP106-126 aggregation.17,19,20 In the work presented here, weexamine an oxidized version of the peptide in which bothmethionine residues are intentionally converted to methioninesulfoxide to determine how this modification alters the mono-meric structure of the peptide and its early oligomerization.
Although the monomeric form of PrP106-126 has beenstudied extensively by ensemble-averaging methods,17,21-23
detailed molecular structures are not available due to theremarkable conformational polymorphism of this disorderedpeptide in solution. In addition, structural information aboutPrP106-126 has been notoriously difficult to obtain becauseof its aggregating nature and tendency to form complex fibrilshaving noncrystalline polymeric structures that are difficult tocharacterize using X-ray crystallography. Most of the structuralinformation obtained so far has come from studies using CD17,21
and NMR,23,24 both of which reveal properties of the bulksolution, which may contain multiple oligomeric and confor-mational states. In this study we use the experimental techniqueof ion mobility spectrometry-mass spectrometry (IMS-MS)25
in conjunction with molecular modeling to examine the con-formations of this peptide. Unlike CD and NMR, IMS-MSallows us to selectively examine oligomeric states and/orconformational families. This technique is even more powerfulwhen combined with state-of-the-art replica exchange moleculardynamics (REMD) simulations,26,27 which yield informationabout structure at the atomic level.28 In addition, CD is used toverify our REMD secondary structure population predictions,and AFM is used to verify the solution conditions for fibrilformation.
Materials and Methods
Sample Preparation. PrP106-126 (KTNMKHMAGAAAA-GAVVGGLG) was purchased from Bachem (Torrance, CA). Anoxidized version in which both methionine residues were intention-ally converted to methionine sulfoxide and a control peptideconsisting of the same amino acids as PrP106-126 in a scrambledsequence (LVGAHAGKMGANTAKAGAMVG) were synthesizedusing solid-phase synthesis techniques and generously provided byDr. Peter Heegaard. All peptides examined in this study had freeN and C termini. Concentrated stock solutions were prepared bydissolving the lyophilized peptides in HPLC grade water (J.T.Baker, Phillipsburg, NJ) that was previously adjusted to pH 7 withdilute ammonium hydroxide and filtered through a 0.2 µm filter.Stock solutions were desalted using G-10 MacroSpin columns (NestGroup, Southborough, MA) and stored at -20 °C for later use.The resulting peptide samples had pH values between 6.8 and 7.0.Fresh samples of peptide in filtered HPLC grade water (20 µM forIMS-MS experiments and 100 µM for CD experiments) wereprepared from the stock solutions immediately prior to use. Thesamples were left at room temperature for incubation studies.
(10) Uversky, V. N.; Yamin, G.; Souillac, P. O.; Goers, J.; Glaser, C. B.;Fink, A. L. FEBS Lett. 2002, 517, 239–244.
(11) Binger, K. J.; Griffin, M. D. W.; Howlett, G. J. Biochemistry 2008,47, 10208–10217.
(12) Muramoto, T.; DeArmond, S. J.; Scott, M.; Telling, G. C.; Cohen,F. E.; Prusiner, S. B. Nat. Med. 1997, 3, 750–755. Muramoto, T.;Scott, M.; Cohen, F. E.; Prusiner, S. B. Proc. Natl. Acad. Sci. U.S.A.1996, 93, 15457–15462. Brown, D. R.; Schmidt, B.; Kretzschmar,H. A. Nature 1996, 380, 345–347. Fischer, M.; Rulicke, T.; Raeber,A.; Sailer, A.; Moser, M.; Oesch, B.; Brandner, S.; Aguzzi, A.;Weissmann, C. EMBO J. 1996, 15, 1255–1264.
(13) Tagliavini, F.; Prelli, F.; Verga, L.; Giaccone, G.; Sarma, R.; Gorevic,P.; Ghetti, B.; Passerini, F.; Ghibaudi, E.; Forloni, G.; Salmona, M.;Bugiani, O.; Frangione, B. Proc. Natl. Acad. Sci. U.S.A. 1993, 90,9678–9682.
(14) Forloni, G.; Angeretti, N.; Chiesa, R.; Monzani, E.; Salmona, M.;Bugiani, O.; Tagliavini, F. Nature 1993, 362, 543–546.
(15) Ettaiche, M.; Pichot, R.; Vincent, J. P.; Chabry, J. J. Biol. Chem. 2000,275, 36487–36490.
(16) Chabry, J.; Ratsimanohatra, C.; Sponne, I.; Elena, P. P.; Vincent, J. P.;Pillot, T. J. Neurosci. 2003, 23, 462–469.
(17) Salmona, M.; Malesani, P.; De Gioia, L.; Gorla, S.; Bruschi, M.;Molinari, A.; Della Vedova, F.; Pedrotti, B.; Marrari, M. A.; Awan,T.; Bugiani, O.; Forloni, G.; Tagliavini, F. Biochem. J. 1999, 342,207–214.
(18) Hope, J.; Shearman, M. S.; Baxter, H. C.; Chong, A.; Kelly, S. M.;Price, N. C. Neurodegeneration 1996, 5, 1–11. Brown, D. R.; Herms,J.; Kretzschmar, H. A. NeuroReport 1994, 5, 2057–2060.
(19) Heegaard, P. M. H.; Pedersen, H. G.; Flink, J.; Boas, U. FEBS Lett.2004, 577, 127–133.
(20) Bergstrom, A. L.; Cordes, H.; Zsurger, N.; Heegaard, P. M. H.;Laursen, H.; Chabry, J. J. Biol. Chem. 2005, 280, 23114–23121.
(21) De Gioia, L.; Selvaggini, C.; Ghibaudi, E.; Diomede, L.; Bugiani, O.;Forloni, G.; Tagliavini, F.; Salmona, M. J. Biol. Chem. 1994, 269,7859–7862.
(22) Villa, A.; Mark, A. E.; Saracino, G. A. A.; Cosentino, U.; Pitea, D.;Moro, G.; Salmona, M. J. Phys. Chem. B 2006, 110, 1423–1428. DiNatale, G.; Impellizzeri, G.; Pappalardo, G. Org. Biomol. Chem. 2005,3, 490–497.
(23) Ragg, E.; Tagliavini, F.; Malesani, P.; Monticelli, L.; Bugiani, O.;Forloni, G.; Salmona, M. Eur. J. Biochem. 1999, 266, 1192–1201.
(24) Kuwata, K.; Matumoto, T.; Cheng, H.; Nagayama, K.; James, T. L.;Roder, H. Proc. Natl. Acad. Sci. U.S.A. 2003, 100, 14790–14795.
(25) von Helden, G.; Hsu, M. T.; Gotts, N.; Bowers, M. T. J. Phys. Chem.1993, 97, 8182–8192. Wyttenbach, T.; Bowers, M. T. Gas-PhaseConformations: The Ion Mobility/Ion Chromatography Method. InModern Mass Spectrometry; Schalley, C. A., Ed.; Springer: Berlin,2003; pp 207-232.
(26) Geyer, C. J. Computing Science and Statistics: Proceedings of the23rd Symposium on the Interface; Springer-Verlag: New York, 1991;pp 156-163. Hukushima, K.; Nemoto, K. J. Phys. Soc. Jpn. 1996,65, 1604–1608. Swendsen, R. H.; Wang, J. S. Phys. ReV. Lett. 1986,57, 2607–2609.
(27) Sugita, Y.; Okamoto, Y. Chem. Phys. Lett. 1999, 314, 141–151.(28) Baumketner, A.; Bernstein, S. L.; Wyttenbach, T.; Bitan, G.; Teplow,
D. B.; Bowers, M. T.; Shea, J. E. Protein Sci. 2006, 15, 420–428.
J. AM. CHEM. SOC. 9 VOL. 132, NO. 2, 2010 533
PrP106-126 Oligomers Formed from �-Hairpins A R T I C L E S

Ion Mobility and Mass Spectrometry. Mass spectra andmobility data leading to experimental collision cross sections wereobtained on a home-built nano electrospray ionization massspectrometer. Details of the instrumentation have previously beenpublished.29 The instrument consists of an ionization source, anion funnel, a drift cell, and a quadrupole mass filter. To obtain massspectra, ions are generated in the source and pass through theinstrument as a continuous beam before arriving at the detector.For mobility data, the ion beam is trapped in the ion funnel andpulsed into the drift cell filled with ∼5 Torr of helium buffer gas.Once inside the cell ions are pulled through by a weak electricfield, E, and experience frictional drag due to the buffer gas, veryquickly reaching a constant drift velocity, VD, proportional to E:
where the proportionality constant K is the ion mobility.After exiting the drift cell, ions pass through the quadrupole mass
filter and are detected as a function of time, producing an arrivaltime distribution (ATD). An ion’s arrival time, ta, is related to thereduced ion mobility, K0, by
where td is the amount of time the ion spends inside the drift cell,t0 is the amount of time the ion spends outside the drift cell, l isthe length of the drift cell, T is the temperature inside the driftcell, P is the pressure inside the drift cell, V is the voltage appliedacross the drift cell, and T0 and P0 are standard temperature andpressure, respectively. ta is measured at a series of field strengths,and plotting ta vs P/V for a given temperature yields a straight linewith an intercept equal to t0. K0 can be obtained from the slope ofthe line, and through the use of kinetic theory, the ion’s collisioncross section, σ, can be calculated using the following equation:30
where z is the ion’s charge, µ is the reduced mass of the collidingparticles (ion + He), kb is the Boltzmann constant, and N is the Henumber density at STP.
Circular Dichroism. Circular dichroism experiments wereperformed at room temperature on an AVIV 202 circular dichroismspectrophotometer using a 0.1 cm path length quartz cell. Resultspresented are the average of four scans taken at 0.5 nm incrementswith an averaging time of 2 s and a 1 nm bandwidth. All spectraare background subtracted and smoothed using the Savitsky-Colaymethod with a polynomial order of 3 and a smoothing window of15 points.31 Mean residue ellipticities were calculated using
where θ is the ellipticity in millidegrees, l is the path length inmillimeters, C is the molar concentration of the peptide, and Nr isthe number of residues. The secondary structure population wasanalyzed using the constrained least-squares fitting analysis programLINCOMB32 with a polypeptide-based reference set.33
Molecular Dynamics Simulations. The AMBER 934 suite wasused in REMD27 simulations and data processing. All three peptideswere modeled with a net charge of +2 and unblocked termini, usingthe AMBER all-atom point-charge force field, ff96.35 Studies36 haveshown that ff96 combined with a recent generalized-born implicitsolvent model (IGB)5)37 plus the surface term (gbsa)1, surfacetension)5.0 cal/mol/Å2) predicts reasonable structures for smallR, �, and R/� proteins, and ff96 is fairly well-balanced betweenR-helix and �-sheet. The parameters for a singly oxidized methion-ine residue were derived by following the same protocol used indeveloping AMBER ff96.
REMD simulations were used to generate two types of theoreticalstructures: solvent-free (preferred gas-phase conformations) anddehydrated solution (the result of removing water molecules fromsolution structures, mimicking transfer of the solution structure intoa vacuum). Starting structures were created by building extendedchain conformations and then subjecting them to an initial energyminimization. Solvent-free simulations were carried out in avacuum, and solution-phase structures were generated using theimplicit solvent model mentioned above to represent solvationeffects with an effective salt concentration of 0.2 M. Sixteen replicaswere set up with temperatures exponentially spaced from 270 to465 K for solution-phase calculations (i.e., 270.0, 278.9, 289.3,300.0, 311.2, 322.7, 334.7, 347.2, 360.1, 373.4, 387.3, 401.7, 416.6,432.1, 448.2, and 465.0 K) and 300-2200 K for solvent-freecalculations (i.e., 300.0, 342.6, 391.3, 446.9, 510.4, 582.8, 665.6,760.2, 868.2, 991.5, 1132.4, 1293.2, 1476.9, 1686.7, 1926.4, and2200.0 K). The temperature values were optimized using thealgorithm described by Wu et al.38 Extreme high temperature (i.e.,up to 2200 K) was used in the solvent-free simulations to overcomeslow structural relaxation and did not produce any notable structuralartifacts (e.g., trans to cis isomerizations of peptide bonds) withinthe duration of the simulations (40.0 ns for each replica). Initialvelocities of atoms for each replica were generated according tothe Maxwell-Boltzmann distribution for that replica’s initialtemperature. The first 1.0 ns of molecular dynamics in each replicawas performed without replica exchanges to equilibrate the systemat its target temperature. After the first 1.0 ns, exchanges betweenneighboring replicas were attempted every 2000 MD steps (2.0 ps),and the exchange rate among replicas was ∼20%. SHAKE39 wasapplied to constrain all bonds connecting hydrogen atoms, and ashorter time step of 1.0 fs rather than the typical 2.0 fs was used toavoid the SHAKE failure associated with large atomic displace-ments at the high temperatures used in our simulations. To reducethe computation time, nonbonded forces were calculated using atwo-stage RESPA approach40 where the forces within a 12 Å radiuswere updated every step and those beyond 12 Å were updated everytwo steps. Temperature was controlled using Berendsen’s algo-rithm41 with a coupling constant of 1.0 ps. The center of masstranslation and rotation were removed every 500 MD steps (0.5ps). Each solution-phase replica was run for 200.0 ns, resulting inan aggregated simulation time of 3.2 µs for each peptide, and eachsolvent-free replica was run for 40.0 ns, resulting in an aggregated
(29) Wyttenbach, T.; Kemper, P. R.; Bowers, M. T. Int. J. Mass Spectrom.2001, 212, 13–23.
(30) Mason, E. A.; McDaniel, E. W. Transport Properties of Ions in Gases;Wiley: New York, 1978.
(31) Greenfield, N. J. Nat. Protoc. 2006, 1, 2876–2890.(32) Perczel, A.; Park, K.; Fasman, G. D. Anal. Biochem. 1992, 203, 83–
93.(33) Sreerama, N.; Woody, R. W. Anal. Biochem. 1993, 209, 32–44.
(34) Case, D. A.; et al. AMBER 9; University of California: San Francisco,2006.
(35) Kollman, P.; Dixon, R.; Cornell, W.; Fox, T.; Chipot, C.; Pohorille,A. Computer Simulation of Biomolecular Systems: Theoretical andExperimental Applications; Kluwer: Dordrecht, 1997; pp 83-96.
(36) Ozkan, S. B.; Wu, G. A.; Chodera, J. D.; Dill, K. A. Proc. Natl. Acad.Sci. U.S.A. 2007, 104, 11987–11992. Shell, M. S.; Ritterson, R.; Dill,K. A. J. Phys. Chem. B 2008, 112, 6878–6886.
(37) Onufriev, A.; Bashford, D.; Case, D. A. Proteins: Struct., Funct.,Bioinf. 2004, 55, 383–394.
(38) Wu, C.; Murray, M. M.; Bernstein, S. L.; Condron, M. M.; Bitan, G.;Shea, J.-E.; Bowers, M. T. J. Mol. Biol. 2009, 387, 492–501.
(39) Ryckaert, J. P.; Ciccotti, G.; Berendsen, H. J. C. J. Comput. Phys.1977, 23, 327–341.
(40) Procacci, P.; Berne, B. J. Mol. Phys. 1994, 83, 255–272.(41) Berendsen, H. J. C.; Postma, J. P. M.; van Gunsteren, W. F.; Dinola,
A.; Haak, J. R. J. Chem. Phys. 1984, 81, 3684–3690.
VD ) KE (1)
td ) ta - t0 )l2T0
K0P0TPV
(2)
σ ) 1.3( z2E2T
µkBP2N2l2)1/2
(tA - t0) (3)
[θ] ) θlCNr
(4)
534 J. AM. CHEM. SOC. 9 VOL. 132, NO. 2, 2010
A R T I C L E S Grabenauer et al.

simulation time of 640.0 ns for each peptide. The replica trajectorieswere saved at 2.0 ps intervals for further analysis.
The STRIDE program of Frishman and Argos42 was used forsecondary structure assignment, and tertiary fold analysis wascarried out using the GROMACS clustering protocol,43 in whichpairwise rmsd (root mean square deviation) over CR atoms is usedas a similarity metric to classify structural families. For eachstructural family, the centroid (the structure having the largestnumber of neighboring structures within the rmsd cutoff of 2.5 Å)was selected as the representative structure of that structural family.The structural families were further merged into a super structuralfamily on the basis of fold topology. Collision cross sections ofthe representative structures were calculated using a trajectorymethod.44 To better correlate with the solvent-free experiments,solution-phase structures were converted to “dehydrated” structuresvia an energy minimization (500 000 steps) in a vacuum prior tothe cross section calculations. This generally reduces the overallsize of the structure, while maintaining solution structure features.
REMD simulations were used to generate both solvent-free andsolution-phase structures. Solvent-free structures were compareddirectly with experimental measurements, while solution-phasestructures were converted to dehydrated solution structures priorto comparison with experiment. The convergence of the REMDsimulations was rigorously verified by a block analysis. The totalsampling times of 200.0 ns for the solvated and 40.0 ns for thesolvent-free simulations at 300 K were equally divided into fourblocks, and the secondary structure and tertiary structure clusteringanalyses detailed above were performed for each block. For all sixsets of REMD simulations, good convergence was found duringthe last half of the simulations (see, for example, the data for thenormal peptide of PrP106-126 in Figure S5 of the SupportingInformation). The structural results presented in this paper werefrom the last half of the trajectory at 300 K (i.e., the last 100.0 nsof the solvated simulations and the last 20.0 ns of the solvent-freesimulations).
Results
The mass spectrum of the normal peptide in water is shownin Figure 1. The spectrum consists of a peak at 957 m/z for the+2 charge state and a peak at 638 m/z for the +3 charge state.(A peak near 1912 m/z for the +1 charge state is not observed.)The +2 charge state corresponds to the native state of the
peptide in which the two basic residues (K106 and K110) andboth the N and C termini are charged at the normal physiologicalcondition (pH ≈ 7.0), whereas the +3 charge state likely resultsfrom protonation of the C-terminus during the electrosprayionization process in the experiment, and thus, it is not the mainfocus of this study. Mass spectra for the control peptide (seethe Materials and Methods for the sequence) and the oxidizedpeptide are similar to that of the normal peptide in Figure 1and are presented in Supporting Information Figure S1.
ATDs for the +2 charge state of the normal and oxidizedpeptides are very similar to each other and are dominated by acompact family of structures with a drift time near 470 µs(Figure 2A; see Supporting Information Figure S2 for +3 chargestate data). Interestingly, a small amount of an extended familyof structures is also present with a drift time near 560 µs. Thisextended structural family is seen only in the normal andoxidized peptide samples, always with low intensity, but neverin control peptide samples. 13C isotope distributions of eachATD component obtained on a modified Q-Tof instrument45
(Supporting Information Figure S3) indicate that both of thesefeatures are due to monomeric forms of the peptides. ATDs forthe control peptide contain a single compact family of structures.Cross sections of the compact structures of the normal andoxidized peptides are very similar, with the +2 charge statehaving an average cross section around 370 Å2. The controlpeptide is somewhat larger, with the +2 charge state having anaverage cross section of 391 Å2. The extended families ofstructures of the normal and oxidized PrP106-126 peptides alsoappear to be very similarly sized. Cross sections for each peptideare summarized in Table 1.
The ability of the normal peptide to form fibrils in filteredHPLC water was confirmed by atomic force microscopy (AFM)of an 800 µM sample incubated at 30 °C for three days(Supporting Information Figure S4). To study the early oligo-merization behavior of these peptides, 20 µM samples wereincubated at room temperature for 72 h and monitored byIMS-MS. The ATD of the +2 charge state of the normalpeptide changes over time, while no changes are observed inATDs of the control and oxidized peptides over the same timeperiod (Figure 2). The +2 ATD for the fresh sample has adominant feature at 470 µs with an average cross section of371 Å2 and a much weaker extended feature near 560 µs withan average cross section of 466 Å2. After 24 h, Figure 2B, thereis a substantial reduction in the extended structure at 560 µsand a new feature is evident as a shoulder, at shorter time, ofthe dominant peak, near 425 µs. By 72 h, Figure 2C, almost allof the extended structure is depleted and a second new featurehas grown in near 390 µs. When the cross sections of thesenew features are calculated assuming they are compact con-formers of the monomer +2 charge state, values of 347 and302 Å2 are obtained. The latter value is much smaller than thoseof any monomeric structures generated by theory (SupportingInformation Figures S5 and S6). Consequently, the mostprobable explanation is that this is an oligomer. (Oligomers withthe same z/n value, where z ) charge and n ) oligomer order,always appear at shorter drift times than the monomer.46) Thisoligomer is most likely dominantly formed from the extended
(42) Frishman, D.; Argos, P. Proteins: Struct., Funct., Genet. 1995, 23,566–579.
(43) Daura, X.; Gademann, K.; Jaun, B.; Seebach, D.; van Gunsteren, W. F.;Mark, A. E. Angew. Chem., Int. Ed. 1999, 38, 236–240.
(44) Mesleh, M. F.; Hunter, J. M.; Shvartsburg, A. A.; Schatz, G. C.; Jarrold,M. F. J. Phys. Chem. 1996, 100, 1608216086. Shvartsburg, A. A.;Jarrold, M. F. Chem. Phys. Lett. 1996, 261, 86–91.
(45) Pringle, S. D.; Giles, K.; Wildgoose, J. L.; Williams, J. P.; Slade,S. E.; Thalassinos, K.; Bateman, R. H.; Bowers, M. T.; Scrivens, J. H.Int. J. Mass Spectrom. 2007, 261, 1–12.
(46) Bernstein, S. L.; Wyttenbach, T.; Baumketner, A.; Shea, J. E.; Bitan,G.; Teplow, D. B.; Bowers, M. T. J. Am. Chem. Soc. 2005, 127, 2075–2084.
Figure 1. Mass spectrum of normal PrP106-126 in water. The +2 chargestate has an m/z ratio of 957, and the +3 charge state has an m/z ratio of638.
J. AM. CHEM. SOC. 9 VOL. 132, NO. 2, 2010 535
PrP106-126 Oligomers Formed from �-Hairpins A R T I C L E S
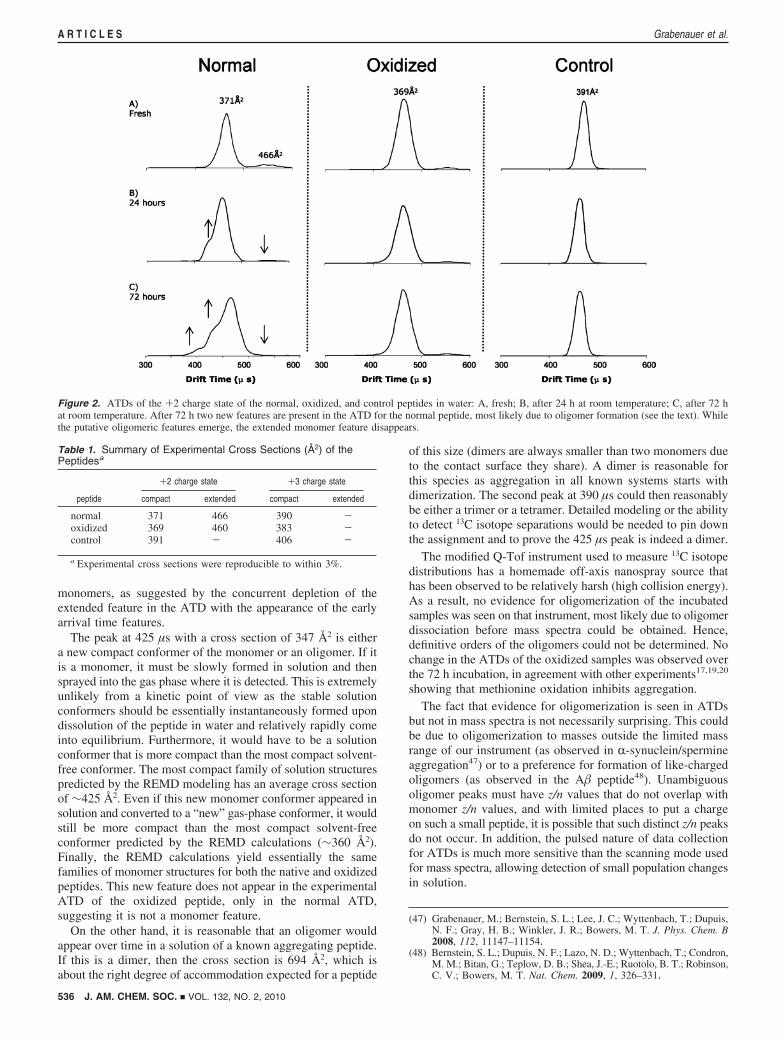
monomers, as suggested by the concurrent depletion of theextended feature in the ATD with the appearance of the earlyarrival time features.
The peak at 425 µs with a cross section of 347 Å2 is eithera new compact conformer of the monomer or an oligomer. If itis a monomer, it must be slowly formed in solution and thensprayed into the gas phase where it is detected. This is extremelyunlikely from a kinetic point of view as the stable solutionconformers should be essentially instantaneously formed upondissolution of the peptide in water and relatively rapidly comeinto equilibrium. Furthermore, it would have to be a solutionconformer that is more compact than the most compact solvent-free conformer. The most compact family of solution structurespredicted by the REMD modeling has an average cross sectionof ∼425 Å2. Even if this new monomer conformer appeared insolution and converted to a “new” gas-phase conformer, it wouldstill be more compact than the most compact solvent-freeconformer predicted by the REMD calculations (∼360 Å2).Finally, the REMD calculations yield essentially the samefamilies of monomer structures for both the native and oxidizedpeptides. This new feature does not appear in the experimentalATD of the oxidized peptide, only in the normal ATD,suggesting it is not a monomer feature.
On the other hand, it is reasonable that an oligomer wouldappear over time in a solution of a known aggregating peptide.If this is a dimer, then the cross section is 694 Å2, which isabout the right degree of accommodation expected for a peptide
of this size (dimers are always smaller than two monomers dueto the contact surface they share). A dimer is reasonable forthis species as aggregation in all known systems starts withdimerization. The second peak at 390 µs could then reasonablybe either a trimer or a tetramer. Detailed modeling or the abilityto detect 13C isotope separations would be needed to pin downthe assignment and to prove the 425 µs peak is indeed a dimer.
The modified Q-Tof instrument used to measure 13C isotopedistributions has a homemade off-axis nanospray source thathas been observed to be relatively harsh (high collision energy).As a result, no evidence for oligomerization of the incubatedsamples was seen on that instrument, most likely due to oligomerdissociation before mass spectra could be obtained. Hence,definitive orders of the oligomers could not be determined. Nochange in the ATDs of the oxidized samples was observed overthe 72 h incubation, in agreement with other experiments17,19,20
showing that methionine oxidation inhibits aggregation.The fact that evidence for oligomerization is seen in ATDs
but not in mass spectra is not necessarily surprising. This couldbe due to oligomerization to masses outside the limited massrange of our instrument (as observed in R-synuclein/spermineaggregation47) or to a preference for formation of like-chargedoligomers (as observed in the A� peptide48). Unambiguousoligomer peaks must have z/n values that do not overlap withmonomer z/n values, and with limited places to put a chargeon such a small peptide, it is possible that such distinct z/n peaksdo not occur. In addition, the pulsed nature of data collectionfor ATDs is much more sensitive than the scanning mode usedfor mass spectra, allowing detection of small population changesin solution.
(47) Grabenauer, M.; Bernstein, S. L.; Lee, J. C.; Wyttenbach, T.; Dupuis,N. F.; Gray, H. B.; Winkler, J. R.; Bowers, M. T. J. Phys. Chem. B2008, 112, 11147–11154.
(48) Bernstein, S. L.; Dupuis, N. F.; Lazo, N. D.; Wyttenbach, T.; Condron,M. M.; Bitan, G.; Teplow, D. B.; Shea, J.-E.; Ruotolo, B. T.; Robinson,C. V.; Bowers, M. T. Nat. Chem. 2009, 1, 326–331.
Figure 2. ATDs of the +2 charge state of the normal, oxidized, and control peptides in water: A, fresh; B, after 24 h at room temperature; C, after 72 hat room temperature. After 72 h two new features are present in the ATD for the normal peptide, most likely due to oligomer formation (see the text). Whilethe putative oligomeric features emerge, the extended monomer feature disappears.
Table 1. Summary of Experimental Cross Sections (Å2) of thePeptidesa
+2 charge state +3 charge state
peptide compact extended compact extended
normal 371 466 390 -oxidized 369 460 383 -control 391 - 406 -
a Experimental cross sections were reproducible to within 3%.
536 J. AM. CHEM. SOC. 9 VOL. 132, NO. 2, 2010
A R T I C L E S Grabenauer et al.

To explore the structural features linked to the aggregationof PrP106-126, molecular modeling was focused on the +2charge states of the peptides, as that is the expected charge stateof the peptide in physiological solution conditions and it wasthe only charge state for which evidence of aggregation wasseen experimentally. Calculated cross sections and representativestructures of super structural families from the simulations donein implicit solvent and under solvent-free conditions are shownin Figure 3 (the structural families in each superfamily are shownin Figures S5 and S6 of the Supporting Information). Solvent-free structures are smaller than solution-phase structures due toelevated electrostatic interactions in a vacuum (e.g., the dielectricconstant decreases to 1 in a vacuum from 78.5 in water solvent).
For the normal and oxidized peptides, simulations carried outunder solvent-free conditions produced structures with calculatedcross sections in good agreement with those of the compactfamilies of structures seen experimentally. Simulations inimplicit solvent produced more extended structures (�-hairpin)with larger cross sections more comparable to those of theextended features seen in the ion mobility experiments. Con-sequently, we assign the compact structures seen in the ATDsfor the normal and oxidized peptides as solvent-free structuresthat retain little to none of their original solution structuralproperties, while the larger families are dehydrated solutionstructures of �-hairpin. This shift to gas-phase structure is notunexpected as it has previously been shown that for some smallpeptides38 and DNA systems49 a significant loss of solutionstructure occurs upon transfer to the gas phase. ATDs for thecontrol peptide show only one, relatively compact, family ofstructures and on the basis of only comparison to the simulationdata, it is unclear whether they are solvent-free or solution-
phase structures. The experimental cross section (391 Å2) fallsbetween cross sections predicted from simulations for solvent-free (367 ( 12 Å2) and implicit solvent (421 ( 8 Å2) structures.However, the experimental value is closer to that of the solvent-free structures than that of the implicit solvent structures.
Since aggregation occurring in solution is most relevant tobiological systems, structure analysis was focused on thesolution simulations. The secondary structure propensities ofeach of the three peptides at 300 K are summarized in Figure4. The normal and oxidized peptides have very similar secondarystructure propensities of ∼50% �-sheet, ∼30% coil, ∼20% turn,and no R-helix. These two peptides adopt a �-hairpin-like fold.Stabilizing forces for the �-hairpin include main-chain hydrogenbonds, van der Waals interactions, hydrophobic interactionsbetween the four alanine residues in the turn region (Ala114-Ala115-Ala116-Ala117), hydrophobic interactions between twoalanine residues on opposite sides of the hairpin (Aal113-Ala120),and, in the normal peptide, hydrophobic interactions involvingthe two methionine residues (Met109-Leu125, Met112-Val12). Thesecondary structure of the control sequence is significantlydifferent from that of the other two peptides, having a reduced�-conformation propensity (40% vs ∼50%), an increasedR-helical conformation propensity (5% vs 0%), a slightlyincreased coiled conformation propensity (34% vs ∼30%), anda similar turn conformation propensity (20% vs 20%). Overall,the control sequence adopts a compact globular conformation.
To verify our REMD secondary structure predictions, wemeasured the CD spectrum of the normal peptide in water(Figure 5). To ensure a monomer-dominant solution, a 100 µMsolution, the lowest peptide concentration allowed by thesensitivity of the CD instrument, was prepared immediately priorto analysis. The populations of secondary structures obtainedfrom the CD data of the fresh solution are in excellent agreementwith our REMD-predicted values (Table 2). Over the course ofa 26 day room temperature incubation the �-sheet and �-turnpopulations increased slightly from ∼46% and ∼23% to ∼52%and ∼27%, respectively. We expect that after the 26 dayincubation some of the peptide was oligomerized, due to thehigher concentration (100 µM) and longer incubation time ofthis sample compared to the IMS-MS sample (20 µM) thatwas found to form oligomers after 3 days. Examination by AFMdid not reveal any fibrils however, indicating that the samplewas still in the early stages of aggregation. Therefore, the
(49) Baker, E. S.; Bowers, M. T. J. Am. Soc. Mass Spectrom. 2007, 18,1188–1195.
Figure 3. Representative peptide structure of a supercluster for each peptidefrom the REMD simulations in implicit solvent and under solvent-freeconditions at 300 K. The percentage of the population contained within thetop three clusters (see Figures S5 and S6 of the Supporting Information forthe structures) and average collision cross sections for each simulation areshown below the structures. R-Helical, �-sheet, turn, and coiled conforma-tions are colored in purple, yellow, cyan, and white, respectively.
Figure 4. Secondary structure abundance averaged from the equilibriumensemble (last 100 ns) at 300 K from the REMD simulations in implicitsolvent for the normal, oxidized, and control peptides of PrP106-126 inthe +2 charge state with unblocked termini. The mean standard error is∼1%, estimated from the block analysis.
J. AM. CHEM. SOC. 9 VOL. 132, NO. 2, 2010 537
PrP106-126 Oligomers Formed from �-Hairpins A R T I C L E S

increase of �-content over time suggests that these earlyoligomers have a high �-content, further supporting our proposalthat the early oligomers are formed from the association of�-hairpins.
For the normal and oxidized peptides, the abundance of�-hairpin seen in the IMS-MS experiments (∼5%, estimatedfrom the area of the extended feature shown in the ATD inFigure 2A) is much lower than the ∼50% abundance seen inthe simulations and in a circular dichroism spectrum of thenormal peptide in water, Figure 5 and Table 2. This differenceis most likely caused by the conversion of �-hairpin to a morecompact structure following solvent evaporation.
Discussion
PrP106-126 is an amyloidogenic peptide that is neurotoxicin vivo.15,16 Whereas the final products of the pathogenicaggregation are well characterized as �-sheet-rich amyloidfibrils, the structures of peptide monomers and early oligomer-ization states are poorly understood. It is generally believed thathighly ordered �-sheets are formed late in the aggregationprocess from the association of disordered monomers and smallaggregates, through a conformation transition to �-structure afterfibril nucleation.3 This belief is reinforced by a lack of well-defined monomeric �-structure for amyloid peptides in solutionas determined from CD and NMR. However, these techniquesonly reveal properties of the bulk solution and are limited tobeing able to measure average structures in such solutions.Theoretical studies have shown that a fragment of the amyloid-�peptide can adopt a �-hairpin-like fold in monomers and smalloligomers,4,5 suggesting that early ordered oligomers are nucle-ated from �-structure-rich monomers rather than unstructuredcoils. (We will refer to this as the “early conformation transition”mechanism.) This mechanism appears physically attractive sinceit does not involve a drastic structural transition after nucleationthat is energetically unfavorable (rearrangement of large dis-ordered aggregates at a late stage of amyloid fibril formationmust involve a significant free energy barrier), but it has not
been widely studied. Our observations of monomeric �-hairpinstructure by IMS-MS and REMD and the formation of earlyoligomers that correlate with loss of �-hairpin monomers providesupport for the early conformation transition mechanism, shownschematically in Figure 6. Our CD data confirm the secondarystructure predictions from REMD simulations, also supportingthe early conformation transition by showing that early oligo-merization of the peptide coincides with an increase in�-structural content.
In this study, oligomerization was seen in the normal peptideonly, not in the oxidized version or the control sequence.Oligomerization of the normal peptide was very reproducibleunder the conditions used in this study, with the appearance ofthe same new oligomeric features and simultaneous disappear-ance of the extended features seen in ATDs taken from samplesin water after 24 and 72 h at room temperature across multipletrials. These data strongly suggest that the new oligomers areformed from monomers having an extended conformation. Oursimulation data further suggest that the extended feature in theATDs corresponds to �-hairpin. In contrast, the ATDs for thetwo nonaggregating forms of the peptide (the oxidized versionand the control peptide) did not change over the same timeperiod.
Previous studies have shown that methionine oxidationinhibits the aggregation of PrP106-126.19,20 Our results areconsistent with the results of these studies. In contrast to thechanges observed in the ATD of the +2 charge state of thenormal peptide, the ATD for the +2 charge state of the oxidizedpeptide remains unchanged after 72 h of incubation, indicatingno oligomerization of the oxidized peptide. Our experimentaland simulation data both suggest the monomeric forms of the
Figure 5. CD spectra of normal PrP106-126 in water at room temperature.
Table 2. Secondary Structure of PrP106-126 in Water from the CD Experiment and the REMD Simulationa
secondary structure population (%)
R-helix �-sheet �-turn coil
fresh solution (water solvent) 0 ( 0.2 46 ( 1.0 23 ( 0.3 31 ( 0.5incubated for 26 days 0 ( 0.2 52 ( 1.1 27 ( 1.0 21 ( 0.5REMD simulation 0 ( 0.3 48 ( 5.0 20 ( 0.1 32 ( 0.3
a The error for REMD simulation is estimated from the block analysis (Figure S7, Supporting Information).
Figure 6. Proposed mechanism of PrP106-126 oligomer formationinvolving the assembly of ordered �-hairpin monomers, rather thandisordered monomers, to form ordered small aggregates.
538 J. AM. CHEM. SOC. 9 VOL. 132, NO. 2, 2010
A R T I C L E S Grabenauer et al.

two peptides have very similar secondary and tertiary structuralproperties. Therefore, the oxidation does not significantly changethe monomer structure, and the effect of the methionineoxidation on reducing the aggregation propensity most likelystems from reducing the hydrophobic interactions for interpep-tide association by converting the hydrophobic methionine sidechain to hydrophilic sulfoxide upon oxidation. In particular,without the extra hydrophobic interactions (Met109-Leu125 andMet112-Val121), the �-hairpin of the oxidized peptide may beless likely to form a long �-sheet. To the best of our knowledge,our present work provides the first direct evidence of thisinhibition mechanism due to methionine oxidation, which haspreviously been proposed by Binger et al.11 on the basis of theirmethionine-glutamine substitution study on human apolipo-protein C-II. This mechanism should also be applicable to otheramyloid peptides having methionine residues.
The normal and oxidized peptides adopt a �-hairpin-like foldthat is stabilized by multiple hydrophobic interactions along withmain chain hydrogen bonds and van der Waals interactions. Thehydrophobic interactions are critical for stabilizing the �-hairpinstructure, as indicated by a reduction of the �-hairpin populationwhen solvent water molecules are removed from the peptides(Figure 2). These intrapeptide hydrophobic clusters are alsoexpected to play an important role in interpeptide interactionsfor forming long �-sheets and eventually amyloid fibrils. Inaddition, the turn region of these �-hairpins is centered nearthe palindromic portion of the sequence, AGAAAAGA. Modi-fications in this region have been shown to have dramatic effectson the neurotoxicity and secondary structure properties ofPrP106-126,50 possibly because an interruption in this portionof the sequence may prevent the formation of a hairpin-like
fold. Intriguingly, the �-hairpin-like fold is seen in fragmentsof the amyloid-� peptide4,51 responsible for Alzheimer’s diseaseand has very recently been identified in the islet amyloidpolypeptide (IAPP) responsible for diabetes type II.52
The control peptide has quite different secondary and tertiarystructural properties compared to the normal and oxidizedpeptides. The control peptide has less �-sheet than the normalpeptide and greater R-helical and random coil structuralcomponents. Unlike oxidation, which appears to inhibit ag-gregation by mediating interpeptide interactions, these structuraldifferences at the monomeric level are most likely responsiblefor the lack of observed aggregation of the control peptide.
Acknowledgment. We thankfully acknowledge Dr. Peter Hee-gaard for supplying the PrP106-126 samples. The support of theDepartment of Environment Food and Rural Affairs, U.K. (M.T.B.),the David and Lucile Packard Foundation (J.-E.S.), and NationalScience Foundation Grants CHE-0909743 (M.T.B.) and MCB-0642088 (J.-E.S.) is gratefully acknowledged. Simulations wereperformed on the Lonestar cluster at the Texas Advanced Comput-ing Center (Grant LRAC MCA05S027 to J.-E.S.). This work madeuse of MRL Central Facilities supported by the MRSEC Programof the National Science Foundation under Award No. DMR05-20415.
Supporting Information Available: Mass spectra of controland oxidized peptides, ATD comparison of the oxidized peakin the normal sample and the oxidized sample, ATD data forthe +3 charge state of all peptides, 13C isotope distributions ofthe two features in the normal sample +2 charge state ATD,AFM image of PrP106-126 fibrils, representative structures,relative abundances, and cross sections of the top three clustersfrom the REMD simulations in vacuum and implicit solvent,convergence check of the REMD simulations, and complete ref34. This material is available free of charge via the Internet athttp://pubs.acs.org.
JA905595K
(50) Jobling, M. F.; Stewart, L. R.; White, A. R.; McLean, C.; Friedhuber,A.; Maher, F.; Beyreuther, K.; Masters, C. L.; Barrow, C. J.; Collins,S. J.; Cappai, R. J. Neurochem. 1999, 73, 1557–1565. Brown, D. R.Mol. Cell. Neurosci. 2000, 15, 66–78.
(51) Han, W.; Wu, Y. D. J. Am. Chem. Soc. 2005, 127, 15408–15416.(52) Dupuis, N. F.; Wu, C.; Shea, J.-E.; Bowers, M. T. J. Am. Chem. Soc.,
in press.
J. AM. CHEM. SOC. 9 VOL. 132, NO. 2, 2010 539
PrP106-126 Oligomers Formed from �-Hairpins A R T I C L E S