oleps - the official web site for the state of new … new jersey office of the attorney general •...
TRANSCRIPT
OLEPS
New Jersey Office of the Attorney General • Jeffrey S. Chiesa, Attorney General
Office of Law Enforcement Professional Standards • Christina M. Glogoff, Director
OFFICE OF LAW ENFORCEMENT PROFESSIONAL STANDARDS
October 2012
The Effects of Peña-Flores on Municipal Police Departments

OLEPS Municipal Police Department Report October 2012
Page i Office of Law Enforcement Professional Standards
Table of Contents
Page Introduction 1
Survey Methods and Data 2 Phase I 2 Phase II 4 Final Sample 6 Results 9 Motor Vehicle Stops 9 Consent to Search Requests Granted 13 Consent to Search Requests Denied 16 Vehicles Towed 18 Search Warrant Requests 21 Automobile Exception Searches 24
Study Limitations 27 Conclusion 28
Appendix One: Phase I Survey 30 Appendix Two: Department Data 34
OLEPS Municipal Police Department Report October 2012
Page 1 of 54 Office of Law Enforcement Professional Standards
THE EFFECTS OF PEÑA-FLORES ON MUNICIPAL POLICE DEPARTMENTS
OFFICE OF LAW ENFORCEMENT PROFESSIONAL STANDARDS Introduction
Many law enforcement officials believe that State v. Peña-Flores, 198 N.J. 6 (2009),1 had the practical effect of altering the requirements for searches in relation to automobile stops. This decision explained the level of exigent circumstances needed to conduct a search under the automobile exception rule. In response to this decision, the New Jersey State Police (State Police) amended its policies and procedures governing motor vehicle stops to discourage troopers from using the automobile exception in situations where troopers had previously relied upon that exception to the warrant requirement. In the wake of this change, the State Police experienced a surge in the number of consent searches where probable cause existed, while the number of consent searches based upon the lower “reasonable articulable suspicion” standard required by State v. Carty, 170 N.J. 632 (2002), remained very small. The use of probable cause-based consent searches in lieu of the automobile exception transformed the overall appearance of State Police activity. However, it remains to be seen how the Peña-Flores decision impacted municipal and specialized police departments in the State of New Jersey, as data from these departments have not been available. Using a sample of municipal departments, this report details the volume of and trends in police activity across the State. Specifically, this report comments on the effects of the Pena-Flores decision on post stop enforcement activities. Pursuant to a New Jersey Supreme Court Order in a case in which the State had asked the Court to overturn Peña-Flores, State v. Shannon, 210 N.J. 225 (2012), the Office of Law Enforcement Professional Standards (OLEPS) was tasked with collecting data that might capture the effects of Peña-Flores on policing. The Court’s Order specifically requested data on “(a) the total number of motor vehicle stops, (b) the number of warrantless probable cause searches conducted, consent searches requested, consent searches conducted, and vehicles impounded – both before and after Peña-Flores – and (c) other relevant information.” 210 N.J. at 227-228. OLEPS has collected the requested data, to the extent that they are available. This report outlines the research methods employed in data collection, a description of the data, and the results of the survey.
1 State v. Peña-Flores, 198 N.J. 6 (2009), is hereafter referred to as Peña-Flores. This decision served to further define the exigent circumstances under which a search of a vehicle could be conducted without securing a search warrant under the automobile exception when there was probable cause to believe that a crime had been (or will be) committed.
OLEPS Municipal Police Department Report October 2012
Page 2 of 54 Office of Law Enforcement Professional Standards
Survey Methods and Data
There are approximately 550 law enforcement departments/agencies in New Jersey. The majority of these departments are municipal departments, 42 are county agencies, 19 are college/university departments, and 12 are specialty agencies (i.e., park police, fish and wildlife, human services, etc.). Geographically, Bergen County and Monmouth County have the highest concentration of law enforcement agencies; 13.07% of all New Jersey police agencies are in Bergen County and 8.71% are in Monmouth County. Along with the State Police, these 550 agencies are responsible for maintaining general order in the State. However, the nature of policing activities differs from department to department. For example, the State Police primarily handle motor vehicle stops, while other departments in New Jersey may perform more order maintenance policing. Regardless of policing activities, Peña-Flores should have had an impact on all departments in the State. Phase I
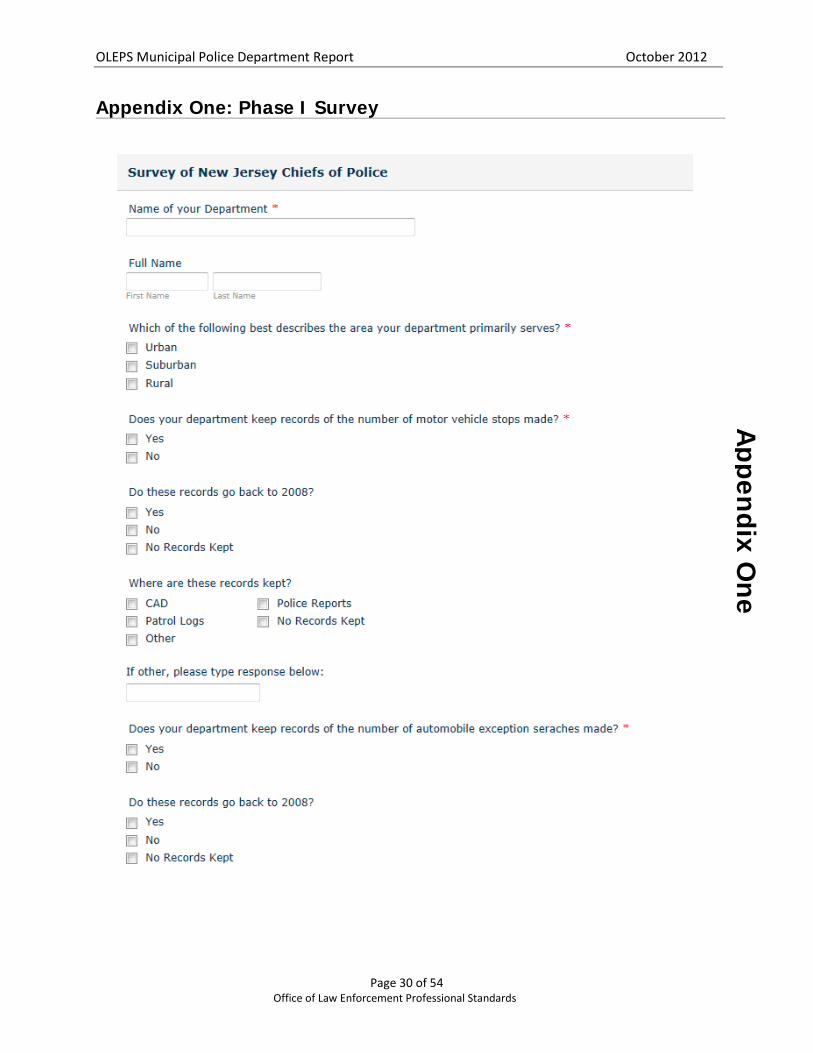
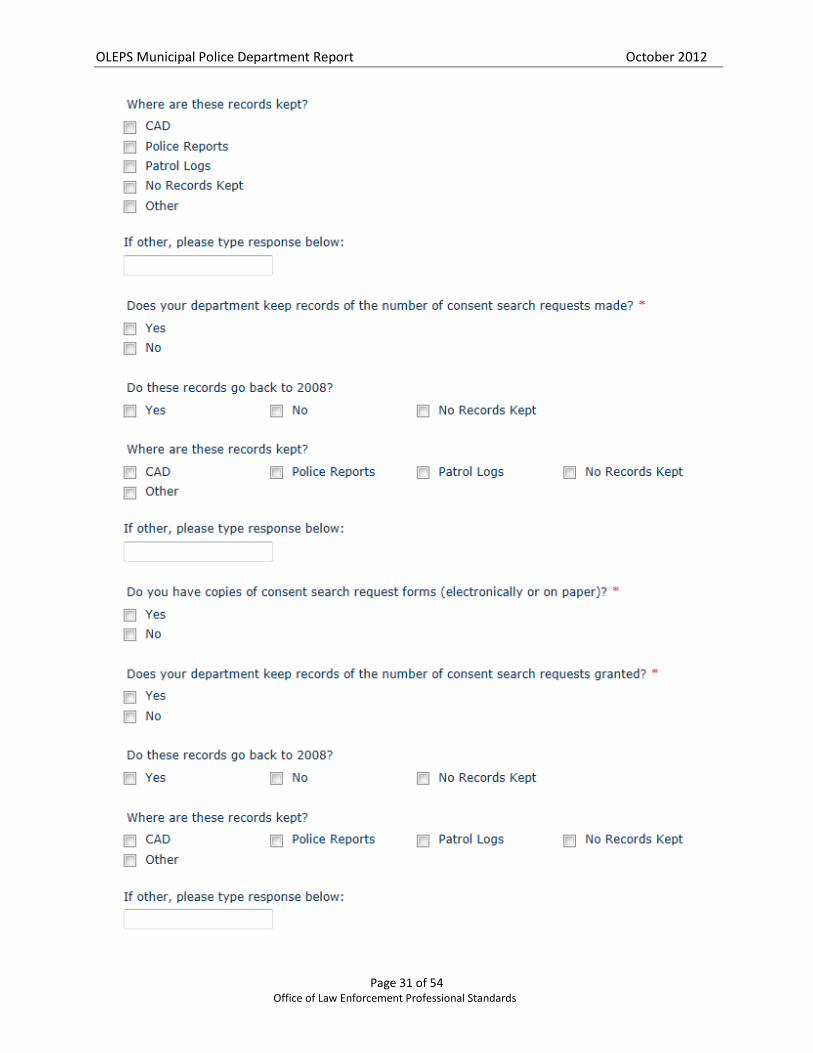
This report utilizes a sample of motor vehicle stop data from law enforcement agencies in New Jersey. Any police department in the State of New Jersey was deemed an eligible participant for this survey. This includes municipal departments, county departments, university/college departments, and other specialized departments (i.e., park police). To obtain the aforementioned motor vehicle stop data, it was necessary to first gain an understanding of how municipal police departments maintained their records. The State Police maintains an extremely thorough and detailed record of all trooper activity in several databases and data management systems. These systems were costly and took several years to implement and develop. The likelihood that municipal and other police agencies in the State have systems capable of similar data management is low. The possibility also exists that some municipal departments may not even have an electronic records management system, opting to use paper records. Because of the potential for disparity in records management, and the understanding that the State Police’s data collection and management is likely unparalleled, OLEPS conducted a preliminary survey to determine where and how motor vehicle stop records are maintained. Procedure In order to reach as many departments as possible, the preliminary survey was sent to the Chiefs/Directors of police departments by the New Jersey State Association of Chiefs of Police (NJSACOP) and by county prosecutors. The survey was e-mailed with a brief letter: explaining the purpose of the survey; providing potential respondents a link to the survey; indicating that all responses are confidential; and providing the name of the appropriate contact at OLEPS should questions or concerns arise. The survey questionnaire was posted online on an Office of the Attorney General website. The questionnaire (Appendix One) asked each department to indicate whether and how records on a number of police activities were stored. These activities included the total number of motor vehicle stops, the number of consent search requests granted, the number of consent searches denied, the number of vehicles towed in connection with an automobile stop, the number of
Survey M
ethods and D
ata
OLEPS Municipal Police Department Report October 2012
Page 3 of 54 Office of Law Enforcement Professional Standards
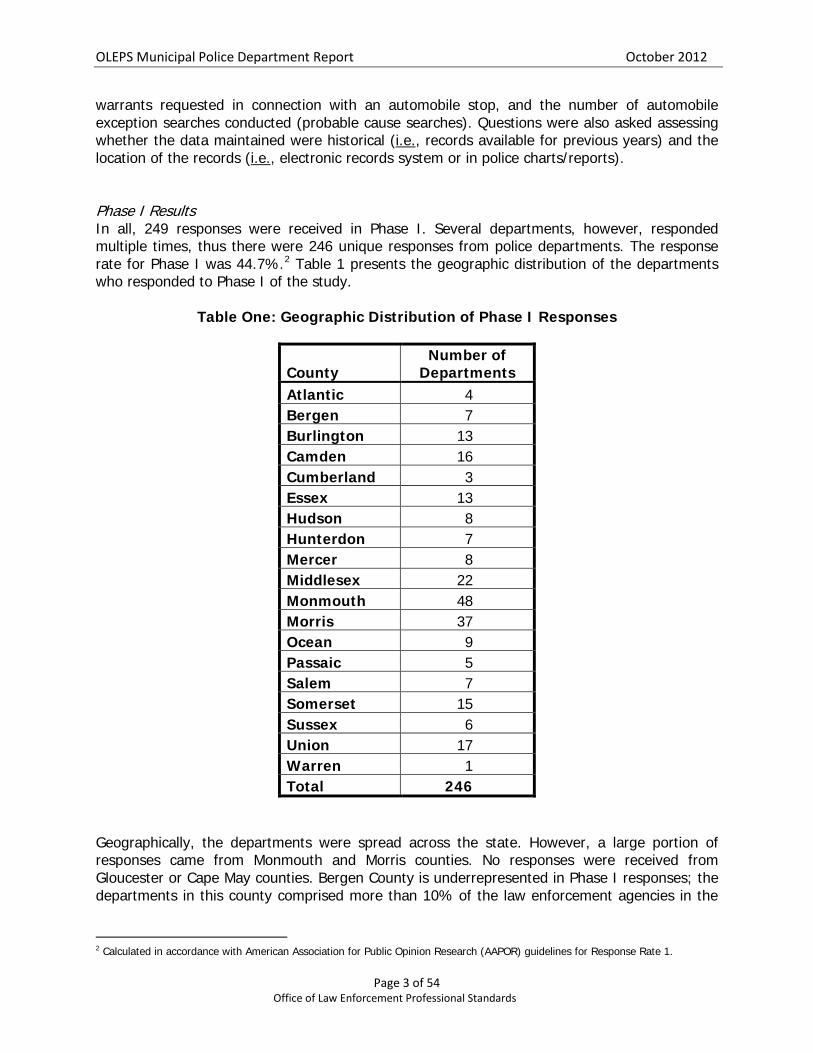
warrants requested in connection with an automobile stop, and the number of automobile exception searches conducted (probable cause searches). Questions were also asked assessing whether the data maintained were historical (i.e., records available for previous years) and the location of the records (i.e., electronic records system or in police charts/reports). Phase I Results In all, 249 responses were received in Phase I. Several departments, however, responded multiple times, thus there were 246 unique responses from police departments. The response rate for Phase I was 44.7%.2 Table 1 presents the geographic distribution of the departments who responded to Phase I of the study.
Table One: Geographic Distribution of Phase I Responses
County Number of
Departments Atlantic 4 Bergen 7 Burlington 13 Camden 16 Cumberland 3 Essex 13 Hudson 8 Hunterdon 7 Mercer 8 Middlesex 22 Monmouth 48 Morris 37 Ocean 9 Passaic 5 Salem 7 Somerset 15 Sussex 6 Union 17 Warren 1 Total 246
Geographically, the departments were spread across the state. However, a large portion of responses came from Monmouth and Morris counties. No responses were received from Gloucester or Cape May counties. Bergen County is underrepresented in Phase I responses; the departments in this county comprised more than 10% of the law enforcement agencies in the
2 Calculated in accordance with American Association for Public Opinion Research (AAPOR) guidelines for Response Rate 1.
OLEPS Municipal Police Department Report October 2012
Page 4 of 54 Office of Law Enforcement Professional Standards
state, but less than 2% of those who responded. Overall, the departments that responded to the questionnaire represent approximately 44% of all police departments in New Jersey. Phase II
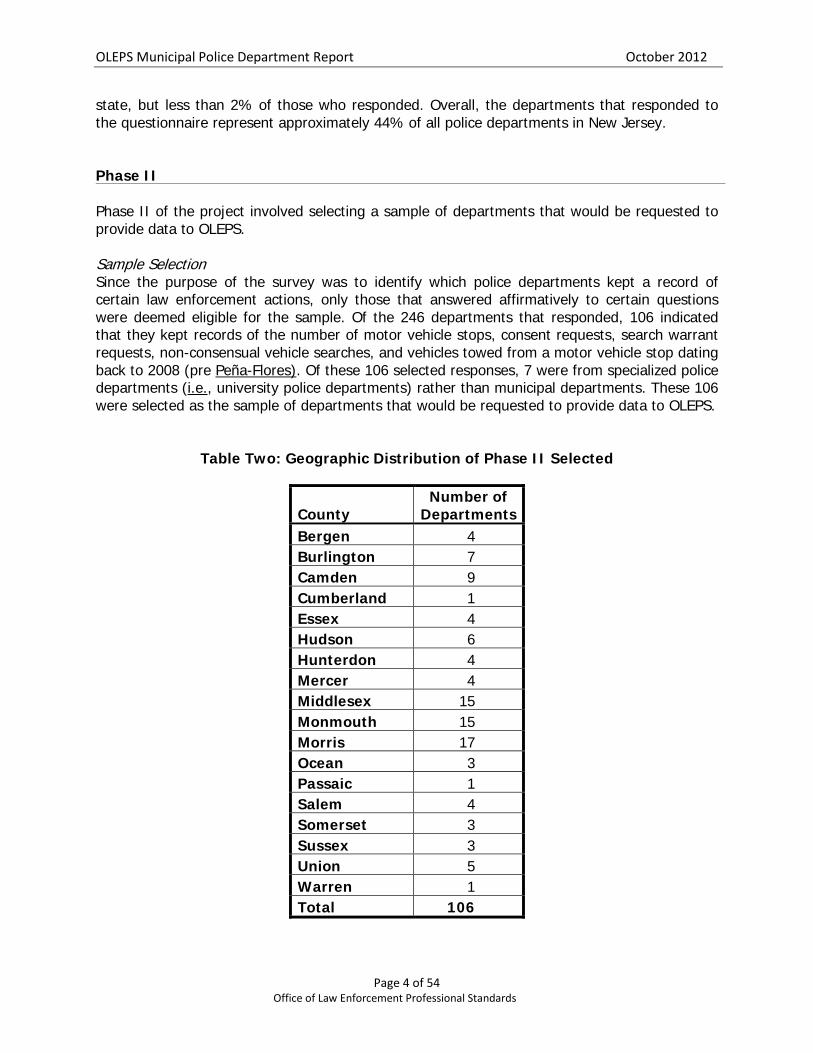
Phase II of the project involved selecting a sample of departments that would be requested to provide data to OLEPS. Sample Selection Since the purpose of the survey was to identify which police departments kept a record of certain law enforcement actions, only those that answered affirmatively to certain questions were deemed eligible for the sample. Of the 246 departments that responded, 106 indicated that they kept records of the number of motor vehicle stops, consent requests, search warrant requests, non-consensual vehicle searches, and vehicles towed from a motor vehicle stop dating back to 2008 (pre Peña-Flores). Of these 106 selected responses, 7 were from specialized police departments (i.e., university police departments) rather than municipal departments. These 106 were selected as the sample of departments that would be requested to provide data to OLEPS.
Table Two: Geographic Distribution of Phase II Selected
County Number of
Departments Bergen 4 Burlington 7 Camden 9 Cumberland 1 Essex 4 Hudson 6 Hunterdon 4 Mercer 4 Middlesex 15 Monmouth 15 Morris 17 Ocean 3 Passaic 1 Salem 4 Somerset 3 Sussex 3 Union 5 Warren 1 Total 106
OLEPS Municipal Police Department Report October 2012
Page 5 of 54 Office of Law Enforcement Professional Standards
This sample mirrors the geographic distribution of the overall responses. The selected departments are clustered in Middlesex, Monmouth, and Morris counties and there is no representation from Cape May, Gloucester, and Atlantic counties. Sample Time Frame In order to truly understand the effects of Peña-Flores, it was necessary to review data for at least a year after the decision, to ensure that all police departments had an appropriate amount of time to create policies in line with the ruling, to learn the policies, and to implement them. This would then require data from 2008 until at least 2010 or 2011. Requesting two or three years of data might seem reasonable, however, police departments in New Jersey have disparate levels of traffic enforcement. While it might be reasonable to request a full year of data from one department, a larger department might have difficulty finding the resources (personnel) to provide those data. Additionally, municipal departments do not necessarily maintain the same level of detail in their general records as the State Police. To provide the information requested, many departments had to read through all reports and documents generated for a motor vehicle stop. Again, while this would be a simple task for a small department, a larger department with 12,000 stops a year would not be able to accommodate such a request. As such, data on motor vehicle stops were requested for a one month period in April. April was chosen for several reasons. First, April is generally a warm month, the likelihood of winter weather conditions is fairly low, which would affect the nature of policing. Second, the data collection for this study began in May, choosing a week prior to the current day in the year, allowed OLEPS to capture data for the current year. Third, while in some years this month may correspond to “Spring Break,” which might affect the number of cars on the road, the driver population should remain relatively stable. By contrast, choosing summer months could provide a completely different picture of motor vehicle stops for some towns (i.e., beach towns). The official data period for this study is the entire month of April. In order to see any potential trends, data were requested for this month in 2008, 2009, 2010, 2011, and 2012 (if available). Procedure All departments in the sample were contacted and asked to provide the name and contact information for the individual within the department who would be likely to provide the data and be the most knowledgeable about the data. In most departments, this was the Chief or Director. However, there were some departments that immediately provided the name and contact information of the individual who worked in the records department and was most familiar with the CAD system or other database. OLEPS e-mailed each department a formal request for data and allowed each department 30 days to provide the data. Once the formal request for data was forwarded, OLEPS confirmed with each department by phone that it received the data request. As the deadline for the data drew near, departments that had not yet returned data to OLEPS were contacted and reminded of the deadline. Throughout the data collection period, OLEPS maintained regular contact with many departments. Several departments contacted OLEPS with questions or concerns about providing the data. OLEPS worked with these departments in determining the appropriate data to provide.
OLEPS Municipal Police Department Report October 2012
Page 6 of 54 Office of Law Enforcement Professional Standards
In some cases, this required OLEPS to travel to police departments to read through files and count the number of motor vehicle stops and activities. Final Sample
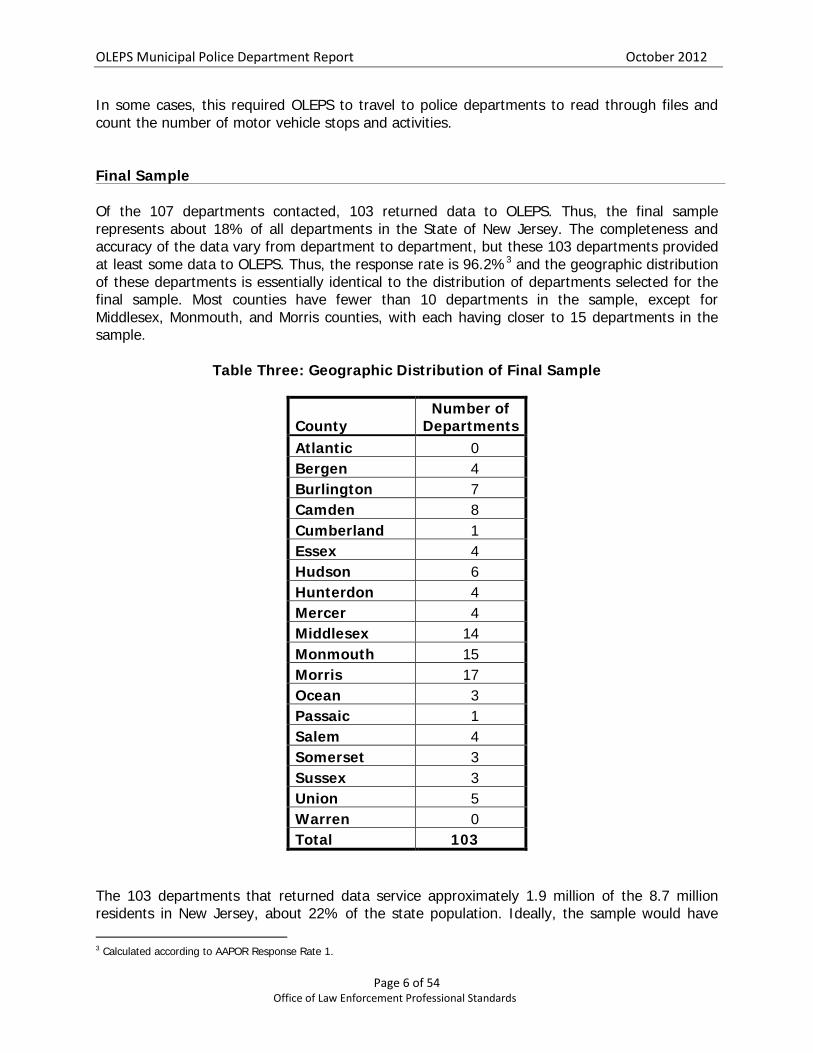
Of the 107 departments contacted, 103 returned data to OLEPS. Thus, the final sample represents about 18% of all departments in the State of New Jersey. The completeness and accuracy of the data vary from department to department, but these 103 departments provided at least some data to OLEPS. Thus, the response rate is 96.2%3 and the geographic distribution of these departments is essentially identical to the distribution of departments selected for the final sample. Most counties have fewer than 10 departments in the sample, except for Middlesex, Monmouth, and Morris counties, with each having closer to 15 departments in the sample.
Table Three: Geographic Distribution of Final Sample
County Number of
Departments Atlantic 0 Bergen 4 Burlington 7 Camden 8 Cumberland 1 Essex 4 Hudson 6 Hunterdon 4 Mercer 4 Middlesex 14 Monmouth 15 Morris 17 Ocean 3 Passaic 1 Salem 4 Somerset 3 Sussex 3 Union 5 Warren 0 Total 103
The 103 departments that returned data service approximately 1.9 million of the 8.7 million residents in New Jersey, about 22% of the state population. Ideally, the sample would have 3 Calculated according to AAPOR Response Rate 1.
OLEPS Municipal Police Department Report October 2012
Page 7 of 54 Office of Law Enforcement Professional Standards
encompassed a larger portion of the state, but the sample size was restricted due to data availability. On average, each department serves 19,553 residents of New Jersey. However, some departments serve areas as small as 699 residents and others as large as 98,576 residents. Since departments vary in the number of residents served, the number of law enforcement officers in each department also varies. This characteristic can have a large impact on the number of activities conducted by a department. A department with 100 officers can conduct many more motor vehicle stops than a department with 20 officers. In the final sample, departments ranged in size from two to 3404 law enforcement employees, with an average of 52 employees in 2010. These numbers include all individuals employed by the department, both sworn law enforcement and citizens. The total number of sworn law enforcement officers ranged from two to 226, with an average of 43 sworn officers. In contrast, the State Police employed 4,233 employees in 2010, 2,936 of whom were officers. Urban v. Rural Compiled by the State Police, the Uniform Crime Report classifies municipalities in the State of New Jersey as “rural,” “suburban,” or “urban center.” These classifications were “compiled by the Department of Community Affairs, Division of State and Regional Planning, [and the] Bureau of Statewide Planning.” The definitions of each classification are:
• Urban center Densely populated with extensive development. • Suburban Predominantly single family residential, within a short distance of an urban area. • Rural Scattered small communities and isolated single family dwellings.
These categorizations are based solely on the number of residents, density, and the area of municipality. As such, there are some areas classified by the UCR as “urban center” that may not typically be thought of as urban. While sandwiched between two major metropolitan areas, New York City and Philadelphia, New Jersey does have some areas that are identified as “major urban”5 areas. Moreover, the municipalities in New Jersey known as the “Urban 15”6 are those areas which are defined as the most urban based on population and density characteristics. Of these areas, only four were selected for the final sample. Interestingly, most of the areas defined as “major urban” or the “Urban 15” did not respond to the Phase I survey. The lack of response from urban departments may result from the type of policing in these areas. Generally, policing in urban areas does not involve many motor vehicle stops compared to other enforcement activities and to other municipal departments in the state.
4 The number of police employees was taken from the 2010 Uniform Crime Report, the most recent year available. Uniform Crime Report,2010, available at http://www.fbi.gov/about-us/cjis/ucr/crime-in-the-u.s/2010/crime-in-the-u.s.-2010/offenses-known-to-law-enforcement. 5 Camden City, Elizabeth City, Jersey City, Newark City, Paterson City, and Trenton City. 6 The Urban 15 are: Bayonne City, Camden City, Clifton City, Toms River Township. East Orange City, Elizabeth City, Irvington Town, Jersey City, Newark City, Passaic City, Paterson City, Trenton City, Union City, Vineland City, and Woodbridge Township.
OLEPS Municipal Police Department Report October 2012
Page 8 of 54 Office of Law Enforcement Professional Standards
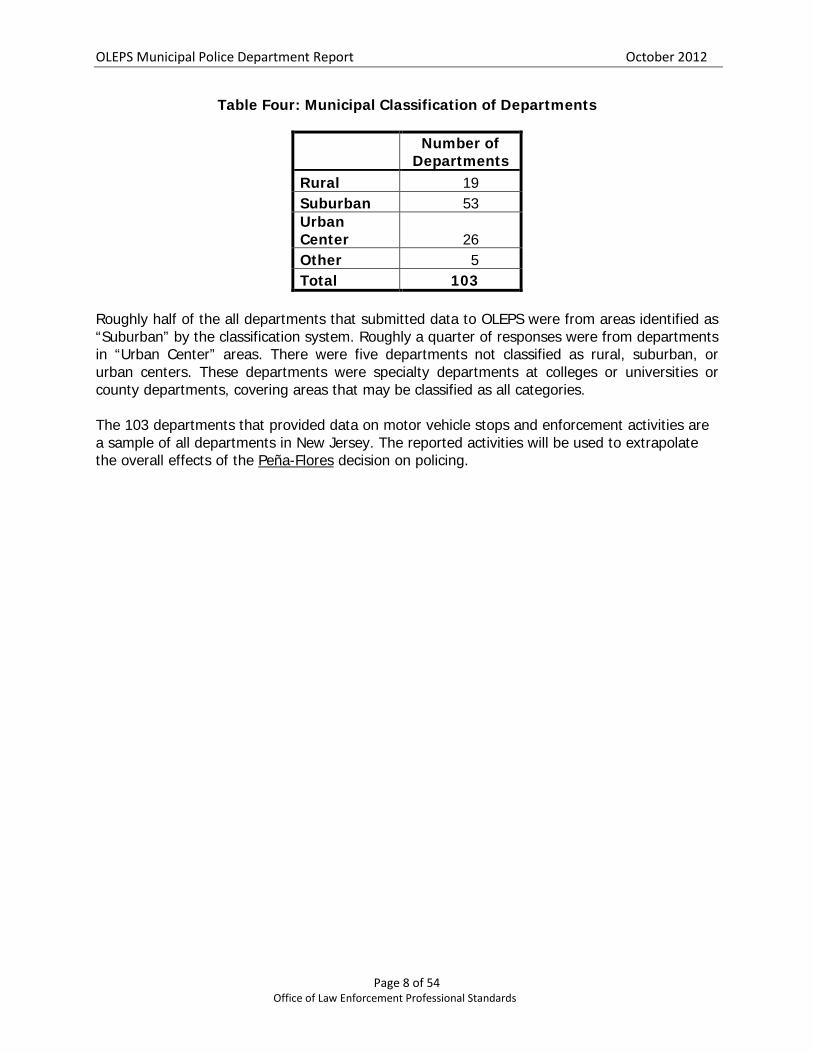
Table Four: Municipal Classification of Departments
Number of Departments
Rural 19 Suburban 53 Urban Center 26 Other 5 Total 103
Roughly half of the all departments that submitted data to OLEPS were from areas identified as “Suburban” by the classification system. Roughly a quarter of responses were from departments in “Urban Center” areas. There were five departments not classified as rural, suburban, or urban centers. These departments were specialty departments at colleges or universities or county departments, covering areas that may be classified as all categories. The 103 departments that provided data on motor vehicle stops and enforcement activities are a sample of all departments in New Jersey. The reported activities will be used to extrapolate the overall effects of the Peña-Flores decision on policing.
OLEPS Municipal Police Department Report October 2012
Page 9 of 54 Office of Law Enforcement Professional Standards
Results
Each enforcement activity requested by the Court is covered in the sections that follow. Results are presented for the overall volume of municipal departments and the State Police, by municipal urban classifications, and by county.7 Motor Vehicle Stops
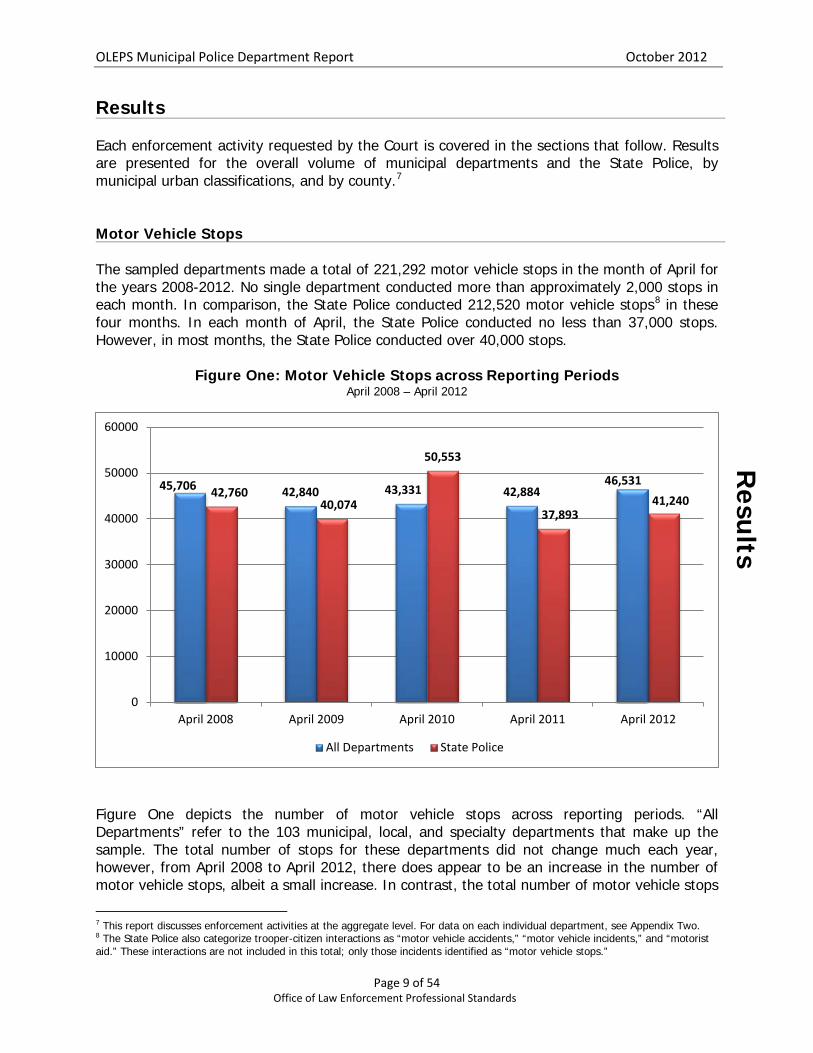
The sampled departments made a total of 221,292 motor vehicle stops in the month of April for the years 2008-2012. No single department conducted more than approximately 2,000 stops in each month. In comparison, the State Police conducted 212,520 motor vehicle stops8 in these four months. In each month of April, the State Police conducted no less than 37,000 stops. However, in most months, the State Police conducted over 40,000 stops.
Figure One: Motor Vehicle Stops across Reporting Periods April 2008 – April 2012
Figure One depicts the number of motor vehicle stops across reporting periods. “All Departments” refer to the 103 municipal, local, and specialty departments that make up the sample. The total number of stops for these departments did not change much each year, however, from April 2008 to April 2012, there does appear to be an increase in the number of motor vehicle stops, albeit a small increase. In contrast, the total number of motor vehicle stops
7 This report discusses enforcement activities at the aggregate level. For data on each individual department, see Appendix Two. 8 The State Police also categorize trooper-citizen interactions as “motor vehicle accidents,” “motor vehicle incidents,” and “motorist aid.” These interactions are not included in this total; only those incidents identified as “motor vehicle stops.”
45,706 42,840 43,331 42,884 46,531
42,760 40,074
50,553
37,893 41,240
0
10000
20000
30000
40000
50000
60000
April 2008 April 2009 April 2010 April 2011 April 2012
All Departments State Police
Resu
lts
OLEPS Municipal Police Department Report October 2012
Page 10 of 54 Office of Law Enforcement Professional Standards
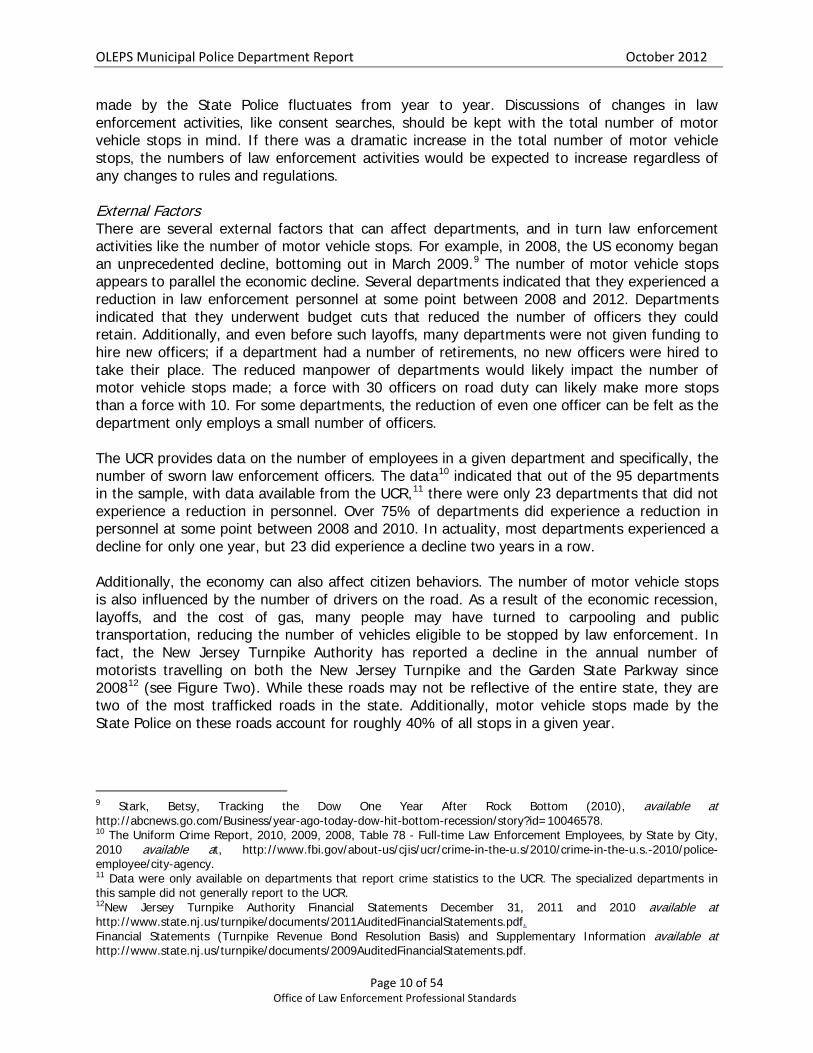
made by the State Police fluctuates from year to year. Discussions of changes in law enforcement activities, like consent searches, should be kept with the total number of motor vehicle stops in mind. If there was a dramatic increase in the total number of motor vehicle stops, the numbers of law enforcement activities would be expected to increase regardless of any changes to rules and regulations. External Factors There are several external factors that can affect departments, and in turn law enforcement activities like the number of motor vehicle stops. For example, in 2008, the US economy began an unprecedented decline, bottoming out in March 2009.9 The number of motor vehicle stops appears to parallel the economic decline. Several departments indicated that they experienced a reduction in law enforcement personnel at some point between 2008 and 2012. Departments indicated that they underwent budget cuts that reduced the number of officers they could retain. Additionally, and even before such layoffs, many departments were not given funding to hire new officers; if a department had a number of retirements, no new officers were hired to take their place. The reduced manpower of departments would likely impact the number of motor vehicle stops made; a force with 30 officers on road duty can likely make more stops than a force with 10. For some departments, the reduction of even one officer can be felt as the department only employs a small number of officers. The UCR provides data on the number of employees in a given department and specifically, the number of sworn law enforcement officers. The data10 indicated that out of the 95 departments in the sample, with data available from the UCR,11 there were only 23 departments that did not experience a reduction in personnel. Over 75% of departments did experience a reduction in personnel at some point between 2008 and 2010. In actuality, most departments experienced a decline for only one year, but 23 did experience a decline two years in a row. Additionally, the economy can also affect citizen behaviors. The number of motor vehicle stops is also influenced by the number of drivers on the road. As a result of the economic recession, layoffs, and the cost of gas, many people may have turned to carpooling and public transportation, reducing the number of vehicles eligible to be stopped by law enforcement. In fact, the New Jersey Turnpike Authority has reported a decline in the annual number of motorists travelling on both the New Jersey Turnpike and the Garden State Parkway since 200812 (see Figure Two). While these roads may not be reflective of the entire state, they are two of the most trafficked roads in the state. Additionally, motor vehicle stops made by the State Police on these roads account for roughly 40% of all stops in a given year.
9 Stark, Betsy, Tracking the Dow One Year After Rock Bottom (2010), available at http://abcnews.go.com/Business/year-ago-today-dow-hit-bottom-recession/story?id=10046578. 10 The Uniform Crime Report, 2010, 2009, 2008, Table 78 - Full-time Law Enforcement Employees, by State by City, 2010 available at, http://www.fbi.gov/about-us/cjis/ucr/crime-in-the-u.s/2010/crime-in-the-u.s.-2010/police-employee/city-agency. 11 Data were only available on departments that report crime statistics to the UCR. The specialized departments in this sample did not generally report to the UCR. 12New Jersey Turnpike Authority Financial Statements December 31, 2011 and 2010 available at http://www.state.nj.us/turnpike/documents/2011AuditedFinancialStatements.pdf. Financial Statements (Turnpike Revenue Bond Resolution Basis) and Supplementary Information available at http://www.state.nj.us/turnpike/documents/2009AuditedFinancialStatements.pdf.
OLEPS Municipal Police Department Report October 2012
Page 11 of 54 Office of Law Enforcement Professional Standards
Figure Two: Reported Number of Motor Vehicles 2008- 2011
Policing activities can vary dramatically based on location. Policing in urban areas generally involves fewer motor vehicle stops than suburban areas since suburban and rural areas tend to have roads with less traffic and congestion. Additionally, urban areas may involve more foot patrols increasing contact between individual officers and citizens. Generally, the departments identified by the UCR as suburban conducted the most stops, roughly half of those for a given month. Rural departments had the fewest motor vehicle stops conducted while urban areas had slightly more than rural but less than suburban departments. In contrast, the State Police primarily patrol areas that would not be classified as urban. While the State Police do have a strong presence in some urban areas (i.e., Camden and Irvington), it is also the primary law enforcement agency on several heavily trafficked roadways in the state.
Table Five: Motor Vehicle Stops by Municipal Classification April 2008 – April 2012
Motor Vehicle Stops 2008 2009 2010 2011 2012 Total All Departments 45,706 42,840 43,331 42,884 46,531 221,292
Rural 7,865 6,797 7,439 7,076 7,724 36,901 Suburban 24,752 23,695 23,406 22,516 26,400 120,769 Urban 11,903 11,310 11,793 12,586 11,655 59,247
State Police 42,760 40,074 50,553 37,893 41,240 212,520
409 398
384 379
245 236 237 235
150
200
250
300
350
400
450
2008 2009 2010 2011
Mill
ions
Garden State Parkway NJ Turnpike
OLEPS Municipal Police Department Report October 2012
Page 12 of 54 Office of Law Enforcement Professional Standards
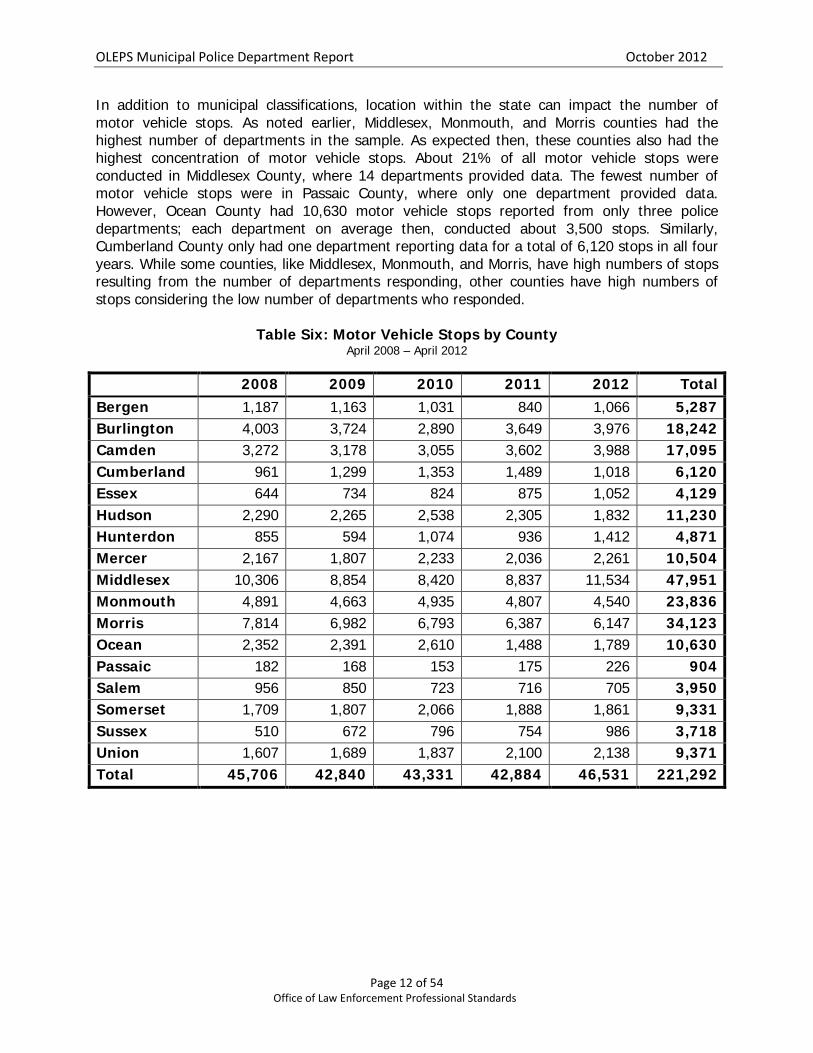
In addition to municipal classifications, location within the state can impact the number of motor vehicle stops. As noted earlier, Middlesex, Monmouth, and Morris counties had the highest number of departments in the sample. As expected then, these counties also had the highest concentration of motor vehicle stops. About 21% of all motor vehicle stops were conducted in Middlesex County, where 14 departments provided data. The fewest number of motor vehicle stops were in Passaic County, where only one department provided data. However, Ocean County had 10,630 motor vehicle stops reported from only three police departments; each department on average then, conducted about 3,500 stops. Similarly, Cumberland County only had one department reporting data for a total of 6,120 stops in all four years. While some counties, like Middlesex, Monmouth, and Morris, have high numbers of stops resulting from the number of departments responding, other counties have high numbers of stops considering the low number of departments who responded.
Table Six: Motor Vehicle Stops by County April 2008 – April 2012
2008 2009 2010 2011 2012 Total Bergen 1,187 1,163 1,031 840 1,066 5,287 Burlington 4,003 3,724 2,890 3,649 3,976 18,242 Camden 3,272 3,178 3,055 3,602 3,988 17,095 Cumberland 961 1,299 1,353 1,489 1,018 6,120 Essex 644 734 824 875 1,052 4,129 Hudson 2,290 2,265 2,538 2,305 1,832 11,230 Hunterdon 855 594 1,074 936 1,412 4,871 Mercer 2,167 1,807 2,233 2,036 2,261 10,504 Middlesex 10,306 8,854 8,420 8,837 11,534 47,951 Monmouth 4,891 4,663 4,935 4,807 4,540 23,836 Morris 7,814 6,982 6,793 6,387 6,147 34,123 Ocean 2,352 2,391 2,610 1,488 1,789 10,630 Passaic 182 168 153 175 226 904 Salem 956 850 723 716 705 3,950 Somerset 1,709 1,807 2,066 1,888 1,861 9,331 Sussex 510 672 796 754 986 3,718 Union 1,607 1,689 1,837 2,100 2,138 9,371 Total 45,706 42,840 43,331 42,884 46,531 221,292
OLEPS Municipal Police Department Report October 2012
Page 13 of 54 Office of Law Enforcement Professional Standards
Consent Requests Granted
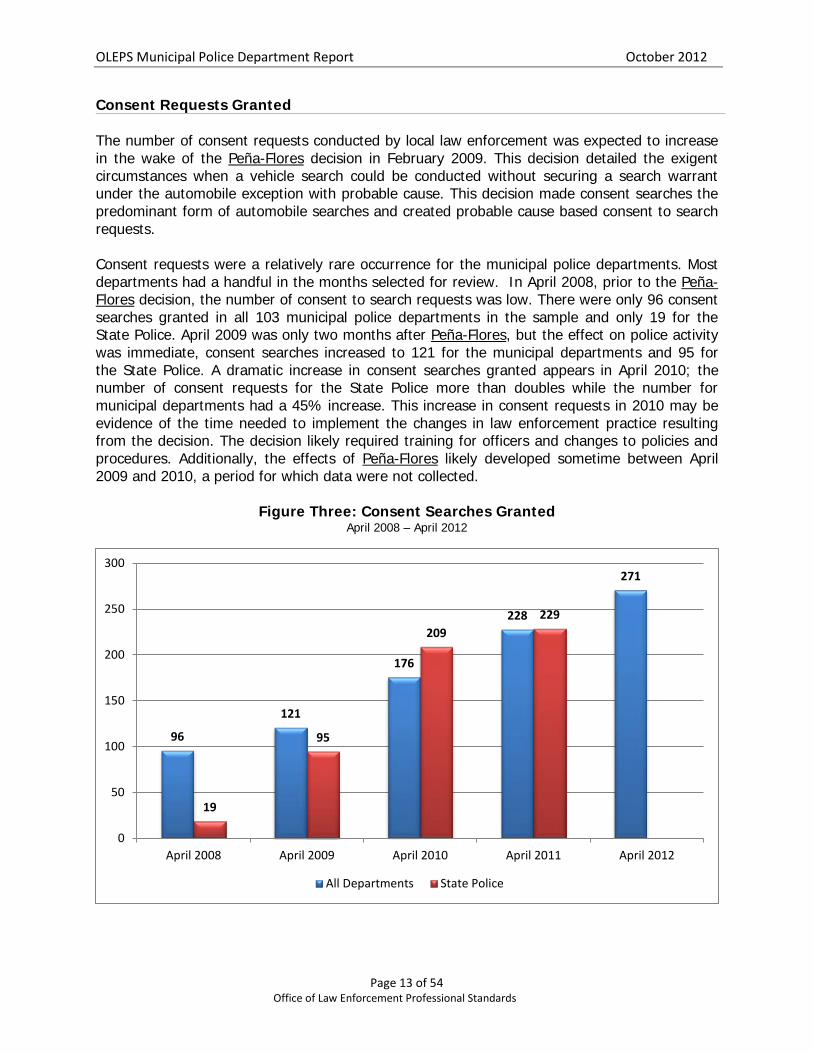
The number of consent requests conducted by local law enforcement was expected to increase in the wake of the Peña-Flores decision in February 2009. This decision detailed the exigent circumstances when a vehicle search could be conducted without securing a search warrant under the automobile exception with probable cause. This decision made consent searches the predominant form of automobile searches and created probable cause based consent to search requests. Consent requests were a relatively rare occurrence for the municipal police departments. Most departments had a handful in the months selected for review. In April 2008, prior to the Peña-Flores decision, the number of consent to search requests was low. There were only 96 consent searches granted in all 103 municipal police departments in the sample and only 19 for the State Police. April 2009 was only two months after Peña-Flores, but the effect on police activity was immediate, consent searches increased to 121 for the municipal departments and 95 for the State Police. A dramatic increase in consent searches granted appears in April 2010; the number of consent requests for the State Police more than doubles while the number for municipal departments had a 45% increase. This increase in consent requests in 2010 may be evidence of the time needed to implement the changes in law enforcement practice resulting from the decision. The decision likely required training for officers and changes to policies and procedures. Additionally, the effects of Peña-Flores likely developed sometime between April 2009 and 2010, a period for which data were not collected.
Figure Three: Consent Searches Granted April 2008 – April 2012
96
121
176
228
271
19
95
209 229
0
50
100
150
200
250
300
April 2008 April 2009 April 2010 April 2011 April 2012
All Departments State Police
OLEPS Municipal Police Department Report October 2012
Page 14 of 54 Office of Law Enforcement Professional Standards
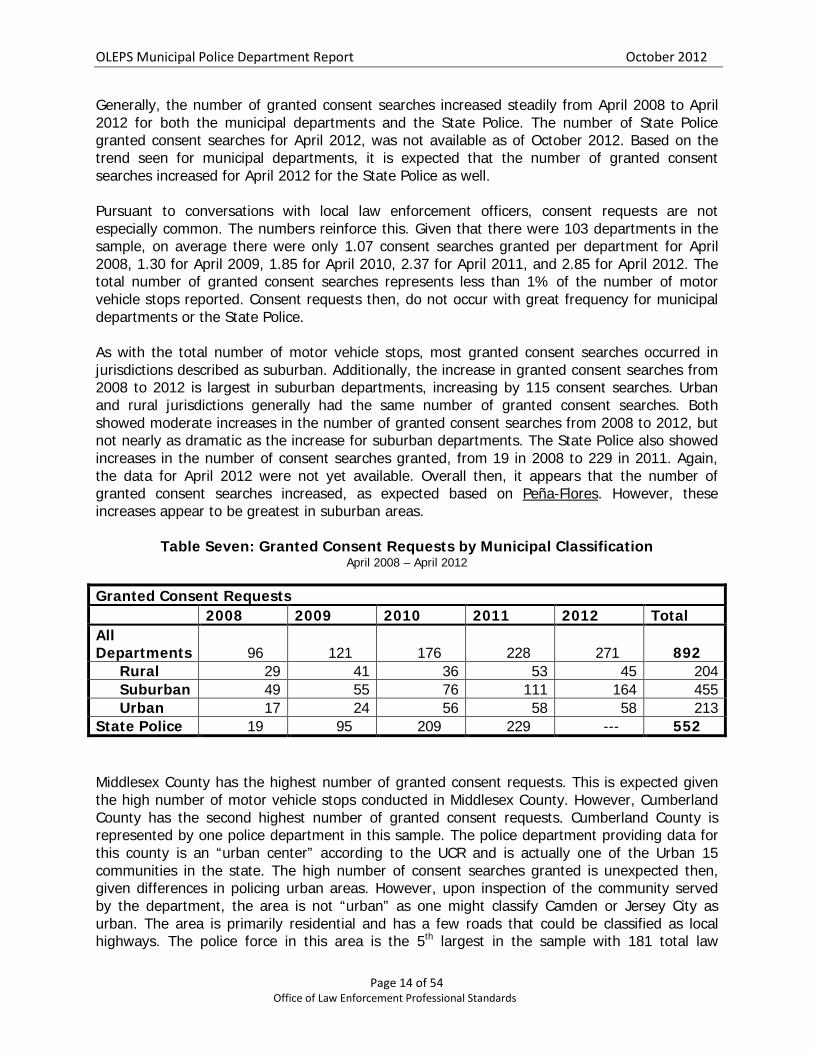
Generally, the number of granted consent searches increased steadily from April 2008 to April 2012 for both the municipal departments and the State Police. The number of State Police granted consent searches for April 2012, was not available as of October 2012. Based on the trend seen for municipal departments, it is expected that the number of granted consent searches increased for April 2012 for the State Police as well. Pursuant to conversations with local law enforcement officers, consent requests are not especially common. The numbers reinforce this. Given that there were 103 departments in the sample, on average there were only 1.07 consent searches granted per department for April 2008, 1.30 for April 2009, 1.85 for April 2010, 2.37 for April 2011, and 2.85 for April 2012. The total number of granted consent searches represents less than 1% of the number of motor vehicle stops reported. Consent requests then, do not occur with great frequency for municipal departments or the State Police. As with the total number of motor vehicle stops, most granted consent searches occurred in jurisdictions described as suburban. Additionally, the increase in granted consent searches from 2008 to 2012 is largest in suburban departments, increasing by 115 consent searches. Urban and rural jurisdictions generally had the same number of granted consent searches. Both showed moderate increases in the number of granted consent searches from 2008 to 2012, but not nearly as dramatic as the increase for suburban departments. The State Police also showed increases in the number of consent searches granted, from 19 in 2008 to 229 in 2011. Again, the data for April 2012 were not yet available. Overall then, it appears that the number of granted consent searches increased, as expected based on Peña-Flores. However, these increases appear to be greatest in suburban areas.
Table Seven: Granted Consent Requests by Municipal Classification April 2008 – April 2012
Granted Consent Requests 2008 2009 2010 2011 2012 Total All Departments 96 121 176 228 271 892
Rural 29 41 36 53 45 204 Suburban 49 55 76 111 164 455 Urban 17 24 56 58 58 213
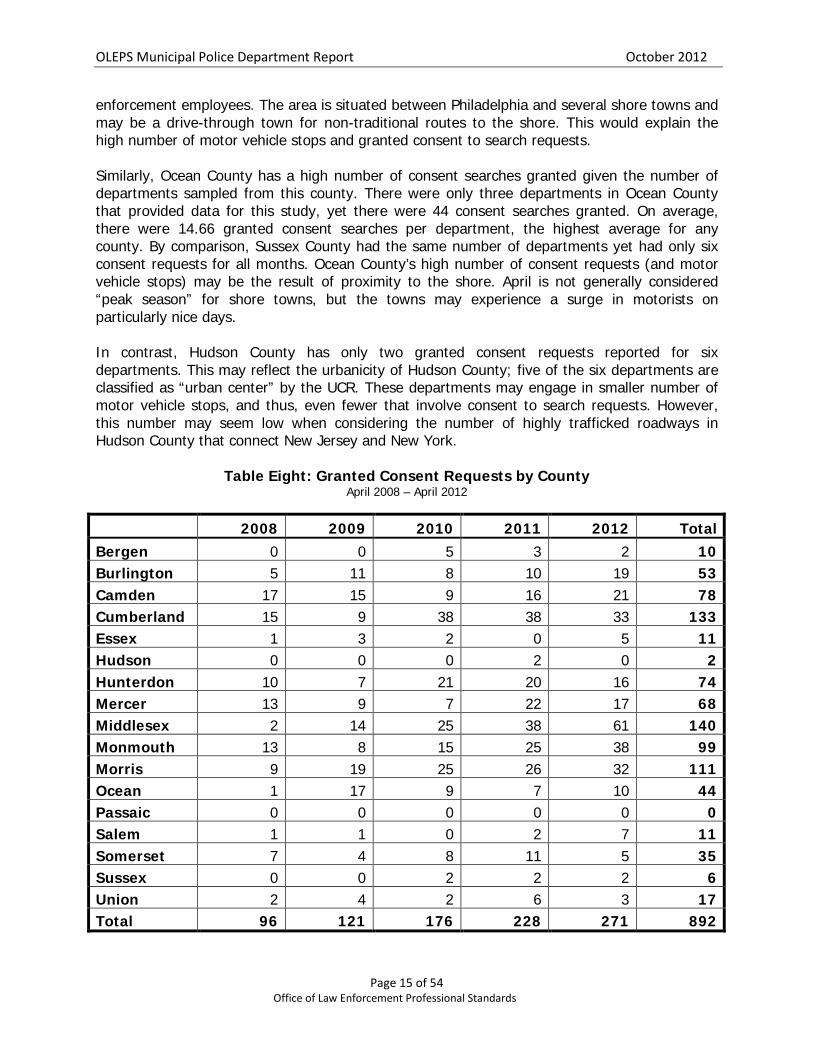
State Police 19 95 209 229 --- 552 Middlesex County has the highest number of granted consent requests. This is expected given the high number of motor vehicle stops conducted in Middlesex County. However, Cumberland County has the second highest number of granted consent requests. Cumberland County is represented by one police department in this sample. The police department providing data for this county is an “urban center” according to the UCR and is actually one of the Urban 15 communities in the state. The high number of consent searches granted is unexpected then, given differences in policing urban areas. However, upon inspection of the community served by the department, the area is not “urban” as one might classify Camden or Jersey City as urban. The area is primarily residential and has a few roads that could be classified as local highways. The police force in this area is the 5th largest in the sample with 181 total law
OLEPS Municipal Police Department Report October 2012
Page 15 of 54 Office of Law Enforcement Professional Standards
enforcement employees. The area is situated between Philadelphia and several shore towns and may be a drive-through town for non-traditional routes to the shore. This would explain the high number of motor vehicle stops and granted consent to search requests. Similarly, Ocean County has a high number of consent searches granted given the number of departments sampled from this county. There were only three departments in Ocean County that provided data for this study, yet there were 44 consent searches granted. On average, there were 14.66 granted consent searches per department, the highest average for any county. By comparison, Sussex County had the same number of departments yet had only six consent requests for all months. Ocean County’s high number of consent requests (and motor vehicle stops) may be the result of proximity to the shore. April is not generally considered “peak season” for shore towns, but the towns may experience a surge in motorists on particularly nice days. In contrast, Hudson County has only two granted consent requests reported for six departments. This may reflect the urbanicity of Hudson County; five of the six departments are classified as “urban center” by the UCR. These departments may engage in smaller number of motor vehicle stops, and thus, even fewer that involve consent to search requests. However, this number may seem low when considering the number of highly trafficked roadways in Hudson County that connect New Jersey and New York.
Table Eight: Granted Consent Requests by County April 2008 – April 2012
2008 2009 2010 2011 2012 Total Bergen 0 0 5 3 2 10 Burlington 5 11 8 10 19 53 Camden 17 15 9 16 21 78 Cumberland 15 9 38 38 33 133 Essex 1 3 2 0 5 11 Hudson 0 0 0 2 0 2 Hunterdon 10 7 21 20 16 74 Mercer 13 9 7 22 17 68 Middlesex 2 14 25 38 61 140 Monmouth 13 8 15 25 38 99 Morris 9 19 25 26 32 111 Ocean 1 17 9 7 10 44 Passaic 0 0 0 0 0 0 Salem 1 1 0 2 7 11 Somerset 7 4 8 11 5 35 Sussex 0 0 2 2 2 6 Union 2 4 2 6 3 17 Total 96 121 176 228 271 892
OLEPS Municipal Police Department Report October 2012
Page 16 of 54 Office of Law Enforcement Professional Standards
Consent Requests Denied
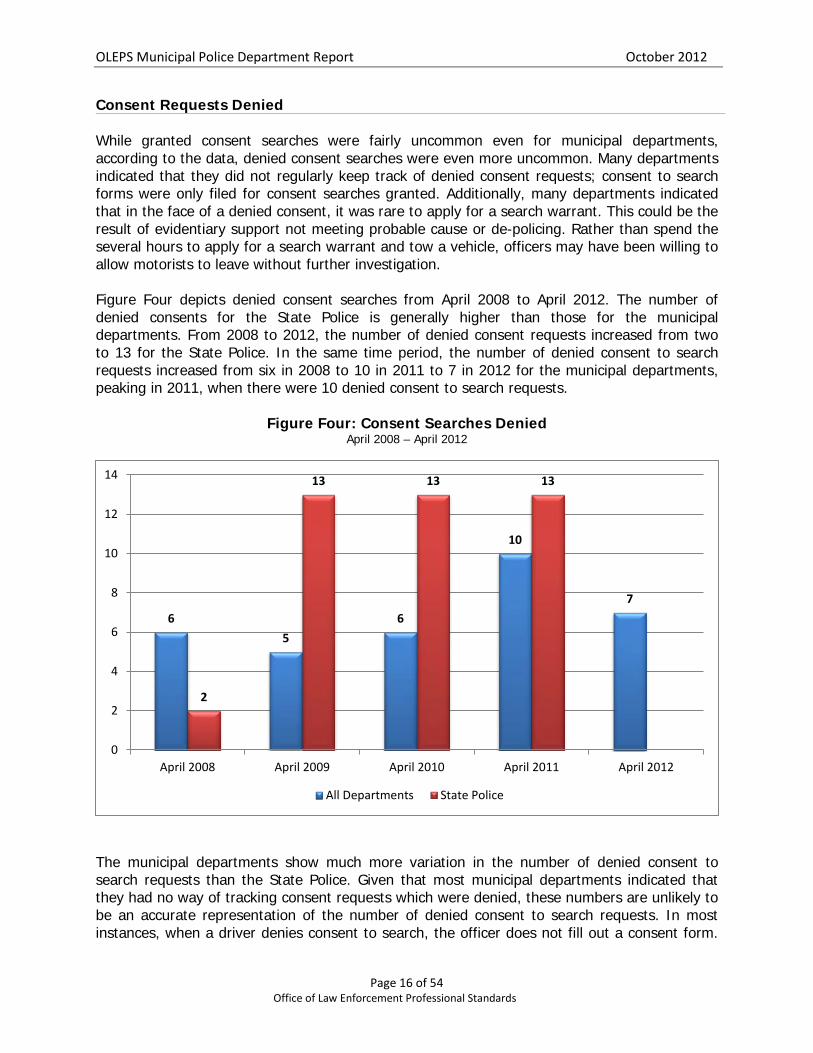
While granted consent searches were fairly uncommon even for municipal departments, according to the data, denied consent searches were even more uncommon. Many departments indicated that they did not regularly keep track of denied consent requests; consent to search forms were only filed for consent searches granted. Additionally, many departments indicated that in the face of a denied consent, it was rare to apply for a search warrant. This could be the result of evidentiary support not meeting probable cause or de-policing. Rather than spend the several hours to apply for a search warrant and tow a vehicle, officers may have been willing to allow motorists to leave without further investigation. Figure Four depicts denied consent searches from April 2008 to April 2012. The number of denied consents for the State Police is generally higher than those for the municipal departments. From 2008 to 2012, the number of denied consent requests increased from two to 13 for the State Police. In the same time period, the number of denied consent to search requests increased from six in 2008 to 10 in 2011 to 7 in 2012 for the municipal departments, peaking in 2011, when there were 10 denied consent to search requests.
Figure Four: Consent Searches Denied April 2008 – April 2012
The municipal departments show much more variation in the number of denied consent to search requests than the State Police. Given that most municipal departments indicated that they had no way of tracking consent requests which were denied, these numbers are unlikely to be an accurate representation of the number of denied consent to search requests. In most instances, when a driver denies consent to search, the officer does not fill out a consent form.
6 5
6
10
7
2
13 13 13
0
2
4
6
8
10
12
14
April 2008 April 2009 April 2010 April 2011 April 2012
All Departments State Police
OLEPS Municipal Police Department Report October 2012
Page 17 of 54 Office of Law Enforcement Professional Standards
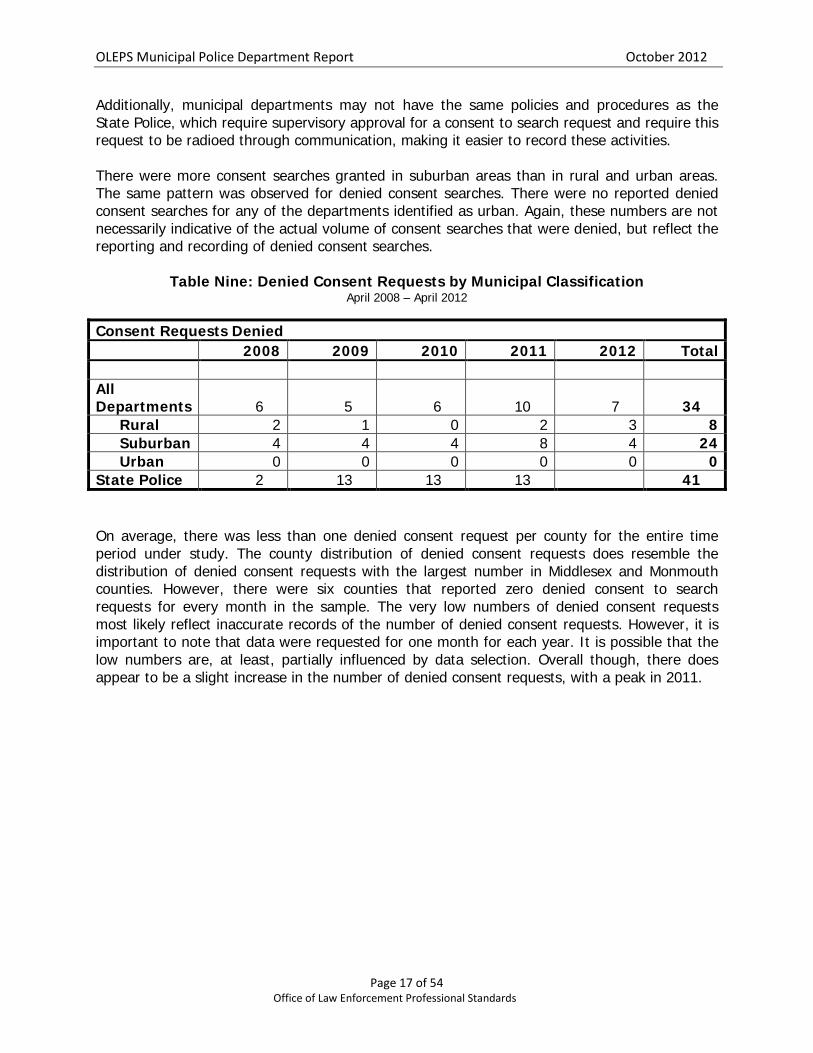
Additionally, municipal departments may not have the same policies and procedures as the State Police, which require supervisory approval for a consent to search request and require this request to be radioed through communication, making it easier to record these activities. There were more consent searches granted in suburban areas than in rural and urban areas. The same pattern was observed for denied consent searches. There were no reported denied consent searches for any of the departments identified as urban. Again, these numbers are not necessarily indicative of the actual volume of consent searches that were denied, but reflect the reporting and recording of denied consent searches.
Table Nine: Denied Consent Requests by Municipal Classification
April 2008 – April 2012
Consent Requests Denied 2008 2009 2010 2011 2012 Total All Departments 6 5 6 10 7 34
Rural 2 1 0 2 3 8 Suburban 4 4 4 8 4 24 Urban 0 0 0 0 0 0
State Police 2 13 13 13 41 On average, there was less than one denied consent request per county for the entire time period under study. The county distribution of denied consent requests does resemble the distribution of denied consent requests with the largest number in Middlesex and Monmouth counties. However, there were six counties that reported zero denied consent to search requests for every month in the sample. The very low numbers of denied consent requests most likely reflect inaccurate records of the number of denied consent requests. However, it is important to note that data were requested for one month for each year. It is possible that the low numbers are, at least, partially influenced by data selection. Overall though, there does appear to be a slight increase in the number of denied consent requests, with a peak in 2011.
OLEPS Municipal Police Department Report October 2012
Page 18 of 54 Office of Law Enforcement Professional Standards
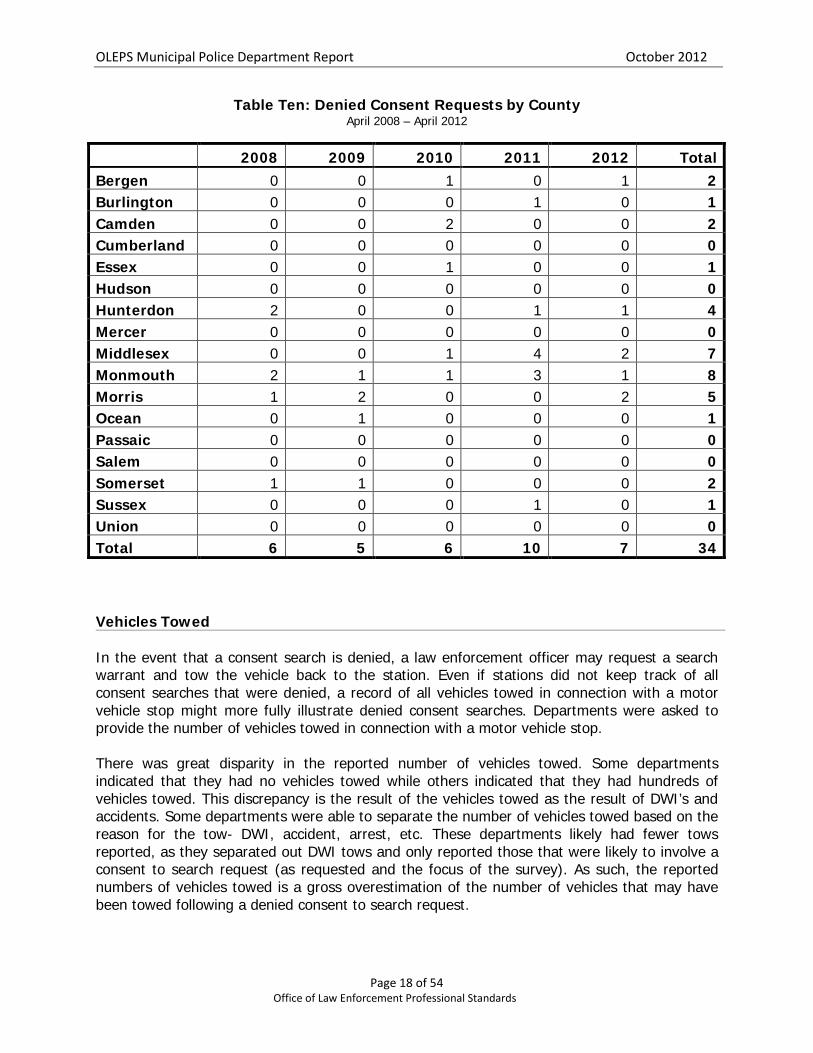
Table Ten: Denied Consent Requests by County April 2008 – April 2012
2008 2009 2010 2011 2012 Total Bergen 0 0 1 0 1 2 Burlington 0 0 0 1 0 1 Camden 0 0 2 0 0 2 Cumberland 0 0 0 0 0 0 Essex 0 0 1 0 0 1 Hudson 0 0 0 0 0 0 Hunterdon 2 0 0 1 1 4 Mercer 0 0 0 0 0 0 Middlesex 0 0 1 4 2 7 Monmouth 2 1 1 3 1 8 Morris 1 2 0 0 2 5 Ocean 0 1 0 0 0 1 Passaic 0 0 0 0 0 0 Salem 0 0 0 0 0 0 Somerset 1 1 0 0 0 2 Sussex 0 0 0 1 0 1 Union 0 0 0 0 0 0 Total 6 5 6 10 7 34 Vehicles Towed
In the event that a consent search is denied, a law enforcement officer may request a search warrant and tow the vehicle back to the station. Even if stations did not keep track of all consent searches that were denied, a record of all vehicles towed in connection with a motor vehicle stop might more fully illustrate denied consent searches. Departments were asked to provide the number of vehicles towed in connection with a motor vehicle stop. There was great disparity in the reported number of vehicles towed. Some departments indicated that they had no vehicles towed while others indicated that they had hundreds of vehicles towed. This discrepancy is the result of the vehicles towed as the result of DWI’s and accidents. Some departments were able to separate the number of vehicles towed based on the reason for the tow- DWI, accident, arrest, etc. These departments likely had fewer tows reported, as they separated out DWI tows and only reported those that were likely to involve a consent to search request (as requested and the focus of the survey). As such, the reported numbers of vehicles towed is a gross overestimation of the number of vehicles that may have been towed following a denied consent to search request.
OLEPS Municipal Police Department Report October 2012
Page 19 of 54 Office of Law Enforcement Professional Standards
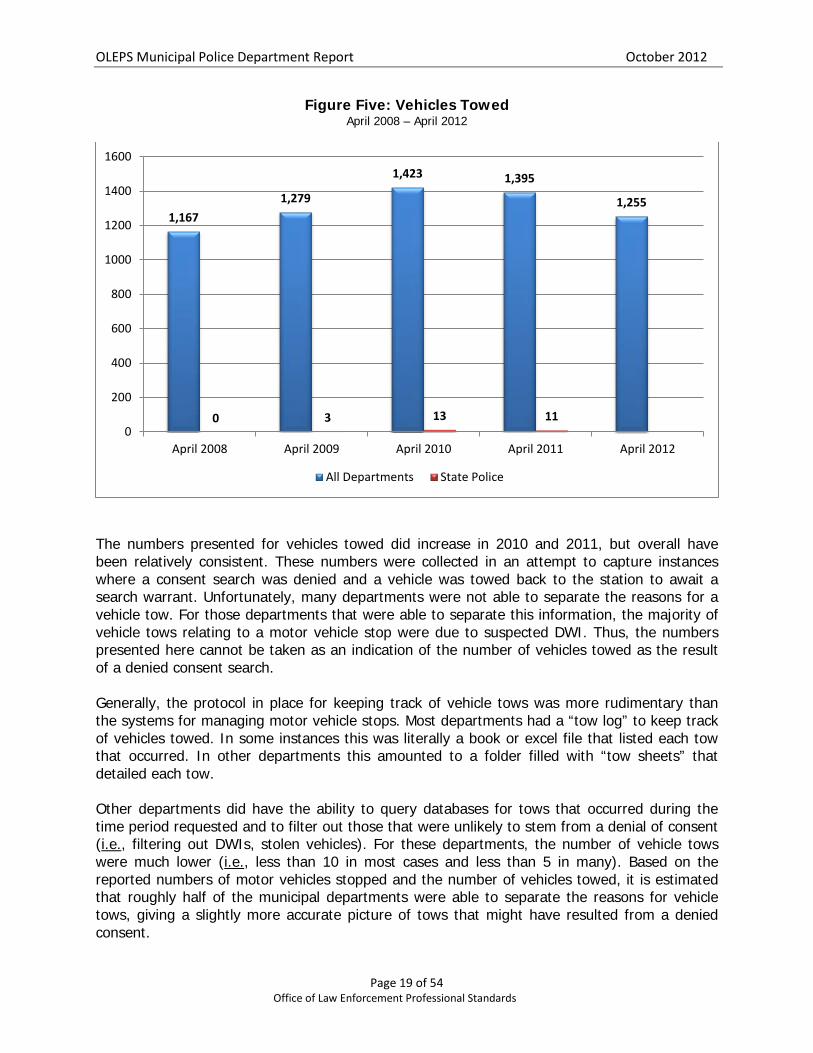
Figure Five: Vehicles Towed April 2008 – April 2012
The numbers presented for vehicles towed did increase in 2010 and 2011, but overall have been relatively consistent. These numbers were collected in an attempt to capture instances where a consent search was denied and a vehicle was towed back to the station to await a search warrant. Unfortunately, many departments were not able to separate the reasons for a vehicle tow. For those departments that were able to separate this information, the majority of vehicle tows relating to a motor vehicle stop were due to suspected DWI. Thus, the numbers presented here cannot be taken as an indication of the number of vehicles towed as the result of a denied consent search. Generally, the protocol in place for keeping track of vehicle tows was more rudimentary than the systems for managing motor vehicle stops. Most departments had a “tow log” to keep track of vehicles towed. In some instances this was literally a book or excel file that listed each tow that occurred. In other departments this amounted to a folder filled with “tow sheets” that detailed each tow. Other departments did have the ability to query databases for tows that occurred during the time period requested and to filter out those that were unlikely to stem from a denial of consent (i.e., filtering out DWIs, stolen vehicles). For these departments, the number of vehicle tows were much lower (i.e., less than 10 in most cases and less than 5 in many). Based on the reported numbers of motor vehicles stopped and the number of vehicles towed, it is estimated that roughly half of the municipal departments were able to separate the reasons for vehicle tows, giving a slightly more accurate picture of tows that might have resulted from a denied consent.
1,167 1,279
1,423 1,395
1,255
0 3 13 11 0
200
400
600
800
1000
1200
1400
1600
April 2008 April 2009 April 2010 April 2011 April 2012
All Departments State Police
OLEPS Municipal Police Department Report October 2012
Page 20 of 54 Office of Law Enforcement Professional Standards
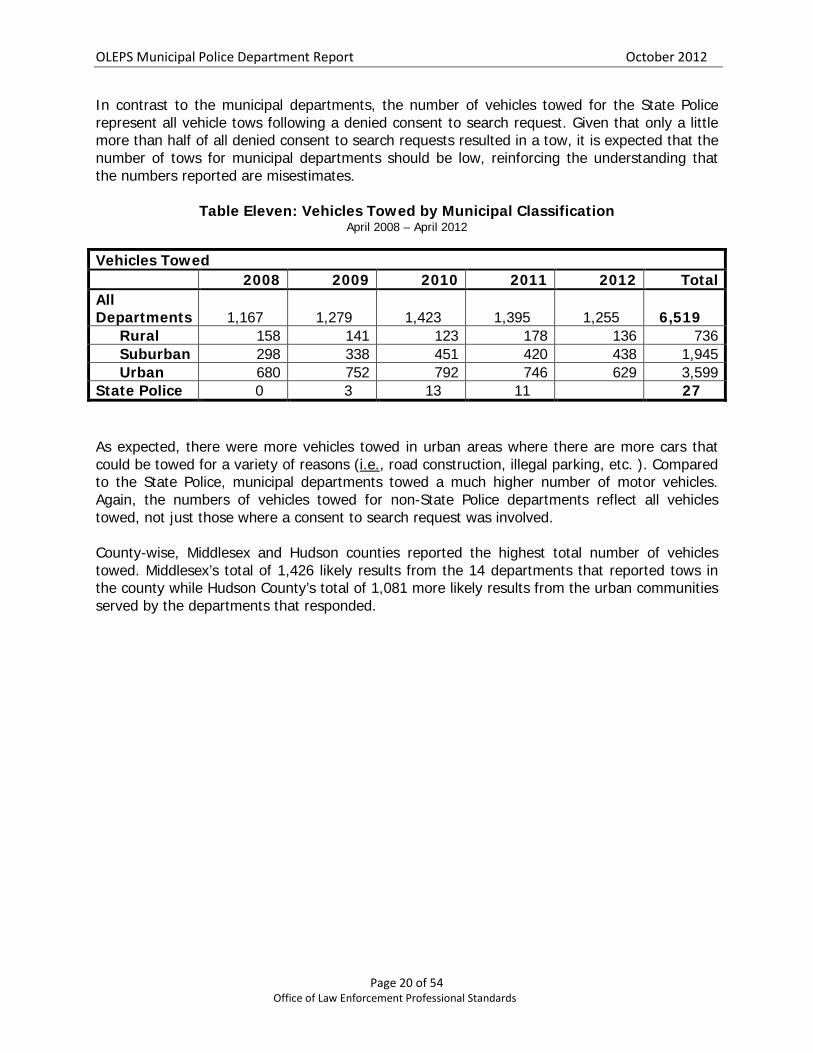
In contrast to the municipal departments, the number of vehicles towed for the State Police represent all vehicle tows following a denied consent to search request. Given that only a little more than half of all denied consent to search requests resulted in a tow, it is expected that the number of tows for municipal departments should be low, reinforcing the understanding that the numbers reported are misestimates.
Table Eleven: Vehicles Towed by Municipal Classification April 2008 – April 2012
Vehicles Towed 2008 2009 2010 2011 2012 Total All Departments 1,167 1,279 1,423 1,395 1,255 6,519
Rural 158 141 123 178 136 736 Suburban 298 338 451 420 438 1,945 Urban 680 752 792 746 629 3,599
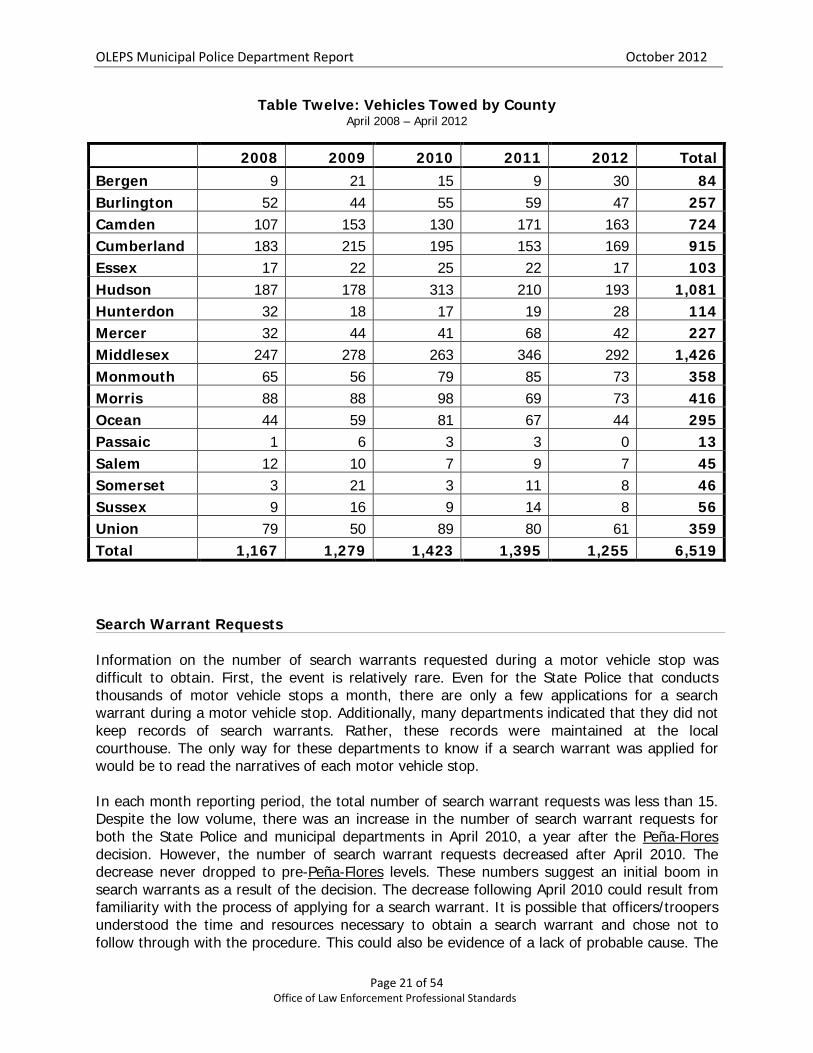
State Police 0 3 13 11 27 As expected, there were more vehicles towed in urban areas where there are more cars that could be towed for a variety of reasons (i.e., road construction, illegal parking, etc. ). Compared to the State Police, municipal departments towed a much higher number of motor vehicles. Again, the numbers of vehicles towed for non-State Police departments reflect all vehicles towed, not just those where a consent to search request was involved. County-wise, Middlesex and Hudson counties reported the highest total number of vehicles towed. Middlesex’s total of 1,426 likely results from the 14 departments that reported tows in the county while Hudson County’s total of 1,081 more likely results from the urban communities served by the departments that responded.
OLEPS Municipal Police Department Report October 2012
Page 21 of 54 Office of Law Enforcement Professional Standards
Table Twelve: Vehicles Towed by County April 2008 – April 2012
2008 2009 2010 2011 2012 Total Bergen 9 21 15 9 30 84 Burlington 52 44 55 59 47 257 Camden 107 153 130 171 163 724 Cumberland 183 215 195 153 169 915 Essex 17 22 25 22 17 103 Hudson 187 178 313 210 193 1,081 Hunterdon 32 18 17 19 28 114 Mercer 32 44 41 68 42 227 Middlesex 247 278 263 346 292 1,426 Monmouth 65 56 79 85 73 358 Morris 88 88 98 69 73 416 Ocean 44 59 81 67 44 295 Passaic 1 6 3 3 0 13 Salem 12 10 7 9 7 45 Somerset 3 21 3 11 8 46 Sussex 9 16 9 14 8 56 Union 79 50 89 80 61 359 Total 1,167 1,279 1,423 1,395 1,255 6,519 Search Warrant Requests
Information on the number of search warrants requested during a motor vehicle stop was difficult to obtain. First, the event is relatively rare. Even for the State Police that conducts thousands of motor vehicle stops a month, there are only a few applications for a search warrant during a motor vehicle stop. Additionally, many departments indicated that they did not keep records of search warrants. Rather, these records were maintained at the local courthouse. The only way for these departments to know if a search warrant was applied for would be to read the narratives of each motor vehicle stop.
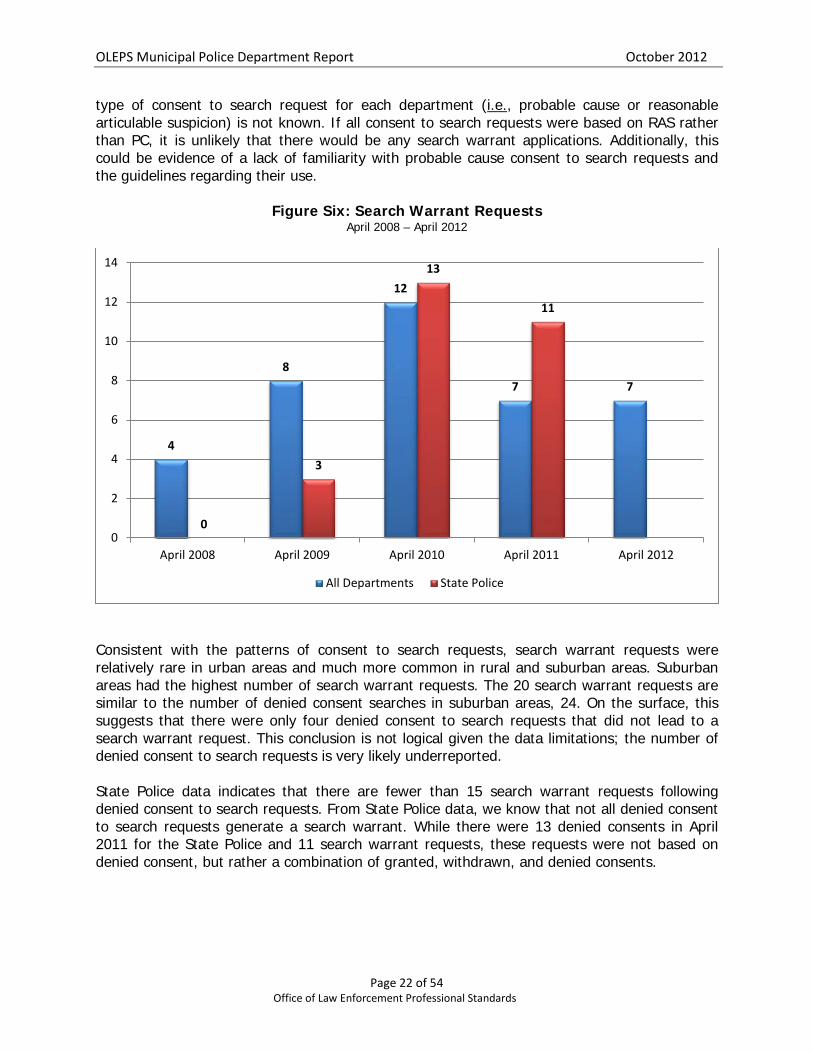
In each month reporting period, the total number of search warrant requests was less than 15. Despite the low volume, there was an increase in the number of search warrant requests for both the State Police and municipal departments in April 2010, a year after the Peña-Flores decision. However, the number of search warrant requests decreased after April 2010. The decrease never dropped to pre-Peña-Flores levels. These numbers suggest an initial boom in search warrants as a result of the decision. The decrease following April 2010 could result from familiarity with the process of applying for a search warrant. It is possible that officers/troopers understood the time and resources necessary to obtain a search warrant and chose not to follow through with the procedure. This could also be evidence of a lack of probable cause. The
OLEPS Municipal Police Department Report October 2012
Page 22 of 54 Office of Law Enforcement Professional Standards
type of consent to search request for each department (i.e., probable cause or reasonable articulable suspicion) is not known. If all consent to search requests were based on RAS rather than PC, it is unlikely that there would be any search warrant applications. Additionally, this could be evidence of a lack of familiarity with probable cause consent to search requests and the guidelines regarding their use.
Figure Six: Search Warrant Requests April 2008 – April 2012
Consistent with the patterns of consent to search requests, search warrant requests were relatively rare in urban areas and much more common in rural and suburban areas. Suburban areas had the highest number of search warrant requests. The 20 search warrant requests are similar to the number of denied consent searches in suburban areas, 24. On the surface, this suggests that there were only four denied consent to search requests that did not lead to a search warrant request. This conclusion is not logical given the data limitations; the number of denied consent to search requests is very likely underreported. State Police data indicates that there are fewer than 15 search warrant requests following denied consent to search requests. From State Police data, we know that not all denied consent to search requests generate a search warrant. While there were 13 denied consents in April 2011 for the State Police and 11 search warrant requests, these requests were not based on denied consent, but rather a combination of granted, withdrawn, and denied consents.
4
8
12
7 7
0
3
13
11
0
2
4
6
8
10
12
14
April 2008 April 2009 April 2010 April 2011 April 2012
All Departments State Police
OLEPS Municipal Police Department Report October 2012
Page 23 of 54 Office of Law Enforcement Professional Standards
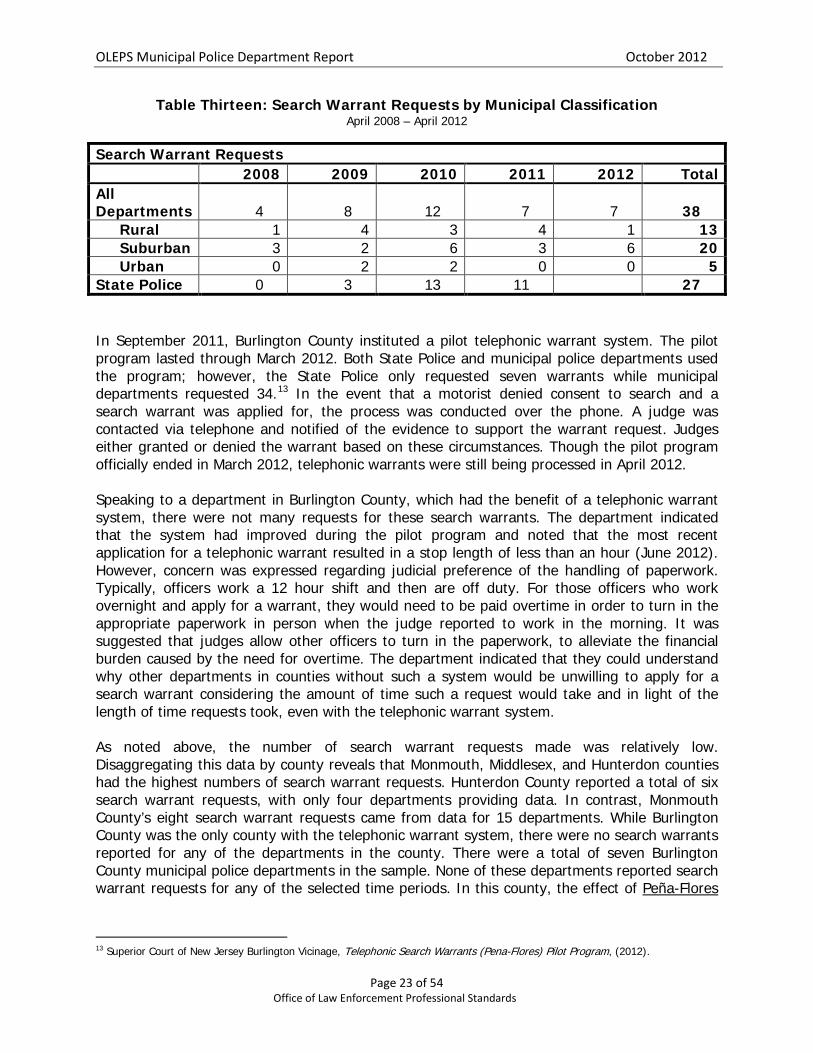
Table Thirteen: Search Warrant Requests by Municipal Classification April 2008 – April 2012
Search Warrant Requests 2008 2009 2010 2011 2012 Total All Departments 4 8 12 7 7 38
Rural 1 4 3 4 1 13 Suburban 3 2 6 3 6 20 Urban 0 2 2 0 0 5
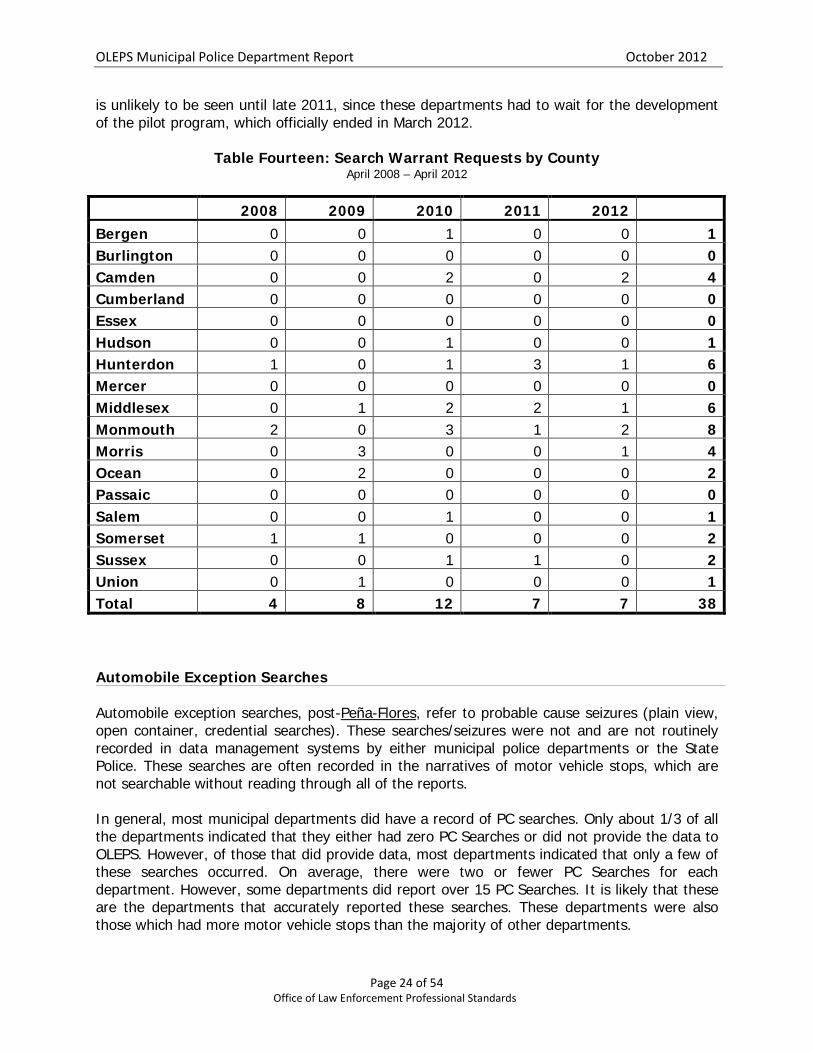
State Police 0 3 13 11 27 In September 2011, Burlington County instituted a pilot telephonic warrant system. The pilot program lasted through March 2012. Both State Police and municipal police departments used the program; however, the State Police only requested seven warrants while municipal departments requested 34.13 In the event that a motorist denied consent to search and a search warrant was applied for, the process was conducted over the phone. A judge was contacted via telephone and notified of the evidence to support the warrant request. Judges either granted or denied the warrant based on these circumstances. Though the pilot program officially ended in March 2012, telephonic warrants were still being processed in April 2012. Speaking to a department in Burlington County, which had the benefit of a telephonic warrant system, there were not many requests for these search warrants. The department indicated that the system had improved during the pilot program and noted that the most recent application for a telephonic warrant resulted in a stop length of less than an hour (June 2012). However, concern was expressed regarding judicial preference of the handling of paperwork. Typically, officers work a 12 hour shift and then are off duty. For those officers who work overnight and apply for a warrant, they would need to be paid overtime in order to turn in the appropriate paperwork in person when the judge reported to work in the morning. It was suggested that judges allow other officers to turn in the paperwork, to alleviate the financial burden caused by the need for overtime. The department indicated that they could understand why other departments in counties without such a system would be unwilling to apply for a search warrant considering the amount of time such a request would take and in light of the length of time requests took, even with the telephonic warrant system. As noted above, the number of search warrant requests made was relatively low. Disaggregating this data by county reveals that Monmouth, Middlesex, and Hunterdon counties had the highest numbers of search warrant requests. Hunterdon County reported a total of six search warrant requests, with only four departments providing data. In contrast, Monmouth County’s eight search warrant requests came from data for 15 departments. While Burlington County was the only county with the telephonic warrant system, there were no search warrants reported for any of the departments in the county. There were a total of seven Burlington County municipal police departments in the sample. None of these departments reported search warrant requests for any of the selected time periods. In this county, the effect of Peña-Flores
13 Superior Court of New Jersey Burlington Vicinage, Telephonic Search Warrants (Pena-Flores) Pilot Program, (2012).
OLEPS Municipal Police Department Report October 2012
Page 24 of 54 Office of Law Enforcement Professional Standards
is unlikely to be seen until late 2011, since these departments had to wait for the development of the pilot program, which officially ended in March 2012.
Table Fourteen: Search Warrant Requests by County April 2008 – April 2012
2008 2009 2010 2011 2012 Total
Bergen 0 0 1 0 0 1 Burlington 0 0 0 0 0 0 Camden 0 0 2 0 2 4 Cumberland 0 0 0 0 0 0 Essex 0 0 0 0 0 0 Hudson 0 0 1 0 0 1 Hunterdon 1 0 1 3 1 6 Mercer 0 0 0 0 0 0 Middlesex 0 1 2 2 1 6 Monmouth 2 0 3 1 2 8 Morris 0 3 0 0 1 4 Ocean 0 2 0 0 0 2 Passaic 0 0 0 0 0 0 Salem 0 0 1 0 0 1 Somerset 1 1 0 0 0 2 Sussex 0 0 1 1 0 2 Union 0 1 0 0 0 1 Total 4 8 12 7 7 38 Automobile Exception Searches
Automobile exception searches, post-Peña-Flores, refer to probable cause seizures (plain view, open container, credential searches). These searches/seizures were not and are not routinely recorded in data management systems by either municipal police departments or the State Police. These searches are often recorded in the narratives of motor vehicle stops, which are not searchable without reading through all of the reports. In general, most municipal departments did have a record of PC searches. Only about 1/3 of all the departments indicated that they either had zero PC Searches or did not provide the data to OLEPS. However, of those that did provide data, most departments indicated that only a few of these searches occurred. On average, there were two or fewer PC Searches for each department. However, some departments did report over 15 PC Searches. It is likely that these are the departments that accurately reported these searches. These departments were also those which had more motor vehicle stops than the majority of other departments.

OLEPS Municipal Police Department Report October 2012
Page 25 of 54 Office of Law Enforcement Professional Standards
Figure Seven: Automobile Exception Searches April 2008 – April 2012
The total number of PC searches reported has decreased since April 2010. They did increase, however, from April 2008 to April 2009. While Peña-Flores did limit the automobile exception standards, the effects of this decision may not have been apparent in April 2009, less than two months after the decision. It is conceivable that it took a year to impact actual policy and procedures. There are no PC Searches reported for the State Police as this would require reading narratives for all 40,000+ stops each month to tally this number.
Table Fifteen: Automobile Exception Searches by Municipal Classification April 2008 – April 2012
Automobile Exception Searches 2008 2009 2010 2011 2012 Total All Departments 141 174 175 157 129 776
Rural 23 29 38 24 21 135 Suburban 96 122 95 84 59 456 Urban 19 21 40 47 49 176
State Police Consistent with Motor Vehicle Stops in general, there are more PC searches in suburban departments than urban and rural departments. This pattern most likely results from differences in the volume of motor vehicle stops in these areas. Interestingly, urban departments did not
141
174 175
157
129
0 0 0 0 0
20
40
60
80
100
120
140
160
180
200
April 2008 April 2009 April 2010 April 2011 April 2012
All Departments State Police
OLEPS Municipal Police Department Report October 2012
Page 26 of 54 Office of Law Enforcement Professional Standards
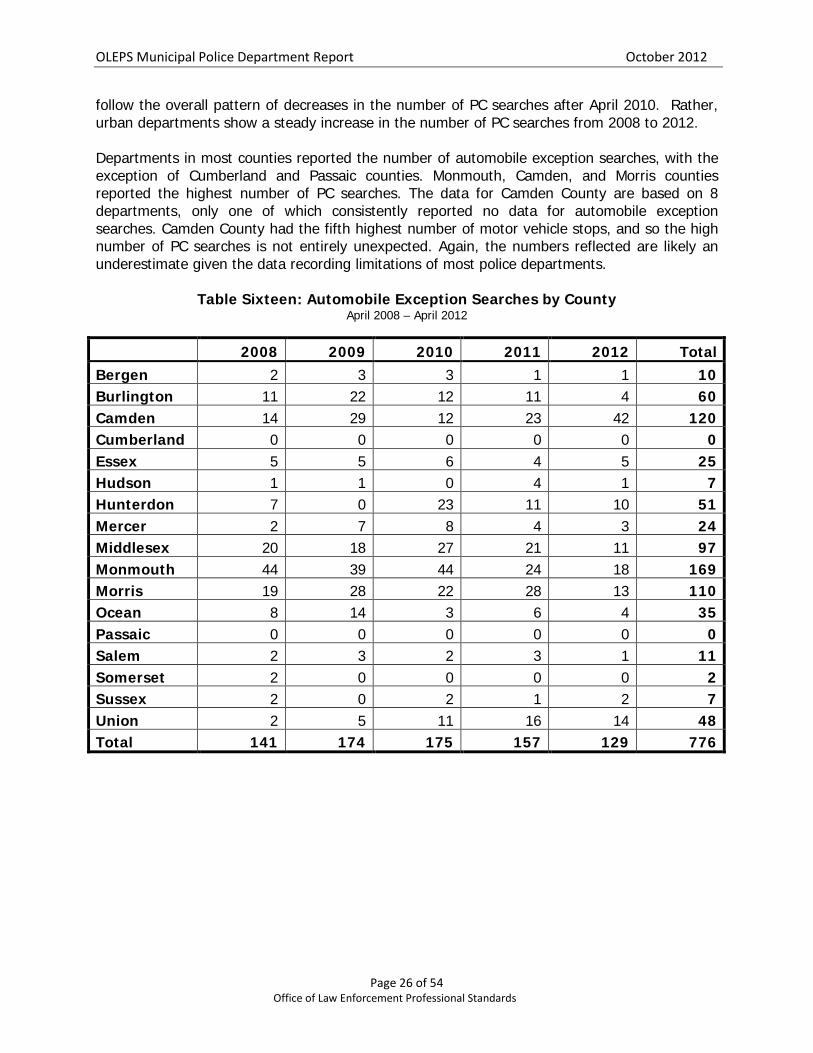
follow the overall pattern of decreases in the number of PC searches after April 2010. Rather, urban departments show a steady increase in the number of PC searches from 2008 to 2012. Departments in most counties reported the number of automobile exception searches, with the exception of Cumberland and Passaic counties. Monmouth, Camden, and Morris counties reported the highest number of PC searches. The data for Camden County are based on 8 departments, only one of which consistently reported no data for automobile exception searches. Camden County had the fifth highest number of motor vehicle stops, and so the high number of PC searches is not entirely unexpected. Again, the numbers reflected are likely an underestimate given the data recording limitations of most police departments.
Table Sixteen: Automobile Exception Searches by County
April 2008 – April 2012
2008 2009 2010 2011 2012 Total Bergen 2 3 3 1 1 10 Burlington 11 22 12 11 4 60 Camden 14 29 12 23 42 120 Cumberland 0 0 0 0 0 0 Essex 5 5 6 4 5 25 Hudson 1 1 0 4 1 7 Hunterdon 7 0 23 11 10 51 Mercer 2 7 8 4 3 24 Middlesex 20 18 27 21 11 97 Monmouth 44 39 44 24 18 169 Morris 19 28 22 28 13 110 Ocean 8 14 3 6 4 35 Passaic 0 0 0 0 0 0 Salem 2 3 2 3 1 11 Somerset 2 0 0 0 0 2 Sussex 2 0 2 1 2 7 Union 2 5 11 16 14 48 Total 141 174 175 157 129 776
OLEPS Municipal Police Department Report October 2012
Page 27 of 54 Office of Law Enforcement Professional Standards
Study Limitations
The data in this project are subject to a few limitations. These limitations are not necessarily unique to this project; some are inherent in survey research. Additionally, these limitations are not meant to discredit the findings of the survey, but rather to provide further explanation and context for the results. First, in distributing the Phase I preliminary survey, OLEPS was required to rely on NJSACOP and county prosecutors to forward the survey information to municipal departments; no database of e-mail addresses was available to OLEPS directly. Second, while all departments have an e-mail address, survey researchers have noted several issues conducting e-mail surveys. For some respondents, the message may be automatically filtered to a SPAM or Bulk mail folder, not reaching the intended recipient. Variation in equipment and technology (speed of computer and internet) can make it difficult for some respondents to receive and complete the survey. Second, municipal departments are generally funded through the communities in which they serve. Some communities may provide more funding for technology and record keeping than others. This means that the equipment/database/process used to store information on motor vehicle stops was not the same across departments. Some departments had county dispatch systems that housed most stop information while other departments had in-house systems. Additionally, many departments have experienced changes in procedures for recording data, namely, upgrades to new and more complete data systems. The variation in records systems made it difficult for some departments to obtain the data requested. Some departments were able to query their databases and pull stops with the specific enforcement activities. However, other departments had to pull hard copies of reports and read through all reports for motor vehicle stops in the requested reporting periods. The records management systems used by the State Police resulted from the Consent Decree14 and required a large amount of time, money, and resources to implement. It would be very unlikely for municipal departments to implement systems as comprehensive as those utilized by the State Police without the assistance of a grant. Third, and related to the second limitation, departments vary regarding what information is recorded and maintained. Most departments did not keep a record of denied consent to search requests. The general policy was to request consent, and when a motorist granted consent, to complete a consent to search form. It was uncommon for departments to produce a consent form where consent was denied. Fourth, only 246 of over 550 departments responded to Phase I of this project. Of those, only 107 indicated that they kept records of the events discussed in this report. The data collection and records management practices of half of the departments in the State of New Jersey are unknown. Noticeably, many of the larger (urban) departments within the state did not respond to the survey. It is entirely possible that the remaining departments would present a different picture of enforcements and motor vehicle stops. With that, the departments that did respond are from areas across the entire state and represent urban, suburban, and rural departments. The results then, are theoretically, representative of all departments in the state. 14 In December 1999, the State of New Jersey entered into a Consent Decree with the Civil Rights Division of the United States Department of Justice. No. 99-5970 (MLC). The Consent Decree was dissolved in September 2009.
Limitation
s
OLEPS Municipal Police Department Report October 2012
Page 28 of 54 Office of Law Enforcement Professional Standards
Conclusion
Despite the limitations mentioned, the data are consistent with expectations. In the wake of the Peña-Flores decision, the number of consent to search requests increased for both municipal departments and the State Police. The increase in consent to search requests was found despite only slight increases in the number of motor vehicle stops. To fully understand the results presented here, context is necessary. In 2008 and 2009, the United States and New Jersey experienced an unprecedented economic downturn. The economy bottomed in 2009, with companies, organizations, and governments experiencing great strain and stress in their budgets. Many municipal departments experienced tightening of their budgets which forced some to lay off officers and that caused many more departments to be unable to hire new officers in the wake of attrition. The budgetary constraints also affected the ability of departments to replace any aging equipment or systems. While the results do indicate an increase in the number of consent searches post Peña-Flores, the increase would have likely been greater had departments not experienced such restrictions. Without hiring new officers or replacing those who had retired, many departments experienced declines in the number of motor vehicle stops they were able to conduct, and hence enforcement activities (i.e., consent to search requests). Conclusions regarding other enforcement activities are limited because of the restrictions in data availability. While the number of consent searches increased following Peña-Flores, denied consent to search requests do not appear to match this pattern. The number of denied consent searches fluctuates rather than increasingly steadily in the years after the decision. Search warrant requests do appear to increase following Peña-Flores, but their overall pattern appears to be more fluctuation than steady increase, especially when comparing municipal and State Police numbers. As noted before, the reported numbers of vehicles towed following a denied consent request are not accurate. Instead, the totals likely reflect overall vehicle tows resulting from a motor vehicle stop. Finally, automobile exception searches did appear to decline following the Peña-Flores decision, as expected. However, no conclusion could be drawn regarding the State Police as the data are unavailable. Overall, the activities conducted by municipal departments represent a fraction of volume handled by the State Police, especially in reference to consent to search requests. The nature of policing in municipal departments is generally more varied than the State Police; few departments in the state would be likely to indicate that traffic enforcement represents the bulk of their activity. Additionally, the State Police employ a much larger number of troopers than most municipal departments; it would be difficult to find a department that came close to their numbers.
Con
clusion
OLEPS Municipal Police Department Report October 2012
Page 29 of 54 Office of Law Enforcement Professional Standards
Thank you to the following police organizations for assisting OLEPS by providing data on motor vehicle stops and enforcement activities. Aberdeen Township Allenhurst Andover Township Bayonne Belmar Police Berlin Township Bound Brook Bradley Beach Brielle Brookdale Community College Burlington Township Butler Caldwell Chatham Borough Chester Township Chesterfield Township Clark Clinton Township Deal East Brunswick Eastampton Twp. Elmer Borough Essex Fells Evesham Township Fanwood Florham Park Frenchtown Borough Garwood Glen Ridge Gloucester City Gloucester Township Guttenberg Police Hamburg Police Hanover Township Harding Township
Harrison Hawthorne Highland Park Hillsborough Hoboken Hopewell Hudson County Sheriff Lake Como Lakehurst Lakewood Laurel Springs Lawrence Township Linden Lindenwold Lodi Long Hill Township Manalapan Township Manchester Township Marlboro Township Mendham Borough Metuchen Middlesex Borough Milltown Monmouth Beach Monmouth University Monroe Township Montgomery Montville Township Morris County Park Morris Township Mount Arlington Mount Olive Township Mountain Lakes Neptune City New Brunswick New Jersey State Police
Newton North Brunswick Parsippany-Troy Hills Pemberton Borough Penns Grove Pennsauken Township Pennsville Township Pequannock Township Piscataway Princeton University Rahway Readington Township River Vale Robbinsville Police Rockaway Borough Rutgers University- Newark Rutgers University- New Brunswick Salem City Sea Bright Somerdale South Brunswick South River Spotswood Tewksbury Township Union City Upper Saddle River Vineland Voorhees West Long Branch Westampton Willingboro Woodbridge Township Wyckoff
OLEPS Municipal Police Department Report October 2012
Page 30 of 54 Office of Law Enforcement Professional Standards
Appendix One: Phase I Survey
Appen
dix On
e
OLEPS Municipal Police Department Report October 2012
Page 31 of 54 Office of Law Enforcement Professional Standards

OLEPS Municipal Police Department Report October 2012
Page 32 of 54 Office of Law Enforcement Professional Standards
OLEPS Municipal Police Department Report October 2012
Page 33 of 54 Office of Law Enforcement Professional Standards
OLEPS Municipal Police Department Report October 2012
Page 34 of 54 Office of Law Enforcement Professional Standards
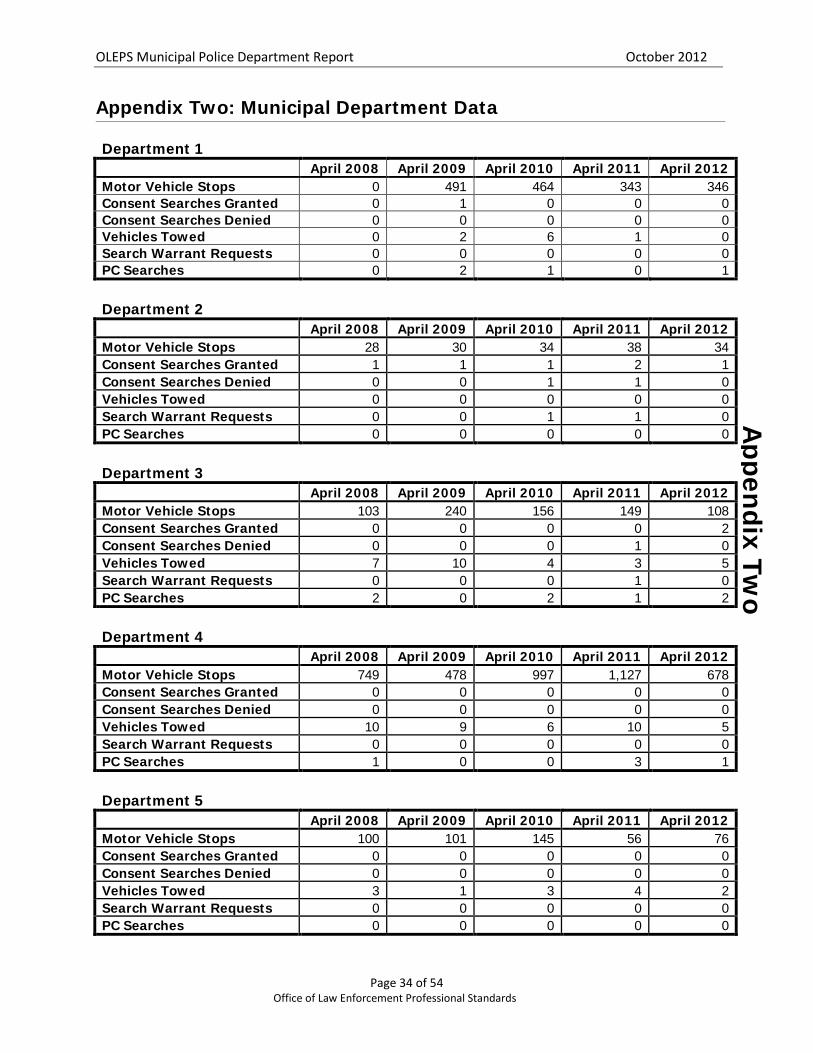
Appendix Two: Municipal Department Data Department 1
April 2008 April 2009 April 2010 April 2011 April 2012 Motor Vehicle Stops 0 491 464 343 346 Consent Searches Granted 0 1 0 0 0 Consent Searches Denied 0 0 0 0 0 Vehicles Towed 0 2 6 1 0 Search Warrant Requests 0 0 0 0 0 PC Searches 0 2 1 0 1
Department 2 April 2008 April 2009 April 2010 April 2011 April 2012
Motor Vehicle Stops 28 30 34 38 34 Consent Searches Granted 1 1 1 2 1 Consent Searches Denied 0 0 1 1 0 Vehicles Towed 0 0 0 0 0 Search Warrant Requests 0 0 1 1 0 PC Searches 0 0 0 0 0
Department 3 April 2008 April 2009 April 2010 April 2011 April 2012
Motor Vehicle Stops 103 240 156 149 108 Consent Searches Granted 0 0 0 0 2 Consent Searches Denied 0 0 0 1 0 Vehicles Towed 7 10 4 3 5 Search Warrant Requests 0 0 0 1 0 PC Searches 2 0 2 1 2
Department 4 April 2008 April 2009 April 2010 April 2011 April 2012
Motor Vehicle Stops 749 478 997 1,127 678 Consent Searches Granted 0 0 0 0 0 Consent Searches Denied 0 0 0 0 0 Vehicles Towed 10 9 6 10 5 Search Warrant Requests 0 0 0 0 0 PC Searches 1 0 0 3 1
Department 5 April 2008 April 2009 April 2010 April 2011 April 2012
Motor Vehicle Stops 100 101 145 56 76 Consent Searches Granted 0 0 0 0 0 Consent Searches Denied 0 0 0 0 0 Vehicles Towed 3 1 3 4 2 Search Warrant Requests 0 0 0 0 0 PC Searches 0 0 0 0 0
Appen
dix Two
OLEPS Municipal Police Department Report October 2012
Page 35 of 54 Office of Law Enforcement Professional Standards
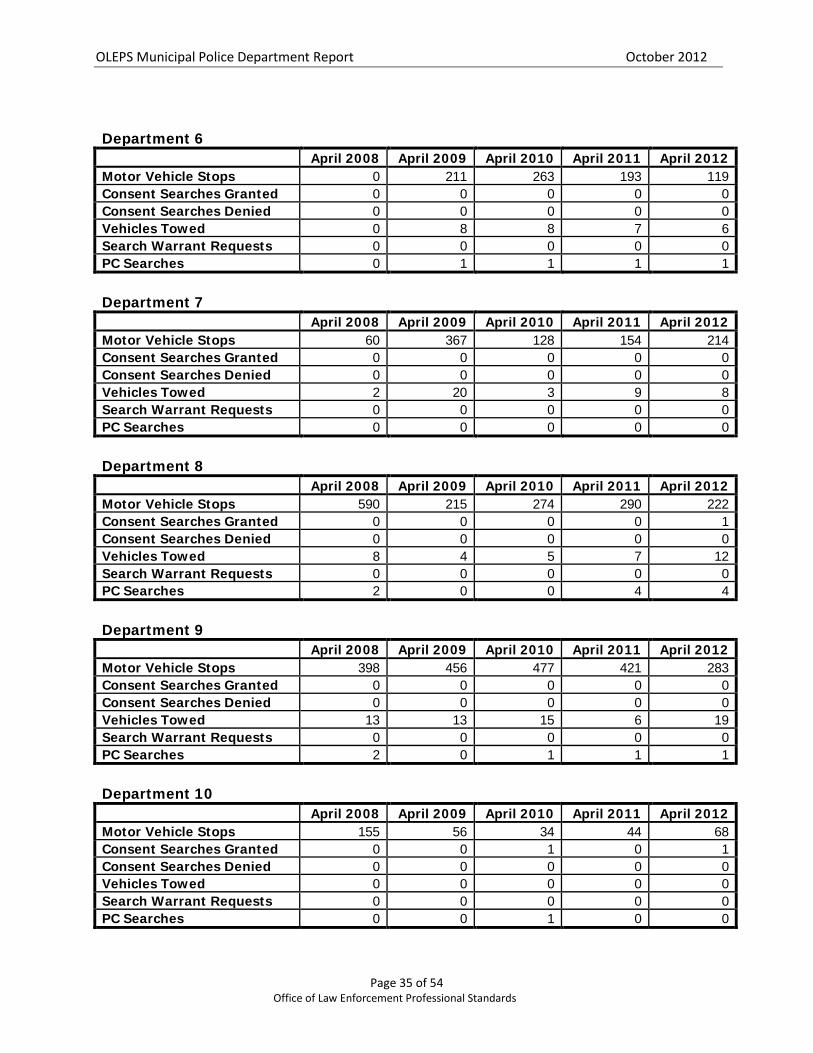
Department 6
April 2008 April 2009 April 2010 April 2011 April 2012
Motor Vehicle Stops 0 211 263 193 119 Consent Searches Granted 0 0 0 0 0 Consent Searches Denied 0 0 0 0 0 Vehicles Towed 0 8 8 7 6 Search Warrant Requests 0 0 0 0 0 PC Searches 0 1 1 1 1
Department 7
April 2008 April 2009 April 2010 April 2011 April 2012 Motor Vehicle Stops 60 367 128 154 214 Consent Searches Granted 0 0 0 0 0 Consent Searches Denied 0 0 0 0 0 Vehicles Towed 2 20 3 9 8 Search Warrant Requests 0 0 0 0 0 PC Searches 0 0 0 0 0
Department 8
April 2008 April 2009 April 2010 April 2011 April 2012
Motor Vehicle Stops 590 215 274 290 222 Consent Searches Granted 0 0 0 0 1 Consent Searches Denied 0 0 0 0 0 Vehicles Towed 8 4 5 7 12 Search Warrant Requests 0 0 0 0 0 PC Searches 2 0 0 4 4
Department 9
April 2008 April 2009 April 2010 April 2011 April 2012
Motor Vehicle Stops 398 456 477 421 283 Consent Searches Granted 0 0 0 0 0 Consent Searches Denied 0 0 0 0 0 Vehicles Towed 13 13 15 6 19 Search Warrant Requests 0 0 0 0 0 PC Searches 2 0 1 1 1
Department 10
April 2008 April 2009 April 2010 April 2011 April 2012
Motor Vehicle Stops 155 56 34 44 68 Consent Searches Granted 0 0 1 0 1 Consent Searches Denied 0 0 0 0 0 Vehicles Towed 0 0 0 0 0 Search Warrant Requests 0 0 0 0 0 PC Searches 0 0 1 0 0

OLEPS Municipal Police Department Report October 2012
Page 36 of 54 Office of Law Enforcement Professional Standards
Department 11
April 2008 April 2009 April 2010 April 2011 April 2012
Motor Vehicle Stops 875 794 548 817 827 Consent Searches Granted 0 0 0 1 4 Consent Searches Denied 0 0 0 0 0 Vehicles Towed 0 2 2 4 2 Search Warrant Requests 0 0 0 0 0 PC Searches 2 2 0 1 3
Department 12
April 2008 April 2009 April 2010 April 2011 April 2012
Motor Vehicle Stops 571 432 616 486 435 Consent Searches Granted 0 3 8 5 2 Consent Searches Denied 0 0 0 0 0 Vehicles Towed 4 5 5 4 1 Search Warrant Requests 0 0 0 0 0 PC Searches 0 2 5 6 3
Department 13
April 2008 April 2009 April 2010 April 2011 April 2012
Motor Vehicle Stops 250 162 139 203 435 Consent Searches Granted 0 0 0 0 0 Consent Searches Denied 0 0 0 0 0 Vehicles Towed 7 4 2 2 6 Search Warrant Requests 0 0 0 0 0 PC Searches 2 2 2 2 3
Department 14
April 2008 April 2009 April 2010 April 2011 April 2012
Motor Vehicle Stops 252 143 113 224 149 Consent Searches Granted 0 0 0 2 0 Consent Searches Denied 0 0 0 0 0 Vehicles Towed 1 0 0 2 0 Search Warrant Requests 0 0 0 0 0 PC Searches 0 0 0 0 0
Department 15
April 2008 April 2009 April 2010 April 2011 April 2012
Motor Vehicle Stops 313 223 328 370 515 Consent Searches Granted 0 0 0 1 1 Consent Searches Denied 0 0 0 0 2 Vehicles Towed 4 5 2 6 12 Search Warrant Requests 0 2 0 0 0 PC Searches 0 0 1 0 0

OLEPS Municipal Police Department Report October 2012
Page 37 of 54 Office of Law Enforcement Professional Standards
Department 16
April 2008 April 2009 April 2010 April 2011 April 2012
Motor Vehicle Stops 371 443 322 363 237 Consent Searches Granted 4 10 1 2 0 Consent Searches Denied 0 0 0 0 0 Vehicles Towed 0 0 0 10 2 Search Warrant Requests 0 0 0 0 0 PC Searches 1 6 0 1 0
Department 17
April 2008 April 2009 April 2010 April 2011 April 2012
Motor Vehicle Stops 232 326 293 413 593 Consent Searches Granted 0 1 0 2 2 Consent Searches Denied 0 0 0 0 0 Vehicles Towed 6 3 11 17 17 Search Warrant Requests 0 0 0 0 0 PC Searches 0 1 2 4 3
Department 18
April 2008 April 2009 April 2010 April 2011 April 2012
Motor Vehicle Stops 0 0 562 541 896 Consent Searches Granted 0 0 15 9 11 Consent Searches Denied 0 0 0 1 1 Vehicles Towed 0 0 5 8 7 Search Warrant Requests 0 0 0 3 1 PC Searches 0 0 21 10 10
Department 19
April 2008 April 2009 April 2010 April 2011 April 2012
Motor Vehicle Stops 98 496 523 460 454 Consent Searches Granted 1 0 3 2 1 Consent Searches Denied 0 1 0 1 0 Vehicles Towed 2 6 12 27 11 Search Warrant Requests 1 0 0 0 1 PC Searches 0 0 0 0 1
Department 20
April 2008 April 2009 April 2010 April 2011 April 2012
Motor Vehicle Stops 0 0 0 0 1,643 Consent Searches Granted 0 0 0 3 20 Consent Searches Denied 0 0 0 1 1 Vehicles Towed 0 0 45 45 50 Search Warrant Requests 0 0 0 0 0 PC Searches 0 0 0 0 0
OLEPS Municipal Police Department Report October 2012
Page 38 of 54 Office of Law Enforcement Professional Standards
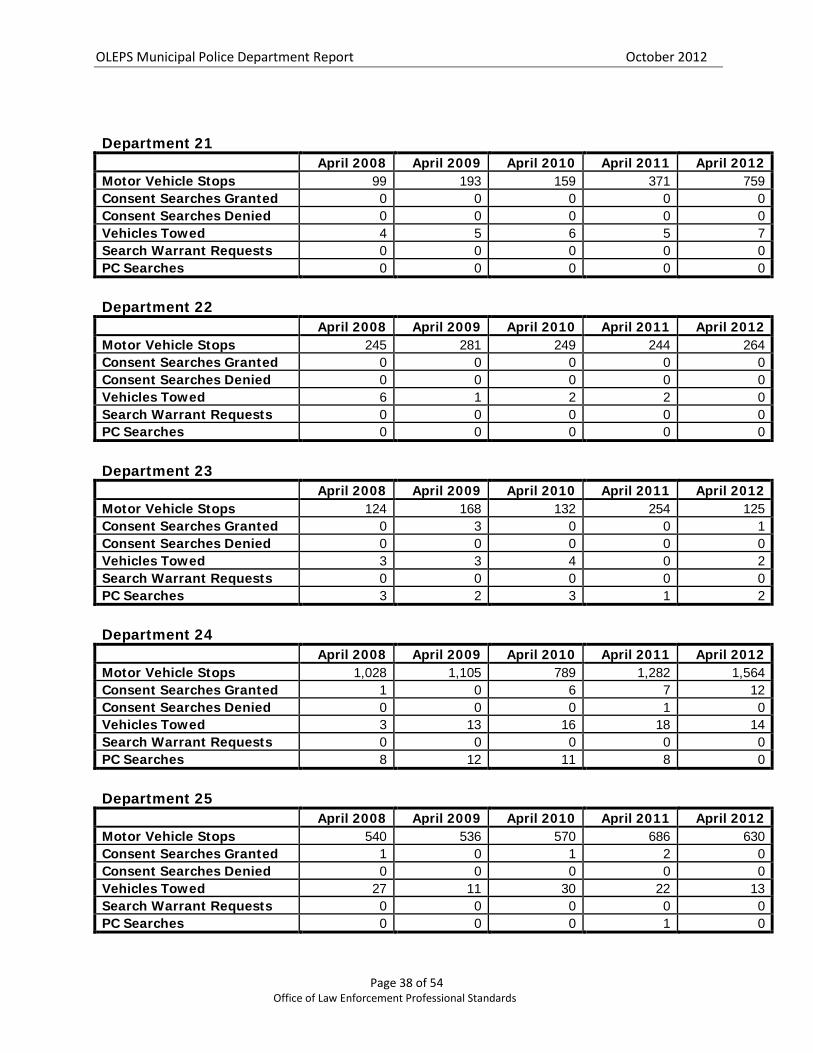
Department 21
April 2008 April 2009 April 2010 April 2011 April 2012 Motor Vehicle Stops 99 193 159 371 759 Consent Searches Granted 0 0 0 0 0 Consent Searches Denied 0 0 0 0 0 Vehicles Towed 4 5 6 5 7 Search Warrant Requests 0 0 0 0 0 PC Searches 0 0 0 0 0
Department 22
April 2008 April 2009 April 2010 April 2011 April 2012
Motor Vehicle Stops 245 281 249 244 264 Consent Searches Granted 0 0 0 0 0 Consent Searches Denied 0 0 0 0 0 Vehicles Towed 6 1 2 2 0 Search Warrant Requests 0 0 0 0 0 PC Searches 0 0 0 0 0
Department 23
April 2008 April 2009 April 2010 April 2011 April 2012
Motor Vehicle Stops 124 168 132 254 125 Consent Searches Granted 0 3 0 0 1 Consent Searches Denied 0 0 0 0 0 Vehicles Towed 3 3 4 0 2 Search Warrant Requests 0 0 0 0 0 PC Searches 3 2 3 1 2
Department 24
April 2008 April 2009 April 2010 April 2011 April 2012
Motor Vehicle Stops 1,028 1,105 789 1,282 1,564 Consent Searches Granted 1 0 6 7 12 Consent Searches Denied 0 0 0 1 0 Vehicles Towed 3 13 16 18 14 Search Warrant Requests 0 0 0 0 0 PC Searches 8 12 11 8 0
Department 25
April 2008 April 2009 April 2010 April 2011 April 2012
Motor Vehicle Stops 540 536 570 686 630 Consent Searches Granted 1 0 1 2 0 Consent Searches Denied 0 0 0 0 0 Vehicles Towed 27 11 30 22 13 Search Warrant Requests 0 0 0 0 0 PC Searches 0 0 0 1 0

OLEPS Municipal Police Department Report October 2012
Page 39 of 54 Office of Law Enforcement Professional Standards
Department 26
April 2008 April 2009 April 2010 April 2011 April 2012 Motor Vehicle Stops 489 610 298 453 364 Consent Searches Granted 0 1 0 2 2 Consent Searches Denied 0 0 0 0 0 Vehicles Towed 1 1 8 7 2 Search Warrant Requests 0 0 0 0 0 PC Searches 0 0 0 0 0
Department 27
April 2008 April 2009 April 2010 April 2011 April 2012
Motor Vehicle Stops 89 54 130 102 189 Consent Searches Granted 0 0 1 1 0 Consent Searches Denied 0 0 0 0 0 Vehicles Towed 0 1 0 0 1 Search Warrant Requests 0 0 0 0 0 PC Searches 0 0 0 0 0
Department 28
April 2008 April 2009 April 2010 April 2011 April 2012
Motor Vehicle Stops 202 219 278 253 311 Consent Searches Granted 0 2 1 1 1 Consent Searches Denied 0 0 0 0 0 Vehicles Towed 4 7 5 3 3 Search Warrant Requests 0 0 0 0 0 PC Searches 0 0 1 0 1
Department 29
April 2008 April 2009 April 2010 April 2011 April 2012
Motor Vehicle Stops 172 318 425 332 361 Consent Searches Granted 0 0 0 0 3 Consent Searches Denied 0 0 0 0 0 Vehicles Towed 5 10 11 14 5 Search Warrant Requests 0 0 0 0 0 PC Searches 0 1 0 1 0
Department 30
April 2008 April 2009 April 2010 April 2011 April 2012
Motor Vehicle Stops 180 87 129 105 120 Consent Searches Granted 0 0 0 0 1 Consent Searches Denied 0 0 0 0 0 Vehicles Towed 6 5 2 8 12 Search Warrant Requests 0 0 0 0 0 PC Searches 9 4 4 14 27

OLEPS Municipal Police Department Report October 2012
Page 40 of 54 Office of Law Enforcement Professional Standards
Department 31
April 2008 April 2009 April 2010 April 2011 April 2012 Motor Vehicle Stops 1,065 956 901 833 1,681 Consent Searches Granted 17 15 9 11 16 Consent Searches Denied 0 0 0 0 0 Vehicles Towed 0 18 10 19 23 Search Warrant Requests 0 0 0 0 1 PC Searches 0 21 4 7 13
Department 32
April 2008 April 2009 April 2010 April 2011 April 2012
Motor Vehicle Stops 111 76 69 108 130 Consent Searches Granted 0 0 0 0 0 Consent Searches Denied 0 0 0 0 0 Vehicles Towed 22 14 18 17 22 Search Warrant Requests 0 0 0 0 0 PC Searches 0 0 0 0 0
Department 33
April 2008 April 2009 April 2010 April 2011 April 2012
Motor Vehicle Stops 122 110 128 273 109 Consent Searches Granted 0 0 1 2 0 Consent Searches Denied 0 0 0 0 0 Vehicles Towed 1 5 3 11 2 Search Warrant Requests 0 0 0 0 0 PC Searches 0 0 0 0 0
Department 34
April 2008 April 2009 April 2010 April 2011 April 2012
Motor Vehicle Stops 929 593 584 444 356 Consent Searches Granted 0 0 2 0 4 Consent Searches Denied 0 1 0 0 0 Vehicles Towed 8 8 9 12 4 Search Warrant Requests 0 1 0 0 0 PC Searches 2 5 3 3 0
Department 35
April 2008 April 2009 April 2010 April 2011 April 2012
Motor Vehicle Stops 182 226 249 316 98 Consent Searches Granted 1 1 4 4 2 Consent Searches Denied 0 0 0 0 0 Vehicles Towed 0 0 0 0 0 Search Warrant Requests 0 0 0 0 0 PC Searches 3 5 5 5 2

OLEPS Municipal Police Department Report October 2012
Page 41 of 54 Office of Law Enforcement Professional Standards
Department 36
April 2008 April 2009 April 2010 April 2011 April 2012
Motor Vehicle Stops 174 207 220 133 122 Consent Searches Granted 0 0 0 0 0 Consent Searches Denied 0 0 0 0 0 Vehicles Towed 2 6 9 1 7 Search Warrant Requests 0 0 1 0 0 PC Searches 0 0 0 0 0
Department 37
April 2008 April 2009 April 2010 April 2011 April 2012
Motor Vehicle Stops 182 168 153 175 226 Consent Searches Granted 0 0 0 0 0 Consent Searches Denied 0 0 0 0 0 Vehicles Towed 1 6 3 3 0 Search Warrant Requests 0 0 0 0 0 PC Searches 0 0 0 0 0
Department 38
April 2008 April 2009 April 2010 April 2011 April 2012
Motor Vehicle Stops 487 685 512 410 505 Consent Searches Granted 0 1 0 0 1 Consent Searches Denied 0 0 0 0 0 Vehicles Towed 28 22 17 18 20 Search Warrant Requests 0 0 2 0 0 PC Searches 0 0 2 0 0
Department 39
April 2008 April 2009 April 2010 April 2011 April 2012
Motor Vehicle Stops 1,125 1,066 1,181 739 868 Consent Searches Granted 6 3 6 7 3 Consent Searches Denied 1 1 0 0 0 Vehicles Towed 1 1 0 0 0 Search Warrant Requests 1 1 0 0 0 PC Searches 0 0 0 0 0
Department 40
April 2008 April 2009 April 2010 April 2011 April 2012
Motor Vehicle Stops 560 731 660 339 359 Consent Searches Granted 0 0 0 0 0 Consent Searches Denied 0 0 0 0 0 Vehicles Towed 138 136 238 147 123 Search Warrant Requests 0 0 0 0 0 PC Searches 0 0 0 0 0

OLEPS Municipal Police Department Report October 2012
Page 42 of 54 Office of Law Enforcement Professional Standards
Department 41
April 2008 April 2009 April 2010 April 2011 April 2012 Motor Vehicle Stops 803 604 633 938 956 Consent Searches Granted 9 3 0 9 3 Consent Searches Denied 0 0 0 0 0 Vehicles Towed 1 0 2 3 0 Search Warrant Requests 0 0 0 0 0 PC Searches 0 0 3 2 2
Department 42
April 2008 April 2009 April 2010 April 2011 April 2012
Motor Vehicle Stops 191 218 73 117 113 Consent Searches Granted 0 0 0 2 0 Consent Searches Denied 0 0 0 0 0 Vehicles Towed 5 3 35 26 33 Search Warrant Requests 0 0 0 0 0 PC Searches 0 1 0 1 0
Department 43
April 2008 April 2009 April 2010 April 2011 April 2012
Motor Vehicle Stops 45 67 2 9 35 Consent Searches Granted 0 0 0 0 0 Consent Searches Denied 0 0 0 0 0 Vehicles Towed 0 0 0 0 0 Search Warrant Requests 0 0 0 0 0 PC Searches 0 0 0 0 0
Department 44
April 2008 April 2009 April 2010 April 2011 April 2012
Motor Vehicle Stops 144 103 90 196 273 Consent Searches Granted 0 9 0 2 3 Consent Searches Denied 0 0 0 0 0 Vehicles Towed 5 5 7 11 4 Search Warrant Requests 0 1 0 0 0 PC Searches 8 13 3 4 4
Department 45
April 2008 April 2009 April 2010 April 2011 April 2012
Motor Vehicle Stops 384 669 1,356 450 631 Consent Searches Granted 0 2 2 0 3 Consent Searches Denied 0 0 0 0 0 Vehicles Towed 20 33 63 39 29 Search Warrant Requests 0 0 0 0 0 PC Searches 0 0 0 0 0
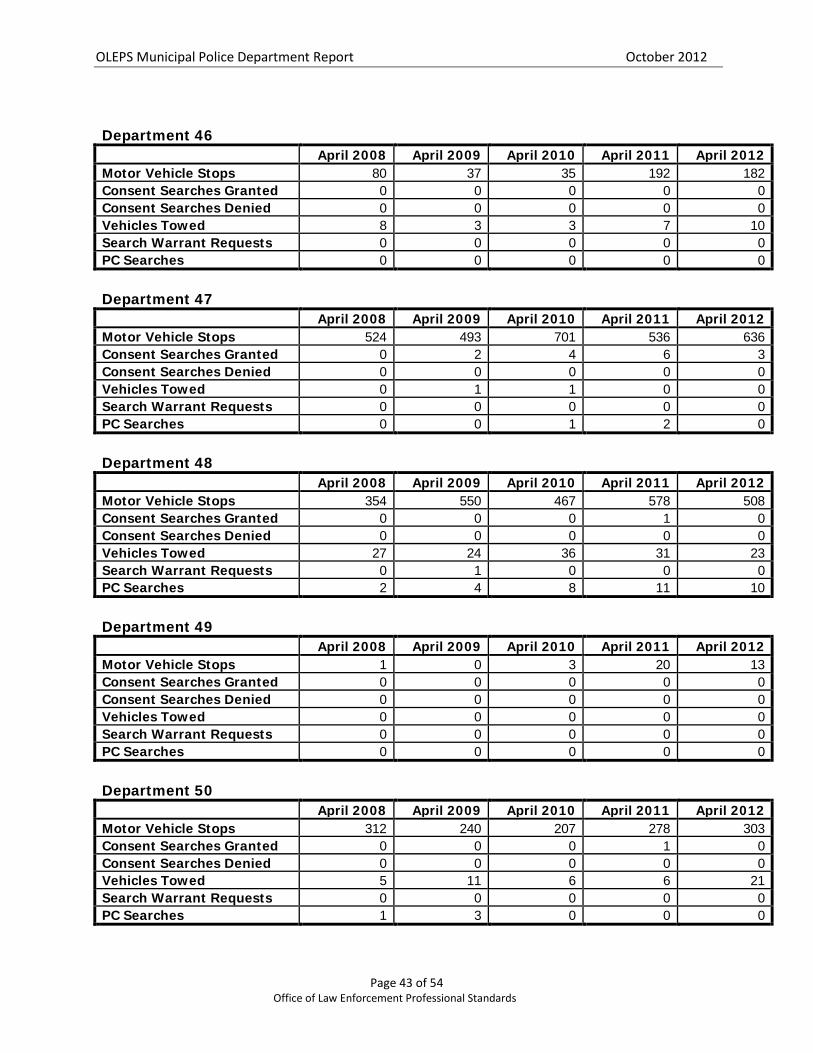
OLEPS Municipal Police Department Report October 2012
Page 43 of 54 Office of Law Enforcement Professional Standards
Department 46
April 2008 April 2009 April 2010 April 2011 April 2012
Motor Vehicle Stops 80 37 35 192 182 Consent Searches Granted 0 0 0 0 0 Consent Searches Denied 0 0 0 0 0 Vehicles Towed 8 3 3 7 10 Search Warrant Requests 0 0 0 0 0 PC Searches 0 0 0 0 0
Department 47
April 2008 April 2009 April 2010 April 2011 April 2012
Motor Vehicle Stops 524 493 701 536 636 Consent Searches Granted 0 2 4 6 3 Consent Searches Denied 0 0 0 0 0 Vehicles Towed 0 1 1 0 0 Search Warrant Requests 0 0 0 0 0 PC Searches 0 0 1 2 0
Department 48
April 2008 April 2009 April 2010 April 2011 April 2012
Motor Vehicle Stops 354 550 467 578 508 Consent Searches Granted 0 0 0 1 0 Consent Searches Denied 0 0 0 0 0 Vehicles Towed 27 24 36 31 23 Search Warrant Requests 0 1 0 0 0 PC Searches 2 4 8 11 10
Department 49
April 2008 April 2009 April 2010 April 2011 April 2012
Motor Vehicle Stops 1 0 3 20 13 Consent Searches Granted 0 0 0 0 0 Consent Searches Denied 0 0 0 0 0 Vehicles Towed 0 0 0 0 0 Search Warrant Requests 0 0 0 0 0 PC Searches 0 0 0 0 0
Department 50
April 2008 April 2009 April 2010 April 2011 April 2012
Motor Vehicle Stops 312 240 207 278 303 Consent Searches Granted 0 0 0 1 0 Consent Searches Denied 0 0 0 0 0 Vehicles Towed 5 11 6 6 21 Search Warrant Requests 0 0 0 0 0 PC Searches 1 3 0 0 0

OLEPS Municipal Police Department Report October 2012
Page 44 of 54 Office of Law Enforcement Professional Standards
Department 51
April 2008 April 2009 April 2010 April 2011 April 2012
Motor Vehicle Stops 485 369 393 324 301 Consent Searches Granted 0 1 2 1 1 Consent Searches Denied 0 0 0 0 0 Vehicles Towed 1 1 1 1 1 Search Warrant Requests 0 0 0 0 1 PC Searches 2 2 1 1 1
Department 52
April 2008 April 2009 April 2010 April 2011 April 2012
Motor Vehicle Stops 1,568 1,285 978 853 570 Consent Searches Granted 6 1 2 1 2 Consent Searches Denied 0 0 0 0 0 Vehicles Towed 1 1 3 0 1 Search Warrant Requests 0 0 0 0 0 PC Searches 2 4 5 4 1
Department 53
April 2008 April 2009 April 2010 April 2011 April 2012
Motor Vehicle Stops 1,824 1,619 1,164 842 885 Consent Searches Granted 1 6 7 5 4 Consent Searches Denied 0 1 0 0 0 Vehicles Towed 19 21 11 17 11 Search Warrant Requests 0 1 0 0 0 PC Searches 0 1 0 2 0
Department 54
April 2008 April 2009 April 2010 April 2011 April 2012
Motor Vehicle Stops 792 539 760 1,047 1,074 Consent Searches Granted 3 0 5 8 9 Consent Searches Denied 0 0 0 0 0 Vehicles Towed 13 1 3 10 2 Search Warrant Requests 0 0 0 0 0 PC Searches 20 8 7 2 1
Department 55
April 2008 April 2009 April 2010 April 2011 April 2012
Motor Vehicle Stops 251 222 261 227 141 Consent Searches Granted 0 0 0 0 1 Consent Searches Denied 0 0 0 0 0 Vehicles Towed 0 1 0 2 1 Search Warrant Requests 0 0 0 0 0 PC Searches 0 0 0 0 0

OLEPS Municipal Police Department Report October 2012
Page 45 of 54 Office of Law Enforcement Professional Standards
Department 56
April 2008 April 2009 April 2010 April 2011 April 2012
Motor Vehicle Stops 811 759 752 426 666 Consent Searches Granted 0 1 0 0 0 Consent Searches Denied 0 0 0 0 0 Vehicles Towed 4 20 8 2 21 Search Warrant Requests 0 0 0 0 0 PC Searches 0 0 1 0 0
Department 57
April 2008 April 2009 April 2010 April 2011 April 2012
Motor Vehicle Stops 428 392 302 233 279 Consent Searches Granted 0 0 3 2 0 Consent Searches Denied 0 0 0 0 0 Vehicles Towed 6 6 10 0 13 Search Warrant Requests 0 0 0 0 0 PC Searches 0 0 0 0 0
Department 58
April 2008 April 2009 April 2010 April 2011 April 2012
Motor Vehicle Stops 406 153 411 772 422 Consent Searches Granted 0 0 2 6 7 Consent Searches Denied 0 0 0 1 0 Vehicles Towed 11 12 19 23 15 Search Warrant Requests 0 0 0 0 0 PC Searches 8 9 5 14 6
Department 59
April 2008 April 2009 April 2010 April 2011 April 2012
Motor Vehicle Stops 60 127 304 124 184 Consent Searches Granted 0 0 0 1 0 Consent Searches Denied 0 0 0 0 0 Vehicles Towed 1 1 0 4 4 Search Warrant Requests 0 0 0 0 0 PC Searches 0 0 1 2 0
Department 60
April 2008 April 2009 April 2010 April 2011 April 2012
Motor Vehicle Stops 74 8 12 4 8 Consent Searches Granted 0 0 0 0 0 Consent Searches Denied 0 0 0 0 0 Vehicles Towed 0 0 0 0 0 Search Warrant Requests 0 0 0 0 0 PC Searches 0 0 0 0 0
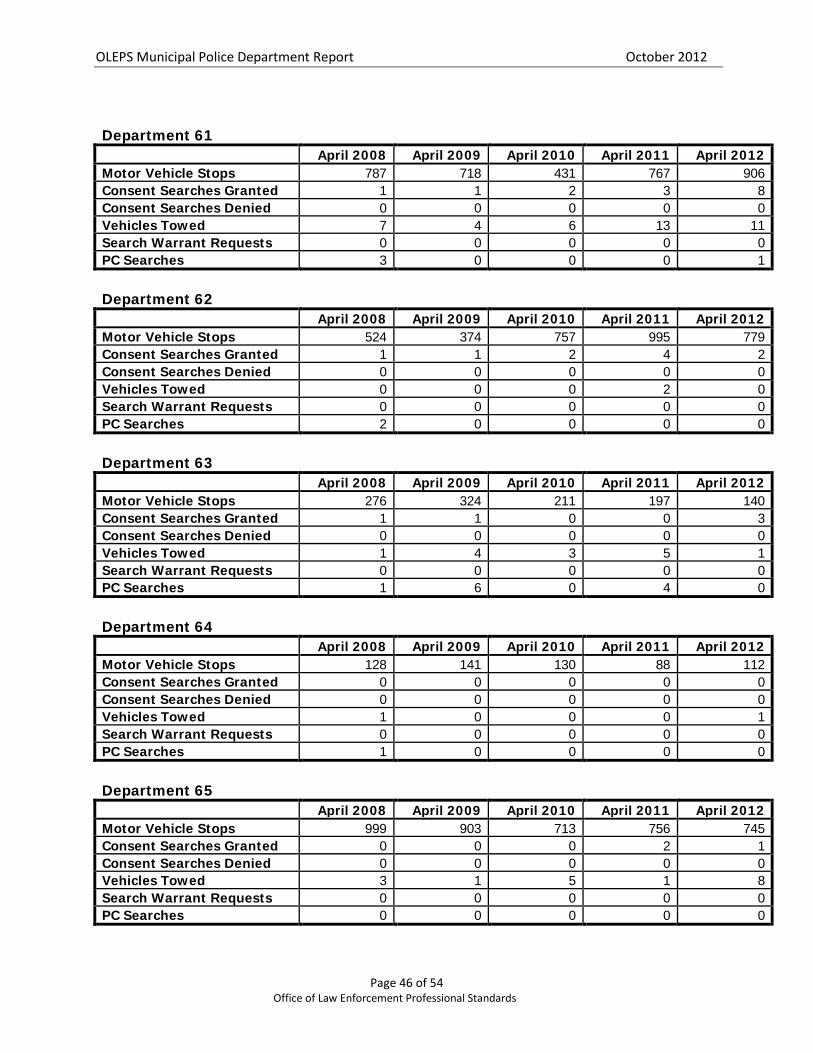
OLEPS Municipal Police Department Report October 2012
Page 46 of 54 Office of Law Enforcement Professional Standards
Department 61
April 2008 April 2009 April 2010 April 2011 April 2012
Motor Vehicle Stops 787 718 431 767 906 Consent Searches Granted 1 1 2 3 8 Consent Searches Denied 0 0 0 0 0 Vehicles Towed 7 4 6 13 11 Search Warrant Requests 0 0 0 0 0 PC Searches 3 0 0 0 1
Department 62
April 2008 April 2009 April 2010 April 2011 April 2012
Motor Vehicle Stops 524 374 757 995 779 Consent Searches Granted 1 1 2 4 2 Consent Searches Denied 0 0 0 0 0 Vehicles Towed 0 0 0 2 0 Search Warrant Requests 0 0 0 0 0 PC Searches 2 0 0 0 0
Department 63
April 2008 April 2009 April 2010 April 2011 April 2012
Motor Vehicle Stops 276 324 211 197 140 Consent Searches Granted 1 1 0 0 3 Consent Searches Denied 0 0 0 0 0 Vehicles Towed 1 4 3 5 1 Search Warrant Requests 0 0 0 0 0 PC Searches 1 6 0 4 0
Department 64
April 2008 April 2009 April 2010 April 2011 April 2012
Motor Vehicle Stops 128 141 130 88 112 Consent Searches Granted 0 0 0 0 0 Consent Searches Denied 0 0 0 0 0 Vehicles Towed 1 0 0 0 1 Search Warrant Requests 0 0 0 0 0 PC Searches 1 0 0 0 0
Department 65
April 2008 April 2009 April 2010 April 2011 April 2012
Motor Vehicle Stops 999 903 713 756 745 Consent Searches Granted 0 0 0 2 1 Consent Searches Denied 0 0 0 0 0 Vehicles Towed 3 1 5 1 8 Search Warrant Requests 0 0 0 0 0 PC Searches 0 0 0 0 0

OLEPS Municipal Police Department Report October 2012
Page 47 of 54 Office of Law Enforcement Professional Standards
Department 66
April 2008 April 2009 April 2010 April 2011 April 2012
Motor Vehicle Stops 212 101 193 148 174 Consent Searches Granted 0 1 1 1 0 Consent Searches Denied 0 0 0 0 0 Vehicles Towed 0 0 3 1 0 Search Warrant Requests 0 0 0 0 0 PC Searches 0 0 0 0 0
Department 67
April 2008 April 2009 April 2010 April 2011 April 2012
Motor Vehicle Stops 1,115 1,118 869 848 915 Consent Searches Granted 6 8 7 5 8 Consent Searches Denied 1 0 0 0 0 Vehicles Towed 22 11 25 10 18 Search Warrant Requests 0 0 0 0 0 PC Searches 7 6 6 4 2
Department 68
April 2008 April 2009 April 2010 April 2011 April 2012
Motor Vehicle Stops 196 109 147 112 110 Consent Searches Granted 0 1 0 0 1 Consent Searches Denied 0 0 0 0 0 Vehicles Towed 4 4 4 2 4 Search Warrant Requests 0 0 0 0 0 PC Searches 1 0 0 2 0
Department 69
April 2008 April 2009 April 2010 April 2011 April 2012
Motor Vehicle Stops 418 312 336 566 673 Consent Searches Granted 2 5 3 11 23 Consent Searches Denied 2 0 0 1 1 Vehicles Towed 18 19 19 21 18 Search Warrant Requests 1 0 2 0 1 PC Searches 15 21 19 7 5
Department 70
April 2008 April 2009 April 2010 April 2011 April 2012
Motor Vehicle Stops 1,401 695 1,026 1,260 330 Consent Searches Granted 0 0 0 1 1 Consent Searches Denied 0 0 0 0 0 Vehicles Towed 96 115 101 162 60 Search Warrant Requests 0 0 0 0 0 PC Searches 4 1 8 1 0
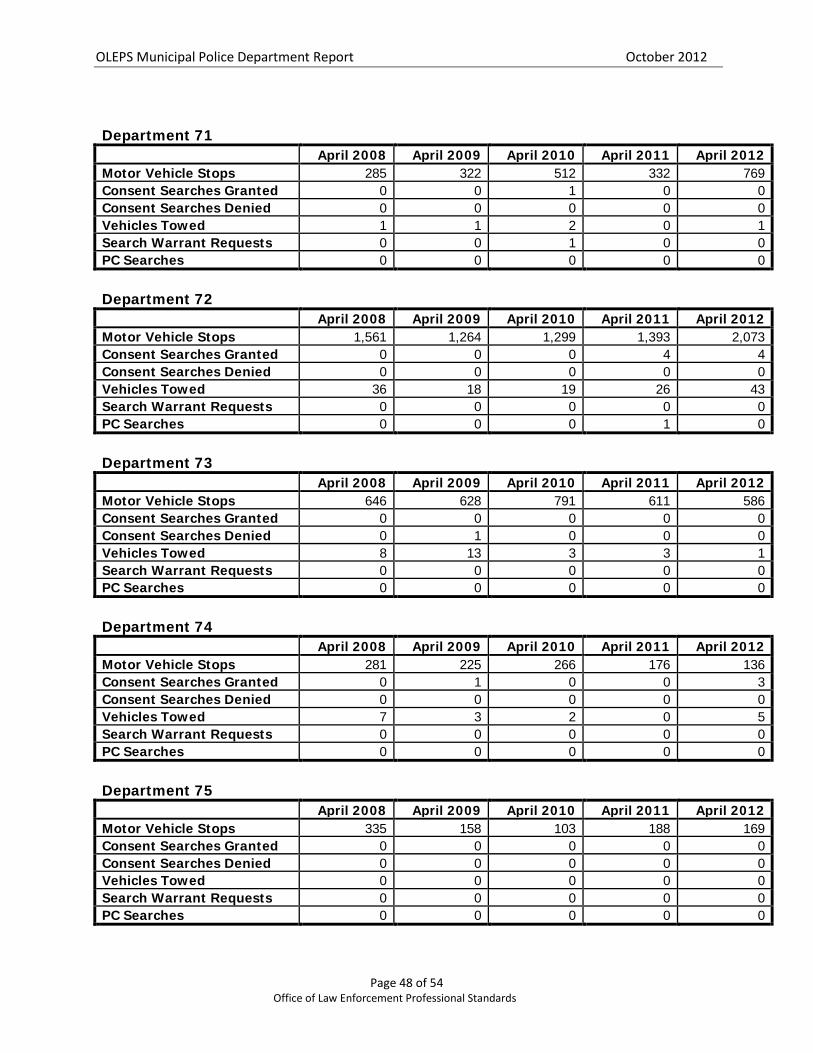
OLEPS Municipal Police Department Report October 2012
Page 48 of 54 Office of Law Enforcement Professional Standards
Department 71
April 2008 April 2009 April 2010 April 2011 April 2012
Motor Vehicle Stops 285 322 512 332 769 Consent Searches Granted 0 0 1 0 0 Consent Searches Denied 0 0 0 0 0 Vehicles Towed 1 1 2 0 1 Search Warrant Requests 0 0 1 0 0 PC Searches 0 0 0 0 0
Department 72
April 2008 April 2009 April 2010 April 2011 April 2012
Motor Vehicle Stops 1,561 1,264 1,299 1,393 2,073 Consent Searches Granted 0 0 0 4 4 Consent Searches Denied 0 0 0 0 0 Vehicles Towed 36 18 19 26 43 Search Warrant Requests 0 0 0 0 0 PC Searches 0 0 0 1 0
Department 73
April 2008 April 2009 April 2010 April 2011 April 2012
Motor Vehicle Stops 646 628 791 611 586 Consent Searches Granted 0 0 0 0 0 Consent Searches Denied 0 1 0 0 0 Vehicles Towed 8 13 3 3 1 Search Warrant Requests 0 0 0 0 0 PC Searches 0 0 0 0 0
Department 74
April 2008 April 2009 April 2010 April 2011 April 2012
Motor Vehicle Stops 281 225 266 176 136 Consent Searches Granted 0 1 0 0 3 Consent Searches Denied 0 0 0 0 0 Vehicles Towed 7 3 2 0 5 Search Warrant Requests 0 0 0 0 0 PC Searches 0 0 0 0 0
Department 75
April 2008 April 2009 April 2010 April 2011 April 2012
Motor Vehicle Stops 335 158 103 188 169 Consent Searches Granted 0 0 0 0 0 Consent Searches Denied 0 0 0 0 0 Vehicles Towed 0 0 0 0 0 Search Warrant Requests 0 0 0 0 0 PC Searches 0 0 0 0 0
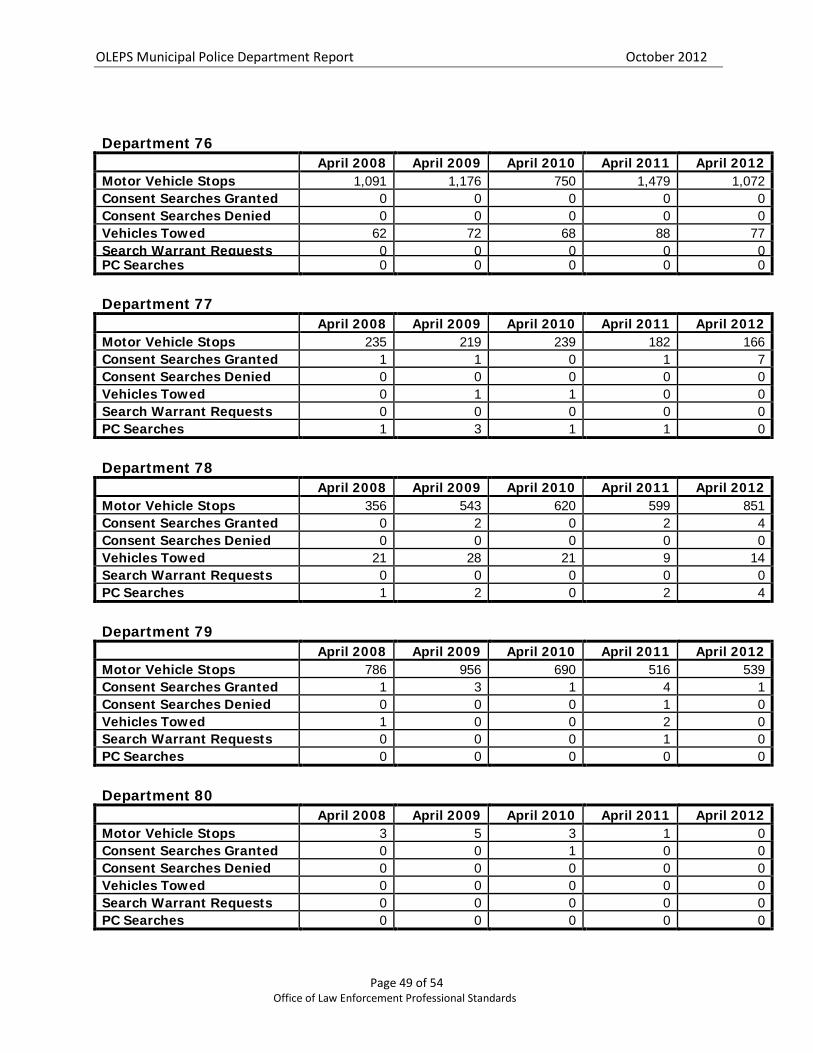
OLEPS Municipal Police Department Report October 2012
Page 49 of 54 Office of Law Enforcement Professional Standards
Department 76
April 2008 April 2009 April 2010 April 2011 April 2012
Motor Vehicle Stops 1,091 1,176 750 1,479 1,072 Consent Searches Granted 0 0 0 0 0 Consent Searches Denied 0 0 0 0 0 Vehicles Towed 62 72 68 88 77 Search Warrant Requests 0 0 0 0 0 PC Searches 0 0 0 0 0
Department 77
April 2008 April 2009 April 2010 April 2011 April 2012
Motor Vehicle Stops 235 219 239 182 166 Consent Searches Granted 1 1 0 1 7 Consent Searches Denied 0 0 0 0 0 Vehicles Towed 0 1 1 0 0 Search Warrant Requests 0 0 0 0 0 PC Searches 1 3 1 1 0
Department 78
April 2008 April 2009 April 2010 April 2011 April 2012
Motor Vehicle Stops 356 543 620 599 851 Consent Searches Granted 0 2 0 2 4 Consent Searches Denied 0 0 0 0 0 Vehicles Towed 21 28 21 9 14 Search Warrant Requests 0 0 0 0 0 PC Searches 1 2 0 2 4
Department 79
April 2008 April 2009 April 2010 April 2011 April 2012
Motor Vehicle Stops 786 956 690 516 539 Consent Searches Granted 1 3 1 4 1 Consent Searches Denied 0 0 0 1 0 Vehicles Towed 1 0 0 2 0 Search Warrant Requests 0 0 0 1 0 PC Searches 0 0 0 0 0
Department 80
April 2008 April 2009 April 2010 April 2011 April 2012
Motor Vehicle Stops 3 5 3 1 0 Consent Searches Granted 0 0 1 0 0 Consent Searches Denied 0 0 0 0 0 Vehicles Towed 0 0 0 0 0 Search Warrant Requests 0 0 0 0 0 PC Searches 0 0 0 0 0

OLEPS Municipal Police Department Report October 2012
Page 50 of 54 Office of Law Enforcement Professional Standards
Department 81
April 2008 April 2009 April 2010 April 2011 April 2012
Motor Vehicle Stops 279 58 229 170 96 Consent Searches Granted 1 1 0 0 0 Consent Searches Denied 0 0 0 0 0 Vehicles Towed 15 5 7 7 5 Search Warrant Requests 0 0 0 0 0 PC Searches 0 0 0 0 0
Department 82
April 2008 April 2009 April 2010 April 2011 April 2012
Motor Vehicle Stops 764 533 378 287 325 Consent Searches Granted 10 7 5 10 5 Consent Searches Denied 2 0 0 0 0 Vehicles Towed 32 14 9 10 20 Search Warrant Requests 1 0 1 0 0 PC Searches 6 0 0 0 0
Department 83
April 2008 April 2009 April 2010 April 2011 April 2012
Motor Vehicle Stops 479 489 249 203 184 Consent Searches Granted 0 0 0 1 0 Consent Searches Denied 0 0 0 0 0 Vehicles Towed 0 1 0 0 0 Search Warrant Requests 0 0 0 0 0 PC Searches 0 0 0 0 0
Department 84
April 2008 April 2009 April 2010 April 2011 April 2012
Motor Vehicle Stops 837 705 896 561 669 Consent Searches Granted 4 4 2 7 11 Consent Searches Denied 0 0 0 0 0 Vehicles Towed 31 43 38 65 42 Search Warrant Requests 0 0 0 0 0 PC Searches 2 7 4 0 1
Department 85
April 2008 April 2009 April 2010 April 2011 April 2012
Motor Vehicle Stops 414 297 277 184 155 Consent Searches Granted 1 0 1 1 2 Consent Searches Denied 0 0 0 0 0 Vehicles Towed 9 6 9 4 5 Search Warrant Requests 0 0 0 0 0 PC Searches 1 0 1 1 1

OLEPS Municipal Police Department Report October 2012
Page 51 of 54 Office of Law Enforcement Professional Standards
Department 86
April 2008 April 2009 April 2010 April 2011 April 2012
Motor Vehicle Stops 98 86 128 86 131 Consent Searches Granted 1 0 2 0 1 Consent Searches Denied 0 0 1 0 0 Vehicles Towed 2 5 8 6 4 Search Warrant Requests 0 0 0 0 0 PC Searches 0 0 1 0 0
Department 87
April 2008 April 2009 April 2010 April 2011 April 2012
Motor Vehicle Stops 537 524 313 366 320 Consent Searches Granted 0 1 4 4 2 Consent Searches Denied 0 0 1 0 0 Vehicles Towed 23 40 14 19 14 Search Warrant Requests 0 0 0 0 0 PC Searches 2 1 0 1 0
Department 88
April 2008 April 2009 April 2010 April 2011 April 2012
Motor Vehicle Stops 141 192 132 102 106 Consent Searches Granted 0 0 0 1 0 Consent Searches Denied 0 0 0 0 0 Vehicles Towed 6 8 4 7 7 Search Warrant Requests 0 0 1 0 0 PC Searches 1 0 1 2 1
Department 89
April 2008 April 2009 April 2010 April 2011 April 2012
Motor Vehicle Stops 199 163 341 209 240 Consent Searches Granted 0 0 0 0 0 Consent Searches Denied 0 0 0 0 0 Vehicles Towed 3 6 11 5 4 Search Warrant Requests 0 0 0 0 0 PC Searches 3 4 9 4 4
Department 90
April 2008 April 2009 April 2010 April 2011 April 2012
Motor Vehicle Stops 148 179 397 302 199 Consent Searches Granted 0 0 0 0 0 Consent Searches Denied 0 0 0 0 0 Vehicles Towed 29 40 32 35 27 Search Warrant Requests 0 0 0 0 1 PC Searches 3 2 3 0 1
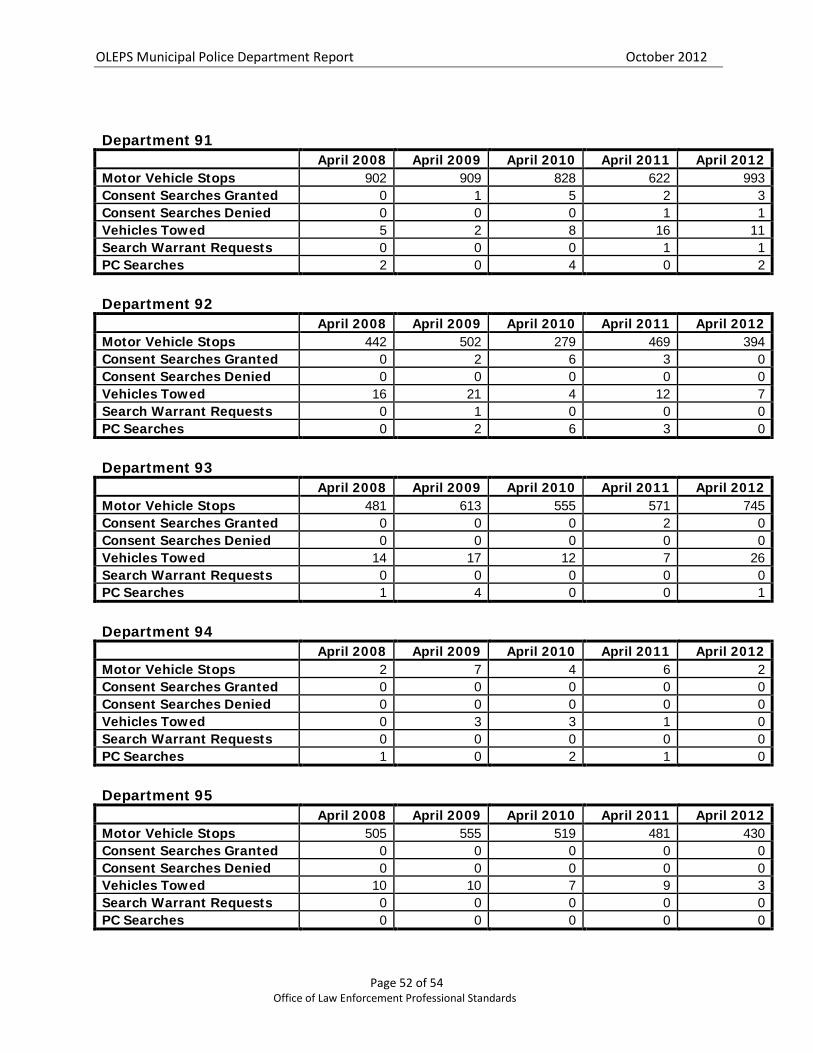
OLEPS Municipal Police Department Report October 2012
Page 52 of 54 Office of Law Enforcement Professional Standards
Department 91
April 2008 April 2009 April 2010 April 2011 April 2012
Motor Vehicle Stops 902 909 828 622 993 Consent Searches Granted 0 1 5 2 3 Consent Searches Denied 0 0 0 1 1 Vehicles Towed 5 2 8 16 11 Search Warrant Requests 0 0 0 1 1 PC Searches 2 0 4 0 2
Department 92
April 2008 April 2009 April 2010 April 2011 April 2012
Motor Vehicle Stops 442 502 279 469 394 Consent Searches Granted 0 2 6 3 0 Consent Searches Denied 0 0 0 0 0 Vehicles Towed 16 21 4 12 7 Search Warrant Requests 0 1 0 0 0 PC Searches 0 2 6 3 0
Department 93
April 2008 April 2009 April 2010 April 2011 April 2012
Motor Vehicle Stops 481 613 555 571 745 Consent Searches Granted 0 0 0 2 0 Consent Searches Denied 0 0 0 0 0 Vehicles Towed 14 17 12 7 26 Search Warrant Requests 0 0 0 0 0 PC Searches 1 4 0 0 1
Department 94
April 2008 April 2009 April 2010 April 2011 April 2012
Motor Vehicle Stops 2 7 4 6 2 Consent Searches Granted 0 0 0 0 0 Consent Searches Denied 0 0 0 0 0 Vehicles Towed 0 3 3 1 0 Search Warrant Requests 0 0 0 0 0 PC Searches 1 0 2 1 0
Department 95
April 2008 April 2009 April 2010 April 2011 April 2012
Motor Vehicle Stops 505 555 519 481 430 Consent Searches Granted 0 0 0 0 0 Consent Searches Denied 0 0 0 0 0 Vehicles Towed 10 10 7 9 3 Search Warrant Requests 0 0 0 0 0 PC Searches 0 0 0 0 0
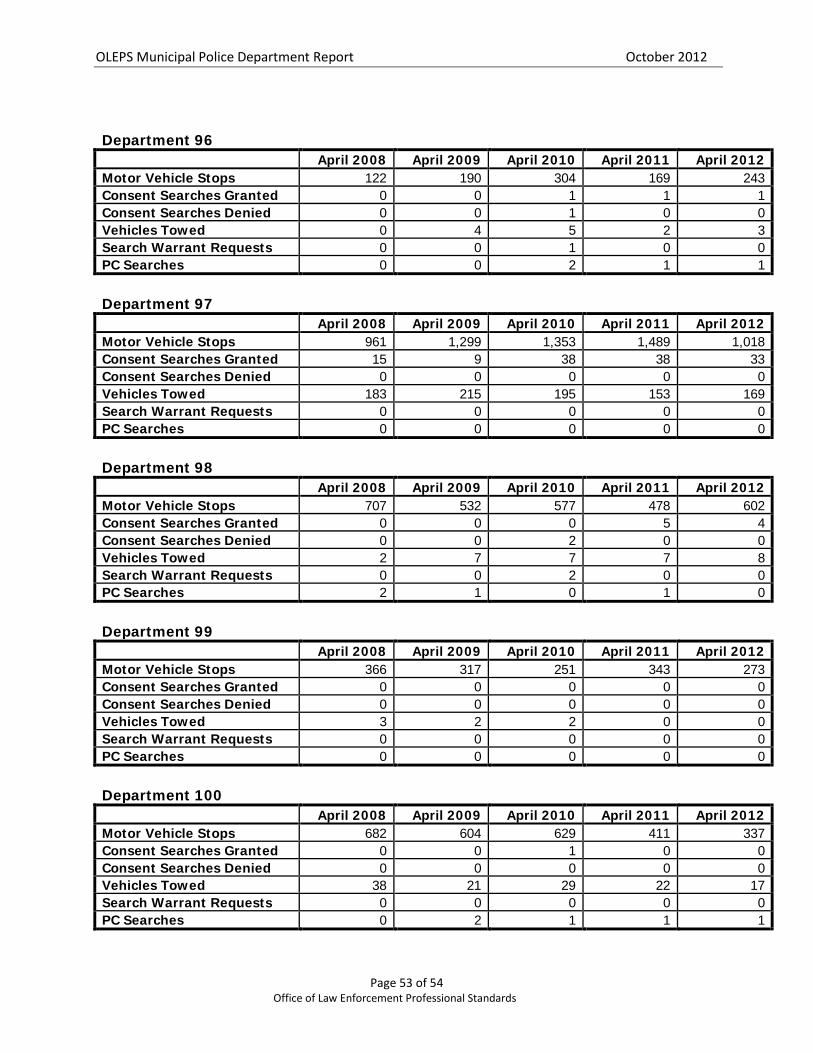
OLEPS Municipal Police Department Report October 2012
Page 53 of 54 Office of Law Enforcement Professional Standards
Department 96
April 2008 April 2009 April 2010 April 2011 April 2012
Motor Vehicle Stops 122 190 304 169 243 Consent Searches Granted 0 0 1 1 1 Consent Searches Denied 0 0 1 0 0 Vehicles Towed 0 4 5 2 3 Search Warrant Requests 0 0 1 0 0 PC Searches 0 0 2 1 1
Department 97
April 2008 April 2009 April 2010 April 2011 April 2012
Motor Vehicle Stops 961 1,299 1,353 1,489 1,018 Consent Searches Granted 15 9 38 38 33 Consent Searches Denied 0 0 0 0 0 Vehicles Towed 183 215 195 153 169 Search Warrant Requests 0 0 0 0 0 PC Searches 0 0 0 0 0
Department 98
April 2008 April 2009 April 2010 April 2011 April 2012
Motor Vehicle Stops 707 532 577 478 602 Consent Searches Granted 0 0 0 5 4 Consent Searches Denied 0 0 2 0 0 Vehicles Towed 2 7 7 7 8 Search Warrant Requests 0 0 2 0 0 PC Searches 2 1 0 1 0
Department 99
April 2008 April 2009 April 2010 April 2011 April 2012
Motor Vehicle Stops 366 317 251 343 273 Consent Searches Granted 0 0 0 0 0 Consent Searches Denied 0 0 0 0 0 Vehicles Towed 3 2 2 0 0 Search Warrant Requests 0 0 0 0 0 PC Searches 0 0 0 0 0
Department 100
April 2008 April 2009 April 2010 April 2011 April 2012
Motor Vehicle Stops 682 604 629 411 337 Consent Searches Granted 0 0 1 0 0 Consent Searches Denied 0 0 0 0 0 Vehicles Towed 38 21 29 22 17 Search Warrant Requests 0 0 0 0 0 PC Searches 0 2 1 1 1
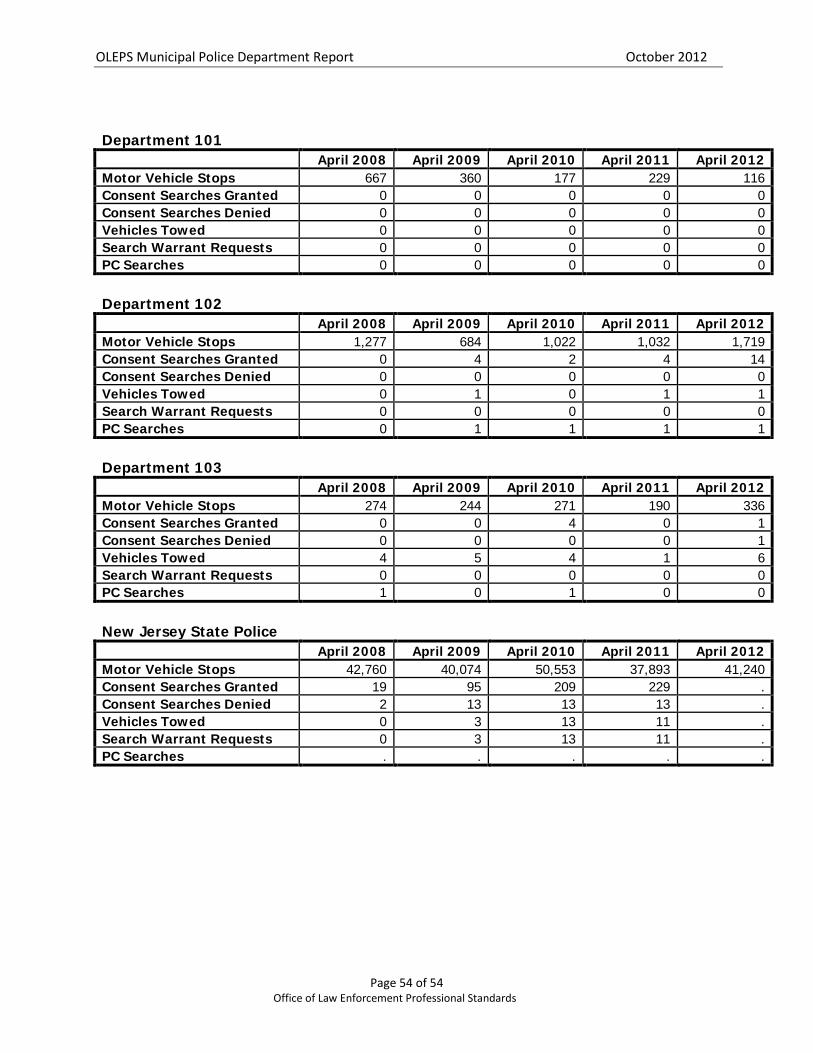
OLEPS Municipal Police Department Report October 2012
Page 54 of 54 Office of Law Enforcement Professional Standards
Department 101
April 2008 April 2009 April 2010 April 2011 April 2012
Motor Vehicle Stops 667 360 177 229 116 Consent Searches Granted 0 0 0 0 0 Consent Searches Denied 0 0 0 0 0 Vehicles Towed 0 0 0 0 0 Search Warrant Requests 0 0 0 0 0 PC Searches 0 0 0 0 0
Department 102
April 2008 April 2009 April 2010 April 2011 April 2012
Motor Vehicle Stops 1,277 684 1,022 1,032 1,719 Consent Searches Granted 0 4 2 4 14 Consent Searches Denied 0 0 0 0 0 Vehicles Towed 0 1 0 1 1 Search Warrant Requests 0 0 0 0 0 PC Searches 0 1 1 1 1
Department 103
April 2008 April 2009 April 2010 April 2011 April 2012
Motor Vehicle Stops 274 244 271 190 336 Consent Searches Granted 0 0 4 0 1 Consent Searches Denied 0 0 0 0 1 Vehicles Towed 4 5 4 1 6 Search Warrant Requests 0 0 0 0 0 PC Searches 1 0 1 0 0
New Jersey State Police
April 2008 April 2009 April 2010 April 2011 April 2012
Motor Vehicle Stops 42,760 40,074 50,553 37,893 41,240 Consent Searches Granted 19 95 209 229 . Consent Searches Denied 2 13 13 13 . Vehicles Towed 0 3 13 11 . Search Warrant Requests 0 3 13 11 . PC Searches . . . . .