older people in acute care - healthcare improvement scotland
TRANSCRIPT

Older People in Acute CareData Review and Cost Analysis - NHS Ayrshire & Arran
A pathway for frail older people in the emergency department

© Healthcare Improvement Scotland 2016First published March 2016Report written by Stewart Cardwell, Edward Clifton and Penny Bond.
All images contained within this publication were sourced from the NHSScotland Photo Library and are covered by © Crown copyright.
The contents of this document may be copied or reproduced for use within NHSScotland, or for educational, personal or non-commercial research purposes only. Commercial organisations must obtain written permission from Healthcare Improvement Scotland before copying or reproducing any part of this document.
www.healthcareimprovementscotland.org
Acknowledgements
The authors of this report would like to thank all those who have supported and contributed to this work. This includes:
• QuEST who funded this analysis• Dr Rowan Wallace and colleagues from NHS Ayrshire &
Arran who implemented the pathway, and• the Improving Older People’s Acute Care Team,
Healthcare Improvement Scotland.
3
ContentsIntroduction 5
Pilot study: May 2013 6
Assessment methodology 7
Results 10
Discussion 20
Conclusion 21
Appendix 1: Frail older people’s pathway 22
Appendix 2: Extension of patient journey analysis 24
Appendix 3: Additional results noted for out of hours admissions 25
Appendix 4: List of abbreviations 26

4
Patient pathway for frail older people within an emergency department
Economic evaluation
University Hospital Crosshouse, Ayrshire, Scotland£
Report focus
Key messages
• Analyses of unplanned emergency admissions showed that frail patients stayed in hospital longer, were more likely than others to be admitted to a non-specialist bed, and did not have rapid access to a Comprehensive Geriatric Assessment.
• A multidisciplinary team provided a ‘front door’ assessment of all over 65s with frailty, using a frailty index developed at University Hospital Crosshouse. Patients identified as frail then entered the frail older people’s pathway developed in the hospital.
• Over the six months during while the pathway was in place in 2014, compared to the previous year:
− the overall admission rate for all over 65s fell from 68.1% to 66.4% − there were 232 patients coded as avoided admissions owing to the pathway − the overall re-attendance rate for all over 65s fell from 26.1% to 17.9%, and − the overall readmission rate for all over 65s fell from 16.3% to 11.6%.
• For the frail patients admitted to the pathway following assessment, the improvements in the above outcomes were greater still.
• An economic evaluation was carried out to assess the cost impact of the pathway, taking into account the impact on the following: patient length of stay, ward of admission, avoided admissions, re-attendance rates and readmission rates.
• The results demonstrated a potential annual resource saving associated with the pathway of £4.6million.
5
Introduction
Frailty is a complex, multidimensional problem that affects all ages. It is defined as an inability to withstand illness which can cause decompensation, loss of function and disability.
There is a growing evidence base to support rapid identification and comprehensive assessment of individuals with frailty in order to deliver the best possible outcomes for them.
As part of the improving older people’s acute care programme, Healthcare Improvement Scotland worked with teams in a number of Scotland’s NHS boards to test a range of approaches to identifying and managing frailty. In April 2014, a ‘Think Frailty’ report highlighted work to identify frailty and ensure rapid Comprehensive Geriatric Assessment (CGA) in four NHS boards across Scotland including NHS Ayrshire & Arran1. This report provides a more detailed data review and cost analysis of that work.
University Hospital Crosshouse (UHC) is a large district general hospital located just outside Kilmarnock, Ayrshire. This 640-bedded facility provides a wide range of services, including maternity and paediatric inpatient services for Ayrshire. It is the main accident and emergency facility for North and East Ayrshire.
By the winter of 2012, NHS Ayrshire & Arran had significantly enhanced its Intermediate Care and Enablement Service (IC&ES). This community service offers an alternative to acute hospital admission and provides access to CGA. Despite this, unplanned emergency admissions to the two acute sites in NHS Ayrshire & Arran continued to increase.
During December 2012, an analysis over a 10-day period of unplanned emergency admissions to UHC uncovered significant issues in terms of the management of frailty. Frail patients stayed in hospital longer, were more likely than others to be admitted to a non-specialist bed and did not have rapid access to CGA.
A review of admissions data from 2001/02 to 2011/12 showed the number of over 75 year olds admitted to hospital increased each year, as did the time these individuals spent in acute hospital beds. People over 65 represent the minority of emergency department (ED) attendances, but form the majority of those admitted to hospital. They also spend longer in the ED than younger attendees. The results were negative outcomes that often involved ED re-attendance and acute hospital readmission for frail patients and a negative impact on other hospital services from delayed discharges and disruptions to the complexity of the flow of older patients through the hospital.
The data demonstrated a clear need to reduce unplanned admissions and deal more appropriately with older patients in order to reduce the time they spent in hospital.
1Healthcare Improvement Scotland. Improving the identification and management of frailty: a case study report of innovation on four acute sites in NHSScotland [online]. 2014 [cited 2015 Jun 15]; Available from: www.knowledge.scot.nhs.uk/improvingcareforolderpeople/resources.aspx

6
Pilot study: May 2013
A multidisciplinary team based in UHC ED embarked on a short pilot project of ‘front door’ assessment of all over 65 year olds with frailty. The core team included:
• consultant geriatrician• consultant in emergency medicine• emergency department nursing staff• specialist nurses from IC&ES• elderly mental health liaison nurse• local GP• pharmacist• physiotherapist• advanced nurse practitioner, and• administrative staff.
The pilot project took place between 9am–5pm over one week in mid-May 2013 during which the multidisciplinary team worked from the front desk in the ED with access to eight care-of-the-elderly inpatient beds and two 23-hour beds in the clinical decisions unit (CDU) adjacent to the ED. No additional financial resources were allocated to the project, with all contributions from team members taking place within existing contracted time.
The team used a frailty index to screen all over 65 year olds who attended the ED between the hours of 9am–5pm, Monday to Friday and to identify patients for further assessment by the multidisciplinary team. Screening took place as soon as people arrived at the hospital.
The modified early warning score (MEWS) is a scoring system designed to indicate the severity of a patient’s condition. In the pilot study, it provided a marker of the individual’s current burden of ill health.
The team automatically excluded patients who had suffered a stroke, needed a high level of care (ITU or high dependency) or if they were on renal dialysis because these individuals have a well-defined care pathway and rapid access to specialist beds. For all other patients, the team applied the index case by case, excluding those with an obvious requirement for specialist care other than CGA, such as recent chemotherapy or a myocardial infarction.
Patients identified as frail then entered the frail elderly pathway developed in the hospital. Following initial screening, the team checked for delirium or cognitive impairment using the 4A test. A crucial part of the pathway is a multidisciplinary team discussion of all the people identified as frail in the initial assessment.
Continuation of initial pilotBased on the positive results (for example, more appropriate admissions, lower associated costs) of the week-long pilot, it was agreed to extend the testing of a frail older people’s Pathway (FOPP) within the UHC ED for a further 6 months in 2014. The pathway can be found in Appendix 1.
Data were collected during this period to allow an assessment of the impact of the FOPP to be carried out, using a control group from the equivalent 6 months in 2013 when the pathway was not present – this would help ensure that like-for-like data were being compared. Although the main focus of the impact assessment is on the comparative 6-month data, it is worth noting that the FOPP was kept in place for 20-months in total - for more details on the 20-month data, see Appendix 2.

7
Assessment methodology
There were two main areas of focus for the assessment of the FOPP: analysis of the patient journey and economic evaluation.
Patient journey analysisThe objective was to develop a clear understanding of the impact of an ED-focused team reviewing patients over 65 years of age. The key measures to be reviewed and compared were:
• patient outcomes (including avoided admissions)
• ED journey times• ED re-attendance• hospital readmission, and• length of stay (LoS).
Data were collected over a 6-month period from January–June 2014. To minimise the risk of chance and bias affecting the analysis, 2013 baseline data for the old pathway are from the same time period during the previous year (Figure 1).
Beyond the comparison between all over 65s assessed during the 2014 data period versus all over 65s assessed during the 2013 data period, the analysis was further broken down by the following FOPP screening subgroups; those who were assessed as suitable for the new pathway (hereafter referred to as ‘FOPP YES’), those that were assessed and deemed not suitable for the new pathway (hereafter ‘FOPP NO’), and those who did not meet the FOPP criteria (hereafter ‘Excluded from FOPP’).
The intention was to drill down into all available datasets extracting key measures and assessing any correlation and or trending detail discovered. This allowed the FOPP core team and analytical support to develop new methodology as the data review progressed.
The monthly ED attendances in Figure 1 show that the two datasets appear comparable in size and proportion.
In 2013, the sub-total of 7,977 attendances from January–June represented 22.3% of the total ED attendances and, in 2014, the 8,084 attendances represented 21.7% of the total. Although an increase of 1.3% was noted, the proportion of attendances remained similar.

8
Figure 1: Comparison between 2013 and 2014 ED attendance data to illustrate similarity between datasets
9
Economic evaluationIn order to assess the complexity and ultimately cost impact of the new pathway for frail elderly patients, an economic evaluation was carried out in the form of a cost minimisation analysis which facilitated a comparison between the costs associated with the introduction of the FOPP versus the same costs associated with the old pathway (that is, the existing pathway before the Change Programme).
The cost minimisation analysis assumes that non-monetary consequences, for example patient and family experience, will remain the same before and after the introduction of the new pathway. If the pathway also resulted in improvements in non-monetary consequences, the analysis may be considered conservative in that it underestimates its overall value.
The economic model incorporated a detailed patient journey analyses of all over 65 year olds arriving at UHC ED when the multidisciplinary team was in place (9am – 5pm).
By merging three core datasets from 2014, it was possible to track a patient journey from ED attendance, processing by FOPP staff, and onward inpatient episodes through UHC to ultimate discharge. As such, the model took into account the number of bed moves for each patient, the respective LoS for each, and ward bed allocation by specialty.
These three datasets were:
• a Symphony Management System (ED PMS) extract
• a manually loaded Excel database monitoring patient journey through the FOPP, and
• a core Patient Management System (PMS) extract showing the patient journey through all wards and calculating LoS.
The 2013 control group used only the ED PMS and core PMS extracts as the FOPP did not exist in the control data.
By calculating the LoS by ward for each patient and the associated NHS bed day cost for each individual ward, it was possible to estimate an average cost per admission for the patients in each group. It was anticipated that the results would indicate process variation between the groups – using cost as a proxy for complexity of patient journey (that is, wards of higher acuity costing considerably more than step-down beds).
As well as an overall comparison between the 2014 data period and the 2013 control group, the model would also help assess any variance across three FOPP screening subgroups: FOPP YES, FOPP NO and those excluded from FOPP. All three of these subgroups could then be compared with the 2013 control group.

10
Results
Patient journey analysisAdmissions versus discharges
Figure 2 below shows the number and proportion of over 65 year old patients admitted versus discharged across the 6-month periods in 2013 and 2014. The results are then broken down by the FOPP screening subgroups to allow further comparison of the impact of the FOPP.
Figure 2: Admission and discharge comparison between 2013 control group and 2014 FOPP data
2013 2014 all FOPP YES FOPP NO Excluded from FOPP
No. % No. % No. % No. % No. %Admitted 5432 68.1 5366 66.4 536 63.4 925 75.1 3905 65.0Discharged 2362 29.6 2494 30.9 288 34.1 286 23.2 1920 32.0Other 183 2.3 224 2.7 21 2.5 20 4.7 183 3.0Total 7977 8084 845 1231 6008
In 2013, the admission rate for the over 65s patient group was 68.1% alongside a discharge rate of 29.6%. While the FOPP was in place in 2014, the overall admission rate for over 65s fell to 66.4% and the discharge rate increased to 30.9%. The admission and discharge rates broken down by each of the three FOPP screening subgroups, in comparison with 2013, show the following:
• 3.1% reduction in the admission rate and a 2.4% increase in the discharge rate of patients not reviewed by the FOPP
• 7.0% increase in the admission rate and a 6.4% reduction in the discharge rate of those patients assessed for the FOPP but not placed on the pathway, and
• 4.7% reduction in the admission rate and a 4.5% increase in the discharge rate of patients assessed and placed on the FOPP.
It appears that the FOPP patients are impacted by the pathway in the desired ways. The three screening subgroups created by review and assessment each show a different result in the two key outcomes of admission and discharge. It appears that breaking down the complexity of the flow of this patient group has the benefit of identified likely demand for both inpatient care and discharge management, for example workforce and support services.

11
Avoided admissions
It was intended that a key measure of the impact of FOPP intervention would be that of avoided admission. This was simply a measure that was based on agreeing that if a FOPP discharged patient had not been placed on the pathway, they would normally have been admitted.
In the 6 months of the pathway, 232 patients were discharged from the pathway and coded as avoided admissions, from a total assessed of 2,076; this is 11.2% of patients assessed by FOPP and 2.9% of all patients attending.
Re-attendance
As shown in Figure 3, the re-attendance figures have dropped from 26.1% in 2013 to 17.9% in 2014. A breakdown of each of the three screening subgroups’ re-attendance rates, after FOPP review, is also shown in Figure 3.
Figure 3: Comparison in re-attendances between 2013 control group and 2014 FOPP data
2013 2014 all FOPP YES FOPP NO Excluded from FOPP
First visit 5893 6636 777 1158 4701Re-attendance 2084 1448 68 73 1307% re-attend 26.1% 17.9% 8.0% 5.9% 21.8%
Broken down by the three FOPP screening subgroups, re-attendance rates, in comparison with 2013, show the following:
• 4.3% reduction in the re-attendance of patients not reviewed by the FOPP• 20.2% reduction in the re-attendance of those patients assessed for the FOPP but not placed on
the pathway, and• 18.1% reduction in the patients assessed and placed on the FOPP.
This demonstrates that the breakdown of the initial 8.2% re-attendance reduction from 2013 to 2014 lies across each subgroup but in differing amounts. The patients not assessed whilst seeing a reduction was the least whereas the two subgroups involving the FOPP team’s assessment and care provision shows between 18.1% and 20.2% less re-attendance across the 6-month time period.

12
Readmission
Figure 4 shows the 28-day readmission figures for the over 65 year old patient group, where there is an overall 4.7% reduction from 16.3% in 2013 to 11.6% in 2014. A breakdown of each of the three screening subgroups’ readmission rates, after FOPP review, is also shown in Figure 4.
Figure 4: Comparison in 28-day readmissions between 2013 control group and 2014 FOPP data
2013 2014 all FOPP YES FOPP NO Excluded from FOPP
First admit 4547 4746 493 828 3426Readmit 885 620 43 97 480% readmit 16.3% 11.6% 8.0% 10.5% 12.3%
As seen previously with across the FOPP screening subgroups, we continue to see differing results. The readmission rates, in comparison with 2013, show a:
• 4.0% reduction in the readmission of patients not reviewed by the FOPP• 5.8% reduction in the readmission of those patients assessed for the FOPP but not placed on the
pathway, and• 8.3% reduction in the readmission of patients assessed and placed on the FOPP.
This has been broken down further to review 0–7 day readmission alongside 8–28 day readmission, in keeping with the pilot analysis in figures 5 and 6 below.
The 0–7 day readmission rate has dropped across all screening subgroups to between 2.4% and 3.2%, having been 7.4% in 2013 (see Figure 5).
Figure 5: Comparison in 7-day readmissions between 2013 control group and 2014 FOPP data
2013 2014 all FOPP YES FOPP NO Excluded from FOPP
First admit 4547 4746 493 828 3426Readmit 402 138 17 26 95% readmit 7.4% 2.6% 3.2% 2.8% 2.4%
13
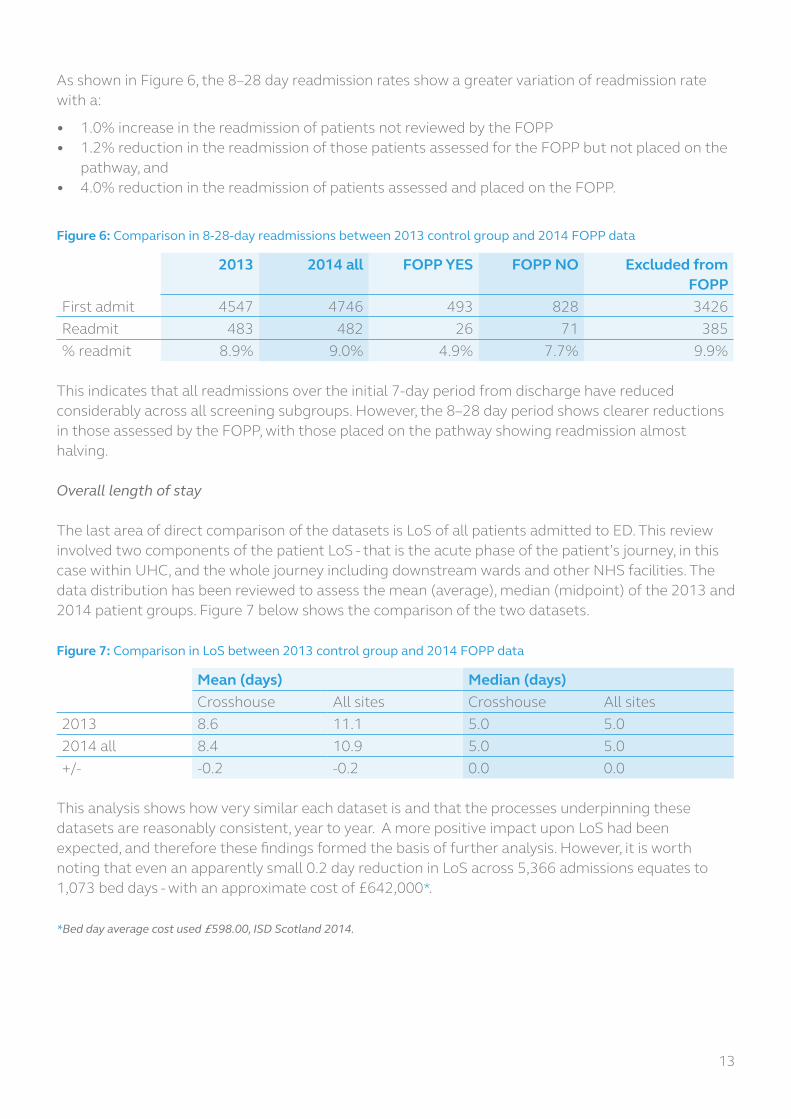
As shown in Figure 6, the 8–28 day readmission rates show a greater variation of readmission rate with a:
• 1.0% increase in the readmission of patients not reviewed by the FOPP• 1.2% reduction in the readmission of those patients assessed for the FOPP but not placed on the
pathway, and• 4.0% reduction in the readmission of patients assessed and placed on the FOPP.
Figure 6: Comparison in 8-28-day readmissions between 2013 control group and 2014 FOPP data
2013 2014 all FOPP YES FOPP NO Excluded from FOPP
First admit 4547 4746 493 828 3426Readmit 483 482 26 71 385% readmit 8.9% 9.0% 4.9% 7.7% 9.9%
This indicates that all readmissions over the initial 7-day period from discharge have reduced considerably across all screening subgroups. However, the 8–28 day period shows clearer reductions in those assessed by the FOPP, with those placed on the pathway showing readmission almost halving.
Overall length of stay
The last area of direct comparison of the datasets is LoS of all patients admitted to ED. This review involved two components of the patient LoS - that is the acute phase of the patient’s journey, in this case within UHC, and the whole journey including downstream wards and other NHS facilities. The data distribution has been reviewed to assess the mean (average), median (midpoint) of the 2013 and 2014 patient groups. Figure 7 below shows the comparison of the two datasets.
Figure 7: Comparison in LoS between 2013 control group and 2014 FOPP data
Mean (days) Median (days)Crosshouse All sites Crosshouse All sites
2013 8.6 11.1 5.0 5.02014 all 8.4 10.9 5.0 5.0+/- -0.2 -0.2 0.0 0.0
This analysis shows how very similar each dataset is and that the processes underpinning these datasets are reasonably consistent, year to year. A more positive impact upon LoS had been expected, and therefore these findings formed the basis of further analysis. However, it is worth noting that even an apparently small 0.2 day reduction in LoS across 5,366 admissions equates to 1,073 bed days - with an approximate cost of £642,000*.
*Bed day average cost used £598.00, ISD Scotland 2014.
14
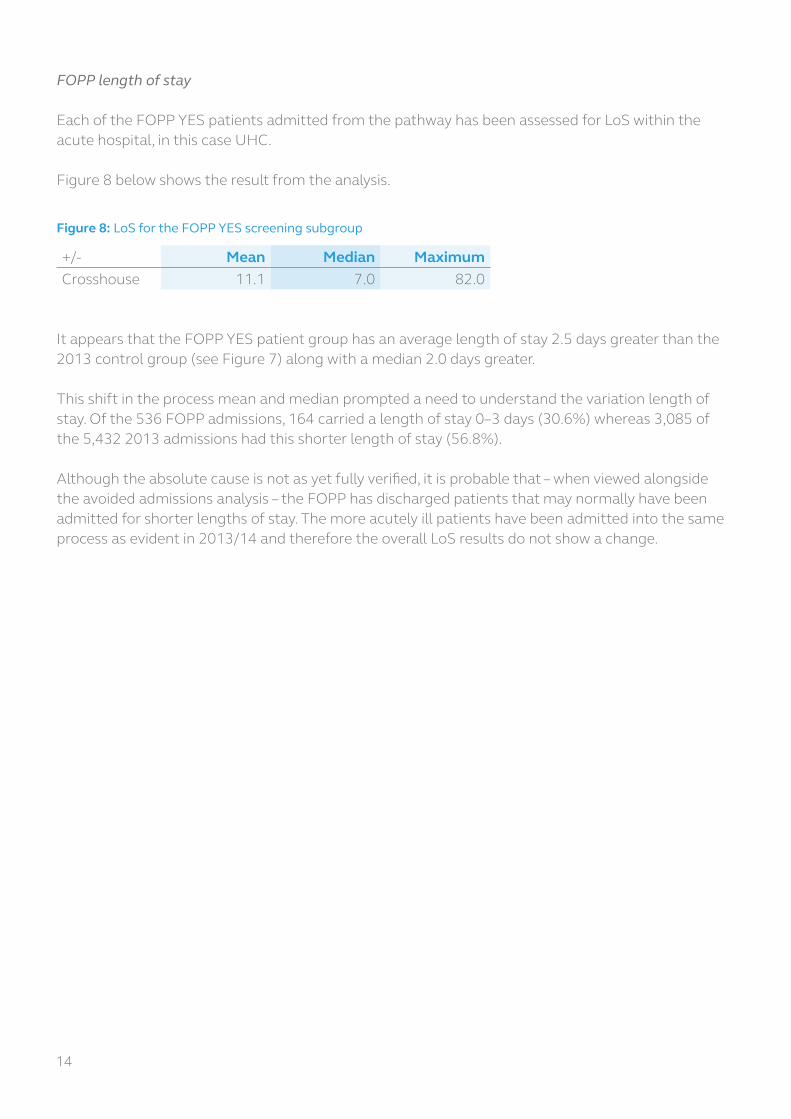
FOPP length of stay
Each of the FOPP YES patients admitted from the pathway has been assessed for LoS within the acute hospital, in this case UHC.
Figure 8 below shows the result from the analysis.
Figure 8: LoS for the FOPP YES screening subgroup
+/- Mean Median MaximumCrosshouse 11.1 7.0 82.0
It appears that the FOPP YES patient group has an average length of stay 2.5 days greater than the 2013 control group (see Figure 7) along with a median 2.0 days greater.
This shift in the process mean and median prompted a need to understand the variation length of stay. Of the 536 FOPP admissions, 164 carried a length of stay 0–3 days (30.6%) whereas 3,085 of the 5,432 2013 admissions had this shorter length of stay (56.8%).
Although the absolute cause is not as yet fully verified, it is probable that – when viewed alongside the avoided admissions analysis – the FOPP has discharged patients that may normally have been admitted for shorter lengths of stay. The more acutely ill patients have been admitted into the same process as evident in 2013/14 and therefore the overall LoS results do not show a change.

15
Economic evaluation
The first aspect of the economic evaluation focuses on patient LoS within each ward during their patient journey and is based upon the methodology described previously. This analysis was carried out over a 12-month period.
The cost analysis then incorporates the potential resource savings as a result of the impact the FOPP has had on the following – as shown in the previous section – avoided admissions, reattendances and re-admissions.
Analysis of length of stay within each ward
In order to capture any changes to the complexity of the patient pathway following the introduction of the FOPP, the focus of the economic evaluation was an analysis of LoS and patient journey from admission to discharge. As presented in Figure 9, for the 2013 control group, there were 5,633 admissions, with a total bed days of 16,474. Based upon the methodology described previously, this resulted in a total cost associated with the 2013 control group of £10,355,069. The average cost per admission was £1,838.
Figure 9 shows the costs by pathway and extrapolates average cost per admission.
Figure 9: Comparison of average admission costs between 2013, 2014, and the FOPP subgroups
Patients Bed days Total cost Avg/admission2013 Control 5633 16474 £10,355,069 £1,8382014 All 6130 17370 £10,085,948 £1,645FOPP YES 1634 4212 £1,953,040 £1,195FOPP NO 4496 4496 £8,132,908 £1,809
For the 2014 FOPP patient group, the number of admissions was 6,130, which is similar to the number of 2013 control group admissions. However, the average cost per admission in 2014 fell to £1,645.
A reason for this becomes apparent when the 2014 patient group is broken down by FOPP YES and FOPP NO. The average cost per admission for the FOPP YES and FOPP NO subgroups was £1,195 and £1,809 respectively.
In order to help illustrate the impact of the cost impact from 2013 to 2014, the results from 2014 were standardised in line with the 2013 number of admissions. As shown in Figure 10, the standardised result for the 2014 groups was a total cost of £9,268,213. This represents an estimated non-cash releasing cost reduction of £1,086,856.

16
Figure 10: Comparison of standardised total cost between 2013, 2014, and the FOPP subgroups
Patients Standardised bed days
Standardised cost +/- £’s
2013 control 5633 16474 £10,355,0692014 All 6130 15962 £9,268,213 -£1,086,856FOPP YES 1634 14520 £6,732,848 -£3,622,221FOPP NO 4496 16485 £10,189,651 -£165,418
Again, the cause of the cost reduction is demonstrated when the results broken down by FOPP YES and FOPP NO. Of the 6,130 admissions within the 2014 cohort, 1,634 were assessed as FOPP YES and 4,496 were assessed FOPP NO. The standardised results for the FOPP YES group show a total cost of £6,732,848. Reassuringly, the total cost for the FOPP NO subgroup (those that essentially followed the old pathway) was £10,189,651 – very similar to the 2013 control group.
This analysis has shown that despite the fact that the FOPP did not have a large impact on average LoS, the improvement in the appropriateness of patient journey following FOPP assessment led a less complex – and thus less costly admission.
Note: an observation was made when reviewing the cost of the 2013 control group where the out of hours admission costs varied considerably from the daytime calculation. For more details, see Appendix 3.

17
Avoided admissions
The data showed a total of 953 avoided admissions over the 20 months the FOPP was in place. The average length of stay for this patient group was 8.4 days in acute care provision and 11.1 days for all care provision. Figure 11 provides a range for the potential resource saving from avoided admissions.
As described in the ‘FOPP length of stay’ section previously, initial LoS analysis found that the FOPP avoided admissions may have been patients who would have required relatively short LoS. As such, Figure 11 includes a conservative resource saving estimate of £1,709,724 based on an average LoS of 3 days for the avoided admissions.
Figure 11: Potential resource saving from avoided admissions
Avoided admissions Average LoS Total days Resource saving*953 8.4 8005 £4,787,110953 11.1 10578 £6,325,644953 3.0 2859 £1,709,724
*This calculation made with the average bed day cost for this patient group of £598.00, ISD 2014.
Reduction in re-attendance rate
For the reduced re-attendance rates as a result of the FOPP, reduction in activity can be cost assessed – the results of which are presented in Figure 12. In the 6-month period of analysis, the re-attendance activity resource saving could be approximated to around £89,040.
Figure 12: Potential resource saving from reduction in re-attendance rate
Attend Re-attend Total Resource saving*
2013 7977 26.1% 2084 -2014 8084 17.9% 1448 £89,040
*This calculation made with the average ED attendance for this patient group of £140.00, ISD 2014.

18
Reduction in readmissions
For the reduced readmission rates resulting from the FOPP, reduction in activity can be cost assessed (see Figure 13). In the 6-month period of analysis, the potential readmission resource saving is estimated at £1,320,901 – based on the average LoS of 8.4 days for this patient group.
Figure 13: Potential resource saving from reduction in readmissions
Admit Readmit Total Resource saving*
2013 5432 16.3% 885 -2014 5366 11.6% 622 £1,320,901
*This calculation made with the average ED attendance for this patient group of £598.00, ISD 2014.
Annual FOPP resource use savings
Based on the potential resource savings presented above, the total estimated resource savings over a 12-month period are presented in Figure 14.
Figure 14: Total annual resource saving associated with the FOPP
Resource saving Duration of analysis (months)
12-month resource saving
LoS and disposition £1,086,856 12 £1,086,856Avoided admissions £1,709,724 20 £1,025,834Re-attendance reduction £89,040 6 £178,080Readmission reduction £1,320,900 6 £2,641,800Total £4,932,570

19
Staff cost
It is important that these potential resource savings are balanced against the costs of providing the FOPP.
The FOPP multidisciplinary team required additional staff to deliver the new pathway and so the analysis includes the consequent increase in staff salary costs. The costs are based on the pre-penultimate point on the Agenda for Change pay scales. The additional staff cost was estimated to be £299,928 as detailed in Figure 15.
Figure 15: FOPP staff and whole time equivalent (WTE) input to pathway
Staff WTEConsultant Geriatrician 1ANP Band 7 1.3Pharmacist Band 7 1.25CPN Band 6 1ICES practitioner Band 6 1Administrator Band 3 1Physio Band 6 1Total £299,928
Overall cost impact
The overall potential annual resource cost reduction equates to £4,632,642 – which is the potential cost savings of £4,932,570 minus the staff cost of £299,928; this is detailed in Figure 16. This potential is based on the FOPP remaining 9am–5pm, Monday to Friday.
Figure 16: Net resource saving associated with FOPP
12-month resource saving
Additional staff cost
Net resource saving
FOPP YES vs FOPP No £4,932,570 £299,928 £4,632,642

20
Discussion
The results show that implementation of the FOPP led to improvements in the quality of patient care as well as financial benefits.
There have been benefits noted in the number of patients re-attending the ED, with a reduction of over 100 patients per month as well as readmissions falling by 44 patients per month. These numbers were attributed to the pathway as patients outwith the FOPP appeared to re-attend and subsequently readmit at higher rates. This indicates that the FOPP intervention, treatment and selected inpatient journey had a more successful outcome, alongside dedicated care packages in place on and after discharge.
One of the goals of the FOPP was to avoid inappropriate admission of this patient group and facilitate their return to their usual place of residence, with the appropriate support in place. On average, 48 patients per month were recorded as having avoided admission, that is when each case was reviewed by the FOPP team, including ED personnel, they concluded that without the FOPP intervention, the patient would normally have been admitted for investigation, rather than discharged. This supports the earlier findings on re-attendance and readmission.
On review, it appeared that patients admitted through the FOPP had a similar length of stay to other patients in this group.
This raised the question ‘Did the patient journeys vary in complexity?’ and, if so how should this be reviewed. On studying the patient journeys through all admission routes, there was considerable variance in complexity. By using the varying bed day cost of each ward, costs for the FOPP were isolated as a proxy for complexity. This showed that, on average there was a 35% cost reduction for patients admitted to the pathway, compared to other patients admitted at the same time, and similarly against the 2013 control group.
The more recent finding about out of hours admissions indicates a considerable difference in average cost of admission compared with both the FOPP and all daytime service pathways. Further review regarding the LoS and components of out of hours patient journeys could explain the higher costs identified.
Overall, the FOPP showed benefits across the measures detailed above and subsequently in the quality of patient care. In terms of resource savings, once removing costs, the FOPP has the potential to return a considerable resource saving in the region of £4.6 million.
21
Conclusion
The FOPP resulted in improvement to the quality and appropriateness of care for the over 65 year old patient group managed through it, with an associated large potential resource saving for the healthcare service.
As such, the FOPP has proven to be a positive model that should be explored further for inclusion alongside Emergency Departments, Assessment Units and other points of emergency access to our acute sites.
The FOPP analysis raised a number of additional questions around presenting conditions and diagnoses of additional patients treated by the pathway. There should be further steps taken to understand the complexity of care for certain presenting conditions, for example delirium and falls, to inform the design of onward patient journeys and ultimately discharge planning with a view to community-based care. Greater understanding of patient flow specifically out of hours is required.

22
Appendix 1: Frail older people’s pathway
Patients attending ED ≥ 65 YOA
MEWS /high level of care? Identified and assessed for FOPP by team
Not for FOPPED Process
Yes for FOPP Not for FOPPFOPP/ED Process
Treatment and supported discharge
Short stay (≤72 hours) and supported discharge
Admission to inpatient ward and supported discharge
1 2
Discharged to place of residence with discharge plan, social care and all required support in place
Assessment outcomes
1. Patients were automatically excluded that had suffered a stroke, required a high level of care (HDU/ITU), renal dialysis, recent chemotherapy and certain cardiac presentations. These patients continued on the ED pathway.
2. Patients assessed for the pathway but not accepted often received examination, treatment and discharge intervention by team members. They continued on the ED pathway.

23
FOPP team• consultant geriatrician• consultant in emergency
medicine• ED nursing staff• specialist nurses from
IC&ES• elderly mental health
liaison nurse• pharmacist• advanced nurse
practitioner• physiotherapist• administration staff
Assessment criteria• frailty index• 4AT scoring• resident in care or nursing
home?• presenting with new
delirium?• impaired mobility?• fall in last month?• dementia?• incontinence?• recipient of social care?
Other elements of FOPP• medicines reconcilitiation• medical and functional
assessement• data systems and care
provision review• planning, carrying out and
reporting investigations• development of an
outcome plan
24
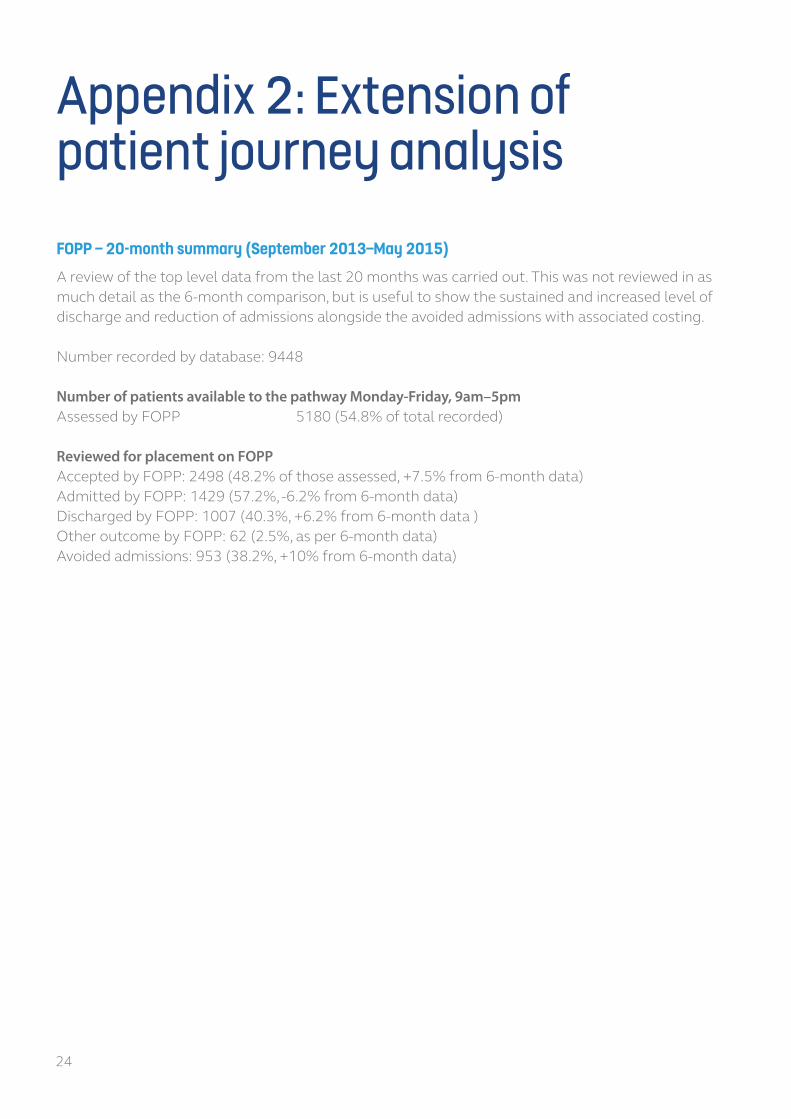
Appendix 2: Extension of patient journey analysisFOPP – 20-month summary (September 2013–May 2015)
A review of the top level data from the last 20 months was carried out. This was not reviewed in as much detail as the 6-month comparison, but is useful to show the sustained and increased level of discharge and reduction of admissions alongside the avoided admissions with associated costing.
Number recorded by database: 9448
Number of patients available to the pathway Monday-Friday, 9am–5pmAssessed by FOPP 5180 (54.8% of total recorded)
Reviewed for placement on FOPPAccepted by FOPP: 2498 (48.2% of those assessed, +7.5% from 6-month data)Admitted by FOPP: 1429 (57.2%, -6.2% from 6-month data)Discharged by FOPP: 1007 (40.3%, +6.2% from 6-month data )Other outcome by FOPP: 62 (2.5%, as per 6-month data)Avoided admissions: 953 (38.2%, +10% from 6-month data)

25
Appendix 3: Additional results noted for out of hours admissionsAs a by-product of the analyses carried out to ascertain the average LoS for each daytime pathway taken, some interesting outcomes for the out of hours admissions in the 2013 control data were discovered.
When separating the control group for comparison with the timing of the FOPP, the remaining admissions – 5pm–8am, Monday-Friday and weekends – showed surprising results, as shown in the revised Figure 12 below.
Figure 12 (revised)
Patients Bed days Total cost Avg/admission +/-2013 control 5633 16474 £10,355,069 £1,838FOPP - all 6130 17370 £10,085,948 £1,645 -193FOPP YES 1634 4212 £1,953,040 £1,195 -643FOPP NO 4496 13158 £8,132,908 £1,809 -292013 Out of Hours 2983 41871 £19,802,059 £6,638 £4,800
It would appear that patient admission and subsequent inpatient journey, in the out of hours period, was costing 3–4 times more than the daytime 2013 control group and 5–6 times more expensive than the 2014 FOPP average cost of admission.
These early data indicate a more complex and less straightforward patient journey resulting in a higher cost LoS. Further analysis would be required to ascertain such complexity.

26
Appendix 4: List of abbreviationsCDU clinical decisions unitCGA Comprehensive Geriatric AssessmentED emergency departmentFOPP Frail older people’s pathwayIC&ES Intermediate Care and Enablement ServiceLoS length of stayMEWS modified early warning scoreUHC University Hospital Crosshouse


Edinburgh Office
Gyle Square1 South Gyle CrescentEdinburghEH12 9EB
0131 623 4300
Glasgow Office
Delta House50 West Nile StreetGlasgowG1 2NP
0141 225 6999
www.healthcareimprovementscotland.org
The Improvement Hub (ihub) is part of Healthcare Improvement Scotland
You can read and download this document from our website. We are happy to consider requests for other languages or formats. Please contact our Equality and Diversity Advisor on 0141 225 6999 or email [email protected]