old mutual investment funds series ii authorised corporate
TRANSCRIPT
Old Mutual Investment Funds Series IIAuthorised Corporate Director’s Interim ReportFor the Period Ended 30 April 2012
. Asian Select Fund
. European Equity Fund
. Global Equity Fund
. Global Strategic Bond Fund
. Japanese Select Fund
. North American Equity Fund
. UK Select Equity Fund

Contents
Management and Professional Services. . . . . . . . . . . . . . . . . . . . . . . . . . . . . . . . . . . . . . . . . . . . . . . . . . . . . . . . . . . . . . . . 3
Information about the Company during the period. . . . . . . . . . . . . . . . . . . . . . . . . . . . . . . . . . . . . . . . . . . . . . . . . . . . . . . . . 4
Old Mutual Asian Select Fund. . . . . . . . . . . . . . . . . . . . . . . . . . . . . . . . . . . . . . . . . . . . . . . . . . . . . . . . . . . . . . . . . . . . . . . 5
Old Mutual European Equity Fund . . . . . . . . . . . . . . . . . . . . . . . . . . . . . . . . . . . . . . . . . . . . . . . . . . . . . . . . . . . . . . . . . . . . 12
Old Mutual Global Equity Fund . . . . . . . . . . . . . . . . . . . . . . . . . . . . . . . . . . . . . . . . . . . . . . . . . . . . . . . . . . . . . . . . . . . . . . 18
Old Mutual Global Strategic Bond Fund . . . . . . . . . . . . . . . . . . . . . . . . . . . . . . . . . . . . . . . . . . . . . . . . . . . . . . . . . . . . . . . . 29
Old Mutual Japanese Select Fund . . . . . . . . . . . . . . . . . . . . . . . . . . . . . . . . . . . . . . . . . . . . . . . . . . . . . . . . . . . . . . . . . . . . 36
Old Mutual North American Equity Fund . . . . . . . . . . . . . . . . . . . . . . . . . . . . . . . . . . . . . . . . . . . . . . . . . . . . . . . . . . . . . . . 44
Old Mutual UK Select Equity Fund . . . . . . . . . . . . . . . . . . . . . . . . . . . . . . . . . . . . . . . . . . . . . . . . . . . . . . . . . . . . . . . . . . . 54
Aggregated Financial Statements . . . . . . . . . . . . . . . . . . . . . . . . . . . . . . . . . . . . . . . . . . . . . . . . . . . . . . . . . . . . . . . . . . . . 61
Other Significant Information . . . . . . . . . . . . . . . . . . . . . . . . . . . . . . . . . . . . . . . . . . . . . . . . . . . . . . . . . . . . . . . . . . . . . . . . 63
Old Mutual Investment Funds Series II
2

Management and Professional Services
Authorised Corporate Director (ACD) and RegistrarOld Mutual Fund Managers Limited2 Lambeth HillLondonEC4V 4AD
Authorised and regulated by the Financial Services AuthorityA member of the IMA
DirectorsA list of directors is available on request
Investment AdviserOld Mutual Asset Managers (UK) Limited2 Lambeth HillLondonEC4P 4WR
Authorised and regulated by the Financial Services Authority
AdministratorsInternational Financial Data Services (IFDS)PO Box 10278ChelmsfordCM99 2AR
DepositaryNational Westminster Bank Plc135 BishopsgateLondonEC2M 3UR
Authorised and regulated by the Financial Services Authority
AuditorsKPMG Audit Plc15 Canada SquareLondonE14 5GL
Old Mutual Investment Funds Series II
3

Information About the Company During the Period
Old Mutual Investment Funds Series II is an investment company with variable capital incorporated in England and Wales underregistration number IC76 and authorised by the Financial Services Authority under the Open Ended Investment Companies Regulations2001.
The Company is an umbrella company. The assets of each fund are treated as separate from those of every other fund and will beinvested in accordance with that fund’s own investment objective and policy.
Each sub fund of the company belongs to the type of UCITS scheme within chapter 5 of the FSA Collective Investment SchemesSourcebook 2004 Regulations (‘‘COLL Sourcebook’’).
Liability
The shareholders of the Company have no liability for the debts of the Company.
Sub funds are not legal entities in themselves but form part of the Company. Should the assets attributed to any sub fund be insufficient tomeet the liabilities attributable to it, the shortfall may be met out of the assets attributed to one or more of the other sub funds.
We hereby certify the financial statements on behalf of Old Mutual Managers Limited.
P. Nathan S. Wilson
Chief Operating Officer Sales & Marketing Director
Old Mutual Fund Managers Limited Old Mutual Fund Managers Limited
31 May 2012 31 May 2012
Old Mutual Investment Funds Series II
4

Investment Adviser’s ReportFor the period ended 30 April 2012
Performance
6 months to
30 April
2012
1 year to 31
October
2011
1 year to 31
October
2010
1 year to 31
October
2009
1 year to 31
October
2008
1 year to 31
October
2007
Old Mutual Asian Select Fund 8.0% -9.6% 18.5% 61.0% -48.3% 76.2%
IMA Far East ex Japan return 3.7% -6.4% 24.8% 60.6% -45.6% 53.6%
Quartile 1 4 4 2 3 1
MSCI Asia Pacific Free 3.6% -4.8% 24.2% 63.1% -44.7% 53.1%
Data Source - # Morningstar, bid to bid, net income reinvested, sterling
Investment Objectives, Policy and StrategyTo achieve long term capital growth through the active management of a diversified portfolio of securities. There will be no geographic oreconomic restrictions but principally, investment will be in securities traded on Asian and Australasian stockmarkets.
Subject to the regulations, the property of the fund may include transferable securities, shares in collective investment schemes (includingthose managed or operated by the ACD or an associate of the ACD), warrants, money market instruments, deposits and derivatives.
The fund will initially only use derivatives for Efficient Portfolio Management purposes. The fund may use derivatives for purposes otherthan EPM, provided it has given shareholders 60 days notice of such change. If the fund did use derivatives for investment purposes, thenet asset value of the fund would therefore, at times, be highly volatile and the risk profile of the fund might change.
The fund aims to achieve long term capital growth by investing in a diversified portfolio of securities originating predominantly in themarkets of the Asia Pacific region excluding Japan. This includes the more developed markets of Australia, Hong Kong and Singapore.
ReviewAsian equity returns for the six months to the end of April 2012 were strongly positive as investor sentiment improved from the deeppessimism seen in the summer of 2011. Asian equities remain a secular growth story, but are currently impacted by their ‘‘risk on’’ nature.The major theme throughout global equities, and an unavoidable impact on Asian investor sentiment, remains the fluid nature ofEuropean political and liquidity risk. The European agreement in October 2011 detailing banking recapitalisation and an increase the sizeof the bailout in Europe sparked the global rally. This was continued in the first two months of 2012 with the European Central Bank seeingthrough a successful second round of the Long-Term Refinancing Operation, providing around E500 billion in additional liquidity. Thisremoved the threat of any immediate credit crisis in the European banking system. More broadly, data and policy announcements in theUS, Germany and China pointed to a more positive skew in the economic picture. A note of caution appeared towards the end of theperiod as old fears regarding a Euro break up and commensurate instability in the European banking system came to the fore. Thiscoincided with weaker leading indicators in both Europe and the US.
The fund performed very well in the six months to the end of April, after the transition to systematic investment strategies implemented inDecember 2011. As we would expect, given the stock selection nature of the fund, stock picking rather than sector selection droveperformance over the period. Stock selection was particularly strong in the areas of information technology and consumer discretionary.The use of multiple stock selection tools is likely to be well rewarded over the longer term, as tools tend to work in different areas and atdifferent times of the economic and business cycle. The current six months have seen strong returns to cheaper stocks from expensiveones and those stocks enjoying analyst support performed well over the period.
OutlookPerformance of the portfolio is strong over the short and medium term. The environment remains challenging for equities in general as wework through a period of political, economic and financial uncertainty. The portfolio remains well placed to weather the storm given thediverse investment tools utilised, together with strong risk management.
Risk WarningPlease remember that past performance is not a guide to future performance. The price of shares and the income from them may godown as well as up. You may not get back the amount you invest. The fund may not be suitable for everyone and if in doubt you shouldseek advice from your financial adviser.
Note:
External sources of underlying economic data used by Old Mutual Asset Managers (UK) Limited include MSCI, Datastream and Factset.
Market performance data is sourced from Morningstar / Factset. Each quoted index or stock return is based on the price movementbetween the market close on 31 October 2007 and the close on 30 April 2012. Returns quoted are sterling or local currency returns asspecified.
30 April 2012Old Mutual Asset Managers (UK) Limited
Old Mutual Investment Funds Series II
Old Mutual Asian Select Fund
5

Net Asset Value per Share
The fund was launched on 14 September 1994. Income units were first issued on that date at 105p per unit. Accumulation units were firstissued on 10 October 1999. On 19 September 2007, the fund was converted into a sub fund of an Open Ended Investment Company, OldMutual Investment Funds Series II.
Fund size
Date Net asset value
£
Net asset value
per share
(pence)
Equivalent number
of shares
in issue
31 October 2010 Class A Acc 88,158,365 240.53 36,651,897
31 October 2011 Class A Acc 72,713,198 219.77 33,085,469
30 April 2012 Class A Acc 29,072,129 237.18 12,257,651
Old Mutual Investment Funds Series II
Old Mutual Asian Select Fund
6

Stamp Duty Reserve Tax (SDRT)The SDRT regime, applicable to the fund is explained on page 63.
Total Expense Ratio (TER)
As at
30 April 2012
As at
31 October 2011
Share Class A 1.82 1.82
The TER takes into account the ACD fee and all other operating expenses over the relevant financial period.
Old Mutual Investment Funds Series II
Old Mutual Asian Select Fund
7

Portfolio Statement (unaudited)As at 30 April 2012
Holding Fair
value
£000
Percentage of
total net assets
%
Equities (31 October 2011 96.32%)
Australia (31 October 2011 19.93%)
Ansell 36,133 344 1.18
Beach Petroleum Energy 132,352 119 0.41
BHP Billiton 2,611 59 0.20
Carsales.com 23,464 86 0.30
Challenger Financial 142,199 362 1.25
Commonwealth Bank of Australia 2,689 90 0.31
CSL 11,551 272 0.93
Fairfax Media 719,762 316 1.09
Flight Centre 29,326 397 1.37
Fortescue Metals 200,927 727 2.50
Goodman Fielder 20,123 8 0.03
Iluka Resources 68,962 752 2.59
Insurance Australia 156,130 355 1.22
Medusa Mining 9,690 35 0.12
NRW 20,850 55 0.19
Primary Health Care 110,807 200 0.69
QR National 398,689 931 3.20
Ramsay Health Care 34,563 443 1.52
Seven Group 13,578 88 0.30
Suncorp-Metway 135,891 710 2.44
Tabcorp 77,279 142 0.49
Toll 43,801 164 0.56
6,655 22.89
Bermuda (31 October 2011 0.00%)
Biosensors International 197,000 130 0.45
Great Eagle 24,000 43 0.15
Texwinca 18,000 14 0.04
187 0.64
Cayman Islands (31 October 2011 6.32%)
China Shanshui Cement Group 165,000 82 0.28
SA SA International 28,000 11 0.04
Sands China 163,600 396 1.36
Soho China 1,849,500 882 3.04
Tencent 6,000 116 0.40
1,487 5.12
China (31 October 2011 10.42%)
Bank of China 1,789,000 459 1.58
China Citic 1,951,000 761 2.62
China Construction Bank 1,311,000 628 2.16
China Minsheng 1,482,000 945 3.25
China Petroleum & Chemical 344,000 228 0.78
Datang International Power Generation 1,862,000 406 1.40
Dongfeng Motor 322,000 390 1.34
Guangzhou R&F Properties 173,600 142 0.49
Industrial & Commercial Bank 1,859,000 760 2.61
PICC Property and Causalty Co 190,000 146 0.50
4,865 16.73
Hong Kong (31 October 2011 12.51%)
Galaxy Entertainment 38,000 73 0.25
Hutchi Telecommunications 172,000 47 0.16
Hutchison Whampoa 38,000 225 0.77
Old Mutual Investment Funds Series II
Old Mutual Asian Select Fund
8

Holding Fair
value
£000
Percentage of
total net assets
%
Hong Kong (31 October 2011 12.51%) - (continued)
MGM China 194,400 221 0.76
Smartone Telecommunications 130,500 151 0.52
Wynn Macau 398,800 787 2.71
1,504 5.17
India (31 October 2011 7.38%)
Canara Bank 4,214 21 0.07
Coal india 17,450 72 0.25
HCL Technologies 4,027 24 0.08
HDFC Bank 95,827 607 2.09
ITC 234,120 670 2.31
Reliance Communications 11,425 10 0.03
State Bank of India 8,377 209 0.72
Tata Motors 42,840 158 0.54
Titan Industries 209,131 569 1.96
2,340 8.05
Indonesia (31 October 2011 1.79%)
Bank Rakyat Indonesia Persero 1,961,000 860 2.96
PT Lippo Bank* 1,800,000 - -
860 2.96
Ireland (31 October 2011 0.00%)
James Hardie Industries 3,031 15 0.05
Malaysia (31 October 2011 2.93%)
AMMB Bhd 34,400 43 0.15
Bumi Armada Bhd 387,000 312 1.07
Digi.com Bhd 65,500 54 0.19
409 1.41
Singapore (31 October 2011 8.49%)
Fraser and Neave 98,000 341 1.17
Jardine Cycle & Carriage 3,000 70 0.24
Sakari Resources 163,000 160 0.55
STX OSV 97,000 77 0.26
UOL Group 46,000 104 0.36
Wing Tai 27,000 16 0.06
768 2.64
South Korea (31 October 2011 13.72%)
Celltrion 12,000 208 0.71
Dongbu Insurance 6,690 164 0.56
Hanwha Group 3,490 55 0.19
Hyosung Group 558 18 0.06
Hyundai Fire and Marine 5,150 81 0.28
Korea Electric Power 48,250 567 1.95
Korea Gas 10,810 259 0.89
KT&G Corp 6,826 288 0.99
Lotte Confectionery 346 319 1.10
Samsung Electronics 2,619 1,979 6.81
SK 10,421 686 2.36
SK Telecom 5,819 424 1.46
5,048 17.36
Old Mutual Investment Funds Series II
Old Mutual Asian Select Fund
9
Portfolio Statement (unaudited)As at 30 April 2012 (continued)

Holding Fair
value
£000
Percentage of
total net assets
%
Taiwan (31 October 2011 11.12%)
Asustek Computer 54,000 335 1.15
China Petrochemical 341,000 212 0.73
Far Eastone Telecom 398,868 533 1.83
Fubon Financial 681,933 437 1.50
Hotai Motor 51,000 199 0.69
Pegatron Corp 633,000 564 1.94
Radiant Opto Electronics 330,000 848 2.92
Simplo Technology 5,000 23 0.08
United Microelectronics 515,000 165 0.57
3,316 11.41
Thailand (31 October 2011 1.71%)
Advanced Info Service 228,000 835 2.87
C All Public L 298,500 455 1.57
Dhana Siam Finance FB* 154,000 - -
First Bangkok Bank FB* 190,972 - -
IFCT Finance FB* 74,000 - -
Nava Finance FB* 163,000 - -
Union Asia FB* 228,000 - -
1,290 4.44
Other (31 October 2011 3.95%)
Futures (31 October 2011 0.00%)
S&P 500 15 June 2012 7 5 0.02
Portfolio of investments 28,749 98.89
Net Current Assets
(31 October 2011 -0.27%) 323 1.11
Net Assets29,072 100.00
*Suspended securities.
FB: represents securities held under Foreign Board requirements.
All of the above investments are denominated in the currency of the country of origin, unless indicated otherwise.
Unless otherwise stated, all investments are ordinary shares or stocks and are listed or traded on an elibible exchange.
Old Mutual Investment Funds Series II
Old Mutual Asian Select Fund
10
Portfolio Statement (unaudited)As at 30 April 2012 (continued)

Statement of Total Return (unaudited)For the Period ended 30 April 2012
1 November 2011 -
30 April 2012
1 November 2010 -
30 April 2011
Income £000 £000 £000 £000
Net capital gains 575 4,425
Revenue 425 783
Expenses (367) (786)
Finance costs: Interest - (1)
Net revenue/(expense) before taxation 58 (4)
Taxation (21) (30)
Net revenue/(expense) after taxation 37 (34)
Total return before distributions 612 4,391
Finance costs: Distributions (67) -
Change in net assets attributable to shareholders from investment
activities 545 4,391
Statement of Change in Net Assets Attributable to Shareholders (unaudited)For the Period ended 30 April 2012
1 November 2011 -
30 April 2012
1 November 2010 -
30 April 2011
£000 £000 £000 £000
Opening net assets attributable to shareholders 72,713 88,158
Amounts receivable on issue of shares 79 1,450
Amounts payable on cancellation of shares (44,266) (7,328)
(44,187) (5,878)
SDRT (see page 63) 1 (1)
Change in net assets attributable to shareholders from investment
activities 545 4,391
Closing net assets attributable to shareholders 29,072 86,670
Balance Sheet (unaudited)As at 30 April 2012
As at
30 April 2012
As at
31 October 2011
£000 £000
Assets
Investment assets 28,749 72,908
Debtors 653 1,338
Cash and bank balances 548 789
Total other assets 1,201 2,127
Total assets 29,950 75,035
Liabilities
Creditors 878 2,322
Total other liabilities 878 2,322
Total liabilities 878 2,322
Net assets attributable to shareholders 29,072 72,713
Old Mutual Investment Funds Series II
Old Mutual Asian Select Fund
11
Investment Adviser’s ReportFor the period ended 30 April 2012
Performance
6 months to
30 April
2012
1 year to 31
October
2011
1 year to 31
October
2010
1 year to 31
October
2009
1 year to 31
October
2008
1 year to 31
October
2007
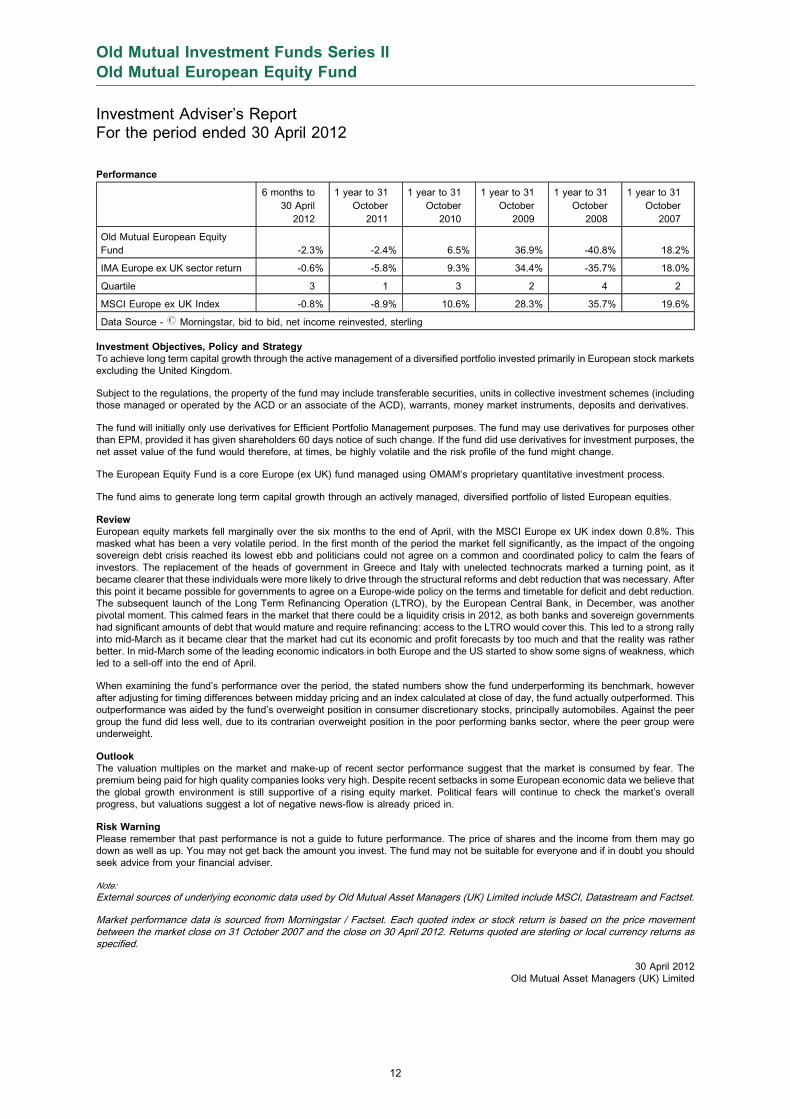
Old Mutual European Equity
Fund -2.3% -2.4% 6.5% 36.9% -40.8% 18.2%
IMA Europe ex UK sector return -0.6% -5.8% 9.3% 34.4% -35.7% 18.0%
Quartile 3 1 3 2 4 2
MSCI Europe ex UK Index -0.8% -8.9% 10.6% 28.3% 35.7% 19.6%
Data Source - # Morningstar, bid to bid, net income reinvested, sterling
Investment Objectives, Policy and StrategyTo achieve long term capital growth through the active management of a diversified portfolio invested primarily in European stock marketsexcluding the United Kingdom.
Subject to the regulations, the property of the fund may include transferable securities, units in collective investment schemes (includingthose managed or operated by the ACD or an associate of the ACD), warrants, money market instruments, deposits and derivatives.
The fund will initially only use derivatives for Efficient Portfolio Management purposes. The fund may use derivatives for purposes otherthan EPM, provided it has given shareholders 60 days notice of such change. If the fund did use derivatives for investment purposes, thenet asset value of the fund would therefore, at times, be highly volatile and the risk profile of the fund might change.
The European Equity Fund is a core Europe (ex UK) fund managed using OMAM’s proprietary quantitative investment process.
The fund aims to generate long term capital growth through an actively managed, diversified portfolio of listed European equities.
ReviewEuropean equity markets fell marginally over the six months to the end of April, with the MSCI Europe ex UK index down 0.8%. Thismasked what has been a very volatile period. In the first month of the period the market fell significantly, as the impact of the ongoingsovereign debt crisis reached its lowest ebb and politicians could not agree on a common and coordinated policy to calm the fears ofinvestors. The replacement of the heads of government in Greece and Italy with unelected technocrats marked a turning point, as itbecame clearer that these individuals were more likely to drive through the structural reforms and debt reduction that was necessary. Afterthis point it became possible for governments to agree on a Europe-wide policy on the terms and timetable for deficit and debt reduction.The subsequent launch of the Long Term Refinancing Operation (LTRO), by the European Central Bank, in December, was anotherpivotal moment. This calmed fears in the market that there could be a liquidity crisis in 2012, as both banks and sovereign governmentshad significant amounts of debt that would mature and require refinancing: access to the LTRO would cover this. This led to a strong rallyinto mid-March as it became clear that the market had cut its economic and profit forecasts by too much and that the reality was ratherbetter. In mid-March some of the leading economic indicators in both Europe and the US started to show some signs of weakness, whichled to a sell-off into the end of April.
When examining the fund’s performance over the period, the stated numbers show the fund underperforming its benchmark, howeverafter adjusting for timing differences between midday pricing and an index calculated at close of day, the fund actually outperformed. Thisoutperformance was aided by the fund’s overweight position in consumer discretionary stocks, principally automobiles. Against the peergroup the fund did less well, due to its contrarian overweight position in the poor performing banks sector, where the peer group wereunderweight.
OutlookThe valuation multiples on the market and make-up of recent sector performance suggest that the market is consumed by fear. Thepremium being paid for high quality companies looks very high. Despite recent setbacks in some European economic data we believe thatthe global growth environment is still supportive of a rising equity market. Political fears will continue to check the market’s overallprogress, but valuations suggest a lot of negative news-flow is already priced in.
Risk WarningPlease remember that past performance is not a guide to future performance. The price of shares and the income from them may godown as well as up. You may not get back the amount you invest. The fund may not be suitable for everyone and if in doubt you shouldseek advice from your financial adviser.
Note:
External sources of underlying economic data used by Old Mutual Asset Managers (UK) Limited include MSCI, Datastream and Factset.
Market performance data is sourced from Morningstar / Factset. Each quoted index or stock return is based on the price movementbetween the market close on 31 October 2007 and the close on 30 April 2012. Returns quoted are sterling or local currency returns asspecified.
30 April 2012Old Mutual Asset Managers (UK) Limited
Old Mutual Investment Funds Series II
Old Mutual European Equity Fund
12

Net Asset Value per Share
The fund was launched on 28 April 1998. Accumulation units were first issued on that date at 100p per unit. Income units were first issuedon 6 January 2003. On 19 September 2007, the fund was converted into a sub fund of an Open Ended Investment Company, Old MutualInvestment Funds Series II.
Fund size
Date Net asset value
£
Net asset value
per share
(pence)
Equivalent number
of shares
in issue
31 October 2010 Class A Acc 73,446,263 139.63 52,602,083
31 October 2010 Class B Acc 10,008 100.08 10,000
31 October 2011 Class A Acc 61,818,095 136.29 45,358,617
31 October 2011 Class B Acc 9,819 98.19 10,000
30 April 2012 Class A Acc 51,899,065 133.20 38,963,593
30 April 2012 Class B Acc 514,048 96.28 533,918
Old Mutual Investment Funds Series II
Old Mutual European Equity Fund
13

Stamp Duty Reserve Tax (SDRT)The SDRT regime, applicable to the fund is explained on page 63.
Total Expense Ratio (TER)
As at
30 April 2012
As at
31 October 2011
Share Class A 1.79 1.79
Share Class B 1.29 1.29
The TER takes into account the ACD fee and all other operating expenses over the relevant financial period.
Old Mutual Investment Funds Series II
Old Mutual European Equity Fund
14

Portfolio Statement (unaudited)As at 30 April 2012
Holding Fair
value
£000
Percentage of
total net assets
%
Equities (31 October 2011 83.81%)
Austria (31 October 2011 0.76%)
Voestalpine 49,500 995 1.90
France (31 October 2011 18.73%)
Alstom 43,416 969 1.85
AXA 71,300 632 1.21
BNP Paribas 55,500 1,394 2.66
France Telecom 105,128 899 1.71
Pernod Ricard 15,757 1,018 1.94
Publicis Groupe 24,132 765 1.46
Renault 34,835 982 1.87
Sanofi-Aventis 53,096 2,498 4.77
Total 48,400 1,416 2.70
Vivendi 64,748 735 1.40
11,308 21.57
Germany (31 October 2011 15.49%)
Allianz 14,362 992 1.89
BASF 44,965 2,292 4.38
Bayer 17,614 774 1.48
Bmw 27,384 1,610 3.07
Deutsche Bank 50,570 1,367 2.61
Dialog Semiconducto 54,628 740 1.41
Fresenius Medical Centre 15,127 651 1.24
Heidlebergcement 17,372 601 1.15
Henkel KGaA Agro 28,925 1,326 2.53
RWE 31,525 834 1.59
Siemens 17,806 1,024 1.95
12,211 23.30
Italy (31 October 2011 7.10%)
ENI 77,000 1,059 2.02
Luxembourg (31 October 2011 1.59%)
SES Global 71,300 1,043 1.99
Netherlands (31 October 2011 5.03%)
EADS (Euro Aeronautic Defense Space) 50,349 1,233 2.35
ING 300,239 1,320 2.52
Wolters Kluwer 58,079 614 1.17
3,167 6.04
Norway (31 October 2011 1.55%)
Telenor 55,704 621 1.18
Spain (31 October 2011 9.06%)
Banco Bilbao Vizcaya Argentaria 187,650 792 1.51
Banco Santander 183,824 716 1.37
BBVA 187,650 17 0.03
Red Electrrica Corp 21,704 573 1.09
Santander 183,824 30 0.06
2,128 4.06
Sweden (31 October 2011 7.64%)
Electrolux 61,298 838 1.60
Old Mutual Investment Funds Series II
Old Mutual European Equity Fund
15

Holding Fair
value
£000
Percentage of
total net assets
%
Sweden (31 October 2011 7.64%) - (continued)
Getinge AB 42,850 705 1.34
SKF ’B’ 90,400 1,314 2.51
Swedbank 129,500 1,309 2.50
Swedish Match 36,644 906 1.73
5,072 9.68
Switzerland (31 October 2011 16.86%)
ABB 94,911 1,066 2.04
Baloise (Regd) 16,500 791 1.51
Credit Suisse 48,700 722 1.38
Dufry AG Basel 6,950 583 1.11
Nestle 57,160 2,146 4.10
Novartis 60,548 2,056 3.92
Roche 22,493 2,517 4.80
Swatch Group 3,560 1,019 1.94
Swisscom 4,044 927 1.77
Syngenta 4,853 1,056 2.01
Zurich Financial Services 9,500 1,439 2.75
14,322 27.33
Other (31 October 2011 14.96%)
Portfolio of Investments 51,926 99.07
Net Current Assets
(31 October 2011 1.23%) 487 0.93
Net Assets52,413 100.00
All the above investments are denominated in sterling, unless indicated otherwise.
Unless otherwise stated, all investments are listed or traded on an eligible exchange.
Old Mutual Investment Funds Series II
Old Mutual European Equity Fund
16
Portfolio Statement (unaudited)As at 30 April 2012 (continued)

Statement of Total Return (unaudited)For the Period ended 30 April 2012
1 November 2011 -
30 April 2012
1 November 2010 -
30 April 2011
Income £000 £000 £000 £000
Net capital (losses)/gains (2,314) 11,173
Revenue 1,070 653
Expenses (468) (638)
Net revenue before taxation 602 15
Taxation (113) (56)
Net revenue/(expense) after taxation 489 (41)
Total return before distributions (1,825) 11,132
Finance costs: Distributions (1) -
Change in net assets attributable to shareholders from investment
activities (1,826) 11,132
Statement of Change in Net Assets Attributable to Shareholders (unaudited)For the Period ended 30 April 2012
1 November 2011 -
30 April 2012
1 November 2010 -
30 April 2011
£000 £000 £000 £000
Opening net assets attributable to shareholders 61,828 73,458
Amounts receivable on issue of shares 1,432 50
Amounts payable on cancellation of shares (9,021) (5,865)
(7,589) (5,815)
Change in net assets attributable to shareholders from investment
activities (1,826) 11,132
Closing net assets attributable to shareholders 52,413 78,775
Balance Sheet (unaudited)As at 30 April 2012
As at
30 April 2012
As at
31 October 2011
£000 £000
Assets
Investment assets 51,926 61,067
Debtors 1,223 287
Cash and bank balances 94 509
Total other assets 1,317 796
Total assets 53,243 61,863
Liabilities
Creditors 830 35
Total other liabilities 830 35
Total liabilities 830 35
Net assets attributable to shareholders 52,413 61,828
Old Mutual Investment Funds Series II
Old Mutual European Equity Fund
17

Investment Adviser’s ReportFor the period ended 30 April 2012
Performance
6 months to
30 April
2012
1 year to 31
October
2011
1 year to 31
October
2010
1 year to 31
October
2009
1 year to 31
October
2008
1 year to 31
October
2007
Old Mutual Global Equity Fund* 6.8% 8.1% 16.0% 15.3% -33.4% 9.5%
IMA Global Growth sector
return 3.5% -0.05% 14.9% 25.0% -31.2% 13.9%
Quartile 1 1 2 4 3 3
MSCI World Index 7.2% 1.3% 16.8% 16.9% -24.8% 10.5%
*Accumulation shares
Data Source - # Morningstar, bid to bid, net income reinvested, sterling
Investment Objectives, Policy and StrategyTo achieve long term capital growth through the active management of a diversified portfolio invested primarily in a broad range of globalequities.
Subject to the regulations, the property of the fund may include transferable securities, units in collective investment schemes (includingthose managed or operated by the ACD or an associate of the ACD), warrants, money market instruments, deposits and derivatives.
The fund will initially only use derivatives for Efficient Portfolio Management purposes. The fund may use derivatives for purposes otherthan EPM, provided it has given shareholders 60 days notice of such change. If the fund did use derivatives for investment purposes, thenet asset value of the fund would therefore, at times, be highly volatile and the risk profile of the fund might change.
The Global Equity Fund is a diversified portfolio managed using a quantitative approach to generate long term capital growth. The fund isnot subject to geographical restraints, although in practice it does not tend to invest in those markets or countries not represented in theMSCI World Index.
ReviewEquity returns for the six months to the end of April 2012 were generally strongly positive as investor sentiment improved from the deeppessimism seen in the summer of 2011. The returns have come at a time of significant volatility as investors reacted to a changing macroenvironment. The major theme throughout global equities remains the fluid nature of European political and liquidity risk. The Europeanagreement in October 2011 detailing banking recapitalisation and an increase the size of the bailout in Europe sparked the rally. This wascontinued in the first two months of 2012 with the European Central Bank seeing through a successful second round of the Long-TermRefinancing Operation, providing around E500 billion in additional liquidity. This removed the threat of any immediate credit crisis in theEuropean banking system. More broadly, data and policy announcements in the US, Germany and China pointed to a more positive skewin the economic picture. A note of caution appeared towards the end of the period as old fears regarding a Euro break up andcommensurate instability in the European banking system came to the fore. This coincided with weaker leading indicators in both Europeand the US.
The fund performed extremely well in the six months to the end of April, continuing a period of very strong returns relative to both peergroup and index. As we would expect, given the stock selection nature of the fund, stock picking rather than sector selection droveperformance over the period. Stock selection was particularly strong in the areas of industrials and consumer staples. The use of multiplestock selection strategies has been very well rewarded over the period, with all strategies utilised to spot investment opportunitiesperforming well. In particular returns to stocks showing good management decision-making and those enjoying analyst support performedwell over the period.
OutlookPerformance of the portfolio is strong over the short and medium term. However the environment remains challenging for equities ingeneral as we work through a period of political, economic and financial uncertainty. The portfolio remains well placed to weather thestorm given the diverse investment tools utilised, together with strong risk management.
Risk WarningPlease remember that past performance is not a guide to future performance. The price of shares and the income from them may godown as well as up. You may not get back the amount you invest. The fund may not be suitable for everyone and if in doubt you shouldseek advice from your financial adviser.
Note:
External sources of underlying economic data used by Old Mutual Asset Managers (UK) Limited include MSCI, Datastream and Factset.
Market performance data is sourced from Morningstar / Factset. Each quoted index or stock return is based on the price movementbetween the market close on 31 October 2007 and the close on 30 April 2012. Returns quoted are sterling or local currency returns asspecified.
30 April 2012Old Mutual Asset Managers (UK) Limited
Old Mutual Investment Funds Series II
Old Mutual Global Equity Fund
18

Net Asset Value per Share
The fund was launched on 15 July 1998. Accumulation units were first issued on that date at 100p per unit. Income units were first issuedon 6 January 2003.
Fund size
Date Net asset value
£
Net asset value
per share
(pence)
Equivalent number
of shares
in issue
31 October 2010 Class A Acc 29,656,718 122.12 24,284,320
31 October 2011 Class A Acc 28,464,342 132.03 21,559,258
30 April 2012 Class A Acc 10,887,994 141.01 7,721,435
Old Mutual Investment Funds Series II
Old Mutual Global Equity Fund
19

Stamp Duty Reserve Tax (SDRT)The SDRT regime, applicable to the fund is explained on page 63.
Total Expense Ratio (TER)
As at
30 April 2012
As at
31 October 2011
Share Class A 1.94 1.94
The TER takes into account the ACD fee and all other operating expenses over the relevant financial period.
Old Mutual Investment Funds Series II
Old Mutual Global Equity Fund
20

Portfolio Statement (unaudited)As at 30 April 2012
Holding Fair
value
£000
Percentage of
total net assets
%
Equities (31 October 2011 97.25%)
Australia (31 October 2011 3.79%)
Ansell 5,113 49 0.45
Carsales.com 10,463 39 0.36
Challenger Financial 4,580 12 0.11
Crown 6,866 40 0.37
Duluxgroup 15,254 30 0.28
Envestra 6,584 3 0.03
Flight Centre 848 11 0.10
Fortescue Metals 8,230 30 0.27
Primary Health Care 8,053 15 0.13
QR National 23,999 56 0.51
Ramsay Health Care 4,297 55 0.51
Seven Group 2,148 14 0.13
Tabcorp 13,590 25 0.23
Toll 2,460 9 0.08
388 3.56
Austria (31 October 2011 0.21%)
Mayr-Melnhof Karton 56 3 0.03
Belgium (31 October 2011 1.04%)
KBC 3,739 45 0.41
Solvay 69 5 0.05
50 0.46
Canada (31 October 2011 4.81%)
Atco 626 29 0.27
Calfrac Well Services 1,863 31 0.28
Centerra Gold 4,732 37 0.34
First Majestic Silver 5,452 52 0.48
Macdonald Dettwiler & Associates 2,027 55 0.51
Maple Leaf Foods 478 4 0.04
Nexen 2,028 24 0.22
Petrominerales 4,719 42 0.38
Precision Drilling Corp 3,664 21 0.19
Rogers Communications 2,093 48 0.44
Sherritt 9,441 33 0.30
Toromont Industries 232 3 0.03
Trilogy Energy 3,119 52 0.48
431 3.96
Cayman Islands (31 October 2011 1.10%)
Herbalife 1,313 57 0.52
Denmark (31 October 2011 1.19%)
Coloplast 476 54 0.49
DSV 1,156 16 0.15
Novo Nordisk ’B’ 907 83 0.76
153 1.40
Finland (31 October 2011 0.83%)
Amer Sports 1,081 9 0.08
Huhtamaki 765 8 0.07
Orion Corp 4,371 55 0.51
Old Mutual Investment Funds Series II
Old Mutual Global Equity Fund
21

Holding Fair
value
£000
Percentage of
total net assets
%
Finland (31 October 2011 0.83%) - (continued)
Tieto Energy Components 484 5 0.05
77 0.71
France (31 October 2011 2.06%)
Arkema 419 23 0.21
AXA 2,429 22 0.20
BIC 881 60 0.55
CNP Assurances 393 3 0.03
Renault 1,775 50 0.46
Rexel 4,054 53 0.49
211 1.94
Germany (31 October 2011 1.57%)
Aurubis 98 3 0.03
Beiersdorf 562 24 0.22
Celesio 3,482 37 0.34
Freenet 1,823 20 0.18
Hugo Boss 541 37 0.34
Infineon Technologies 9,760 60 0.55
Rational 201 31 0.29
United Internet 4,705 57 0.52
269 2.47
Greece (31 October 2011 0.17%)
Hellenic Petroleum 924 4 0.04
OPAP 4,312 24 0.22
28 0.26
Hong Kong (31 October 2011 0.23%)
Hutchi Telecommunications 52,000 14 0.13
MGM China 26,800 30 0.28
Smartone Telecommunications 41,500 48 0.44
Wynn Macau 29,200 58 0.53
150 1.38
Ireland (31 October 2011 1.16%)
Elan 363 3 0.03
Paddy Power 1,459 58 0.53
Smurfit Kappa 6,028 32 0.29
93 0.85
Italy (31 October 2011 0.84%)
Azimut 540 3 0.03
Banco Popolare 61,747 57 0.52
Cir Cie Industriali 5,477 5 0.05
Exor 1,206 18 0.16
Exor Pref 258 3 0.03
Intesa San Paolo 3,347 3 0.03
Italcementi Fabbriche Riunite Cemento 2,526 10 0.09
Mediolanum 6,456 16 0.15
Recordati 1,494 7 0.06
Salvatore Ferragamo 3,125 47 0.43
Unicredit 14,265 35 0.32
Union Di Banche Italiane 3,054 7 0.06
211 1.93
Old Mutual Investment Funds Series II
Old Mutual Global Equity Fund
22
Portfolio Statement (unaudited)As at 30 April 2012 (continued)

Holding Fair
value
£000
Percentage of
total net assets
%
Japan (31 October 2011 9.16%)
77th Bank 9,000 22 0.20
Acom 4,110 55 0.51
Aoyama Trading 800 10 0.09
Aozora Bank 33,000 52 0.48
Bank of Yokohama 18,000 53 0.49
Central Japan Railway 12 61 0.56
Daikyo 31,000 50 0.46
Daishi Bank 4,000 8 0.07
Daito Trust Construction 300 17 0.16
Gree 3,500 58 0.53
Hitachi Capital Corp 4,800 49 0.45
Hyakugo Bank 2,000 5 0.05
Itochu Corp 8,800 61 0.56
Itochu Techno-Solutions Corp 400 11 0.10
Keiyo Bank 4,000 11 0.10
Musashino Bank 400 8 0.07
Net One Systems 6,700 56 0.51
San-in Godo Bank 2,000 9 0.08
Sanrio 1,400 38 0.35
Seino 4,000 17 0.16
Ship Healthcare 3,900 56 0.51
SKY Perfect JSAT 172 46 0.42
Sumco 3,800 25 0.23
Sumisho Computer Systems 3,800 36 0.33
Sumitomo Corp 6,800 59 0.54
United Arrows 3,900 54 0.50
UNY 1,100 8 0.07
Valor 3,900 42 0.39
Yamaguchi Financial 1,000 5 0.05
982 9.02
Netherlands (31 October 2011 0.77%)
EADS (Euro Aeronautic Defense Space) 491 12 0.11
Koninklijke 4,687 36 0.33
48 0.44
New Zealand (31 October 2011 0.17%)
AMP NZ Office 7,786 4 0.04
Nuplex Industries 2,400 3 0.03
Ryman Healthcare 3,618 6 0.05
Sky Network Television 2,821 8 0.07
21 0.19
Norway (31 October 2011 0.67%)
Algeta 3,258 47 0.43
Cermaq 1,454 12 0.11
Det Norske Oljeselskap 5,059 44 0.41
DNO International 46,501 46 0.42
Prosafe 10,300 50 0.46
TGS Nopec Geophysical 2,137 38 0.35
237 2.18
Singapore (31 October 2011 0.53%)
Jardine Cycle & Carriage 1,000 23 0.21
Sembcorp Industries 2,000 5 0.05
STX OSV 36,000 29 0.26
57 0.52
Old Mutual Investment Funds Series II
Old Mutual Global Equity Fund
23
Portfolio Statement (unaudited)As at 30 April 2012 (continued)

Holding Fair
value
£000
Percentage of
total net assets
%
Spain (31 October 2011 1.10%)
Banco De Sabadell 33,075 49 0.45
Distribuidora Internacional De Alimentacion 18,746 56 0.51
Zardoya Otis 4,381 33 0.31
138 1.27
Sweden (31 October 2011 3.24%)
AarhusKarlshamn 230 5 0.05
Axis 3,721 58 0.53
Hennes & Mauritz 3,238 68 0.62
Lundin Petroleum 4,234 52 0.48
Oriflame Cosmetics 1,253 27 0.25
Saab ’B’ 4,438 45 0.42
Swedish Match 2,305 57 0.52
312 2.87
Switzerland (31 October 2011 3.59%)
EMS-Chemie 28 4 0.03
Gam 1,724 14 0.13
Nestle 932 35 0.32
Novartis 98 3 0.03
Roche 994 111 1.02
Straumann 62 6 0.06
173 1.59
United Kingdom (31 October 2011 9.79%)
Aberdeen Asset Management 19,615 56 0.51
Admiral Group 940 11 0.10
Aegis Group 1,842 3 0.03
Aggreko 2,639 60 0.55
AstraZeneca 2,947 80 0.73
BP 1,578 7 0.06
British American Tobacco 3,237 102 0.94
Catlin Group 6,098 26 0.24
Daily Mail & General Trust 3,690 16 0.15
Drax Group 4,195 23 0.21
Hargreaves Lansdown 10,443 55 0.51
Hochschild Mining 2,909 15 0.14
HSBC 2,868 16 0.15
IMI 1,911 19 0.17
Michael Page International 9,513 40 0.37
Provident Financial 4,639 54 0.50
Rightmove 3,825 59 0.54
Rotork 2,645 58 0.53
Royal Dutch Shell ‘A’ 198 4 0.04
Sage Group 16,855 48 0.44
Smith (DS) 13,409 23 0.21
Sports Direct International 7,987 24 0.22
Stagecoach Group 1,261 3 0.03
Tui Travel 1,982 4 0.04
Vodafone Group 4,538 8 0.07
Weir 2,914 50 0.46
864 7.94
United States (31 October 2011 49.23%)
Accenture 1,839 74 0.68
Advance Auto Parts 990 56 0.51
AES 7,070 54 0.50
Aetna 1,648 44 0.40
Old Mutual Investment Funds Series II
Old Mutual Global Equity Fund
24
Portfolio Statement (unaudited)As at 30 April 2012 (continued)

Holding Fair
value
£000
Percentage of
total net assets
%
United States (31 October 2011 49.23%) - (continued)
Alaska Air 2,514 53 0.49
Alliance Data 763 61 0.56
American Express 318 12 0.11
Amerigroup 688 27 0.25
Apollo Group ’A’ 1,746 38 0.35
Apple 515 191 1.75
Assurant 2,189 55 0.51
AT&T 1,504 30 0.28
Boeing 1,733 82 0.75
Brinker International 2,735 53 0.49
Brunswick 1,870 31 0.28
Buckle 1,885 54 0.50
Capital One Financial Corp 1,059 37 0.34
Capital Source 5,633 23 0.21
Cash America International 1,647 47 0.43
Caterpillar 1,298 83 0.76
CBOE 3,261 54 0.50
Chevron Corp 598 39 0.36
CNO Financial 11,892 55 0.51
Coach 1,324 60 0.55
Coca-Cola 240 11 0.10
Colgate-Palmolive 1,266 77 0.71
Community Health Systems 3,526 53 0.49
Constellation Brand ’A’ 3,818 51 0.47
Copart 2,026 33 0.30
Core Laboratories 653 55 0.51
Credit Acceptance Corp 935 55 0.51
Cummins 882 64 0.59
Cypress Semiconductors 5,849 54 0.50
Deere 1,429 73 0.67
Dell 6,451 65 0.60
Electronic Arts 4,860 46 0.42
Exelis 3,729 27 0.25
Expedia 1,068 26 0.24
Express Scripts 3,462 52 0.48
Exxon Mobil Corp 2,359 125 1.15
Ezcorp 2,683 45 0.41
Gamestop 4,087 57 0.52
Gartner 2,082 56 0.51
General Electric 2,993 36 0.33
Genwaorth Financial ’A’ 14,477 53 0.49
Gilead Sciences 2,163 69 0.63
Goodyear Tire & Rubber 4,619 32 0.29
Google 37 14 0.13
Hartford Financial Services 4,641 59 0.54
HealthSouth 4,214 59 0.54
Hewlett-Packard 5,049 77 0.71
Humana 1,080 58 0.53
Hunt (J.B) Transport Services 1,610 55 0.51
Intel Corp 567 10 0.09
International Business Machine Corp 1,258 160 1.47
ITT Educational Services 1,262 51 0.47
Jabil Circuit 3,689 53 0.49
Jazz Pharmaceuticals 1,914 61 0.56
Johnson & Johnson 572 23 0.21
Joy Global 856 38 0.35
JPMorgan Chase 742 20 0.18
Kodiak Oil & Gas 8,428 47 0.43
Limited Brands 2,032 64 0.59
Lincoln National 3,751 57 0.52
Lions Gate Entertainment 6,452 49 0.45
Lockheed Martin Corp 1,216 68 0.62
Old Mutual Investment Funds Series II
Old Mutual Global Equity Fund
25
Portfolio Statement (unaudited)As at 30 April 2012 (continued)

Holding Fair
value
£000
Percentage of
total net assets
%
United States (31 October 2011 49.23%) - (continued)
Lorillard 713 60 0.55
LSI 10,665 52 0.48
Magellan Health Services 523 15 0.14
Mastercard ’A’ 292 82 0.75
Mcgraw Hill Companies 1,949 59 0.54
Metropcs Communications 10,615 46 0.42
Microsoft Corp 2,799 55 0.51
Monster Beverage Corp 1,523 61 0.56
NRG Energy 5,597 57 0.52
Nu Skin Enterprises 1,563 50 0.46
Owens-Illinois 3,645 52 0.48
Pfizer 1,476 21 0.19
Philip Morris International 2,233 123 1.13
Pier 1 Imports 5,079 56 0.51
Polaris Industries 380 19 0.17
Popular 10,270 11 0.10
Procter & Gamble 657 26 0.24
Protective Life 2,322 42 0.39
Prudential Financial 703 27 0.25
Questcor Pharmaceuticals 2,197 60 0.55
Regions Financial 2,591 11 0.10
Reinsurance Group of America 270 10 0.09
Rockwell Collins 1,526 53 0.49
Rosetta Resources 1,865 58 0.53
Safeway 4,183 53 0.49
Sauer-Danfoss 925 26 0.24
Seagate Technology 3,158 57 0.52
Select Comfort 2,619 48 0.44
SLM 2,701 25 0.23
Smithfield Foods 3,642 48 0.44
Suntrust Banks 1,389 21 0.19
Superior Energy Services 3,136 51 0.47
Tempur Pedic International 1,391 51 0.47
Textron 3,525 59 0.54
The Western Union Company 5,425 62 0.57
Ulta Salon Cosmetic 898 49 0.45
United Health Group 1,885 67 0.62
United Rentals 1,910 55 0.51
United Therapeutics Corp 2,100 58 0.53
Unum 4,070 60 0.55
US Cellular Corp 234 6 0.05
Validus 2,851 57 0.52
Vertex Pharmaceuticals 2,403 57 0.52
Virgin Media 3,763 57 0.52
Wabco 1,471 57 0.52
Warmer Chilcott 5,396 62 0.57
Wells Fargo & Co 776 16 0.15
WR Grace 1,503 55 0.51
5,814 53.40
Futures (31 October 2011 0.01%)
Dow Jones Euro Stoxx 15 June 2012 2 - -
Mini Topix Tokyo 07 June 2012 4 (1) (0.01)
S&P 500 15 June 2012 1 1 0.01
- -
Old Mutual Investment Funds Series II
Old Mutual Global Equity Fund
26
Portfolio Statement (unaudited)As at 30 April 2012 (continued)

Holding Fair
value
£000
Percentage of
total net assets
%
Other (31 October 2011 2.00%)
Portfolio of Investments 10,767 98.89
Net Current Assets
(31 October 2011 0.74%) 121 1.11
Net Assets10,888 100.00
All the above investments are denominated in sterling, unless indicated otherwise.
Unless otherwise stated, all investments are listed or traded on an eligible exchange.
Old Mutual Investment Funds Series II
Old Mutual Global Equity Fund
27
Portfolio Statement (unaudited)As at 30 April 2012 (continued)

Statement of Total Return (unaudited)For the Period ended 30 April 2012
1 November 2011 -
30 April 2012
1 November 2010 -
30 April 2011
Income £000 £000 £000 £000
Net capital gains 507 4,277
Revenue 144 285
Expenses (141) (271)
Net revenue before taxation 3 14
Taxation (12) (22)
Net expense after taxation (9) (8)
Total return before distributions 498 4,269
Finance costs: Distributions (5) -
Change in net assets attributable to shareholders from investment
activities 493 4,269
Statement of Change in Net Assets Attributable to Shareholders (unaudited)For the Period ended 30 April 2012
1 November 2011 -
30 April 2012
1 November 2010 -
30 April 2011
£000 £000 £000 £000
Opening net assets attributable to shareholders 28,464 29,657
Amounts receivable on issue of shares 398 255
Amounts payable on cancellation of shares (18,468) (2,218)
(18,070) (1,963)
SDRT (see page 63) 1 -
Change in net assets attributable to shareholders from investment
activities 493 4,269
Closing net assets attributable to shareholders 10,888 31,963
Balance Sheet (unaudited)As at 30 April 2012
As at
30 April 2012
As at
31 October 2011
£000 £000
Assets
Investment assets 10,767 28,253
Debtors 156 167
Cash and bank balances 88 163
Total other assets 244 330
Total assets 11,011 28,583
Liabilities
Creditors 123 119
Total other liabilities 123 119
Total liabilities 123 119
Net assets attributable to shareholders 10,888 28,464
Old Mutual Investment Funds Series II
Old Mutual Global Equity Fund
28

Investment Adviser’s ReportFor the period ended 30 April 2012
Performance
6 months to
30 April
2012
1 year to 31
October
2011
1 year to 31
October
2010
1 year to 31
October
2009
1 year to 31
October
2008
1 year to 31
October
2007
Old Mutual Global Strategic
Fund* -1.28% 1.71% 13.08% 35.96% 8.54% 0.2%
IMA Global Bond sector return 1.38% 0.5% 10.8% 22.58% 8.09% -0.28%
Quartile 4 2 2 1 2 2
*Accumulation shares
Data Source - # Standard & Poor’s, bid to bid, net income reinvested, sterling
Investment Objectives, Policy and StrategyTo produce an attractive level of income together with capital appreciation by investing in a diversified portfolio of fixed and variable ratebond investments, including convertible securities. The fund will vary the currencies in which it invests to enable it to achieve its objective.
Subject to the regulations, the property of the fund may include transferable securities, units in collective investment schemes (includingthose managed or operated by the ACD or an associate of the ACD), warrants, money market instruments, deposits and derivatives.More than 35% in value of the property of the fund may consist of Government and other public securities issued by one issuer inaccordance with the investment management and borrowing powers of the Company set out in Appendix 2.
The fund will be permitted to use derivatives for investment purposes; the net asset value of this fund may therefore, at times, be highlyvolatile and the risk profile of this fund may change. The aim of the fund is to produce an attractive level of income together with capitalappreciation by investing in a diversified portfolio of fixed and variable rate bond investments, including convertible securities. The fundwill vary the currencies in which it invests to enable it to achieve its objective.
ReviewEurozone events continued to drive sentiment. Risks of a country exiting the union increased, raising questions on how the singlecurrency could operate without fiscal and political union. European leaders agreed a ‘Fiscal Compact’ and the European central bankannounced near unlimited liquidity to the banking system, aiming to prevent another ‘credit crunch’. This act set the tone for a sharprecovery in risk assets for January 2012 (reversing declines from the third and fourth quarters in 2011).
Central banks extended loose policy at varying rates. The US Federal Reserve implied interest rates would remain low until at least 2014,the Bank of England increased quantitative easing whilst the Bank of Japan proceeded with a record stimulus programme. Economicindicators were mixed. The US outpaced all developed markets, while Germany proved resilient given the sharp declines in output acrossthe rest of the European region. More recent data have shown cooling, but still expansionary data from Asia.
Over the period, core government bonds (US, UK, Japan, German) increased in price terms – marking new record low yields. Corporatebonds recovered from the lows of October 2011, however liquidity remains tempered. Investors significantly increased risk, as measuredby credit default swaps (a way of insuring risk on corporate bonds). Equity markets followed a similar pattern. In currencies, sterling wasthe strongest and the euro the weakest in trade-weighted terms. Commodity-linked currencies fell in line with commodity markets, whicheased over the period (with the exception of oil and soybean which were both affected by supply-side issues).
The fund returned -1.28% net through the six month period. Corporate paper delivered positive returns. Duration – the fund’s sensitivity tointerest rates – produced mixed results, with positive returns from short positioning in US government bonds and losses from German andUK government bonds. Currency was the largest drag to performance, as sterling gained across major trading peers.
OutlookMajor hurdles face the global economy. Elections and politics in Europe (and the US) add undesired flux to markets. Eurozone sentimenthas clearly deteriorated. Austerity fatigue is driving politicians to ‘Plan B’ – but it is capital markets that will ultimately determine the ‘growthversus austerity’ debate. The US continues to overspend on the public budget, but it is the least bad option with the additional benefit ofbeing the world’s reserve currency. For now, away from our longer-term structural views, we favour long-dated government bonds issuedby the US and Germany, hold the euro and allocate to the US dollar and the yen.
Risk WarningPlease remember that past performance is not a guide to future performance. The price of shares and the income from them may godown as well as up. You may not get back the amount you invest. The fund may not be suitable for everyone and if in doubt you shouldseek advice from your financial adviser. Bond funds are affected by changes (real or anticipated) in the rate of inflation or interest rates,which may cause returns on bonds to be more or less attractive. Investment in corporate bonds brings an increased risk of default andmay affect the capital value of the fund.
Note:
External sources of underlying economic data used by Old Mutual Asset Managers (UK) Limited include MSCI, Datastream and Factset.Market performance data is sourced from Morningstar / Factset. Each quoted index or stock return is based on the price movementbetween the market close on 31 October 2007 and the close on 30 April 2012. Returns quoted are sterling or local currency returns asspecified.
30 April 2012Old Mutual Asset Managers (UK) Limited
Old Mutual Investment Funds Series II
Old Mutual Global Strategic Bond Fund
29

Net Asset Value per Share
The fund was launched on 26 November 1991 as the Old Mutual International Bond & Convertible Fund. Income units were first issued onthat date at 105p per unit. On 19 September 2007, the fund was converted into a sub fund of an Open Ended Investment Company, OldMutual Investment Funds Series II and renamed the Old Mutual Global Strategic Bond Fund.
Fund size
Date Net asset value
£
Net asset value
per share
(pence)
Equivalent number
of shares
in issue
31 October 2010 Class A Inc 69,236,659 203.06 34,096,277
31 October 2010 Class A Acc 166,017,861 310.83 53,411,034
31 October 2010 Class B Inc 138,882,835 106.58 130,313,758
31 October 2010 Class B Acc 8,655,678 109.56 7,900,724
31 October 2011 Class A Inc 99,751,257 205.21 48,610,202
31 October 2011 Class A Acc 238,785,656 316.16 75,527,766
31 October 2011 Class B Inc 194,292,927 107.71 180,392,136
31 October 2011 Class B Acc 11,477,657 111.87 10,260,040
30 April 2012 Class A Inc 99,168,266 201.81 49,140,467
30 April 2012 Class A Acc 298,937,690 312.17 95,761,740
30 April 2012 Class B Inc 229,206,808 105.92 216,393,449
30 April 2012 Class B Acc 12,474,145 110.68 11,270,366
Old Mutual Investment Funds Series II
Old Mutual Global Strategic Bond Fund
30

Stamp Duty Reserve Tax (SDRT)The SDRT regime, applicable to the fund is explained on page 63.
Total Expense Ratio (TER)
As at
30 April 2012
As at
31 October 2011
Share Class A 1.14 1.14
Share Class B 0.64 0.64
The TER takes into account the ACD fee and all other operating expenses over the relevant financial period.
Old Mutual Investment Funds Series II
Old Mutual Global Strategic Bond Fund
31

Portfolio Statement (unaudited)As at 30 April 2012
Holding Fair
value
£000
Percentage of
total net assets
%
Bonds (31 October 2011 54.15%)
Euros (31 October 2011 23.64%)
Alba Group 8% 15 May 2018 2,800,000 2,348 0.37
Anglo American 3.5% 28 March 2022 3,900,000 3,210 0.50
Ardagh Glass 7.125% 15 June 2017 3,800,000 2,931 0.46
BG Energy 3% 16 November 2018 2,200,000 1,863 0.29
Boats Investment 11% 31 March 2017 1,000,000 870 0.14
Boparan 9.75% 30 April 2018 3,600,000 3,060 0.48
BPCM 2.994% 18 February 2019 1,900,000 1,596 0.25
Convatec Healthcare 10.875% 15 December 2018 1,600,000 1,322 0.21
Cyfrowy Polsat Finance 7.125% 20 May 2018 2,900,000 2,356 0.37
Dong Energy 7.75% 1 June 2050 1,800,000 1,560 0.24
Eco Bat Finance 7.75% 15 February 2017 800,000 644 0.10
EIB 2.5% 15 October 2018 15,000,000 12,510 1.96
France Telecom 3.875% 9 April 2020 1,300,000 1,126 0.18
Greif Luxembourg Finance 7.375% 15 July 2021 1,400,000 1,184 0.18
Heidelberg Cement 8.5% 31 October 2019 3,200,000 2,900 0.45
Kabel Deutschland 6.5% 29 June 2018 2,854,000 2,441 0.38
Kinov Germ Bond 10% 15 June 2018 1,700,000 1,429 0.22
Kuka 8.75% 15 November 2017 1,200,000 1,039 0.16
Lehman Brothers (Default) 0.00% 14 March 2019 300,000 - -
Levi Strauss 7.75% 15 May 2018 3,600,000 2,998 0.47
Lloyds Banking Group Capital 4.625% 2 February 2017 1,039,000 865 0.13
OI European Group 6.75% 15 September 2020 950,000 821 0.13
Rexel 7% 17 December 2018 2,775,000 2,363 0.37
RWE 4.625% PERP 1,500,000 1,158 0.18
South Africa 5.25% 16 May 2013 3,550,000 2,998 0.47
St Gobain 3.625% 28 March 2022 1,300,000 1,047 0.16
Standard Chartered 4.125% 18 January 2019 1,900,000 1,648 0.26
Telstra 4.25% 23 March 2020 1,000,000 900 0.14
TVN Finance Corporation 7.875% 15 November 2018 3,750,000 2,947 0.46
Unitymedia 8.125% 1 December 2017 2,050,000 1,748 0.27
Unitymedia GMBH 9.625% 1 December 2019 1,000,000 879 0.14
UPC 8.375% 15 August 2020 2,700,000 2,225 0.35
66,986 10.47
Sterling (31 October 2011 16.39%)
Abbey National Treasury Services 5.125% 14 April 2021 1,500,000 1,589 0.25
Anglian Water 7% 31 January 2018 300,000 305 0.05
Aviva (FRN) 0.00% 3 June 2041 1,100,000 951 0.15
Bank Nederland Gemeenten 2.625% 10 December 2013 750,000 765 0.12
BMW Finance 3.375% 14 December 2018 3,000,000 3,073 0.48
Cable & Wireless 8.625% 25 March 2019 1,020,000 991 0.15
CNP Assurances (FRN) 0.00% 30 September 2041 2,500,000 1,937 0.30
Co-operative Group 5.625% 8 July 2020 2,430,000 2,387 0.37
Comcast 5.5% 23 November 2029 1,300,000 1,453 0.23
DNB Bank 4.25% 27 January 2020 2,300,000 2,305 0.36
EDF 6.25% 30 May 2028 4,250,000 4,777 0.75
EIB 2.25% 22 January 2015 17,700,000 17,954 2.81
FCE Bank 4.825% 15 February 2017 1,500,000 1,513 0.24
Gatwick Funding 5.25% 23 January 2024 3,000,000 3,031 0.47
GE Capital 4.375% 31 July 2019 1,382,000 1,417 0.22
Glencore Finance 5.5% 3 April 2022 2,500,000 2,530 0.40
Group 4 Security 7.75% 13 May 2019 1,850,000 2,259 0.35
HSBC 6.375% 18 October 2022 850,000 853 0.13
ING Bank 6.875% 29 May 2023 911,000 893 0.14
ING Bank 3.875% 23 December 2016 1,582,000 1,567 0.25
Jaguar Land Rover 8.125% 15 May 2018 2,500,000 2,586 0.40
Legal & General Group (FRN) 0.00% 23 July 2041 2,000,000 2,333 0.36
Pemex 8.25% 2 June 2022 1,800,000 2,211 0.35
Old Mutual Investment Funds Series II
Old Mutual Global Strategic Bond Fund
32

Holding Fair
value
£000
Percentage of
total net assets
%
Sterling (31 October 2011 16.39%) - (continued)
Pinton Estates 0.00% 28 December 2012 300,000 222 0.03
Royal KPN 5% 18 November 2026 1,400,000 1,380 0.22
RSA Insurance Group 9.375% 20 May 2039 1,900,000 2,159 0.34
Scottish Widows 5.125% PERP 2,866,000 2,002 0.31
Standard Chartered 7.75% 3 April 2018 2,150,000 2,449 0.38
Svenska Handelsbanken 4% 18 January 2019 2,500,000 2,559 0.40
TDC 5.625% 23 February 2023 550,000 615 0.10
The Society of Lloyds (FRN) 6.875% 17 November 2025 2,150,000 2,155 0.34
Wales & West Utilities Finance 4.625% 13 December 2023 1,100,000 1,161 0.18
Western Power Distribution 5.25% 17 January 2023 2,450,000 2,688 0.42
Yorkshire Water Services Finance 6% 24 April 2025 1,300,000 1,403 0.22
78,473 12.27
United States Dollar (31 October 2011 11.47%)
Avis Budget Car Rental 8.25% 15 January 2019 1,900,000 1,209 0.19
FMG Resources 6.875% 1 April 2022 5,000,000 3,098 0.48
HYVA Global 8.625% 24 March 2016 5,400,000 2,740 0.43
Nord Anglia Education 10.25% 1 April 2017 2,400,000 1,520 0.24
Nordea 3.125% 20 March 2017 5,000,000 3,083 0.48
Rabobank Nederland 0.00% PERP 2,500,000 1,946 0.30
Sable International 8.75% 1 February 2020 2,800,000 1,830 0.29
USA 0.25% 15 September 2014 41,350,000 25,389 3.97
40,815 6.38
Australian Dollar (31 October 2011 2.23%)
Queensland Treasury 6% 14 September 2017 17,300,000 12,125 1.89
Queensland Treasury 6% 14 September 2017 15,200,000 10,658 1.67
22,783 3.56
Swiss Franc (31 October 2011 0.42%)
Aguila 3 7.875% 31 January 2018 3,934,000 2,784 0.43
Forward Currency Contracts (31 October 2011 0.32%)
Bought CNY Sold USD (58) (0.01)
Bought EUR Sold GBP (1,153) (0.18)
Bought GBP Sold DKK 670 0.10
Bought GBP Sold JPY 175 0.03
Bought GBP Sold USD 5,101 0.80
Bought JPY Sold GBP 97 0.02
Bought JPY Sold SEK 21 -
Bought MXN Sold GBP (406) (0.06)
Bought SGD Sold GBP 154 0.02
Bought USD Sold EUR (577) (0.09)
Bought USD Sold GBP (1,224) (0.19)
Bought USD Sold JPY (179) (0.03)
2,621 0.41
Futures (31 October 2011 0.14%)
Treasury Bonds 20 June 2012 1,393 87 0.02
Japanese Government Bonds 11 June 2012 (79) (320) (0.05)
Euro Bund 7 June 2012 1,433 142 0.02
(91) (0.01)
Options (31 October 2011 0.00%)
Put Treasury Bond 25 May 2012 455 9 -
Old Mutual Investment Funds Series II
Old Mutual Global Strategic Bond Fund
33
Portfolio Statement (unaudited)As at 30 April 2012 (continued)

Holding Fair
value
£000
Percentage of
total net assets
%
Treasury Bills (31 October 2011 33.98%)
United States Dollar (31 October 2011 0.00%)
USA 0.00% 3 May 2012 35,000,000 21,525 3.36
USA 0.00% 31 May 2012 80,000,000 49,198 7.69
USA 0.00% 10 May 2012 30,000,000 18,450 2.88
USA 0.00% 17 May 2012 100,000,000 61,499 9.61
USA 0.00% 24 May 2012 45,000,000 27,674 4.33
USA 0.00% 7 June 2012 54,000,000 33,208 5.19
USA 0.00% 14 June 2012 100,000,000 61,495 9.61
USA 0.00% 21 June 2012 50,000,000 30,747 4.81
USA 0.00% 12 July 2012 80,000,000 49,192 7.69
352,988 55.17
Sterling (31 October 2011 33.98%)
UK 0.00% 8 May 2012 22,025,000 22,023 3.44
Credit Default Swaps (31 October 2011 0.00%)
USD 20 June 2017 514,000,000 (1,025) (0.16)
Other (31 October 2011 8.27%)
Portfolio of Investments 588,366 91.96
Net Current Assets
(31 October 2011 3.14%) 51,421 8.04
Net Assets639,787 100.00
The above investments have been classified according to the currency denomination of the investment rather than according to the
country of origin of the issuer, in line with bond market practice.
Unless otherwise stated, all investments are listed or traded on an eligible exchange.
Old Mutual Investment Funds Series II
Old Mutual Global Strategic Bond Fund
34
Portfolio Statement (unaudited)As at 30 April 2012 (continued)

Statement of Total Return (unaudited)For the Period ended 30 April 2012
1 November 2011 -
30 April 2012
1 November 2010 -
30 April 2011
Income £000 £000 £000 £000
Net capital losses (10,446) (14,936)
Revenue 6,700 4,183
Expenses (2,693) (1,960)
Finance costs: Interest (445) 1
Net revenue before taxation 3,562 2,224
Taxation - -
Net revenue after taxation 3,562 2,224
Total return before distributions (6,884) (12,712)
Finance costs: Distributions (3,562) (2,224)
Change in net assets attributable to shareholders from investment
activities (10,446) (14,936)
Statement of Change in Net Assets Attributable to Shareholders (unaudited)For the Period ended 30 April 2012
1 November 2011 -
30 April 2012
1 November 2010 -
30 April 2011
£000 £000 £000 £000
Opening net assets attributable to shareholders 544,308 382,793
Amounts receivable on issue of shares 237,556 219,927
Amounts payable on cancellation of shares (132,855) (101,441)
104,701 118,486
SDRT (see page 63) (1) (1)
Change in net assets attributable to shareholders from investment
activities (10,446) (14,936)
Unclaimed distribution 1 1
Retained distribution on accumulation shares 1,224 698
Closing net assets attributable to shareholders 639,787 487,041
Balance Sheet (unaudited)As at 30 April 2012
As at
30 April 2012
As at
31 October 2011
£000 £000
Assets
Investment assets 588,366 527,194
Debtors 13,358 12,862
Cash and bank balances 45,434 10,440
Total other assets 58,792 23,302
Total assets 647,158 550,496
Liabilities
Creditors 6,276 5,586
Distribution payable on income shares 1,095 602
Total other liabilities 7,371 6,188
Total liabilities 7,371 6,188
Net assets attributable to shareholders 639,787 544,308
Old Mutual Investment Funds Series II
Old Mutual Global Strategic Bond Fund
35

Investment Adviser’s ReportFor the period ended 30 April 2012
Performance
6 months to
30 April
2012
1 year to 31
October
2011
1 year to 31
October
2010
1 year to 31
October
2009
1 year to 31
October
2008
1 year to 31
October
2007
Old Mutual Japanese Select
Fund* 3.16% 7.75% 11.83% 10.87% -22.89% -5.96%
IMA Japan sector return 1.56% 1.73% 7.13% 13.32% -20.94% -8.34%
Quartile 1 1 1 3 2 2
MSCI Japan Index 3.28% -3.1% 8.17% 11.65% -19.53% -3.65%
*Accumulation shares
Data Source - # Standard & Poors, bid to bid, net income reinvested, sterling
Investment Objectives, Policy and StrategyTo achieve an above average return through the active management of a diversified portfolio invested in the Japanese stock markets,whilst constraining the overall level of portfolio risk.
Subject to the regulations, the property of the fund may include transferable securities, units in collective investment schemes (includingthose managed or operated by the ACD or an associate of the ACD), warrants, money market instruments, deposits and derivatives.
The fund will initially only use derivatives for Efficient Portfolio Management purposes. The fund may use derivatives for purposes otherthan EPM, provided it has given shareholders 60 days notice of such change. If the fund did use derivatives for investment purposes, thenet asset value of the fund would therefore, at times, be highly volatile and the risk profile of the fund might change.
The Japanese Select Fund is a core Japanese equity fund managed using OMAM’s proprietary quantitative investment process.
The fund aims to generate long term capital growth through an actively managed, diversified portfolio of listed Japanese equities.
ReviewJapanese equity returns for the six months to the end of April 2012 were strongly positive as investor sentiment improved from the deeppessimism seen in the summer of 2011. The Japanese economy however remains mixed. The consumer side, surprisingly, is relativelypositive. The labour market is holding up quite well and recent figures for household spending reversed the downward trend. GDPhowever continued to decline in the fourth quarter and trade was in deficit for the first time in over 30 years. Automotive production wasstronger in the first quarter, though still well below its pre-recession peaks, while industrial production is struggling to recover. Businessconfidence surveys indicate a stable outlook. The major theme throughout global equities, and an unavoidable impact on Japaneseinvestor sentiment, remains the fluid nature of European political and liquidity risk. The European agreement in October 2011 detailingbanking recapitalisation and an increase the size of the bailout in Europe sparked the global rally. This was continued in the first twomonths of 2012 with the European Central Bank seeing through a successful second round of the Long-Term Refinancing Operation,providing around E500 billion in additional liquidity. This removed the threat of any immediate credit crisis in the European banking system.More broadly, data and policy announcements in the US, Germany and China pointed to a more positive skew in the economic picture. Anote of caution appeared towards the end of the period as old fears regarding a Euro break up and commensurate instability in theEuropean banking system came to the fore. This coincided with weaker leading indicators in both Europe and the US.
The fund performed well in the six months to the end of April, continuing a period of very strong returns relative to both peer group andindex. As we would expect, given the stock selection nature of the fund, stock picking rather than sector selection drove performance overthe period. Stock selection was particularly strong in the areas of healthcare and consumer discretionary. The use of multiple stockselection tools has been very well rewarded over the longer term, as tools tend to work in different areas and at different times of theeconomic and business cycle. The current six months have seen strong returns to cheaper stocks from expensive ones and those stocksenjoying analyst support performed well over the period.
OutlookOutlook Performance of the portfolio is strong over the short and medium term. The environment remains challenging for equities ingeneral as we work through a period of political, economic and financial uncertainty. The portfolio remains well placed to weather thestorm given the diverse investment tools utilised, together with strong risk management.
Risk WarningPlease remember that past performance is not a guide to future performance. The price of shares and the income from them may godown as well as up. You may not get back the amount you invest. The fund may not be suitable for everyone and if in doubt you shouldseek advice from your financial adviser.
Note:
External sources of underlying economic data used by Old Mutual Asset Managers (UK) Limited include MSCI, Datastream and Factset.
Market performance data is sourced from Morningstar / Factset. Each quoted index or stock return is based on the price movementbetween the market close on 31 October 2007 and the close on 30 April 2012. Returns quoted are sterling or local currency returns asspecified.
30 April 2012Old Mutual Asset Managers (UK) Limited
Old Mutual Investment Funds Series II
Old Mutual Japanese Select Fund
36

Net Asset Value per Share
The fund was launched on 18 June 1986. Income and accumulation units were first issued on that date at 50p per unit. On 19 September2007, the fund was converted to a sub fund of an Open Ended Investment Company, Old Mutual Investment Funds Series II. On 10 April2012 class C accumulation shares were launched.
Fund size
Date Net asset value
£
Net asset value
per share
(pence)
Equivalent number
of shares
in issue
31 October 2010 Class A Acc 22,990,478 78.87 29,151,237
31 October 2011 Class A Acc 20,684,456 84.96 24,345,095
30 April 2012 Class A Acc 17,100,456 87.64 19,512,894
30 April 2012 Class C Acc 719,699 97.27 739,928
Old Mutual Investment Funds Series II
Old Mutual Japanese Select Fund
37

Stamp Duty Reserve Tax (SDRT)The SDRT regime, applicable to the fund is explained on page 63.
Total Expense Ratio (TER)
As at
30 April 2012
As at
31 October 2011
Share Class A 1.82 1.82
Share Class C 1.07 -
The TER takes into account the ACD fee and all other operating expenses over the relevant financial period.
Old Mutual Investment Funds Series II
Old Mutual Japanese Select Fund
38

Portfolio Statement (unaudited)As at 30 April 2012
Holding Fair
value
£000
Percentage of
total net assets
%
Equities (31 October 2011 84.42%)
Airlines (31 October 2011 0.00%)
Skymark Airlines 1,900 9 0.05
Automobiles (31 October 2011 7.62%)
Honda Motor 19,600 435 2.44
Nissan Motor 33,900 216 1.21
Toyota Motor Corp 48,000 1,213 6.81
1,864 10.46
Building Products (31 October 2011 0.00%)
Central Glass Co 4,000 10 0.06
Capital Markets (31 October 2011 0.00%)
Nomura 2,000 5 0.03
Chemicals (31 October 2011 7.34%)
Adeka 3,300 19 0.11
DIC 38,000 48 0.27
Mitsubishi Chemical Holdings Corp 39,500 127 0.71
Toagosei 7,000 19 0.11
Tosoh Corp 59,000 100 0.56
313 1.76
Commercial Banks (31 October 2011 7.20%)
Aozora Bank 100,000 157 0.88
Bank of Yokohama 53,000 157 0.88
Daishi Bank 5,000 9 0.05
Fukuoka 43,000 110 0.62
Higo 2,000 7 0.04
Mitsubishi UFJ Financial Group 337,600 997 5.60
Nishi-Nippon City Bank 14,000 23 0.13
San-in Godo Bank 2,000 9 0.05
Sumitomo Mitsui Trust 40,000 72 0.40
1,541 8.65
Commercial Services & Supplies (31 October 2011 0.22%)
Dai Nippon Printing 9,000 49 0.27
Construction & Engineering (31 October 2011 0.42%)
Kandenko 2,000 5 0.03
Kinden Corp 3,000 13 0.07
18 0.10
Consumer Finance (31 October 2011 2.43%)
Acom 24,290 322 1.81
Credit Saison 21,700 287 1.61
Hitachi Capital Corp 17,100 174 0.97
783 4.39
Containers & Packaging (31 October 2011 0.20%)
Toyo Seikan Kaisha 27,400 225 1.26
Distributors (31 October 2011 0.00%)
Canon Marketing Japan 700 6 0.03
Old Mutual Investment Funds Series II
Old Mutual Japanese Select Fund
39

Holding Fair
value
£000
Percentage of
total net assets
%
Distributors (31 October 2011 0.00%) - (continued)
Paltac 700 6 0.04
12 0.07
Diversified Financial Services (31 October 2011 0.06%)
Fuyo General Lease 800 16 0.09
Mitsubishi UFJ Lease 5,060 129 0.72
Ricoh Leasing 500 7 0.04
152 0.85
Electric Utilities (31 October 2011 0.66%)
Okinawa Electric Power 800 19 0.11
Electrical Equipment (31 October 2011 0.38%)
Nissin Electric 9,000 32 0.18
Electronic Equipment & Instruments (31 October 2011 2.35%)
Fujifilm Holdings Corp 39,500 517 2.90
Food & Staples Retailing (31 October 2011 4.61%)
Aeon 4,100 33 0.18
Heiwado 4,000 35 0.20
Seven & I 18,800 349 1.96
Tsuruha 400 15 0.08
UNY 34,800 248 1.39
Valor 2,800 30 0.17
710 3.98
Food Products (31 October 2011 0.59%)
Morinaga Milk Industry 16,000 36 0.20
Health Care Providers & Services (31 October 2011 3.24%)
Medipal 28,500 221 1.24
Ship Healthcare 6,900 100 0.56
Suzuken 5,200 96 0.54
Toho 7,000 84 0.47
501 2.81
Healthcare Equipment & Supplies (31 October 2011 0.00%)
Hogy Medical 300 8 0.04
Household Durables (31 October 2011 0.00%)
Sekisui House 54,000 307 1.72
Industrial Conglomerates (31 October 2011 0.00%)
Nisshinbo 20,000 108 0.61
Insurance (31 October 2011 1.77%)
Tokio Marine 4,700 74 0.42
Internet & Catalogue Retail (31 October 2011 2.15%)
Start Today 10,300 97 0.54
Internet Software & Services (31 October 2011 2.07%)
Dena 9,000 173 0.97
Gree 32,600 536 3.01
709 3.98
Old Mutual Investment Funds Series II
Old Mutual Japanese Select Fund
40
Portfolio Statement (unaudited)As at 30 April 2012 (continued)

Holding Fair
value
£000
Percentage of
total net assets
%
IT Services (31 October 2011 3.39%)
IT Holdings Corp 20,500 162 0.91
Itochu Techno-Solutions Corp 2,600 72 0.41
Net One Systems 33,200 278 1.56
Sumisho Computer Systems 27,000 257 1.44
769 4.32
Leisure Equipment & Products (31 October 2011 1.65%)
Heiwa Corp 12,100 154 0.86
Namco Bandai 29,900 263 1.48
Universal Entertainment 1,200 17 0.10
434 2.44
Machinery (31 October 2011 4.27%)
Asahi Diamond Industrial 2,400 16 0.09
Hino Motors 18,000 79 0.44
Komatsu 3,800 67 0.38
NGK Insulators 7,000 54 0.30
216 1.21
Media (31 October 2011 2.19%)
Cyberagent 111 209 1.17
Fuji Media 52 54 0.30
SKY Perfect JSAT 977 261 1.47
TBS 2,900 24 0.14
TV Asahi 22 20 0.11
568 3.19
Metals & Mining (31 October 2011 0.49%)
Aichi Steel Corp 3,000 9 0.05
Yodogawa Steel Works 2,000 5 0.03
14 0.08
Multiline Retail (31 October 2011 0.93%)
Izumi 2,100 27 0.15
Oil (31 October 2011 2.70%)
Idemitsu Kosan 5,100 288 1.62
Inpex 160 649 3.64
Japan Petroleum Exploration 6,300 177 0.99
1,114 6.25
Pharmaceuticals (31 October 2011 5.25%)
Kaken Pharmaceutical 14,000 106 0.59
Kissei Pharmaceutical 700 8 0.04
Kyorin 3,000 35 0.20
Otsuka 33,900 626 3.51
Shionogi 34,400 275 1.55
1,050 5.89
Real Estate Management & Development (31 October 2011 2.39%)
Daikyo 26,000 42 0.23
Daito Trust Construction 8,900 491 2.76
533 2.99
Old Mutual Investment Funds Series II
Old Mutual Japanese Select Fund
41
Portfolio Statement (unaudited)As at 30 April 2012 (continued)

Holding Fair
value
£000
Percentage of
total net assets
%
Road & Rail (31 October 2011 5.13%)
Central Japan Railway 128 651 3.65
Nippon Express 22,000 51 0.29
Sankyu 8,000 19 0.11
Seino 42,000 179 1.00
900 5.05
Semiconductors & Semiconductor Equipment (31 October 2011 0.00%)
Rohm 2,000 56 0.31
Sumco 53,900 353 1.99
409 2.30
Specialty Retail (31 October 2011 4.18%)
Aoyama Trading 13,700 174 0.98
DCM 16,700 77 0.43
K’s 3,200 59 0.33
Sanrio 2,800 75 0.42
Shimachu 14,300 197 1.11
United Arrows 14,800 207 1.16
Xebio 1,900 32 0.18
Yamada Denki 3,580 143 0.80
964 5.41
Tobacco (31 October 2011 0.00%)
Japan Tobacco 124 421 2.36
Trading Companies & Distributors (31 October 2011 7.84%)
Itochu Corp 93,800 651 3.66
Marubeni Corp 82,000 350 1.96
Mitsubishi 21,100 282 1.58
Sumitomo Corp 57,000 497 2.79
1,780 9.99
Wireless Telecommunication Services (31 October 2011 0.70%)
E-Access 901 111 0.62
Softbank 3,000 55 0.31
166 0.93
Futures (31 October 2011 0.02%)
Mini Topix Tokyo 07 June 2012 59 (6) (0.03)
Other (31 October 2011 14.07%)
Portfolio of Investments 17,458 97.97
Net Current Assets
(31 October 2011 1.49%) 362 2.03
Net Assets17,820 100.00
All the above investments are denominated in sterling, unless indicated otherwise.
Unless otherwise stated, all investments are listed or traded on an eligible exchange.
Old Mutual Investment Funds Series II
Old Mutual Japanese Select Fund
42
Portfolio Statement (unaudited)As at 30 April 2012 (continued)

Statement of Total Return (unaudited)For the Period ended 30 April 2012
1 November 2011 -
30 April 2012
1 November 2010 -
30 April 2011
Income £000 £000 £000 £000
Net capital gains 331 1,132
Revenue 224 207
Expenses (157) (209)
Net revenue/(expense) before taxation 67 (2)
Taxation (15) (18)
Net revenue/(expense) after taxation 52 (20)
Total return before distributions 383 1,112
Finance costs: Distributions (6) -
Change in net assets attributable to shareholders from investment
activities 377 1,112
Statement of Change in Net Assets Attributable to Shareholders (unaudited)For the Period ended 30 April 2012
1 November 2011 -
30 April 2012
1 November 2010 -
30 April 2011
£000 £000 £000 £000
Opening net assets attributable to shareholders 20,684 22,990
Amounts receivable on issue of shares 3,087 2,099
Amounts payable on cancellation of shares (6,328) (4,624)
(3,241) (2,525)
Change in net assets attributable to shareholders from investment
activities 377 1,112
Closing net assets attributable to shareholders 17,820 21,577
Balance Sheet (unaudited)As at 30 April 2012
As at
30 April 2012
As at
31 October 2011
£000 £000
Assets
Investment assets 17,458 20,375
Debtors 906 984
Cash and bank balances 215 148
Total other assets 1,121 1,132
Total assets 18,579 21,507
Liabilities
Creditors 759 823
Total other liabilities 759 823
Total liabilities 759 823
Net assets attributable to shareholders 17,820 20,684
Old Mutual Investment Funds Series II
Old Mutual Japanese Select Fund
43

Investment Adviser’s ReportFor the period ended 30 April 2012
Performance
6 months to
30 April
2012
1 year to 31
October
2011
1 year to 31
October
2010
1 year to 31
October
2009
1 year to 31
October
2008
1 year to 31
October
2007
Old Mutual North American
Equity Fund 8.97% 15.38% 19.07% 7.02% -25.9% 4.03%
IMA North America sector
return 8.34% 6.09% 16.04% 13.92% -22.12% 6.18%
Quartile 2 1 1 4 4 3
MSCI North American Index 11.2% 6.41% 21.10% 9.59% -18.97% 7.43%
Data Source - # Morningstar, bid to bid, net income reinvested, sterling
Investment Objectives, Policy and StrategyTo achieve long term capital growth through the active management of a diversified portfolio invested primarily in North American stockmarkets.
Subject to the regulations, the property of the fund may include transferable securities, shares in collective investment schemes (includingthose managed or operated by the ACD or an associate of the ACD), warrants, money market instruments, deposits and derivatives.
The fund will initially only use derivatives for Efficient Portfolio Management purposes. The fund may use derivatives for purposes otherthan EPM, provided it has given shareholders 60 days notice of such change. If the fund did use derivatives for investment purposes, thenet asset value of the fund would therefore, at times, be highly volatile and the risk profile of the fund might change.
The fund is designed to generate long term capital appreciation through a diversified portfolio of investments in North America, primarilythe United States. The portfolio is managed using an active quantitative process which employs a number of ‘return factors’ to generatereturn forecasts for each stock in the investment universe. Holdings are drawn primarily from the MSCI North America Index.
ReviewEquity returns for the six months to the end of April 2012 were generally strongly positive as investor sentiment improved from the deeppessimism seen in the summer of 2011. The returns have come at a time of significant volatility as investors reacted to a changing macroenvironment. The major theme throughout global equities remains the fluid nature of European political and liquidity risk. The Europeanagreement in October 2011 detailing banking recapitalisation and an increase the size of the bailout in Europe sparked the rally. This wascontinued in the first two months of 2012 with the European Central Bank seeing through a successful second round of the Long-TermRefinancing Operation, providing around E500 billion in additional liquidity. This removed the threat of any immediate credit crisis in theEuropean banking system. More broadly, data and policy announcements in the US, Germany and China pointed to a more positive skewin the economic picture. A note of caution appeared towards the end of the period as old fears regarding a Euro break up andcommensurate instability in the European banking system came to the fore. This coincided with weaker leading indicators in both Europeand the US.
The fund performed well in the six months to the end of April, continuing a period of very strong returns relative to both peer group andindex. As we would expect, given the stock selection nature of the fund, stock picking rather than sector selection drove performance overthe period. Stock selection was particularly strong in the areas of industrials and consumer staples. The use of multiple stock selectiontools has been very well rewarded over the longer term, as tools tend to work in different areas and at different times of the economic andbusiness cycle. The current six months have seen strong returns to cheaper stocks from expensive ones and those stocks enjoyinganalyst support performed well over the period.
OutlookPerformance of the portfolio is strong over the short and medium term. The environment remains challenging for equities in general as wework through a period of political, economic and financial uncertainty. The portfolio remains well placed to weather the storm given thediverse investment tools utilised, together with strong risk management.
Risk WarningPlease remember that past performance is not a guide to future performance. The price of shares and the income from them may godown as well as up. You may not get back the amount you invest. The fund may not be suitable for everyone and if in doubt you shouldseek advice from your financial adviser.
Note:
External sources of underlying economic data used by Old Mutual Asset Managers (UK) Limited include MSCI, Datastream and Factset.
Market performance data is sourced from Morningstar / Factset. Each quoted index or stock return is based on the price movementbetween the market close on 31 October 2007 and the close on 30 April 2012. Returns quoted are sterling or local currency returns asspecified.
30 April 2012Old Mutual Asset Managers (UK) Limited
Old Mutual Investment Funds Series II
Old Mutual North American Equity Fund
44

Net Asset Value per Share
The fund was launched on 6 April 1985. Income and accumulation units were issued on that date at 50p per unit. On 19 September 2007,the fund was converted to a sub fund of an Open Ended Investment Company, Old Mutual Investment Funds Series II. On 10 April 2012class C accumulation shares were launched.
Fund size
Date Net asset value
£
Net asset value
per share
(pence)
Equivalent number
of shares
in issue
31 October 2010 Class A Acc 67,332,825 322.36 20,887,646
31 October 2010 Class B Acc 10,679 106.79 10,000
31 October 2011 Class A Acc 68,339,119 371.94 18,373,885
31 October 2011 Class B Acc 12,385 123.85 10,000
30 April 2012 Class A Acc 63,650,810 405.29 15,704,955
30 April 2012 Class B Acc 10,629 135.40 7,850
30 April 2012 Class C Acc 1,724,502 98.32 1,753,906
Old Mutual Investment Funds Series II
Old Mutual North American Equity Fund
45

Stamp Duty Reserve Tax (SDRT)The SDRT regime, applicable to the fund is explained on page 63.
Total Expense Ratio (TER)
As at
30 April 2012
As at
31 October 2011
Share Class A 1.73 1.73
Share Class B 1.23 1.23
Share Class C 0.98 -
The TER takes into account the ACD fee and all other operating expenses over the relevant financial period.
Old Mutual Investment Funds Series II
Old Mutual North American Equity Fund
46

Portfolio Statement (unaudited)As at 30 April 2012
Holding Fair
value
£000
Percentage of
total net assets
%
Canada (31 October 2011 6.71%)
Equities (31 October 2011 6.71%)
Commercial Banks (31 October 2011 0.03%)
National Bank of Canada 5,927 286 0.44
Royal Bank of Canada 549 20 0.03
306 0.47
Energy Equipment & Services (31 October 2011 0.74%)
Calfrac Well Services 2,902 48 0.07
Precision Drilling Corp 25,257 144 0.22
Trican Well Service 4,441 39 0.06
231 0.35
Food & Staples Retailing (31 October 2011 0.80%)
Alimentation Couche-Tard 15,426 413 0.63
Metro 7,676 260 0.40
673 1.03
Food Products (31 October 2011 0.12%)
Maple Leaf Foods 6,059 49 0.08
Internet Software & Services (31 October 2011 0.00%)
Open Text 3,151 110 0.17
Machinery (31 October 2011 0.00%)
Toromont Industries 4,166 57 0.09
Metals & Mining (31 October 2011 0.38%)
Centerra Gold 17,753 139 0.21
Sherritt 61,538 217 0.33
356 0.54
Multi-Utilities (31 October 2011 1.82%)
Atco 15,618 720 1.10
Oil (31 October 2011 1.06%)
CDN Oil 6,665 90 0.14
Imperial Oil 4,191 119 0.18
Nexen 15,759 188 0.29
Petrominerales 32,528 285 0.43
Trilogy Energy 32,095 536 0.82
1,218 1.86
Software (31 October 2011 0.65%)
Macdonald Dettwiler & Associates 21,963 600 0.92
Thrifts & Mortgage Finance (31 October 2011 0.00%)
Genworth MI Canada 2,967 38 0.06
Trading Companies & Distributors (31 October 2011 0.00%)
Finning 7,566 133 0.20
Old Mutual Investment Funds Series II
Old Mutual North American Equity Fund
47

Holding Fair
value
£000
Percentage of
total net assets
%
Wireless Telecommunication Services (31 October 2011 1.11%)
Rogers Communications 29,025 667 1.02
Total Canada 5,158 7.89
Cayman Islands (31 October 2011 1.05%)
Equities (31 October 2011 1.05%)
Personal Products (31 October 2011 1.05%)
Herbalife 16,343 708 1.09
United States (31 October 2011 79.20%)
Equities (31 October 2011 79.20%)
Aerospace & Defence (31 October 2011 3.95%)
Boeing 19,102 908 1.39
Lockheed Martin Corp 13,415 753 1.15
Rockwell Collins 14,070 487 0.75
Textron 19,749 328 0.50
2,476 3.79
Air Freight & Logistics (31 October 2011 1.27%)
United Parcel Service ’B’ 3,637 176 0.27
Airlines (31 October 2011 0.00%)
Alaska Air 18,489 387 0.59
Beverages (31 October 2011 2.00%)
Coca-Cola 421 20 0.03
Constellation Brand ’A’ 25,558 342 0.52
Monster Beverage Corp 7,454 300 0.46
662 1.01
Biotechnology (31 October 2011 2.52%)
Amgen 17,439 768 1.17
Celgene 17,040 769 1.18
Gilead Sciences 25,069 804 1.23
2,341 3.58
Capital Markets (31 October 2011 3.02%)
Raymond James Financial 2,220 51 0.08
Chemicals (31 October 2011 2.08%)
WR Grace 18,698 687 1.05
Commercial Banks (31 October 2011 1.15%)
BB & T Corp 1,428 29 0.04
Suntrust Banks 22,330 341 0.52
Wells Fargo & Co 11,236 233 0.36
603 0.92
Commercial Services & Supplies (31 October 2011 0.00%)
Copart 6,331 104 0.16
Communications Equipment (31 October 2011 0.09%)
Cisco Systems 33,217 408 0.62
Old Mutual Investment Funds Series II
Old Mutual North American Equity Fund
48
Portfolio Statement (unaudited)As at 30 April 2012 (continued)

Holding Fair
value
£000
Percentage of
total net assets
%
Computers & Peripherals (31 October 2011 1.80%)
Apple 5,022 1,862 2.85
Dell 75,526 764 1.17
Hewlett-Packard 21,545 328 0.50
Seagate Technology 14,653 266 0.40
3,220 4.92
Consumer Finance (31 October 2011 3.16%)
American Express 27,083 1,002 1.54
Capital One Financial Corp 11,803 407 0.62
Cash America International 12,552 361 0.55
Credit Acceptance Corp 5,879 346 0.53
2,116 3.24
Diversified Consumer Services (31 October 2011 1.88%)
Apollo Group ’A’ 9,851 217 0.33
ITT Educational Services 10,698 431 0.66
648 0.99
Diversified Financial Services (31 October 2011 0.11%)
Bank of America Corp 117,622 596 0.91
CBOE 38,939 641 0.98
Citigroup 2,034 42 0.06
JPMorgan Chase 4,519 120 0.19
1,399 2.14
Diversified Telecommunication Services (31 October 2011 2.27%)
AT&T 9,949 200 0.31
Electric Utilities (31 October 2011 2.38%)
Duke Energy 27,938 368 0.56
Pepco 42,398 491 0.75
859 1.31
Electronic Equipment & Instruments (31 October 2011 0.00%)
Jabil Circuit 15,266 221 0.34
Energy Equipment & Services (31 October 2011 2.95%)
Core Laboratories 8,255 691 1.06
Food & Staples Retailing (31 October 2011 3.13%)
CVS Caremark 8,884 245 0.38
Kroger 47,897 688 1.05
Safeway 49,778 636 0.97
1,569 2.40
Food Products (31 October 2011 0.00%)
Campbell Soup Company 15,954 332 0.51
Dean Foods 2,760 21 0.03
Smithfield Foods 13,473 176 0.27
The Hershey 6,780 278 0.42
807 1.23
Health Care Providers & Services (31 October 2011 5.08%)
Aetna 23,190 620 0.95
Humana 13,461 727 1.11
Old Mutual Investment Funds Series II
Old Mutual North American Equity Fund
49
Portfolio Statement (unaudited)As at 30 April 2012 (continued)

Holding Fair
value
£000
Percentage of
total net assets
%
Health Care Providers & Services (31 October 2011 5.08%) - (continued)
Magellan Health Services 1,197 34 0.05
United Health Group 23,756 846 1.30
WellPoint 1,389 59 0.09
2,286 3.50
Hotels (31 October 2011 0.00%)
Brinker International 25,625 497 0.76
Marriott 28,592 695 1.06
1,192 1.82
Household Durables (31 October 2011 0.00%)
Tempur Pedic International 5,846 214 0.33
Household Products (31 October 2011 1.68%)
Colgate-Palmolive 13,807 835 1.28
Procter & Gamble 3,980 158 0.24
993 1.52
Independent Power Producers & Energy Traders (31 October 2011 0.00%)
AES 89,252 684 1.05
NRG Energy 69,781 714 1.09
1,398 2.14
Industrial Conglomerates (31 October 2011 0.37%)
General Electric 23,269 283 0.43
Insurance (31 October 2011 1.87%)
Aflac 15,638 434 0.66
Allstate 10,636 220 0.34
Assurant 26,158 654 1.00
CNO Financial 75,668 349 0.53
Erie Indemnity 787 37 0.06
Genwaorth Financial ’A’ 76,250 280 0.43
Hartford Financial Services 28,442 363 0.55
Lincoln National 41,811 634 0.97
Principal Financial Group 13,382 228 0.35
Prudential Financial 20,737 783 1.20
Validus 32,701 653 1.00
4,635 7.09
Internet & Catalogue Retail (31 October 2011 2.24%)
Expedia 32,348 802 1.23
Internet Software & Services (31 October 2011 1.51%)
Google 1,376 520 0.80
IT Services (31 October 2011 4.28%)
Accenture 21,564 862 1.32
Alliance Data 8,669 695 1.06
Gartner 26,160 699 1.07
International Business Machine Corp 13,618 1,733 2.65
Mastercard ’A’ 1,334 375 0.58
The Western Union Company 34,474 394 0.60
4,758 7.28
Old Mutual Investment Funds Series II
Old Mutual North American Equity Fund
50
Portfolio Statement (unaudited)As at 30 April 2012 (continued)

Holding Fair
value
£000
Percentage of
total net assets
%
Machinery (31 October 2011 0.62%)
Caterpillar 14,815 952 1.45
Deere 15,367 783 1.20
Wabco 12,103 469 0.72
2,204 3.37
Media (31 October 2011 0.35%)
Lions Gate Entertainment 40,754 312 0.48
Mcgraw Hill Companies 24,094 729 1.11
Virgin Media 45,019 677 1.04
1,718 2.63
Multi-Utilities (31 October 2011 0.32%)
DTE Energy 6,780 235 0.36
Oil (31 October 2011 7.75%)
Chevron Corp 16,899 1,104 1.69
Exxon Mobil Corp 22,215 1,176 1.80
Marathon Petroleum 6,935 176 0.27
Rosetta Resources 8,959 277 0.42
2,733 4.18
Personal Products (31 October 2011 0.00%)
Nu Skin Enterprises 18,173 583 0.89
Pharmaceuticals (31 October 2011 2.26%)
Jazz Pharmaceuticals 22,894 728 1.11
Johnson & Johnson 3,988 159 0.24
Pfizer 8,608 122 0.19
Questcor Pharmaceuticals 24,622 677 1.04
Warmer Chilcott 65,825 761 1.16
2,447 3.74
Road & Rail (31 October 2011 1.06%)
Hunt (J.B) Transport Services 20,162 690 1.06
Semiconductors & Semiconductor Equipment (31 October 2011 2.02%)
Cypress Semiconductors 70,241 646 0.99
Intel Corp 8,592 150 0.23
LSI 128,860 626 0.95
1,422 2.17
Software (31 October 2011 4.91%)
Intuit 17,729 633 0.96
Microsoft Corp 88,049 1,731 2.65
Oracle Corp 12,025 216 0.33
2,580 3.94
Specialty Retail (31 October 2011 4.13%)
Advance Auto Parts 11,853 673 1.03
Buckle 12,513 359 0.55
Express Scripts 43,761 654 1.00
Gamestop 32,392 452 0.69
Limited Brands 24,926 781 1.20
Pier 1 Imports 29,244 322 0.49
Ross Stores 4,774 183 0.28
Select Comfort 18,588 342 0.52
Old Mutual Investment Funds Series II
Old Mutual North American Equity Fund
51
Portfolio Statement (unaudited)As at 30 April 2012 (continued)

Holding Fair
value
£000
Percentage of
total net assets
%
Specialty Retail (31 October 2011 4.13%) - (continued)
TJX Companies 31,062 811 1.24
4,577 7.00
Textiles (31 October 2011 1.77%)
Coach 16,115 733 1.12
Tobacco (31 October 2011 3.00%)
Lorillard 8,970 749 1.14
Philip Morris International 24,717 1,365 2.09
2,114 3.23
Trading Companies & Distributors (31 October 2011 0.00%)
United Rentals 4,430 128 0.19
Wireless Telecommunication Services (31 October 2011 0.22%)
US Cellular Corp 755 18 0.03
Total United States 58,888 90.06
Futures (31 October 2011 0.08%)
S&P 500 15 June 2012 14 8 0.01
Other (31 October 2011 16.97%)
Portfolio of investments 64,762 99.05
Net Current Assets
(31 October 2011 0.08%) 624 0.95
Net Assets65,386 100.00
All the above investments are denominated in sterling, unless indicated otherwise.
Unless otherwise stated, all investments are listed or traded on an eligible exchange.
Old Mutual Investment Funds Series II
Old Mutual North American Equity Fund
52
Portfolio Statement (unaudited)As at 30 April 2012 (continued)

Statement of Total Return (unaudited)For the Period ended 30 April 2012
1 November 2011 -
30 April 2012
1 November 2010 -
30 April 2011
Income £000 £000 £000 £000
Net capital gains 4,774 10,503
Revenue 612 556
Expenses (524) (595)
Net revenue/(expense) before taxation 88 (39)
Taxation (83) (77)
Net revenue/(expense) after taxation 5 (116)
Total return before distributions 4,779 10,387
Finance costs: Distributions (6) (1)
Change in net assets attributable to shareholders from investment
activities 4,773 10,386
Statement of Change in Net Assets Attributable to Shareholders (unaudited)For the Period ended 30 April 2012
1 November 2011 -
30 April 2012
1 November 2010 -
30 April 2011
£000 £000 £000 £000
Opening net assets attributable to shareholders 68,352 67,344
Amounts receivable on issue of shares 10,328 4,282
Amounts payable on cancellation of shares (18,067) (9,346)
(7,739) (5,064)
Change in net assets attributable to shareholders from investment
activities 4,773 10,386
Closing net assets attributable to shareholders 65,386 72,666
Balance Sheet (unaudited)As at 30 April 2012
As at
30 April 2012
As at
31 October 2011
£000 £000
Assets
Investment assets 64,762 68,295
Debtors 227 194
Cash and bank balances 672 592
Total other assets 899 786
Total assets 65,661 69,081
Liabilities
Creditors 275 729
Total other liabilities 275 729
Total liabilities 275 729
Net assets attributable to shareholders 65,386 68,352
Old Mutual Investment Funds Series II
Old Mutual North American Equity Fund
53

Investment Adviser’s ReportFor the period ended 30 April 2012
Performance
6 months to
30 April
2012
1 year to 31
October
2011
1 year to 31
October
2010
1 year to 31
October
2009
1 year to 31
October
2008
1 year to 31
October
2007
Old Mutual UK Select Equity
Fund* 9.82% 0.32% 14.76% 36.87% -42.36% 9.95%
IMA UK All Companies sector
return 6.13% 1.18% 15.53% 31.11% -37.77% 12.32%
Quartile 1 3 2 1 4 3
FTSE All-Share Index 6.25% 0.63% 17.47% 23.47% -34.36% 13.62%
*Income shares
Data Source - # Morningstar, bid to bid, net income reinvested, sterling
Investment Objectives, Policy and StrategyTo achieve long term capital growth through the active management of a diversified portfolio invested primarily in a broad range of UKequities.
Subject to the regulations, the property of the fund may include transferable securities; units in collective investment schemes (includingthose managed or operated by the ACD or an associate of the ACD), warrants, money market instruments, deposits and derivatives. Thefund will initially only use derivatives for EPM purposes.
The fund may use derivatives for purposes other than Efficient Portfolio Management, provided it has given shareholders 60 days noticeof such change. If the fund did use derivatives for investment purposes, the net asset value of the fund would therefore, at times, be highlyvolatile and the risk profile of the fund might change.
The UK Select Equity Fund is an actively managed fund aiming to provide capital growth from investment in a broad-based portfolio of UKcompanies. The fund aims to outperform the IMA UK All Companies sector average over rolling 12-month periods.
ReviewAfter the difficulties of the previous six months, the UK equity market made a welcome return to positive territory in the six months to endApril 2012, rising 6.3%. The majority of gains came in the New Year following the successful attempt by the European Central Bank torelieve pressure on the banking system through the announcement of the Long Term Refinancing Operation. Economic momentum in theUS accelerated encouragingly post the autumn 2011 lull whilst data from Europe and Asia were more muted. Company financialperformance remained robust with regional variations matching those of the broader economic environment.
Our decision to maintain a cyclical bias to the portfolio, as noted previously, proved beneficial as the fund rose 9.8%, comfortablyoutperforming both the benchmark and the peer group. Leading contributors to performance included industrial cyclical businesses suchas Ashtead, Wolseley and Spectris, whilst financial holdings such as SVG Capital and Barclays Bank also contributed positively. We alsobenefitted from not owning supermarket group Tesco whose shares suffered post a significant profit warning. Detractors to performanceincluded our investments in restaurant chain Restaurant Group, pay TV operator BSkyB, kitchens business Howden Joinery and by notowning beverage company Diageo.
In recognition of the strength of performance from many of our cyclical holdings we took a significant amount of profits towards the end ofthe period. Complete disposals included Spectris, Ashtead, Inchcape, ITV, Filtrona and Weir Group. The proceeds were used to introducenew investments to the portfolio which typically operate in less economically sensitive areas of the market including Glaxosmithkline(pharmaceuticals), Lancashire and Amlin (non-life insurance) and utility business National Grid. Other additions to the fund included OphirEnergy, Compass group, DS Smith and banking group HSBC.
OutlookWe remain positive on the outlook for UK equities from current levels and believe the economic and profit cycles have further to run.However, mindful of the recent strength in the equity market together with near-term uncertainty concerning elections in Europe and somemoderation in the pace of macro-economic growth momentum, we would not be surprised if indices continued to consolidate in the shorterterm. However with the corporate sector in good financial health, earnings continuing to grow this year and UK equities sitting at what westill consider to be very attractive valuation levels, we believe it is appropriate to maintain a constructive stance towards UK equities intothe medium term.
Risk WarningPlease remember that past performance is not a guide to future performance. The price of shares and the income from them may godown as well as up. You may not get back the amount you invest. The fund may not be suitable for everyone and if in doubt you shouldseek advice from your financial adviser.
Note:
External sources of underlying economic data used by Old Mutual Asset Managers (UK) Limited include MSCI, Datastream and Factset.
Market performance data is sourced from Morningstar / Factset. Each quoted index or stock return is based on the price movementbetween the market close on 31 October 2007 and the close on 30 April 2012. Returns quoted are sterling or local currency returns asspecified.
30 April 2012Old Mutual Asset Managers (UK) Limited
Old Mutual Investment Funds Series II
Old Mutual UK Select Equity Fund
54

Net Asset Value per Share
The fund was launched on 29 March 1971. Income units were first issued on that date at 5p per unit. Accumulation units were first issuedon 25 March 1986. On 2 January 1986, each unit income unit was subdivided into ten. On 19 September 2007, the fund was convertedinto a sub fund of an Open Ended Investment Company, Old Mutual Investment Funds Series II.
Fund size
Date Net asset value
£
Net asset value
per share
(pence)
Equivalent number
of shares
in issue
31 October 2010 Class A Inc 16,395,261 203.49 8,056,987
31 October 2010 Class A Acc 85,439,559 313.30 27,270,946
31 October 2010 Class B Acc 774,117 134.38 576,050
31 October 2010 Class C Inc 398,577 110.53 360,600
31 October 2011 Class A Inc 27,450,355 202.84 13,532,694
31 October 2011 Class A Acc 51,668,541 314.28 16,440,480
31 October 2011 Class B Acc 750,782 135.48 554,146
31 October 2011 Class C Inc 368,668 110.14 334,725
30 April 2012 Class A Inc 27,182,461 222.79 12,200,970
30 April 2012 Class A Acc 51,268,816 345.16 14,853,717
30 April 2012 Class B Acc 369,965 149.17 248,010
30 April 2012 Class C Inc 234,575 121.40 193,225
Old Mutual Investment Funds Series II
Old Mutual UK Select Equity Fund
55

Stamp Duty Reserve TaxThe SDRT regime, applicable to the scheme is explained on page 63.
Total Expense Ratio (TER)
As at
30 April 2012
As at
31 October 2011
Share Class A 1.70 1.70
Share Class B 1.20 1.20
Share Class C 0.95 0.95
The TER takes into account the ACD fee and all other operating expenses over the relevant financial period.
Old Mutual Investment Funds Series II
Old Mutual UK Select Equity Fund
56

Portfolio Statement (unaudited)As at 30 April 2012
Holding Fair
value
£000
Percentage of
total net assets
%
Equities (31 October 2011 88.62%)
Capital Markets (31 October 2011 0.00%)
Aberdeen Asset Management 371,232 1,050 1.33
SVG Capital 435,492 1,207 1.53
2,257 2.86
Commercial Banks (31 October 2011 7.53%)
Barclays 1,127,981 2,503 3.17
HSBC 566,476 3,163 4.00
Standard Chartered 200,005 3,029 3.83
8,695 11.00
Commercial Services & Supplies (31 October 2011 0.00%)
RPS Group 328,506 779 0.99
Consumer Finance (31 October 2011 0.00%)
Provident Financial 147,881 1,733 2.19
Containers & Packaging (31 October 2011 0.00%)
Rexam 156,198 676 0.86
Smith (DS) 528,321 903 1.14
1,579 2.00
Diversified Telecommunication Services (31 October 2011 2.54%)
BT Group 976,358 2,073 2.62
Energy Equipment & Services (31 October 2011 4.57%)
Petrofac 58,128 1,016 1.29
Wood Group (John) 147,189 1,158 1.46
2,174 2.75
Food & Staples Retailing (31 October 2011 1.05%)
Booker Group 1,677,965 1,332 1.68
Hotels (31 October 2011 2.40%)
Compass 187,247 1,212 1.53
Millennium & Copthorne 199,391 972 1.23
Restaurant Group 428,131 1,209 1.53
3,393 4.29
Household Durables (31 October 2011 3.68%)
Bellway 149,678 1,179 1.49
Berkeley 107,255 1,383 1.75
2,562 3.24
Insurance (31 October 2011 6.75%)
Amlin 303,893 1,008 1.27
Aviva 454,110 1,424 1.80
Lancashire 143,027 1,156 1.46
Legal & General Group 990,486 1,177 1.49
Prudential 249,580 1,887 2.39
6,652 8.41
Old Mutual Investment Funds Series II
Old Mutual UK Select Equity Fund
57

Holding Fair
value
£000
Percentage of
total net assets
%
Internet Software & Services (31 October 2011 1.58%)
Telecity Group 83,300 668 0.84
Machinery (31 October 2011 4.52%)
Melrose 134,512 591 0.75
Media (31 October 2011 3.89%)
Informa 237,229 985 1.25
Metals & Mining (31 October 2011 16.23%)
BHP Billiton 138,381 2,748 3.48
Kenmare Resources 2,457,430 1,275 1.61
Rio Tinto 87,963 3,070 3.88
Xstrata 174,862 2,087 2.64
9,180 11.61
Multi-Utilities (31 October 2011 0.00%)
National Grid 262,925 1,733 2.19
Oil (31 October 2011 14.82%)
BG Group 208,118 3,016 3.82
BP 719,167 3,182 4.03
Ophir Energy 175,737 1,005 1.27
Premier Oil 362,175 1,367 1.73
Royal Dutch Shell ‘B’ 177,130 3,971 5.02
Tullow Oil 150,967 2,311 2.92
14,852 18.79
Pharmaceuticals (31 October 2011 0.96%)
GlaxoSmithKline 224,829 3,218 4.07
Shire 137,323 2,777 3.51
5,995 7.58
Pharmaceuticals & Biotechnology (31 October 2011 0.00%)
Biotech* 65,001 - -
Real Estate Investment Trusts (REITs) (31 October 2011 1.83%)
Land Securities 140,938 1,032 1.31
Software (31 October 2011 1.85%)
Aveva Group 73,997 1,222 1.54
Sage Group 488,322 1,405 1.78
2,627 3.32
Specialty Retail (31 October 2011 3.26%)
Howden Joinery Group 1,230,017 1,508 1.91
Support Services (31 October 2011 1.80%)
Experian 54,693 539 0.68
Thrifts & Mortgage Finance (31 October 2011 1.65%)
Paragon Group 795,496 1,443 1.83
Trading Companies & Distributors (31 October 2011 4.36%)
Wolseley 43,177 1,026 1.30
Old Mutual Investment Funds Series II
Old Mutual UK Select Equity Fund
58
Portfolio Statement (unaudited)As at 30 April 2012 (continued)

Holding Fair
value
£000
Percentage of
total net assets
%
Wireless Telecommunication Services (31 October 2011 3.35%)
Vodafone Group 2,153,680 3,660 4.63
Other (31 October 2011 10.91%)
Portfolio of Investments 79,068 100.02
Net Current Liabilities
(31 October 2011 0.47%) (12) (0.02)
Net Assets79,056 100.00
* The value of this stock is negligible.
All the above investments are denominated in sterling.
Unless otherwise stated, all investments are ordinary shares or stocks and are listed or traded on an eligible exchage.
Old Mutual Investment Funds Series II
Old Mutual UK Select Equity Fund
59
Portfolio Statement (unaudited)As at 30 April 2012 (continued)

Statement of Total Return (unaudited)For the Period ended 30 April 2012
1 November 2011 -
30 April 2012
1 November 2010 -
30 April 2011
Income £000 £000 £000 £000
Net capital gains 6,552 11,549
Revenue 1,004 989
Expenses (649) (891)
Net revenue before taxation 355 98
Taxation - (5)
Net revenue after taxation 355 93
Total return before distributions 6,907 11,642
Finance costs: Distributions (14) -
Change in net assets attributable to shareholders from investment
activities 6,893 11,642
Statement of Change in Net Assets Attributable to Shareholders (unaudited)For the Period ended 30 April 2012
1 November 2011 -
30 April 2012
1 November 2010 -
30 April 2011
£000 £000 £000 £000
Opening net assets attributable to shareholders 80,238 103,008
Amounts receivable on issue of shares 8,406 27,153
Amounts payable on cancellation of shares (16,470) (32,502)
(8,064) (5,349)
SDRT (see page 63) (13) (18)
Change in net assets attributable to shareholders from investment
activities 6,893 11,642
Unclaimed distribution 2 2
Closing net assets attributable to shareholders 79,056 109,285
Balance Sheet (unaudited)As at 30 April 2012
As at
30 April 2012
As at
31 October 2011
£000 £000
Assets
Investment assets 79,068 79,864
Debtors 682 2,745
Cash and bank balances 379 839
Total other assets 1,061 3,584
Total assets 80,129 83,448
Liabilities
Creditors 1,073 3,037
Distribution payable on income shares - 173
Total other liabilities 1,073 3,210
Total liabilities 1,073 3,210
Net assets attributable to shareholders 79,056 80,238
Old Mutual Investment Funds Series II
Old Mutual UK Select Equity Fund
60

Statement of Total Return (unaudited)For the year ended 30 April 2012
1 November 2011 -
30 April 2012
1 November 2010 -
30 April 2011
Income £000 £000 £000 £000
Net capital gains (21) 28,123
Revenue 10,179 7,656
Expenses (4,999) (5,350)
Finance costs: Interest (445) -
Net revenue before taxation 4,735 2,306
Taxation (244) (208)
Net revenue after taxation 4,491 2,098
Total return before distributions 4,470 30,221
Finance costs: Distributions (3,661) (2,225)
Change in net assets attributable to shareholders from
investment activities 809 27,996
Statement of Change in Net Assets Attributable to Shareholders (unaudited)For the year ended 30 April 2012
1 November 2011 -
30 April 2012
1 November 2010 -
30 April 2011
£000 £000 £000 £000
Opening net assets attributable to shareholders 876,587 767,408
Amounts receivable on creation of shares 261,286 255,216
Amounts payable on cancellation of shares (245,475) (163,324)
15,811 91,892
SDRT (see page 63) (12) (20)
Change in net assets attributable to shareholders from investment
activities 809 27,996
Unclaimed distribution 3 3
Retained distribution on accumulation shares 1,224 698
Closing net assets attributable to shareholders 894,422 887,977
Balance Sheet (unaudited)As at 30 April 2012
As at
30 April 2012
As at
31 October 2011
£000 £000
Assets
Investments assets 841,096 857,956
Current assets
Debtors 17,205 18,577
Cash and bank balances 47,430 13,480
Total other assets 64,635 32,057
Total assets 905,731 890,013
Current liabilities
Creditors 10,214 12,651
Distribution payable on income shares 1,095 775
Total other liabilities 11,309 13,426
Total liabilities 11,309 13,426
Net assets attributable to shareholders 894,422 876,587
Old Mutual Investment Funds Series II
Aggregated Financial Statements
61

Notes to the Financial Statements
1. Accounting Policies
Basis of accountingThe financial statements have been prepared under the historical cost convention, as modified by the revaluation of investments, incompliance with the Financial Service Authority’s Collective Investment Schemes Sourcebook. They have been prepared in accordancewith applicable accounting standards and in accordance with the Statement of Recommended Practice (SORP) for Financial Statementsof Authorised Funds issued by the IMA in October 2010.
Aggregated statementsThe aggregated financial statements represents the sum of the individual funds within the umbrella company. Further analysis ofdistribution and the net asset position can be found on the financial statements of the individual funds.
RevenueDividends on equities and distributions on unit trust holdings are recognised when the relevant securities are quoted ex-dividend orexdistribution. Interest, underwriting commission and other income are accounted for on an accruals basis and the rules for EffectiveInterest Rate (EIR) accounting as outlined in the SORP. Underwriting commission is recognised when the issue takes place.
Special dividendsSpecial dividends are treated as repayments of capital or income depending on the circumstances surrounding the dividend. Wherespecial dividends are taken to capital they are disclosed as realised gains on investments during the period.
Scrip dividendsThe ordinary element of stocks received in lieu of cash are recognised as income. Any enhancement above the cash dividend is taken tocapital and disclosed as realised gains on investments.
Management expensesManagement expenses are accounted for on an accruals basis.
DistributionsAmounts distributable are calculated after charging all of the ACD’s periodic charge and all other expenses except those of a capitalnature. Interest distributions will be made on an Effective Interest Rate (EIR) basis.
Basis of valuation of investmentsThe valuation point is 12.00 noon on the last business day of the accounting period. Quoted investments are valued at the market bidprice net of any accrued interest which is included in the balance sheet as an income-related item.
Foreign currenciesAssets and liabilities have been translated into sterling at the mid-market exchange rates prevailing at the balance sheet date.Transactions in foreign currencies are translated at the exchange rate prevailing at the transaction date. Where forward positions incurrencies are held, these are translated at the appropriate forward rate. Any resulting exchange differences are disclosed as Other gains/(losses) in the Statement of Total Return.
TaxationCorporation tax is charged at 20% of the income liable to Corporation tax less expenses.
Deferred taxDeferred tax is provided for on a full liability basis for all timing differences. Deferred tax assets are only recognised to the extent that it canbe regarded as more likely than not that there will be sufficient suitable taxable profits from which the future reversal of the underlyingtiming differences can be deducted.
Forward foreign exchange contractsForward foreign exchange contracts are used in order to hedge against currency exchange rate movements on underlying investments inoverseas bonds. The difference between the forward and spot and movement in the spot rate are taken to the capital account.
SharesWhere a fund has more than one share class, each class may incur different expenses. Consequently the level of net revenue available toeach share class may differ.
Allocation of Revenue and Expenses to Multiple Share ClassesWith the exception of the annual management charge, which is directly attributable to individual Share Classes, all revenue and expensesare allocated to Share Classes pro rata to the value of the net assests of the relevant Share Class on the day the revenue or expense isrecognised.
Old Mutual Investment Funds Series II
Aggregated Financial Statements
62

Individual Savings AccountsFrom 6 April 1999, each fund has been managed so as to ensure that it is a qualifying investment for the stocks and shares component ofan Individual Savings Account, within the Individual Savings Account (‘ISA’) Regulations 1999.
Stamp Duty Reserve Tax (SDRT)
What is SDRT?SDRT is a tax charge levied by HM Revenue & Customs on the disposal or switching of shares in an OEIC. The tax is charged whenshares are sold back to the ACD (Authorised Corporate Director), or when there is a non-exempt transfer of an investment. SDRT ischarged at the maximum rate of 0.5% on eligible investments (although this figure may be reduced depending on the investments in andnumber of issues and surrenders applicable to the fund). If applicable, SDRT is paid to HM Revenue & Customs on the 14th of the monthfollowing the monthly charging period.
When is SDRT charged?SDRT will be charged to redemptions of shares where the transaction is 2% or greater of the value of the fund as at the date of thetransaction. The charge will be at a rate appropriate to the fund concerned, by reference to the proportion of exempt and non-exemptassets used in the calculation for the previous month.
ACD’s policy on charging SDRTExcept for SDRT on larger deals and on non-exempt transfers between third parties OMFM intends that any liability to SDRT will be borneby the fund concerned.
For further information on the application of SDRT please refer to the full prospectus which is available on request from the ACD.
Capital Gains TaxCapital gains within the fund are not liable to tax. You may be liable to capital gains tax when you sell some of your shares if the total gainsin the relevant tax year exceed the annual exemption. For the tax year 2011/2012, the first £10,600 is exempt. This is the personalallowance for all your investments. If you have any queries regarding your tax position, you should contact your financial adviser.
Old Mutual Investment Funds Series II
Other Significant Information
63

Contact Details
Old Mutual Fund Managers Limited,2 Lambeth Hill, London, EC4V 4AD.
Authorised and regulated by the Financial Services Authority
Telephone: 0808 100 8808.Calls may be recorded for security purposes and to improve customer service.Fax: 020 7489 5252.www.omam.co.uk