old and stable soil organic matter is not necessarily...
TRANSCRIPT
1
Old and stable soil organic matter is not necessarily recalcitrant: 1
implications for modeling concepts and temperature sensitivity 2
3
Running title: Slow turnover of labile soil organic matter 4
Markus Kleber1*, Peter S. Nico2, Alain Plante3, Timothy Filley4, Marc Kramer5, Christopher 5
Swanston6, Phillip Sollins7 6
7
1Department of Crop and Soil Science, Oregon State University, Corvallis, OR. 8
2Earth Sciences Division, Lawrence Berkeley National Laboratory, Berkeley, CA. 9
3Department of Earth and Environmental Science, University of Pennsylvania, Philadelphia, PA 10
4Purdue University, Department of Earth and Atmospheric Sciences, West Lafayette, IN. 11
5Earth & Planetary Sciences Department, University of Santa Cruz, Santa Cruz, CA. 12
6Northern Research Station, USDA Forest Service, Houghton, MI. 13
7Department of Forestry, Oregon State University, Corvallis, OR. 14
15
* Corresponding author. 16
Phone 541 737 5718 17
Fax 541 737 5725 18
e-mail: [email protected] 19
20
Keywords: Soil organic matter, density fractions, turnover time, radiocarbon, stable isotopes, 21
differential scanning calorimetry (DSC), scanning transmission X-ray microscopy (STXM), 22
near edge x-ray absorption fine structure spectroscopy (NEXAFS) 23
2
Abstract 24
Soil carbon turnover models generally assume that passive soil organic carbon (SOC) 25
represents recalcitrant, highly processed and humified decomposition products with 26
centennial turnover times. But recent publications find that recalcitrance alone is insufficient 27
to explain long-term stabilization and is not the major driving force of passive C-pool 28
formation. We used Near Edge X-ray Absorption Fine Structure (NEXAFS) spectroscopy in 29
combination with differential scanning calorimetry and alkaline CuO oxidation to test the 30
hypothesis that soil organic carbon does not necessarily become chemically recalcitrant with 31
time. We selected density separates with a gradient of radiocarbon ages from 107 to 680 32
years. The density fraction with the fastest turnover (Oxisol, 107 years) showed the highest 33
relative abundance of aromatic groups and the lowest O-alkyl C/aromatic C ratio as 34
determined by NEXAFS. Conversely, the fraction with the slowest turnover (Inceptisol, 680 35
years) had the lowest relative abundance of aromatic groups and highest O-alkyl C/aromatic 36
C ratio. This sample also had the highest proportion of thermally labile materials as measured 37
by DSC, and the highest ratio of substituted fatty acids to lignin phenols as measured by 38
CuO. Both of these measurements support the conclusion that the organic matter of the 39
Inceptisol sample with a turnover time representative of the passive pool of carbon turnover 40
models (680 years), was more chemically labile than the organic matter in the two distinctly 41
younger fractions. As our results demonstrate that age and intrinsic molecular structure are 42
not always causally related, we suggest that soil carbon models would benefit from a clearer 43
conceptual separation between carbon that is old and carbon that is intrinsically recalcitrant. 44
Contradictory evidence regarding the temperature sensitivity of decomposition may result 45
when chemically labile, but old and presumably stable carbon is automatically assumed to be 46
molecularly recalcitrant and thus erroneously expected to show high temperature sensitivity. 47
48
3
Introduction 49
The predicted magnitude of the biospheric response to increasing heat content in the 50
atmosphere varies greatly between different coupled climate and carbon cycle models 51
(Friedlingstein et al., 2006), indicating a lack of accurate mechanistic coupling. Of the 52
important feedbacks not yet considered in simulations of the carbon-cycle-climate system, 53
below-ground processes are thought to be especially important (Heimann & Reichstein, 54
2008). Among below-ground processes, the mechanisms that govern the decomposition of 55
old (but not thermally altered) soil carbon constitute a problem space that has seen significant 56
conceptual debate and the publication of contradictory experimental results over the last few 57
years. 58
Carbon pools with long turnover times are currently assumed to make up most of the 59
organic carbon in soils (Davidson & Janssens, 2006, von Lützow & Kögel-Knabner, 2009), 60
and it is believed that this passive or stable SOC consists of highly processed and highly 61
aromatic humified material with centennial turnover times (Ogle et al., 2010). Thus, old 62
organic matter is traditionally thought to be resistant to decomposition based on its inherent 63
chemical recalcitrance, as expressed by the paradigm that the more carbon ages in a soil, the 64
more resistant against decomposition it becomes (Feng, 2009). 65
However, there is a growing body of publications which question the paradigm that old 66
soil organic matter is always recalcitrant, suggesting, for example, that the stability of SOC is 67
not due to the chemical structure of SOC itself (Fontaine et al., 2007) and that recalcitrance 68
alone cannot explain long-term stabilization and is not the major driving force of passive C-69
pool formation (Kögel-Knabner et al., 2008, Marschner et al., 2008). Similarly, Paul et al. 70
(2006) state that the high correlations between different methodologies based on tracers and 71
analytical methods that give different mean residence times for physical and chemical soil 72
fractions can best be explained by the hypothesis that young SOC does not differ greatly in 73

4
composition from older SOC. They further suggested that SOC may not necessarily change 74
with age once it is formed (Paul et al., 2006) and that operational fractions resistant to acid 75
hydrolysis do not necessarily infer recalcitrance as it is defined by the models mentioned 76
above. Other authors find no evidence that humification processes invoked by carbon 77
turnover models are indeed creating recalcitrant humic substances (Burdon, 2001, Kelleher & 78
Simpson, 2006, Lehmann et al., 2008). There are several reports that organic matter coatings 79
on aluminosilicate surfaces consisted of labile, microbially processed materials (Rasmussen 80
et al., 2005, Buurman et al., 2007, Grandy & Neff, 2008, Bol et al., 2009, Grasset et al., 81
2009) but exhibited a relatively old radiocarbon age (Rasmussen et al., 2005, Sollins et al., 82
2006). 83
Information about the molecular composition of old organic matter (other than charcoal) 84
is difficult to obtain, since old organic matter is typically closely associated with mineral 85
surfaces (Flessa et al., 2008). When organic matter is partially removed from soil materials 86
by chemical or physical methods, the residual mineral-associated organic materials are 87
typically much older compared to the carbon in the bulk soil (Wattel-Koekkoek et al., 2003, 88
Kleber et al., 2005). Organic matter in intimate contact with mineral surfaces is often 89
depleted in recalcitrant aromatic structures like lignin and phenolic components 90
(Guggenberger et al., 1994, Kiem & Koegel-Knabner, 2003), and enriched in carboxyl and 91
alkyl carbon, which are considered highly labile structures (Mahieu et al., 1999, Spielvogel et 92
al., 2008). All this evidence calls into question the existence of an automatic causal link 93
between recalcitrance of soil organic matter and old age. 94
Resolving this controversy is essential to accurate climate feedback predictions because 95
existing soil carbon turnover models assume that the recalcitrance of organic carbon increases 96
with age (Feng, 2009, Ogle et al., 2010, Yurova et al., 2010), and that temperature sensitivity 97
to decomposition increases with recalcitrance (Davidson & Janssens, 2006, Conant et al., 98

5
2008b). The fundamental hypothesis underlying our work is that carbon does not always 99
become more recalcitrant as it ages in soil. The novel element in our experimental approach 100
is the application of near edge X-ray absorption fine structure (NEXAFS) spectroscopy. This 101
technique allows us to examine the molecular features of organic carbon without the 102
analytical constraints (e.g. paramagnetic iron in NMR spectroscopy, thermal artifacts in 103
pyrolysis) that sometimes complicate classical methods of organic matter analyses, especially 104
when organic matter is closely associated with mineral surfaces. 105
106
Materials and Methods 107
We specifically examined organo-mineral associations isolated from three different soil 108
types (Oxisol, Alfisol, Inceptisol) with previously measured carbon turnover times of 107, 109
175, and 680 years, respectively (Sollins et al., 2009). We chose the 2.3 - 2.6 kg L-1 density 110
fraction because particulate organic matter has been removed at this density and the 111
remaining organic matter is closely associated with minerals. Our choice of sample was 112
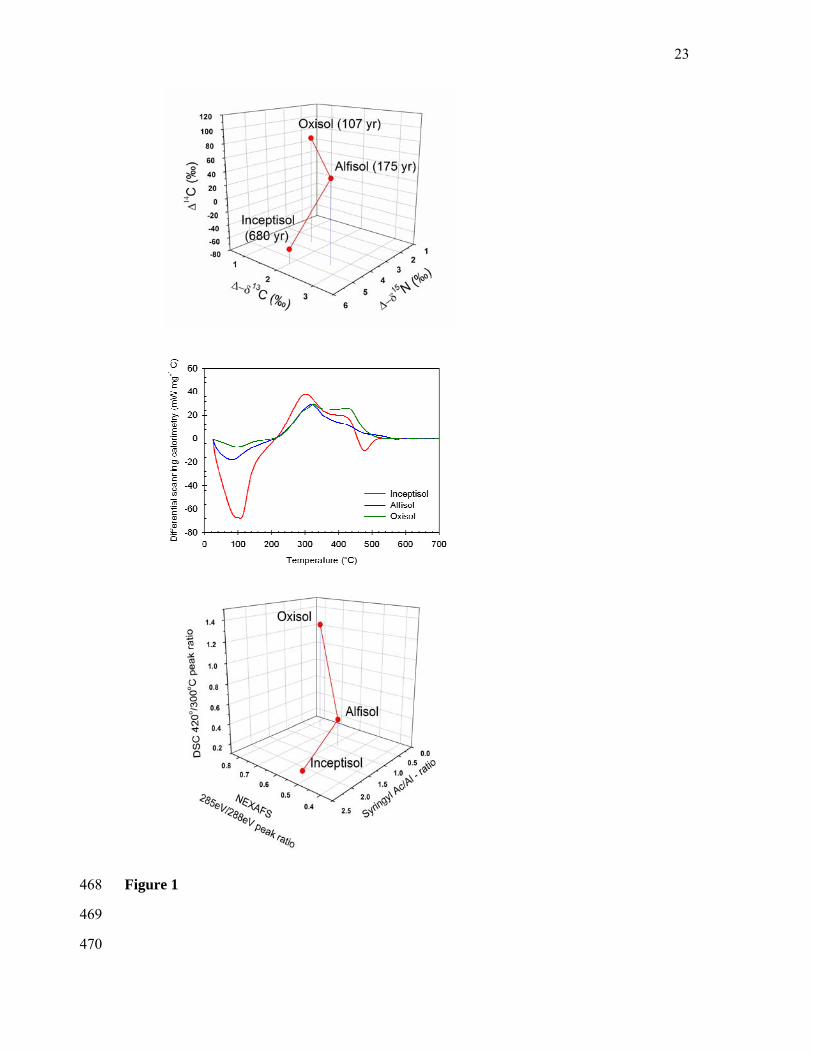
additionally motivated by the observation of greater enrichment in 13C and 15N with 113
increasing turnover time (Figure 1A), implying an increasing fraction of microbial material 114
(Dijkstra et al., 2006). Since microbial materials are comprised of significant proportions of 115
proteins and polysaccharides, which are considered chemically labile, this trend provided a 116
puzzling first indication for a growing proportion of labile materials with increasing turnover 117
time. To provide a proximate measure of the thermal lability of the organic materials we 118
employed differential scanning calorimetry (DSC). Alkaline CuO oxidation was used to 119
determine the relative contributions of lignin phenolics and substituted fatty acids as 120
indicators for the extent of organic matter transformations, and scanning transmission X-ray 121
microscopy coupled with NEXAFS spectroscopy was used to achieve speciation of organic 122
functional groups in individual clay-size organo-mineral microaggregates. 123
6
124
Isolation of organo-mineral associations 125
Samples were obtained by the sequential density fractionation of three soils as reported 126
previously (Sollins et al., 2009). Soils were separated into fractions of increasing density by 127
centrifugation of soil suspended in sodium polytungstate (SPT), aspiration of the floating 128
material and supernatant, and vacuum filtration. The Inceptisol sample was collected at the 129
H.J. Andrews Experimental Forest in the Cascade Mountains, Oregon. The Oxisol samples 130
were from a Rosario series Inceptic Hapludox from Susua State Forest, Puerto Rico. The 131
Alfisol samples were from a Typic Hapludalf from Michigan State University's Kellogg 132
Biological Station. Basic soil and sample characteristics, including stable isotope and 133
radiocarbon data and details on turnover time calculations are provided in (Sollins et al., 134
2009). 135
136
Synchrotron near edge X-ray absorption fine structure (NEXAFS) spectroscopy 137
NEXAFS data were obtained on the Molecular Environmental Sciences Beamline 11.0.2 at 138
the Advanced Light Source (ALS), Lawrence Berkeley National Laboratory. Sample 139
preparation and data collection were performed as reported by Wan et al. (2007). Material 140
from the 2.3 - 2.6 kg L-1 density fraction of each soil type was deposited on individual Si3N4 141
windows obtained from Silson Ltd., England. To locate individual particles or micro-142
aggregates on the window, survey scans were performed at 280 eV, below the C edge. Except 143
as noted below, we disregarded particles with optical density greater than 2.0 at any energy 144
between 278 eV and 330 eV, i.e. the energy range of our carbon K-edge spectra. This limited 145
particle selection to those smaller than one to two microns. In the Alfisol sample three 146
particles had peak OD’s of 2.13, 2.33, and 2.55 respectively. [OD = log(Io/I), where Io is the 147
background photon flux transmitted through the Si3N4 window measured within a clean area 148
7
on the same Si3N4 window, and I is the photon flux transmitted through a region within the 149
sample]. However, the highest absorbing regions of these particles were not used when 150
extracting the C spectra in order to avoid any spectral distortion due to high ODs. Spectra 151
stacks were collected for the selected particles, which involves collected successive images of 152
the particles for a series of ascending closely spaced energies. Spatially resolved spectra can 153
then be extracted from these stacks. We collected stacks in the region of 278 eV to 330 eV 154
broken into five different regions with different energy spacing between the images. Images 155
were collected every 0.5 eV between 278 and 282 eV; every 0.1 eV between 282 and 290.1 156
eV; every 0.5 eV between 290.1 and 310 eV and every 1 eV between 310 to 330 eV. Maps of 157
total C distributions were then obtained using a pixel size of 25 nm, as differences of two 158
absorption images recorded with monochromatic X-ray energies of 280 and 288.4 eV for 159
background and C absorption, respectively. The absorption images were converted to OD 160
images before subtraction. These maps were obtained by subtracting below-edge OD maps 161
from their corresponding above-edge OD map. 162
Carbon NEXAFS stack alignment and analyses, and alignment of background and edge 163
maps of other elements were done using the Zimba alignment module of the software 164
package aXis2000 (Hitchcock, 2006). Functional groups and resonance peak energies used to 165
characterize organic carbon species were taken from the compilation given in Table 1. 166
167
Table 1 168
A semiquantitative analysis of NEXAFS spectra was carried out by peak deconvolution 169
using the software PeakFitTM v4 (SeaSolve Software Inc.). Peak positions were assigned 170
according to Table 1. Following the conventions of Solomon et al. (2005) and Schumacher et 171
al. (2005), the transitions of an electron from the 1s orbital to an aromatic π* orbital at 285 172
eV will be referred to as aromatic C. The 1s → π* transition at 286.5 eV will be designated 173

8
phenolic C, the signals at 289.5 eV will be called O-alkyl C and the resonance around 290 eV 174
as carbonyl-C. The region between 288.2 and 288.8 eV includes transitions associated with 175
amide C=O and those of carboxyl carbon, but we decided to follow the convention of 176
Schumacher et al. (2005) and designate it as carboxyl C. The 1s → 3p/σ* transition near 177
287.5 eV will be designated as aliphatic C. The deconvolution procedure was applied to the 178
extracted spectra through the energy region from 278 to 310 eV. In spectra with large, 179
potentially interfering potassium resonances at 295 and 302 eV, these resonances were 180
manually removed and replaced with a straight line. Although the resonances of interest are 181
all well below these energies, this first order correction was employed as an extra safeguard 182
against fitting distortion from these large resonances. No attempt was made to subtract the 183
contribution of the K edge jump associated with these peaks, but given the fact that this edge 184
should be much smaller than the resonance peaks, the likelihood of it causing noticeable 185
fitting distortion was deemed acceptably low. Spectra were normalized to an edge jump of 186
unity at 310 eV to account for differences in the absolute amount of C on the particles. This 187
energy is beyond the location of specific resonances and is accepted as a reasonable 188
representation of the total elemental C content. This approximation is further experimentally 189
justified by the observation that the spectra are featureless beyond this energy (data not 190
shown). Gaussian peaks with the energies listed above were used to fit the specific bonding 191
resonances. All of the π resonance peaks were fitted using the same FWHM variable that was 192
initially guessed as unity, but was allowed to vary during the fit. However, the final results 193
never deviated more than 10% from this initial guess. 194
The ionization threshold was represented using a ’transition function’ in the PeakFit curve 195
library. This transition function emulates the arctangent function used by other researchers. 196
The magnitude and FWHM of this function was fixed at unity to match the normalized data 197
and the edge position was set at 290 eV in agreement with previous studies. The σ* 198
9
transitions were modeled using two additional gaussian functions with initial energy positions 199
at 294 and 303 eV. No restrictions were placed on these peaks, and the final FWHM values 200
and energy positions were generally in good agreement with the constraints imposed by 201
Schumacher et al. (2005). Peak magnitude for all of the Gaussian transitions was allowed to 202
vary freely, as was energy, although the peak positions naturally constrained themselves to 203
the ranges given above. 204
205
Thermal analyses 206
Density fractions were subjected to thermal analyses as a rapid and integrative assessment 207
of organic matter chemical and thermodynamic stability using a Netzsch STA 409PC Luxx 208
simultaneous thermal analyzer equipped with a type-S TG-DSC sample carrier supporting a 209
PtRh10-Pt thermocouple (Netzsch-Gerätebau GmbH, Selb, Germany). Samples were heated 210
from 25 to 700 °C at a rate of 10 °C min-1 in an oxidizing atmosphere (30 mL min-1 of 211
synthetic air). Results were normalized to sample organic C content, and are reported in units 212
of mW g-1 C. Semi-quantitative analysis involved peak fitting of the resultant DSC 213
thermograms (Plante et al., 2005). Peak fitting was performed using PeakFit. Baselines were 214
corrected using non-parametric routines, and were calculated from the terminal region of the 215
thermogram (generally at temperatures of 600-700 °C). Peaks were fit using the residuals 216
method with Gaussian peak types, allowing for negative peaks (endothermic) with variable 217
peak widths. The initial number and placement of peaks were based on the shape of the 218
thermograms, particularly the presence of signals that suggested separate thermal reactions. 219
Fitting of the thermograms was performed iteratively until no change in the fitting statistics 220
was observed. Deconvolution of the exothermic region of the three soils resulted in three or 221
four individual Gaussian peaks (Table 2). The first peak centered near 100 °C records the 222
endothermic reaction associated with hygroscopic water release. One peak centered at 297-223
10
314 °C (Peak A) and a second peak centered at 416-425 °C (Peak D) were common to all 224
three soils. The small endothermic peak at 573 °C in the Alfisol signals the presence of 225
quartz, while the source of the larger endothermic center at 478 °C in the Inceptisol sample is 226
likely attributable to transformations of poorly crystalline minerals. 227
228
Table 2 229
230
Alterations in plant component composition 231
Assessment of the contribution of plant components from the aromatic biopolymer lignin 232
and the aliphatic biopolymers suberin and cutin was performed by alkaline CuO oxidation 233
(Hedges & Mann, 1979, Goni & Hedges, 1990). Eight lignin phenols and nine hydroxyl and 234
alkoxy-substituted fatty acids (SFA) were quantified as outlined in Filley et al. (2008). 235
Compound yields are presented as mg compound per 100 mg organic C (Λ8 designates the 236
sum of the eight lignin phenols, and SFA is the sum of the nine substituted fatty acids). 237
Estimation of lignin decay state is presented as the ratio of vanillic acid to vanillin 238
(Acid/Aldehyde – Ac/Al ratio). Oxidative decay adds oxygen containing functional groups 239
(COOH), which are acidic. Thus the greater the Ac/Al ratio, the more advanced the state of 240
lignin decomposition (Hedges et al., 1988). 241
242
Results 243
The exothermic regions (positive peaks) of the DSC data (Figure 1B) were used to provide 244
a comparative assessment of the chemical and thermodynamic stability of the organic matter 245
within the 2.3 - 2.6 kg L-1 density fraction of the three soils. The temperature scale position of 246
an exothermal peak correlates with the activation energy for the thermal oxidation reaction 247
(i.e. chemical stability), while peak intensity is a measure of the energy released during the 248
11
reaction (i.e. a combination of energy content and compound abundance). Consequently, 249
thermal reactions in the temperature region of Peak A (≈ 300˚C) have been attributed to the 250
decomposition of compounds such as carbohydrates and peptides, whereas those in the Peak 251
D (≈ 420˚C) range have been attributed to more aromatic components such as lignin (Lopez-252
Capel et al., 2005, Laird et al., 2008). The ratio between the areas of these two peaks (D/A) 253
provides an index for the relative contribution of chemically labile compounds to more stable 254
ones. Thermograms reported for classical humic acids and fulvic acids typically have high 255
D/A ratios (Chen et al., 1978). Previously, decreases in this ratio have been taken to 256
correspond with increases in biogeochemical lability (Leifeld, 2008). However, in our study 257
the decrease in this ratio (Table 2) was directly correlated with increases in Δ14C age of the 258
samples (Figure1A). It is also directly correlated with the increases in the microbial character 259
of the organic matter as determined by stable isotope analysis (Figure 1A). Since microbial 260
compounds, proteins and polysaccharides, are also considered chemically labile compounds, 261
all the evidence suggests that in these density fractions, the oldest organic matter is in fact the 262
most chemically labile. 263
264
Figure 1 265
266
This result is further supported by the chemical differences observed in the CuO-extracted 267
lignin phenols and suberin and cutin-derived substituted fatty acids (SFA) (Table 3). 268
269
Table 3 270
271
The syringyl and vanillyl acid/aldehyde ratios (Ac/Al(s) and Ac/Al(v)) of fresh plant organic 272
matter are typically below 0.4 and this value increases with increasing microbial decay 273
12
(Hedges et al., 1988). The Oxisol sample was characterized by the lowest Ac/Al(s) Ac/Al(v) 274
ratios, the greatest concentrations of lignin phenols, and the greatest concentration of 275
substituted fatty acids (SFA), indicating it contained the most plant-like organic matter (Table 276
3). Furthermore, the Ac/Al(s) and Ac/Al(v) ratios were directly correlated with turnover time, 277
i.e. highest Ac/Al ratio from the sample with the longest turnover time. The relative 278
proportion of extracted plant derived SFA to lignin phenols was greatest for the organic 279
matter in the Inceptisol fraction, 680 years and similar for the Oxisol and Alfisol samples, 280
107 and 175 years respectively. Increasing Ac/Al(s) and Ac/Al(v) ratios and decreasing lignin 281
recovery have been previously observed with increasing particle density, decreasing particle 282
size, or within aggregate gradients (Guggenberger et al., 1994, Sollins et al., 2006). 283
Therefore, similar to the stable isotope and DSC results, the lignin and SFA analyses show a 284
trend of organic materials becoming more microbial like and less chemically recalcitrant with 285
increasing age. 286
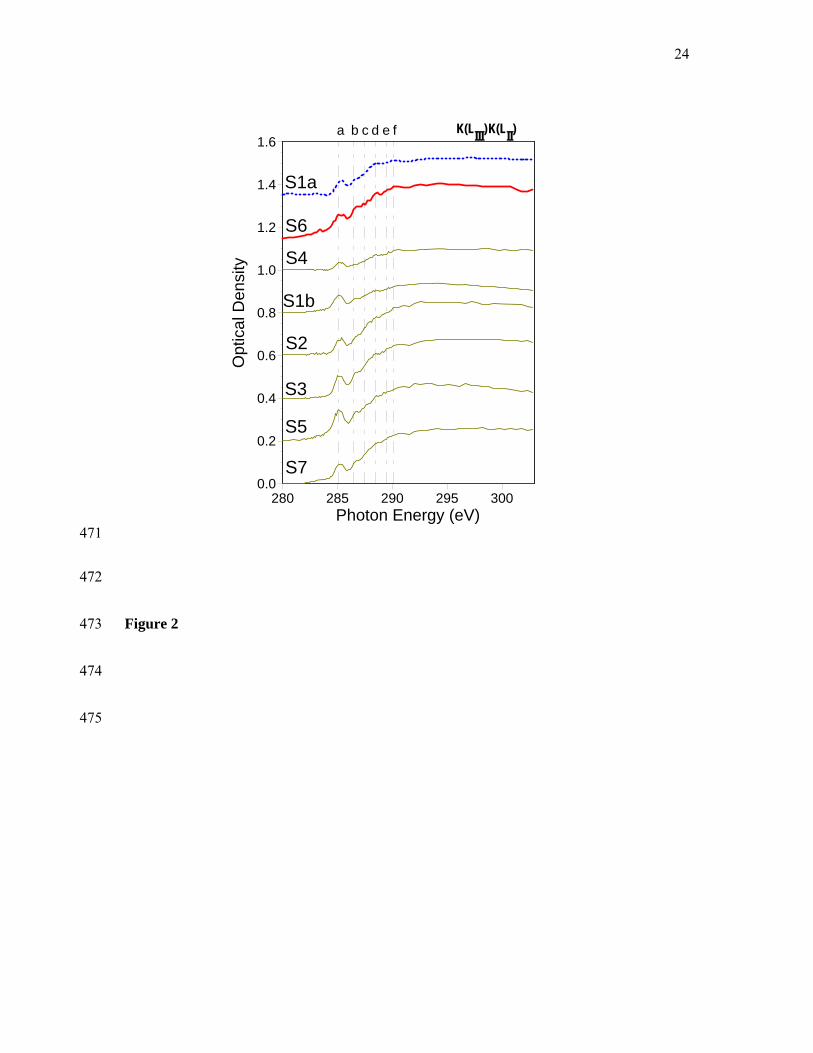
For further investigation of this trend we obtained NEXAFS C 1s spectra for a total of 23 287
individual carbon-mineral microaggregates from the Oxisol (n=8), Alfisol (n=9) and 288
Inceptisol (n=6) samples (Figures 2-4). 289
290
Figures 2-4 291
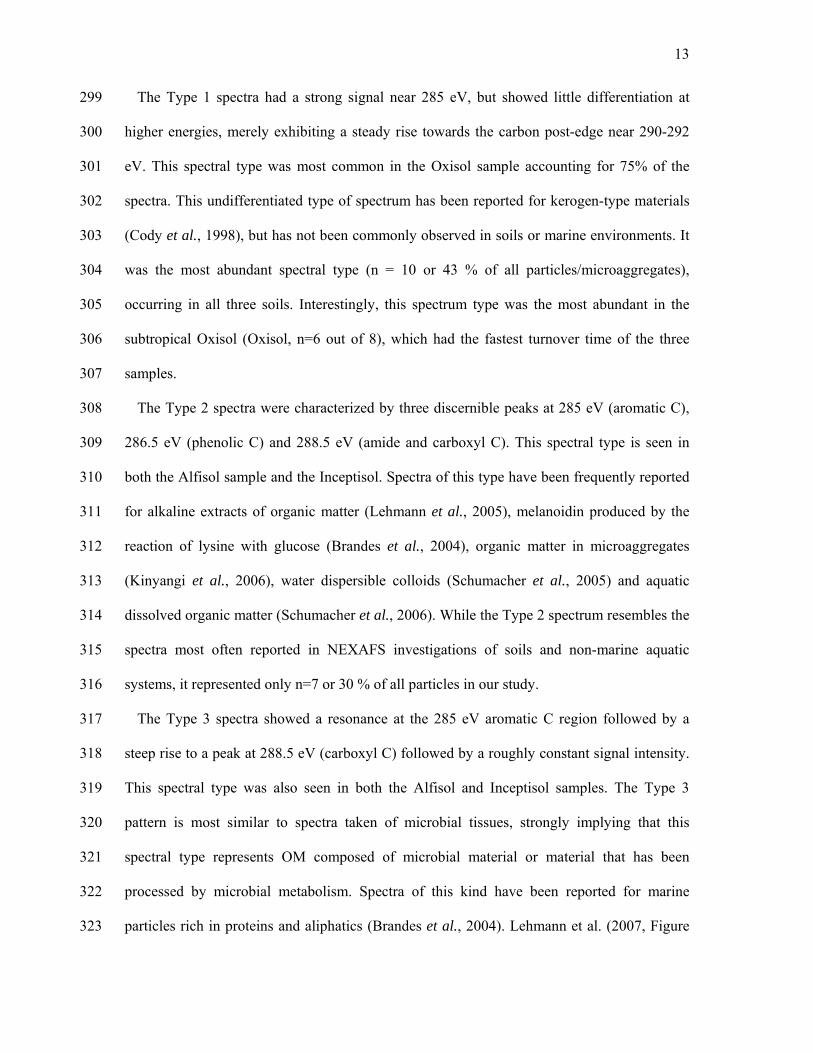
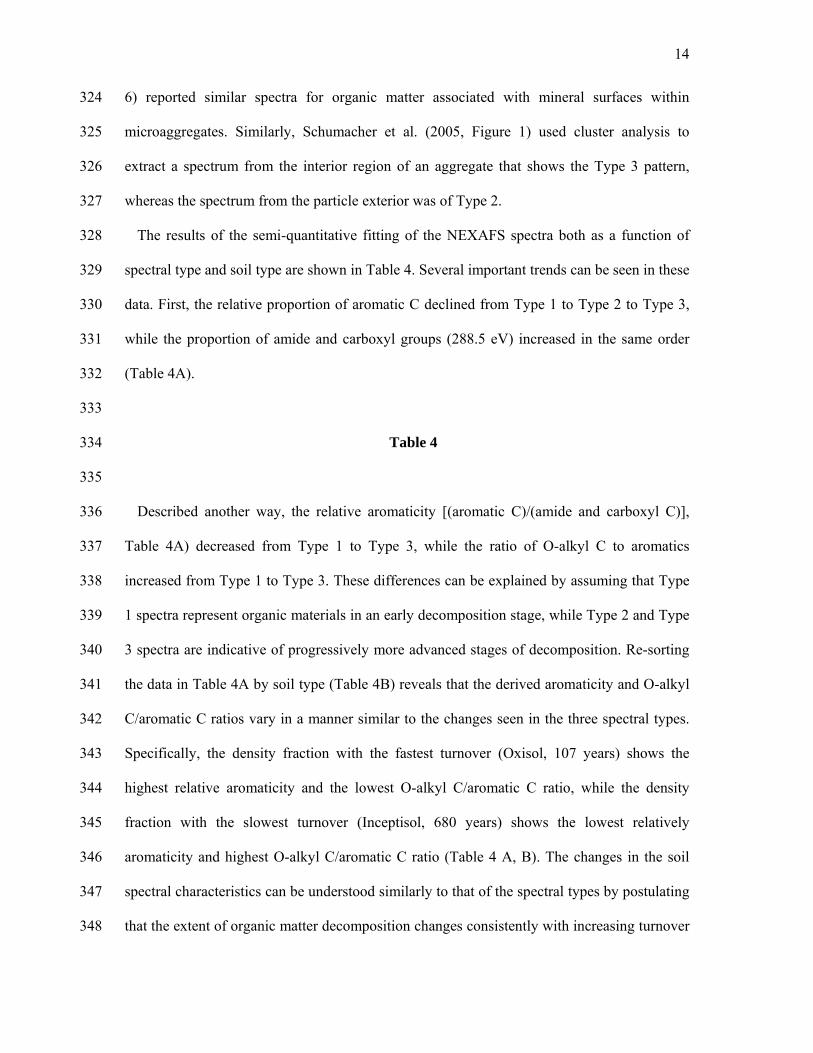
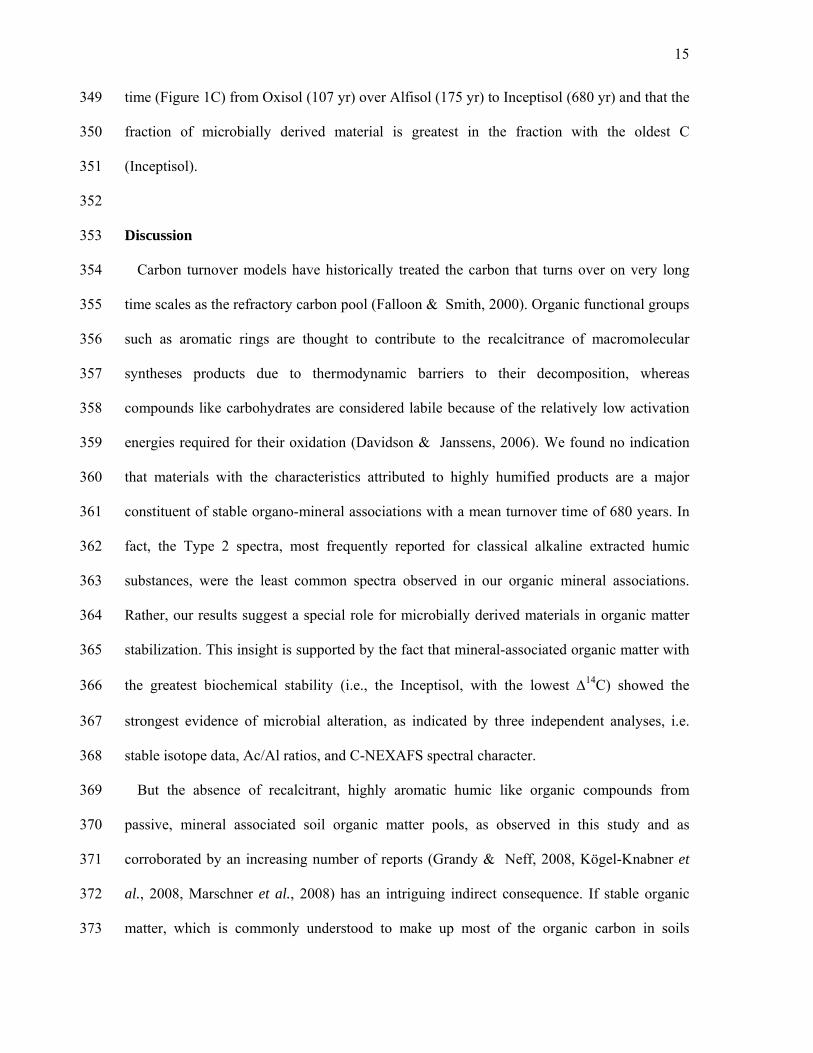
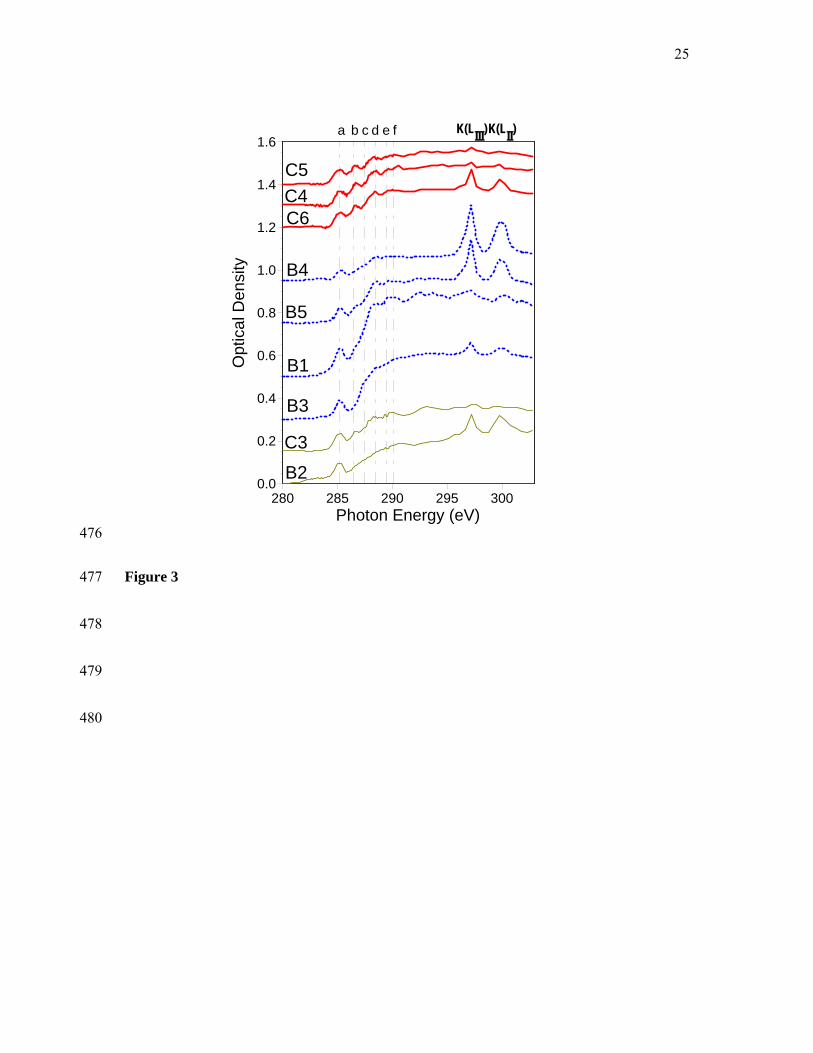
The spectra from the Fe-rich Oxisol sample are quite similar (Figure 2), whereas we 292
observed considerable variation among the Alfisol and Inceptisol spectra (Figures 3 and 4). 293
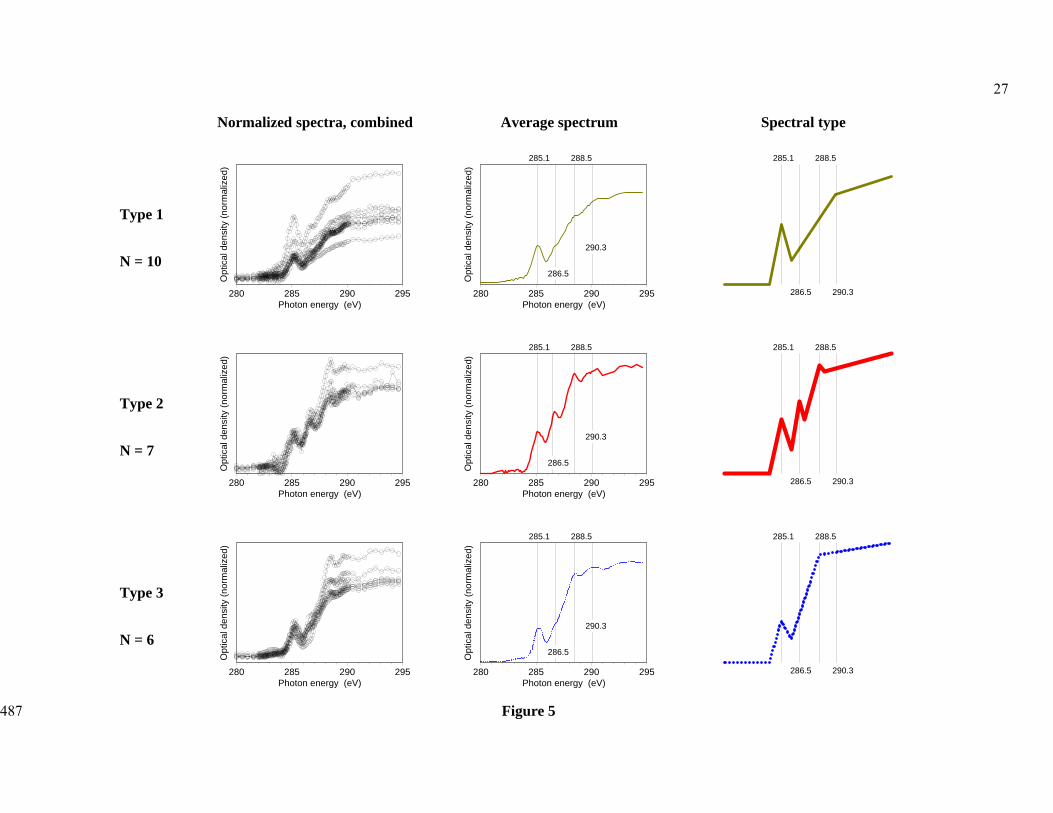
Close comparison of recurring spectral features showed that the spectra from all three 294
samples could be grouped into three spectral types (Figure 5). 295
296
Figure 5 297
298
13
The Type 1 spectra had a strong signal near 285 eV, but showed little differentiation at 299
higher energies, merely exhibiting a steady rise towards the carbon post-edge near 290-292 300
eV. This spectral type was most common in the Oxisol sample accounting for 75% of the 301
spectra. This undifferentiated type of spectrum has been reported for kerogen-type materials 302
(Cody et al., 1998), but has not been commonly observed in soils or marine environments. It 303
was the most abundant spectral type (n = 10 or 43 % of all particles/microaggregates), 304
occurring in all three soils. Interestingly, this spectrum type was the most abundant in the 305
subtropical Oxisol (Oxisol, n=6 out of 8), which had the fastest turnover time of the three 306
samples. 307
The Type 2 spectra were characterized by three discernible peaks at 285 eV (aromatic C), 308
286.5 eV (phenolic C) and 288.5 eV (amide and carboxyl C). This spectral type is seen in 309
both the Alfisol sample and the Inceptisol. Spectra of this type have been frequently reported 310
for alkaline extracts of organic matter (Lehmann et al., 2005), melanoidin produced by the 311
reaction of lysine with glucose (Brandes et al., 2004), organic matter in microaggregates 312
(Kinyangi et al., 2006), water dispersible colloids (Schumacher et al., 2005) and aquatic 313
dissolved organic matter (Schumacher et al., 2006). While the Type 2 spectrum resembles the 314
spectra most often reported in NEXAFS investigations of soils and non-marine aquatic 315
systems, it represented only n=7 or 30 % of all particles in our study. 316
The Type 3 spectra showed a resonance at the 285 eV aromatic C region followed by a 317
steep rise to a peak at 288.5 eV (carboxyl C) followed by a roughly constant signal intensity. 318
This spectral type was also seen in both the Alfisol and Inceptisol samples. The Type 3 319
pattern is most similar to spectra taken of microbial tissues, strongly implying that this 320
spectral type represents OM composed of microbial material or material that has been 321
processed by microbial metabolism. Spectra of this kind have been reported for marine 322
particles rich in proteins and aliphatics (Brandes et al., 2004). Lehmann et al. (2007, Figure 323
14
6) reported similar spectra for organic matter associated with mineral surfaces within 324
microaggregates. Similarly, Schumacher et al. (2005, Figure 1) used cluster analysis to 325
extract a spectrum from the interior region of an aggregate that shows the Type 3 pattern, 326
whereas the spectrum from the particle exterior was of Type 2. 327
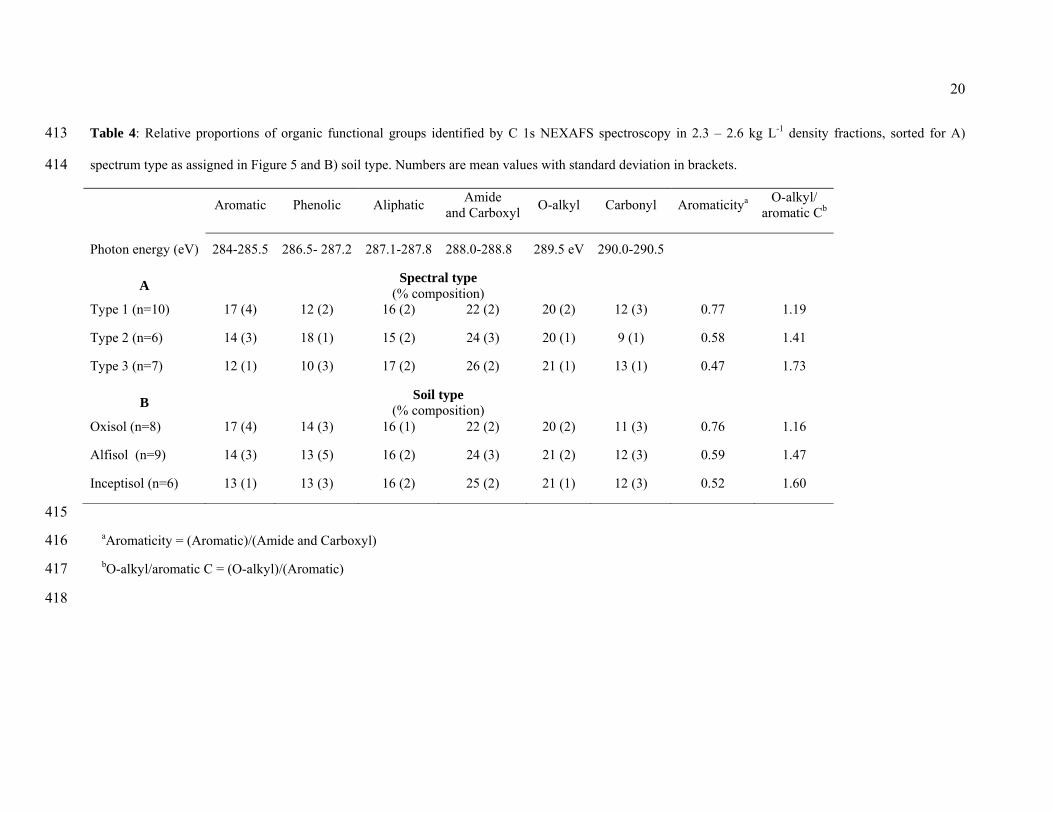
The results of the semi-quantitative fitting of the NEXAFS spectra both as a function of 328
spectral type and soil type are shown in Table 4. Several important trends can be seen in these 329
data. First, the relative proportion of aromatic C declined from Type 1 to Type 2 to Type 3, 330
while the proportion of amide and carboxyl groups (288.5 eV) increased in the same order 331
(Table 4A). 332
333
Table 4 334
335
Described another way, the relative aromaticity [(aromatic C)/(amide and carboxyl C)], 336
Table 4A) decreased from Type 1 to Type 3, while the ratio of O-alkyl C to aromatics 337
increased from Type 1 to Type 3. These differences can be explained by assuming that Type 338
1 spectra represent organic materials in an early decomposition stage, while Type 2 and Type 339
3 spectra are indicative of progressively more advanced stages of decomposition. Re-sorting 340
the data in Table 4A by soil type (Table 4B) reveals that the derived aromaticity and O-alkyl 341
C/aromatic C ratios vary in a manner similar to the changes seen in the three spectral types. 342
Specifically, the density fraction with the fastest turnover (Oxisol, 107 years) shows the 343
highest relative aromaticity and the lowest O-alkyl C/aromatic C ratio, while the density 344
fraction with the slowest turnover (Inceptisol, 680 years) shows the lowest relatively 345
aromaticity and highest O-alkyl C/aromatic C ratio (Table 4 A, B). The changes in the soil 346
spectral characteristics can be understood similarly to that of the spectral types by postulating 347
that the extent of organic matter decomposition changes consistently with increasing turnover 348
15
time (Figure 1C) from Oxisol (107 yr) over Alfisol (175 yr) to Inceptisol (680 yr) and that the 349
fraction of microbially derived material is greatest in the fraction with the oldest C 350
(Inceptisol). 351
352
Discussion 353
Carbon turnover models have historically treated the carbon that turns over on very long 354
time scales as the refractory carbon pool (Falloon & Smith, 2000). Organic functional groups 355
such as aromatic rings are thought to contribute to the recalcitrance of macromolecular 356
syntheses products due to thermodynamic barriers to their decomposition, whereas 357
compounds like carbohydrates are considered labile because of the relatively low activation 358
energies required for their oxidation (Davidson & Janssens, 2006). We found no indication 359
that materials with the characteristics attributed to highly humified products are a major 360
constituent of stable organo-mineral associations with a mean turnover time of 680 years. In 361
fact, the Type 2 spectra, most frequently reported for classical alkaline extracted humic 362
substances, were the least common spectra observed in our organic mineral associations. 363
Rather, our results suggest a special role for microbially derived materials in organic matter 364
stabilization. This insight is supported by the fact that mineral-associated organic matter with 365
the greatest biochemical stability (i.e., the Inceptisol, with the lowest Δ14C) showed the 366
strongest evidence of microbial alteration, as indicated by three independent analyses, i.e. 367
stable isotope data, Ac/Al ratios, and C-NEXAFS spectral character. 368
But the absence of recalcitrant, highly aromatic humic like organic compounds from 369
passive, mineral associated soil organic matter pools, as observed in this study and as 370
corroborated by an increasing number of reports (Grandy & Neff, 2008, Kögel-Knabner et 371
al., 2008, Marschner et al., 2008) has an intriguing indirect consequence. If stable organic 372
matter, which is commonly understood to make up most of the organic carbon in soils 373
16
(Trumbore, 2000, Davidson & Janssens, 2006), is not always chemically recalcitrant, than it 374
may on occasion fail to exhibit the sensitivity to temperature which is thought to be the 375
consequence of its presumed recalcitrant nature (von Lützow & Kögel-Knabner, 2009). 376
We posit that the prevailing notion of a link between the stability of soil organic matter and 377
its temperature sensitivity (Conant et al., 2008a, Conant et al., 2008b) may result from the 378
reliance on an outdated molecular model for stable organic matter. Briefly, the carbon 379
quality-temperature (CQT) theory of the temperature sensitivity of organic matter 380
decomposition links the temperature sensitivity of “recalcitrant” organic carbon to an 381
increase in molecular complexity (Bosatta & Agren, 1999, Davidson & Janssens, 2006). The 382
classical Humic Polymer Model of soil organic matter (Brady & Weil, 2008) depicts stable 383
organic material as large, covalently bonded humic polymers with unique chemical structures 384
that are different from those of the starting materials (Schulten & Schnitzer, 1997, Swift, 385
1999). Fragments are joined into polymeric macromolecules by strong covalent bonds, thus 386
creating the complexity that is required by the CQT theory. But if old soil organic matter 387
fragments are not large, complex, polymeric humic macromolecules (Piccolo, 2001, Sutton & 388
Sposito, 2005), then they loose the special temperature sensitivity as expected by the CQT 389
theory. Therefore, we suggest that some of the contradictory evidence (Wixon & Balser, 390
2009) in the ongoing discussion about the temperature sensitivity of the decomposition of soil 391
organic carbon may result from the automatic assumption that stable, old organic matter is 392
always composed of materials that are chemically recalcitrant. Mechanistic progress would 393
likely result if future modeling concepts were to recognize that ‘recalcitrant carbon’ and ‘old’ 394
or ‘stable’ carbon are not synonymous, and that stable old carbon can very well be chemically 395
labile, if protected. 396
397
17
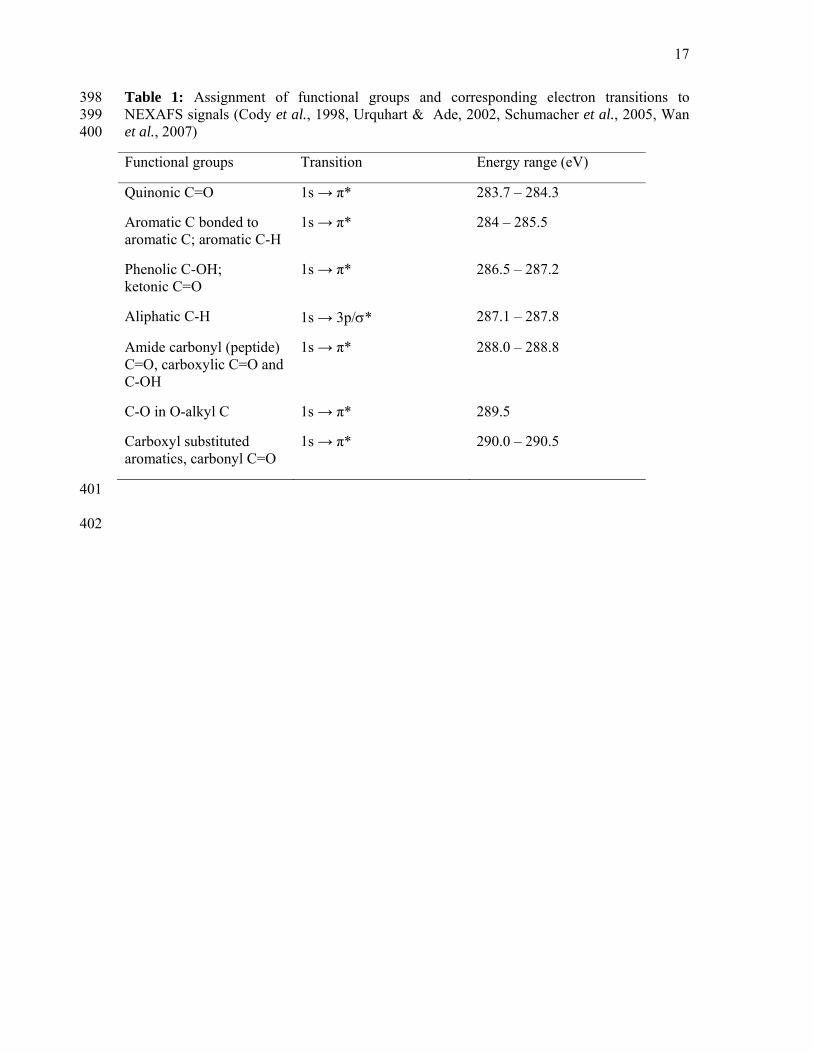
Table 1: Assignment of functional groups and corresponding electron transitions to 398 NEXAFS signals (Cody et al., 1998, Urquhart & Ade, 2002, Schumacher et al., 2005, Wan 399 et al., 2007) 400
Functional groups Transition Energy range (eV)
Quinonic C=O 1s → π* 283.7 – 284.3
Aromatic C bonded to aromatic C; aromatic C-H
1s → π* 284 – 285.5
Phenolic C-OH; ketonic C=O
1s → π* 286.5 – 287.2
Aliphatic C-H 1s → 3p/σ* 287.1 – 287.8
Amide carbonyl (peptide) C=O, carboxylic C=O and C-OH
1s → π* 288.0 – 288.8
C-O in O-alkyl C 1s → π* 289.5
Carboxyl substituted aromatics, carbonyl C=O
1s → π* 290.0 – 290.5
401
402
18
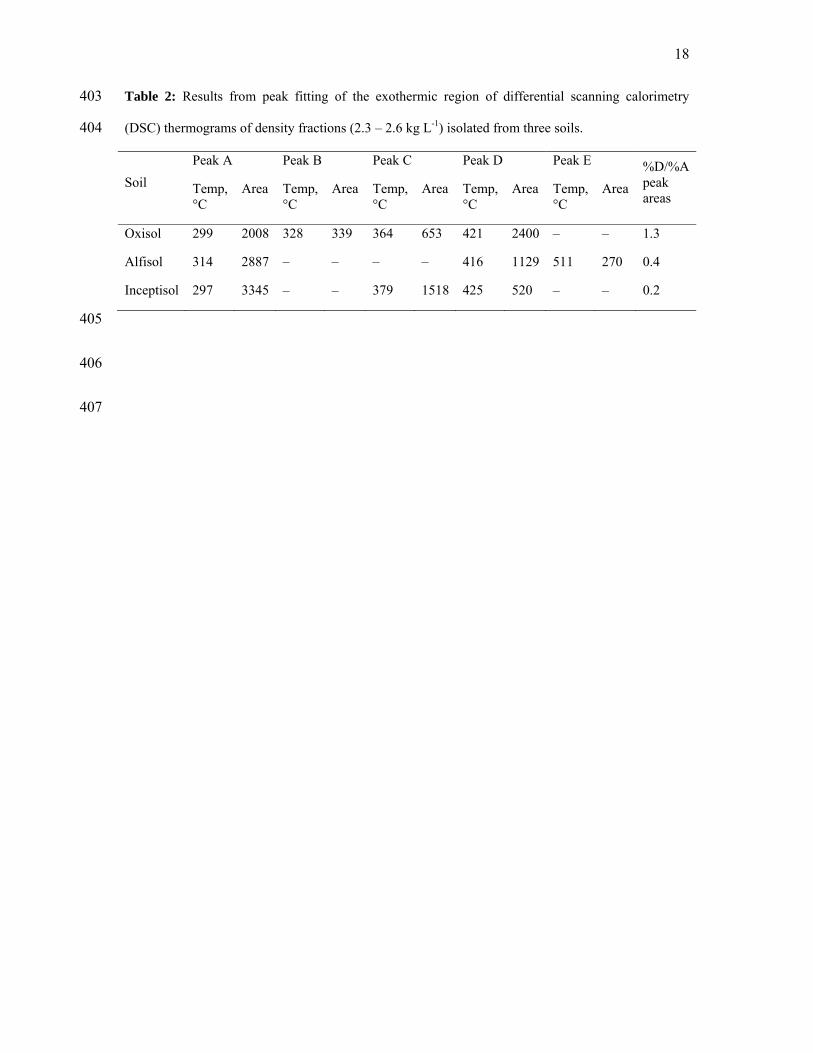
Table 2: Results from peak fitting of the exothermic region of differential scanning calorimetry 403
(DSC) thermograms of density fractions (2.3 – 2.6 kg L-1) isolated from three soils. 404
Soil Peak A Peak B Peak C Peak D Peak E %D/%A
peak areas
Temp, °C
Area Temp, °C
Area Temp, °C
Area Temp, °C
Area Temp, °C
Area
Oxisol 299 2008 328 339 364 653 421 2400 – – 1.3
Alfisol 314 2887 – – – – 416 1129 511 270 0.4
Inceptisol 297 3345 – – 379 1518 425 520 – – 0.2
405
406
407
19
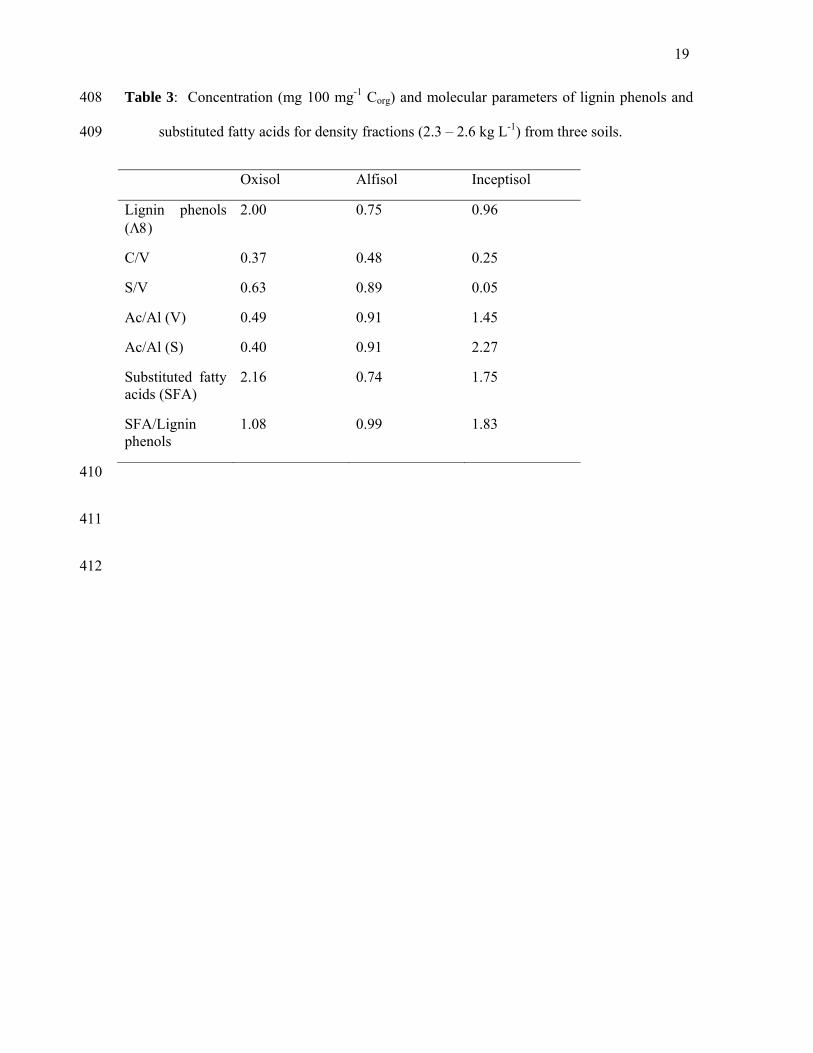
Table 3: Concentration (mg 100 mg-1 Corg) and molecular parameters of lignin phenols and 408
substituted fatty acids for density fractions (2.3 – 2.6 kg L-1) from three soils. 409
Oxisol Alfisol Inceptisol
Lignin phenols (Λ8)
2.00 0.75 0.96
C/V 0.37 0.48 0.25
S/V 0.63 0.89 0.05
Ac/Al (V) 0.49 0.91 1.45
Ac/Al (S) 0.40 0.91 2.27
Substituted fatty acids (SFA)
2.16 0.74 1.75
SFA/Lignin phenols
1.08 0.99 1.83
410
411
412
20
Table 4: Relative proportions of organic functional groups identified by C 1s NEXAFS spectroscopy in 2.3 – 2.6 kg L-1 density fractions, sorted for A) 413
spectrum type as assigned in Figure 5 and B) soil type. Numbers are mean values with standard deviation in brackets. 414
Aromatic Phenolic Aliphatic Amide
and Carboxyl O-alkyl Carbonyl Aromaticitya O-alkyl/ aromatic Cb
Photon energy (eV) 284-285.5 286.5- 287.2 287.1-287.8 288.0-288.8 289.5 eV 290.0-290.5
A Spectral type (% composition)
Type 1 (n=10) 17 (4) 12 (2) 16 (2) 22 (2) 20 (2) 12 (3) 0.77 1.19
Type 2 (n=6) 14 (3) 18 (1) 15 (2) 24 (3) 20 (1) 9 (1) 0.58 1.41
Type 3 (n=7) 12 (1) 10 (3) 17 (2) 26 (2) 21 (1) 13 (1) 0.47 1.73
B Soil type (% composition)
Oxisol (n=8) 17 (4) 14 (3) 16 (1) 22 (2) 20 (2) 11 (3) 0.76 1.16
Alfisol (n=9) 14 (3) 13 (5) 16 (2) 24 (3) 21 (2) 12 (3) 0.59 1.47
Inceptisol (n=6) 13 (1) 13 (3) 16 (2) 25 (2) 21 (1) 12 (3) 0.52 1.60
415 aAromaticity = (Aromatic)/(Amide and Carboxyl) 416 bO-alkyl/aromatic C = (O-alkyl)/(Aromatic) 417
418

21
Figure captions 419
420
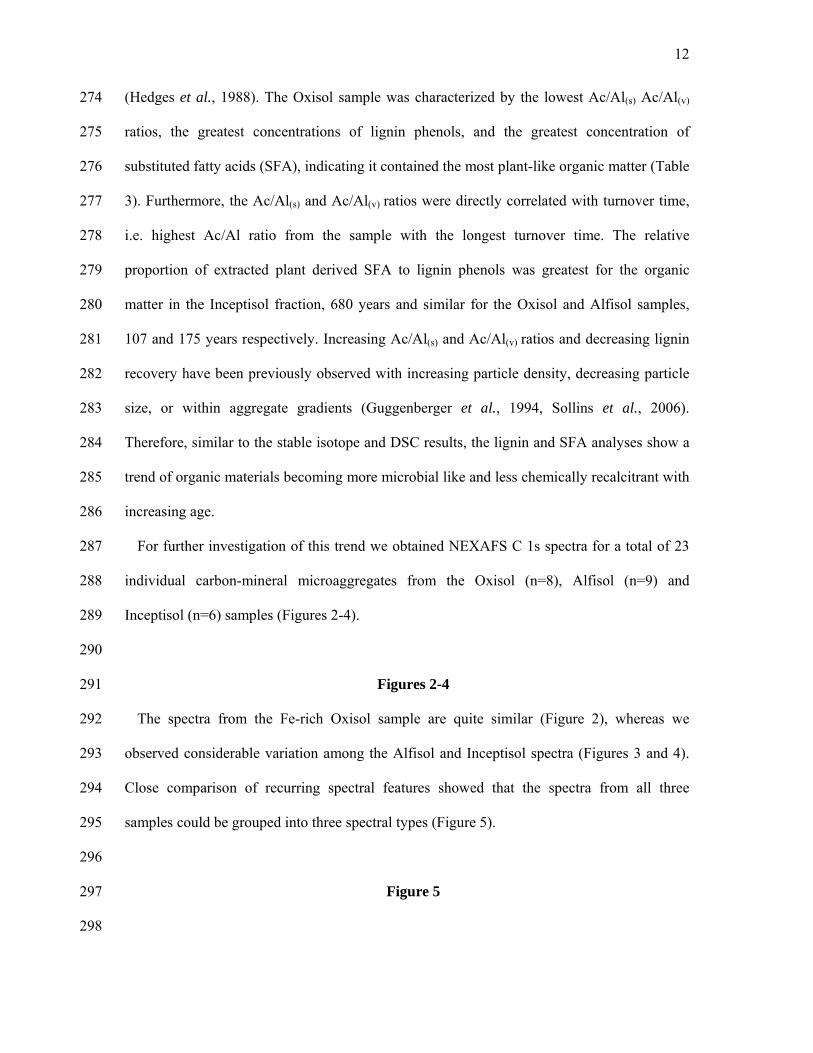
Figure 1A) With decreasing 14C abundance (given as Δ14C) and increasing turnover time 421
(14C-based), organic matter becomes more enriched in 13C and 15N. The Δ-δ notation 422
indicates the absolute value of isotopic enrichment in 13C and 15N in ‰ that was observed 423
between light fraction (< 1.6 kg L-1) and the dense fraction investigated (2.3-2.6 kg L-1) and 424
was calculated as the difference between the δ13C of the dense fraction and the δ13C of the 425
light fraction. Original data as published in Sollins et al. (2009) Brackets are single pool 426
turnover times in years. 427
428
Figure 1B) Differential scanning calorimetry thermograms of the Inceptisol, Alfisol and 429
Oxisol dense fractions showing endothermic (negative) peaks near 100°C due to water 430
release and two exothermic peaks (near 300 and 400°C) due to thermal oxidation of organic 431
matter. 432
433
Figure 1C) As turnover time increases, oxidation state of lignin (Syringyl Ac/Al ratio) 434
increases in the order Oxisol < Alfisol < Inceptisol in agreement with a decrease in thermal 435
stability (DSC 420˚/300˚C peak ratio) and a decrease in aromaticity (285/288 eV peak ratios) 436
as determined by NEXAFS. 437
438
Figure 2: Carbon NEXAFS spectra for 8 nanoaggregates from the 2.3-2.6 g cm-3 density 439
fraction of an Oxisol A horizon. Vertical dashed lines indicate resonances of (a) aromatic, (b) 440
phenolic, (c) aliphatic, (d) amide and carboxyl C, (e) O-alkyl and (f) carbonyl functional 441
groups. The peaks at 297 and 300 eV result indicate the L3 and L2 edges of potassium. 442
Spectra are sorted into three groups: Type 1 is represented by thin continuous line, type 2 by 443
22
thick continuous line and type 3 by dotted line. Spectral identity is documented by internal 444
labels. 445
446
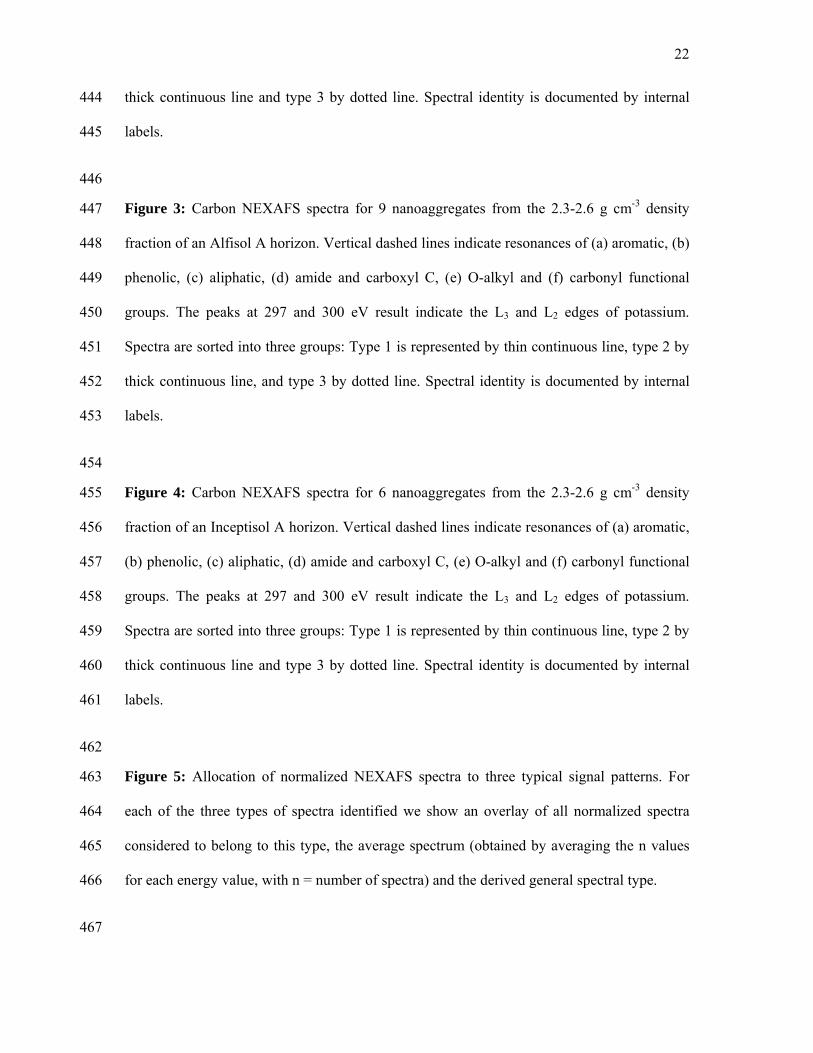
Figure 3: Carbon NEXAFS spectra for 9 nanoaggregates from the 2.3-2.6 g cm-3 density 447
fraction of an Alfisol A horizon. Vertical dashed lines indicate resonances of (a) aromatic, (b) 448
phenolic, (c) aliphatic, (d) amide and carboxyl C, (e) O-alkyl and (f) carbonyl functional 449
groups. The peaks at 297 and 300 eV result indicate the L3 and L2 edges of potassium. 450
Spectra are sorted into three groups: Type 1 is represented by thin continuous line, type 2 by 451
thick continuous line, and type 3 by dotted line. Spectral identity is documented by internal 452
labels. 453
454
Figure 4: Carbon NEXAFS spectra for 6 nanoaggregates from the 2.3-2.6 g cm-3 density 455
fraction of an Inceptisol A horizon. Vertical dashed lines indicate resonances of (a) aromatic, 456
(b) phenolic, (c) aliphatic, (d) amide and carboxyl C, (e) O-alkyl and (f) carbonyl functional 457
groups. The peaks at 297 and 300 eV result indicate the L3 and L2 edges of potassium. 458
Spectra are sorted into three groups: Type 1 is represented by thin continuous line, type 2 by 459
thick continuous line and type 3 by dotted line. Spectral identity is documented by internal 460
labels. 461
462
Figure 5: Allocation of normalized NEXAFS spectra to three typical signal patterns. For 463
each of the three types of spectra identified we show an overlay of all normalized spectra 464
considered to belong to this type, the average spectrum (obtained by averaging the n values 465
for each energy value, with n = number of spectra) and the derived general spectral type. 466
467
23
A
B
C
Figure 1 468
469
470
24
0.0
0.2
0.4
0.6
0.8
1.0
1.2
1.4
1.6
Opt
ical
Den
sity
280 285 290 295 300Photon Energy (eV)
S6
S7
S5
S3
S2
S1a
S4
S1b
a b c d e f K(LIII)K(LII)
471
472
Figure 2 473
474
475
25
0.0
0.2
0.4
0.6
0.8
1.0
1.2
1.4
1.6
Opt
ical
Den
sity
280 285 290 295 300Photon Energy (eV)
B4
B5
B2
B3
B1
C3
C4C6
C5
a b c d e f K(LIII)K(LII)
476
Figure 3 477
478
479
480

26
0.0
0.2
0.4
0.6
0.8
1.0
1.2
Opt
ical
Den
sity
280 285 290 295 300Photon Energy (eV)
H2
H5
H6
H4
HB1
HB2
a b c d e f K(LIII)K(LII)
481
Figure 4 482
483
484
485
486
27
Normalized spectra, combined Average spectrum Spectral type
Type 1
N = 10
Op t
ical
den
sit y
(nor
mal
ized
)
280 285 290 295Photon energy (eV)
Opt
ical
den
sity
(nor
mal
ized
)
280 285 290 295Photon energy (eV)
285.1 288.5
290.3
286.5
285.1 288.5
286.5 290.3
Type 2
N = 7
Op t
ical
den
sit y
(nor
mal
ized
)
280 285 290 295Photon energy (eV)
Opt
ical
den
sity
(nor
mal
ized
)280 285 290 295
Photon energy (eV)
285.1 288.5
290.3
286.5
285.1 288.5
286.5 290.3
Type 3
N = 6
Op t
ical
den
sit y
(nor
mal
ized
)
280 285 290 295Photon energy (eV)
Opt
ical
den
sity
(nor
mal
ized
)
280 285 290 295Photon energy (eV)
285.1 288.5
286.5
290.3
285.1 288.5
286.5 290.3
Figure 5 487


29
Acknowledgments. This research was supported by U.S. Department of Energy, Office of 488
Biological and Environmental Research, Environmental Remediation Sciences Program. 489
Access to beamline 11.0.2 at the Advanced Light Source, Lawrence Berkeley National 490
Laboratory, was provided by the Office of Science, Office of Basic Energy Science, Division 491
of Materials Sciences, and Division of Chemical Sciences, Geosciences, and Biosciences of 492
the U.S. Department of Energy under contract DE-AC02-05CH11231. Funding for the parent 493
study came from USDA CSREES 2005-35107-16336 and NSF DEB-0515846 to P. Sollins 494
and from USDA NRICGP 2002-35107-12249 to K. Lajtha. 495
496
References 497
Bol R, Poirier N, Balesdent J, Gleixner G (2009) Molecular turnover time of soil organic 498
matter in particle-size fractions of an arable soil. Rapid Communications in Mass 499
Spectrometry, 23, 2551-2558. 500
Bosatta E, Agren GI (1999) Soil organic matter quality interpreted thermodynamically. Soil 501
Biology & Biochemistry, 31, 1889-1891. 502
Brady NC, Weil RR (2008) The nature and properties of soils, Upper Saddle River, New 503
Jersey, Prentice Hall. 504
Brandes JA, Lee C, Wakeham S, Peterson M, Jacobsen C, Wirick S, Cody G (2004) 505
Examining marine particulate organic matter at sub-micron scales using scanning 506
transmission X-ray microscopy and carbon X-ray absorption near edge structure 507
spectroscopy. Marine Chemistry, 92, 107-121. 508
Burdon J (2001) Are the traditional concepts of the structures of humic substances realistic? 509
Soil Science, 166, 752-769. 510
Buurman P, Peterse F, Martin GA (2007) Soil organic matter chemistry in allophanic soils: a 511
pyrolysis-GC/MS study of a Costa Rican Andosol catena. European Journal of Soil 512
Science, 58, 1330-1347. 513
Chen Y, Senesi N, Schnitzer M (1978) Chemical and physical characteristics of humic and 514
fulvic acids extracted from soils of mediterranean region Geoderma, 20, 87-104. 515

30
Cody GD, Ade H, Wirick S, Mitchell GD, Davis A (1998) Determination of chemical-516
structural changes in vitrinite accompanying luminescence alteration using C-517
NEXAFS analysis. Organic Geochemistry, 28, 441-455. 518
Conant RT, Drijber RA, Haddix ML et al. (2008a) Sensitivity of organic matter 519
decomposition to warming varies with its quality. Global Change Biology, 14, 868-520
877. 521
Conant RT, Steinweg JM, Haddix ML, Paul EA, Plante AF, Six J (2008b) Experimental 522
warming shows that decomposition temperature sensitivity increases with soil organic 523
matter recalcitrance. Ecology, 89, 2384-2391. 524
Davidson EA, Janssens IA (2006) Temperature sensitivity of soil carbon decomposition and 525
feedbacks to climate change. Nature, 440, 165-173. 526
Falloon PD, Smith P (2000) Modelling refractory soil organic matter. Biology and Fertility of 527
Soils, 30, 388-398. 528
Feng YS (2009) Fundamental Considerations of Soil Organic Carbon Dynamics: A New 529
Theoretical Framework. Soil Science, 174, 467-481. 530
Filley TR, McCormick MK, Crow SE, Szlavecz K, Whigham DF, Johnston CT, van den 531
Heuvel RN (2008) Comparison of the chemical alteration trajectory of Liriodendron 532
tulipifera L. leaf litter among forests with different earthworm abundance. Journal of 533
Geophysical Research-Biogeosciences, 113. 534
Flessa H, Amelung W, Helfrich M et al. (2008) Storage and stability of organic matter and 535
fossil carbon in a Luvisol and Phaeozem with continuous maize cropping: A 536
synthesis. Journal of Plant Nutrition and Soil Science-Zeitschrift Fur 537
Pflanzenernahrung Und Bodenkunde, 171, 36-51. 538
Friedlingstein P, Cox P, Betts R et al. (2006) Climate-carbon cycle feedback analysis: Results 539
from the (CMIP)-M-4 model intercomparison. Journal of Climate, 19, 3337-3353. 540
Goni MA, Hedges JI (1990) Cutin derived CUO reaction products from purified cuticles and 541
tree leaves. Geochimica et Cosmochimica Acta, 54, 3065-3072. 542
Grandy AS, Neff JC (2008) Molecular C dynamics downstream: The biochemical 543
decomposition sequence and its impact on soil organic matter structure and function. 544
Science of The Total Environment, 404, 297-307. 545
Grasset L, Martinod J, Plante AF, Amblès A, Chenu C, Righi D (2009) Nature and origin of 546
lipids in clay size fraction of a cultivated soil as revealed using preparative 547
thermochemolysis. Organic Geochemistry, 40, 70-78. 548
31
Guggenberger G, Christensen BT, Zech W (1994) Land use effects on the composition of 549
organic matter in particle size separates of soil: I. Lignin and carbohydrate signature. 550
European Journal of Soil Science, 46, 449-458. 551
Hedges JI, Blanchette RA, Weliky K, Devol AH (1988) Effects of fungal degradation on the 552
CUO Oxidation products of lignin - a controlled laboratory study. Geochimica et 553
Cosmochimica Acta, 52, 2717-2726. 554
Hedges JI, Mann DC (1979) Characterization of plant tissues by their lignin oxidation 555
products. Geochimica et Cosmochimica Acta, 43, 1803-1807. 556
Heimann M, Reichstein M (2008) Terrestrial ecosystem carbon dynamics and climate 557
feedbacks. Nature, 451, 289-292. 558
Hitchcock AP (2006) aXis2000. Analysis of X-ray Images and Spectra. pp Page, McMaster 559
University, Hamilton, Ontario, Canada. 560
Kelleher BP, Simpson AJ (2006) Humic substances in soils: Are they really chemically 561
distinct? Environmental Science & Technology, 40, 4605-4611. 562
Kinyangi J, Solomon D, Liang BI, Lerotic M, Wirick S, Lehmann J (2006) Nanoscale 563
biogeocomplexity of the organomineral assemblage in soil: Application of STXM 564
microscopy and C 1s-NEXAFS spectroscopy. Soil Science Society of America 565
Journal, 70, 1708-1718. 566
Kögel-Knabner I, Ekschmitt K, Flessa H, Guggenberger G, Matzner E, Marschner B, von 567
Luetzow M (2008) An integrative approach of organic matter stabilization in 568
temperate soils: Linking chemistry, physics, and biology. Journal of Plant Nutrition 569
and Soil Science-Zeitschrift Fur Pflanzenernahrung Und Bodenkunde, 171, 5-13. 570
Laird DA, Chappell MA, Martens DA, Wershaw RL, Thompson M (2008) Distinguishing 571
black carbon from biogenic humic substances in soil clay fractions. Geoderma, 143, 572
115-122. 573
Lehmann J, Kinyangi J, Solomon D (2007) Organic matter stabilization in soil 574
microaggregates: implications from spatial heterogeneity of organic carbon contents 575
and carbon forms. Biogeochemistry, 85, 45-57. 576
Lehmann J, Liang B, Solomon D, Lerotic M, Luizao F, Schafer T, Wirick S (2005) Near-577
edge x-ray absorption fine structure (NEXAFS) spectroscopy for mapping nano-scale 578
distribution of organic carbon forms in soils: Application to black carbon particles. 579
Global Biogeochemical Cycles, 19, doi 10.1029/2004GB002435,002005. 580

32
Lehmann J, Solomon D, Kinyangi J, Dathe L, Wirick S, Jacobsen C (2008) Spatial 581
complexity of soil organic matter forms at nanometre scales. Nature Geoscience, 1, 582
238-242. 583
Leifeld J (2008) Calorimetric characterization of grass during its decomposition. Journal of 584
Thermal Analysis and Calorimetry, 93, 651-655. 585
Lopez-Capel E, Sohi SP, Gaunt JL, Manning DAC (2005) Use of Thermogravimetry-586
Differential Scanning Calorimetry to Characterize Modelable Soil Organic Matter 587
Fractions. Soil Sci Soc Am J, 69, 930-. 588
Marschner B, Brodowski S, Dreves A et al. (2008) How relevant is recalcitrance for the 589
stabilization of organic matter in soils? Journal of Plant Nutrition and Soil Science-590
Zeitschrift Fur Pflanzenernahrung Und Bodenkunde, 171, 91-110. 591
Ogle SM, Breidt FJ, Easter M, Williams S, Killian K, Paustian K (2010) Scale and 592
uncertainty in modeled soil organic carbon stock changes for US croplands using a 593
process-based model. Global Change Biology, 16, 810-822. 594
Paul EA, Morris SJ, Conant RT, Plante AF (2006) Does the Acid Hydrolysis-Incubation 595
Method Measure Meaningful Soil Organic Carbon Pools? Soil Sci Soc Am J, 70, 596
1023-1035. 597
Piccolo A (2001) The supramolecular structure of humic substances. Soil Science, 166, 810-598
832. 599
Plante AF, Pernes M, Chenu C (2005) Changes in clay-associated organic matter quality in a 600
C depletion sequence as measured by differential thermal analyses. Geoderma, 129, 601
186-199. 602
Rasmussen C, Torn MS, Southard RJ (2005) Mineral assemblage and aggregates control 603
carbon dynamics in a California conifer forest. Soil Science Society of America 604
Journal, 69, 1711-1721. 605
Schulten H-R, Schnitzer M (1997) Chemical model structures for soil organic matter and 606
soils. Soil Science, 162, 115-130. 607
Schumacher M, Christl I, Scheinost AC, Jacobsen C, Kretzschmar R (2005) Chemical 608
heterogeneity of organic soil colloids investigated by scanning transmission X-ray 609
microscopy and C-1s NEXAFS microspectroscopy. Environmental Science and 610
Technology, 39, 9094-9100. 611
Schumacher M, Christl I, Vogt RD, Barmettler K, Jacobsen C, Kretzschmar R (2006) 612
Chemical composition of aquatic dissolved organic matter in five boreal forest 613
catchments sampled in spring and fall seasons. Biogeochemistry, 80, 263-275. 614
33
Sollins P, Kramer MG, Swanston C et al. (2009) Sequential density fractionation across soils 615
of contrasting mineralogy: evidence for both microbial- and mineral-controlled soil 616
organic matter stabilization. Biogeochemistry, 96, 209-231. 617
Sollins P, Swanston C, Kleber M et al. (2006) Organic C and N stabilization in a forest soil: 618
Evidence from sequential density fractionation. Soil Biology and Biochemistry, 38, 619
3313-3324. 620
Solomon D, Lehmann J, Kinyangi J, Liang BQ, Schafer T (2005) Carbon K-edge NEXAFS 621
and FTIR-ATR spectroscopic investigation of organic carbon speciation in soils. Soil 622
Science Society of America Journal, 69, 107-119. 623
Sutton R, Sposito G (2005) Molecular structure in soil humic substances: The new view. 624
Environmental Science & Technology, 39, 9009-9015. 625
Swift R (1999) Macromolecular properties of soil humic substances: fact, fiction and opinion. 626
Soil Science, 164, 790-802. 627
Trumbore SE (2000) Age of soil organic matter and soil respiration: radiocarbon constraints 628
on belowground C dynamics. Ecological Applications, 10, 399-411. 629
Urquhart SG, Ade H (2002) Trends in the Carbonyl Core (C 1S, O 1S) π∗ C=O Transition in 630
the Near-Edge X-ray Absorption Fine Structure Spectra of Organic Molecules. J. 631
Phys. Chem. B, 106, 8531-8538. 632
von Lützow M, Kögel-Knabner I (2009) Temperature sensitivity of soil organic matter 633
decomposition-what do we know? Biology and Fertility of Soils, 46, 1-15. 634
Wan J, Tyliszczak T, Tokunaga TK (2007) Organic carbon distribution, speciation, and 635
elemental correlations within soil microaggregates: Applications of STXM and 636
NEXAFS spectroscopy. Geochimica et Cosmochimica Acta, 71, 5439-5449. 637
Wixon DL, Balser TC (2009) Complexity, Climate Change and Soil Carbon: A Systems 638
Approach to Microbial Temperature Response. Systems Research and Behavioral 639
Science, 601-620. 640
Yurova AY, Volodin EM, Ågren G, Chertov OG, Komarov AS (2010) Effects of variations 641
in simulated changes in soil carbon contents and dynamics on future climate 642
projections. Global Change Biology, 16, 823-835. 643
644
645