oklahoma water resources board | the water …...the use and management of oklahoma’s water...
TRANSCRIPT


Cover photo: Early Morning on Grand Lake, Barry Fogerty, OWRB
The objective of the Oklahoma Comprehensive Water Plan is to ensure a dependable water supply for all Oklahomans through integrated and coordinated water resources planning by providing the
information necessary for water providers, policy-makers, and end users to make informed decisions concerning the use and management of Oklahoma’s water resources.
This study, managed and executed by the Oklahoma Water Resources Board under its authority to update the Oklahoma Comprehensive Water Plan, was funded jointly through monies generously
provided by the Oklahoma State Legislature and the federal government through cooperative agreements with the U.S. Army Corps of Engineers and Bureau of Reclamation.
The online version of this 2012 OCWP Watershed Planning Region Report (Version 1.1) includes figures that have been updated since distribution of the original printed version. Revisions herein primarily pertain to the seasonality (i.e., the
percent of total annual demand distributed by month) of Crop Irrigation demand. While the annual water demand remains unchanged, the timing and magnitude of projected gaps and depletions have been modified in some basins. The online
version may also include other additional or updated data and information since the original version was printed.

Oklahoma Comprehensive Water Plan
Grand Watershed Planning Region

2 Grand Regional Report Oklahoma Comprehensive Water Plan
Statewide OCWP Watershed Planning Region and Basin Delineation
Contents Introduction . . . . . . . . . . . . . . . . . . . . . . . . . . . . . . . . . . . . . . . . . . . . . . . 1
Regional Overview . . . . . . . . . . . . . . . . . . . . . . . . . . . . . . . . . . . . . . 1
Grand Regional Summary . . . . . . . . . . . . . . . . . . . . . . . . . . . . . . . . . . . 2
Synopsis . . . . . . . . . . . . . . . . . . . . . . . . . . . . . . . . . . . . . . . . . . . . . . . 2
Water Resources & Limitations . . . . . . . . . . . . . . . . . . . . . . . . . 2
Water Supply Options . . . . . . . . . . . . . . . . . . . . . . . . . . . . . . . . . . 4
Water Supply . . . . . . . . . . . . . . . . . . . . . . . . . . . . . . . . . . . . . . . . . . . . . . 6
Physical Water Availability . . . . . . . . . . . . . . . . . . . . . . . . . . . . . 6
Surface Water Resources . . . . . . . . . . . . . . . . . . . . . . . . . . . . . 6
Groundwater Resources . . . . . . . . . . . . . . . . . . . . . . . . . . . . . 9
Permit Availability . . . . . . . . . . . . . . . . . . . . . . . . . . . . . . . . . . . . . .11
Water Quality . . . . . . . . . . . . . . . . . . . . . . . . . . . . . . . . . . . . . . . . . 12
Water Demand . . . . . . . . . . . . . . . . . . . . . . . . . . . . . . . . . . . . . . . . . . . 20
Public Water Providers . . . . . . . . . . . . . . . . . . . . . . . . . . . . . . . . . . . . 22
Water Supply Options . . . . . . . . . . . . . . . . . . . . . . . . . . . . . . . . . . . . 36
Limitations Analysis . . . . . . . . . . . . . . . . . . . . . . . . . . . . . . . . . . . 36
Primary Options . . . . . . . . . . . . . . . . . . . . . . . . . . . . . . . . . . . . . . . 36
Demand Management . . . . . . . . . . . . . . . . . . . . . . . . . . . . . . . 36
Out-of-Basin Supplies . . . . . . . . . . . . . . . . . . . . . . . . . . . . . . . 36
Reservoir Use . . . . . . . . . . . . . . . . . . . . . . . . . . . . . . . . . . . . . . 36
Increasing Reliance on Surface Water . . . . . . . . . . . . . . . 37
Increasing Reliance on Groundwater . . . . . . . . . . . . . . . . . 37
Expanded Options . . . . . . . . . . . . . . . . . . . . . . . . . . . . . . . . . . . . 37
Expanded Conservation Measures . . . . . . . . . . . . . . . . . . . 37
ArtificialAquiferRecharge . . . . . . . . . . . . . . . . . . . . . . . . . . 37
Marginal Quality Water Sources . . . . . . . . . . . . . . . . . . . . . 37
Potential Reservoir Development . . . . . . . . . . . . . . . . . . . . 37
Basin Data & Analysis . . . . . . . . . . . . . . . . . . . . . . . . . . . . . . . . . . . . . 41
Basin 80 . . . . . . . . . . . . . . . . . . . . . . . . . . . . . . . . . . . . . . . . . . . . . . . 41
Basin 81 . . . . . . . . . . . . . . . . . . . . . . . . . . . . . . . . . . . . . . . . . . . . . . . 51
Glossary . . . . . . . . . . . . . . . . . . . . . . . . . . . . . . . . . . . . . . . . . . . . . . . . . . 60
Sources . . . . . . . . . . . . . . . . . . . . . . . . . . . . . . . . . . . . . . . . . . . . . . . . . . . 66

Grand Regional Report 1 Oklahoma Comprehensive Water Plan
The Oklahoma Comprehensive Water Plan (OCWP) was originally developed in 1980 and lastupdatedin1995.Withthespecificobjectiveof establishing a reliable supply of water for state users throughout at least the next 50 years, the current update represents the most ambitious and intensive water planning effort ever undertaken by the state . The 2012 OCWP Update is guided by two ultimate goals:
1 . Provide safe and dependable water supply for all Oklahomans while improving the economy and protecting the environment .
2 . Provide information so that water providers, policy makers, and water users can make informed decisions concerning the use and management of Oklahoma’s water resources .
In accordance with the goals, the 2012 OCWP Update has been developed under an innovative parallel-path approach: inclusive and dynamic public participation to build sound water policy complemented by detailed technical evaluations .
Alsouniquetothisupdatearestudiesconductedaccordingtospecificgeographicboundaries (watersheds) rather than political boundaries (counties) . This new strategy involved dividing the state into 82 surface water basins for water supply availability analysis (see the OCWP Physical Water Supply Availability Report) . Existing watershed boundaries were revised to include a United States Geological Survey (USGS) stream
gage at or near the basin outlet (downstream boundary), where practical . To facilitate consideration of regional supply challenges and potential solutions, basins were aggregated into 13 distinct Watershed Planning Regions .
This Watershed Planning Region report, one of 13 such documents prepared for the 2012 OCWP Update, presents elements of technical studies pertinent to the Grand Region . Each regional report presents information from both a regional and multiple basin perspective, including water supply/demand analysis results, forecasted water supply shortages, potential supply solutions and alternatives, and supporting technical information .
Integral to the development of these reports was the Oklahoma H2O tool, a sophisticated database and geographic information system (GIS) based analysis tool created to compare projectedwaterdemandtophysicalsuppliesin each of the 82 OCWP basins statewide . Recognizing that water planning is not a static process but rather a dynamic one, this versatile tool can be updated over time as new supply and demand data become available, and can be used to evaluate a variety of “what-if” scenarios at the basin level, such as a change in supply sources, demand, new reservoirs, and various other policy management scenarios .
Primary inputs to the model include demand projectionsforeachdecadethrough2060,foundedon widely-accepted methods and peer review of inputs and results by state and federal agency staff, industry representatives, and stakeholder groups for
Introduction
The primary factors in the determination of reliable future water supplies are physical supplies, water rights, water quality, and infrastructure. Gaps and depletions occur when demand exceeds supply, and can be attributed to physical supply, water rights, infrastructure, or water quality constraints.
As a key foundation of OCWP technical work, a computer-based analysis tool, “Oklahoma H2O,” was created to compare projected demands with physical supplies for each basin to identify areas of potential water shortages.
each demand sector . Surface water supply data for each of the 82 basins is based on 58 years of publicly-availabledailystreamflowgagedatacollectedbytheUSGS . Groundwater resources were characterized using previously-developed assessments of groundwateraquiferstorageandrechargerates.
Additional and supporting information gathered during development of the 2012 OCWP Update is provided in the OCWP Executive Report and various OCWP supplemental reports . Assessments of statewide physical water availability and potential shortages are further documented in the OCWP Physical Water Supply Availability Report . Statewide waterdemandprojectionmethodsandresultsaredetailed in the OCWP Water Demand Forecast Report . Permitting availability was evaluated based on the OWRB’s administrative protocol and documented in the OCWP Water Supply Permit Availability Report . All supporting documentation can be found on the OWRB’s website .
Regional OverviewThe Grand Watershed Planning Region includes two basins (numbered 80 and 81 for reference). The region encompasses 2,694 square miles in northeast Oklahoma, spanning all of Ottawa County and parts of Craig, Rogers, Mayes, Delaware, Wagoner, and Cherokee Counties.
The region is divided between the Central Lowland physiography province in the west and the Ozark Plateaus in the south and east. Encompassing some of the most scenic areas of the state, the region’s terrain includes forested mountains, rolling plains, and rich river basins. Tall grass prairies in the east with a mix of rangeland and cropland give way to oak-hickory and oak-hickory-pine forests with livestock farming and logging land uses.
The region has a generally mild climate with annual mean temperatures varying from 59°F to 61°F. Annual average precipitation ranges from 42 inches in the northwest to 45 inches in the southeast. Annual evaporation is around 46 inches per year.
The largest cities in the region include Miami (2010 population 13,570), Pryor Creek (9,539), and Vinita (5,743). The greatest demand is from Municipal and Industrial water use.
By 2060, this region is projected to have a total demand of 57,550 acre-feet per year (AFY), an increase of approximately 20,250 AFY (54%) from 2010.

2 Grand Regional Report Oklahoma Comprehensive Water Plan
The Grand Region accounts for 2% of the state’s total water demand . The largest demand sectors are Municipal and Industrial (59% of the region’s 2010 overall demand), Thermoelectric Power (12%), and Livestock (17%) .
Water Resources & LimitationsSurface Water Surface water is used to meet about 42% of the Grand Region’s demand . The region is supplied by the Grand River and its tributaries . The river and creeks in the region can have periods of low flow due to seasonal and long-term trends in precipitation . Fort Gibson, Hudson (Markham Ferry), and Grand lakes were built on the Grand River for flood control and hydropower purposes . W . R . Holway was constructed as a pumped storageprojectadjacenttoHudson.Noinformation is available on the amount of water supply or yield of these reservoirs; therefore,theprojectedshortagesdonot
account for the use of reservoir storage in the basin . Lake Spavinaw and Lake Eucha have been constructed on Spavinaw Creek to provide both out-of-basin water supply to the City of Tulsa in the Middle Arkansas Planning Region and for recreation .
Relative to other regions in the state, surface waterqualityintheregionisconsideredpoortofair.Multiplecreeksandmajorreservoirsareimpaired for Agricultural use (Crop Irrigation demand sector) and Public and Private Water Supply (Municipal and Industrial demand sector) due to high levels of total dissolved solids (TDS), chloride, sulfate, and chlorophyll-a . These impairments are scheduled to be addressed through the Total Maximum Daily Loads (TMDL) process, but the use of these supplies may be limited for the interim .
The Grand River Dam Authority (GRDA) is currently responsible for administering surface water resources in the Grand Watershed Planning Region . Therefore, with the exception of a small number of water rights
that were issued prior to GRDA’s formation, the OWRB does not issue or administer stream water permits in the region . Instead of actual appropriation of waters, GRDA generally enters into contracts for the use of surface waterresourceswithinitsjurisdiction.
Alluvial Groundwater Alluvial groundwater is used to meet 2% of the demand in the region . Almost all the use of
alluvial groundwater is for Self-Supplied Residential (domestic) purposes, which doesnotrequirepermitsandareassumedtobesuppliedfromminoralluvialaquifers.If alluvial groundwater continues to supply a similar portion of demand in the future, storagedepletionsfromtheseminoraquifershave a moderate probability of occurring throughout the year . The largest storage depletionsareprojectedtooccurinthe
Grand Regional Summary Synopsis
� The Grand Region relies primarily on bedrock groundwater and surface water supplies (including reservoirs).
� It is anticipated that water users in the region will continue to rely on these sources to meet future demand.
� By 2020, surface water gaps will occur in Basin 80 without use of the basin’s reservoirs.
� By 2020, alluvial groundwater depletions in minor aquifers will occur in Basin 80.
� No bedrock groundwater storage depletions are expected in the region.
� To reduce the risk of adverse impacts on water supplies, it is recommended that surface water gaps and groundwater depletions be decreased where economically feasible.
� Additional conservation could reduce surface water gaps.
� Use of additional groundwater supplies and/or developing small reservoirs or using existing reservoirs could mitigate gaps without having major impacts to groundwater storage.
� No basins within the region have been identified as a water availability “hot spots,” areas where more severe deficits or gaps in supply are anticipated. (See “Regional and Statewide Opportunities and Solutions,” 2012 OCWP Executive Report.)
Current and Projected Regional Water Demand
Grand Region Demand SummaryCurrent Water Demand: 37,300 acre-feet/year (2% of state total)
Largest Demand Sector: Municipal & Industrial (59% of regional total)
Current Supply Sources: 42% SW 2% Alluvial GW 56% Bedrock GW
Projected Demand (2060): 57,550 acre-feet/year
Growth (2010-2060): 20,250 acre-feet/year (54%)

Grand Regional Report 3 Oklahoma Comprehensive Water Plan
Water Supply LimitationsGrand Region
summer . Site-specific information on minor aquifersshouldbeconsideredbeforelong-termor large-scale use .
The availability of permits is not expected to constrain the use of alluvial groundwater supplies to meet local demand through 2060 . There are no prevalent alluvial groundwater qualityissuesintheregion.
Bedrock Groundwater Bedrock groundwater is used to meet 56% of the demand in the region . Currently permitted andprojectedwithdrawalsareprimarilyfromtheRoubidouxmajoraquiferandBooneminoraquifer.Bothaquifershaveover20millionacre-feet (AF) of groundwater storage in the region.Bedrockaquiferstoragedepletionsarenot expected in the Grand Region .
The availability of permits is not expected to constrain the use of bedrock groundwater supplies to meet local demand through 2060 . Concentrations of chloride and naturally occurring radioactivity may exceed drinking water standards in some localized areas of the Roubidouxbedrockaquifer;however,therearenowidespreadgroundwaterqualityissuesin the region .
Water Supply LimitationsSurface water limitations are determined based on physical availability, water supply availability for new permits, and water quality. Groundwater limitations are determined based on the total size and rate of storage depletions in major aquifers. Groundwater permits are not expected to constrain the use of groundwater through 2060; insufficient statewide groundwater quality data are available to compare basins based on groundwater quality. Basins with the most significant water supply challenges statewide are indicated by a red box. The remaining basins with surface water gaps or groundwater storage depletions were considered to have potential limitations (yellow). Basins without gaps and storage depletions are considered to have minimal limitations (green). Detailed explanations of each basin’s supplies are provided in individual basin summaries and supporting data and analysis.
4 Grand Regional Report Oklahoma Comprehensive Water Plan
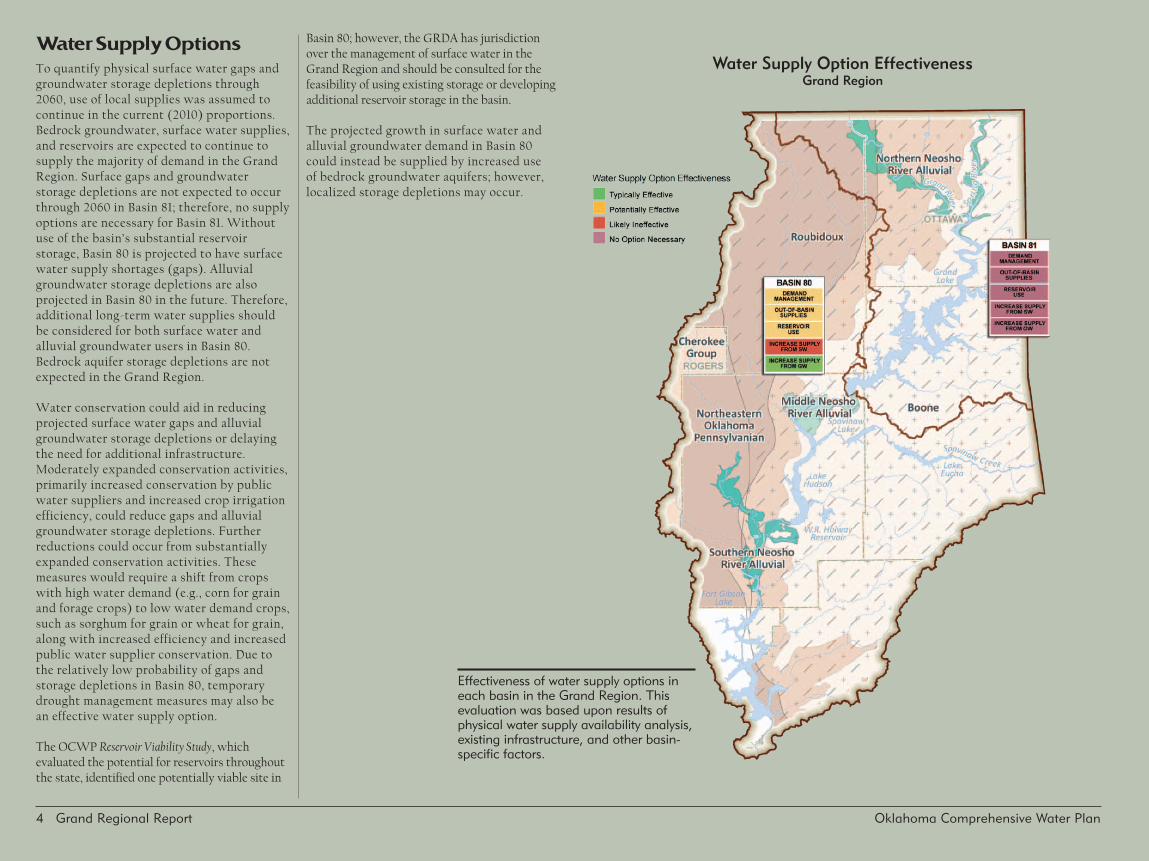
Water Supply Option EffectivenessGrand Region
Water Supply Options Toquantifyphysicalsurfacewatergapsandgroundwater storage depletions through 2060, use of local supplies was assumed to continue in the current (2010) proportions . Bedrock groundwater, surface water supplies, and reservoirs are expected to continue to supplythemajorityofdemandintheGrandRegion . Surface gaps and groundwater storage depletions are not expected to occur through 2060 in Basin 81; therefore, no supply options are necessary for Basin 81 . Without use of the basin’s substantial reservoir storage,Basin80isprojectedtohavesurfacewater supply shortages (gaps) . Alluvial groundwater storage depletions are also projectedinBasin80inthefuture.Therefore,additional long-term water supplies should be considered for both surface water and alluvial groundwater users in Basin 80 . Bedrockaquiferstoragedepletionsarenotexpected in the Grand Region .
Water conservation could aid in reducing projectedsurfacewatergapsandalluvialgroundwater storage depletions or delaying the need for additional infrastructure . Moderately expanded conservation activities, primarily increased conservation by public water suppliers and increased crop irrigation efficiency, could reduce gaps and alluvial groundwater storage depletions . Further reductions could occur from substantially expanded conservation activities . These measureswouldrequireashiftfromcropswith high water demand (e .g ., corn for grain and forage crops) to low water demand crops, such as sorghum for grain or wheat for grain, along with increased efficiency and increased public water supplier conservation . Due to the relatively low probability of gaps and storage depletions in Basin 80, temporary drought management measures may also be an effective water supply option .
The OCWP Reservoir Viability Study, which evaluated the potential for reservoirs throughout thestate,identifiedonepotentiallyviablesitein
Basin80;however,theGRDAhasjurisdictionover the management of surface water in the Grand Region and should be consulted for the feasibility of using existing storage or developing additional reservoir storage in the basin .
Theprojectedgrowthinsurfacewaterandalluvial groundwater demand in Basin 80 could instead be supplied by increased use ofbedrockgroundwateraquifers;however,localized storage depletions may occur .
Effectiveness of water supply options in each basin in the Grand Region. This evaluation was based upon results of physical water supply availability analysis, existing infrastructure, and other basin-specific factors.
Grand Regional Report 5 Oklahoma Comprehensive Water Plan
6 Grand Regional Report Oklahoma Comprehensive Water Plan
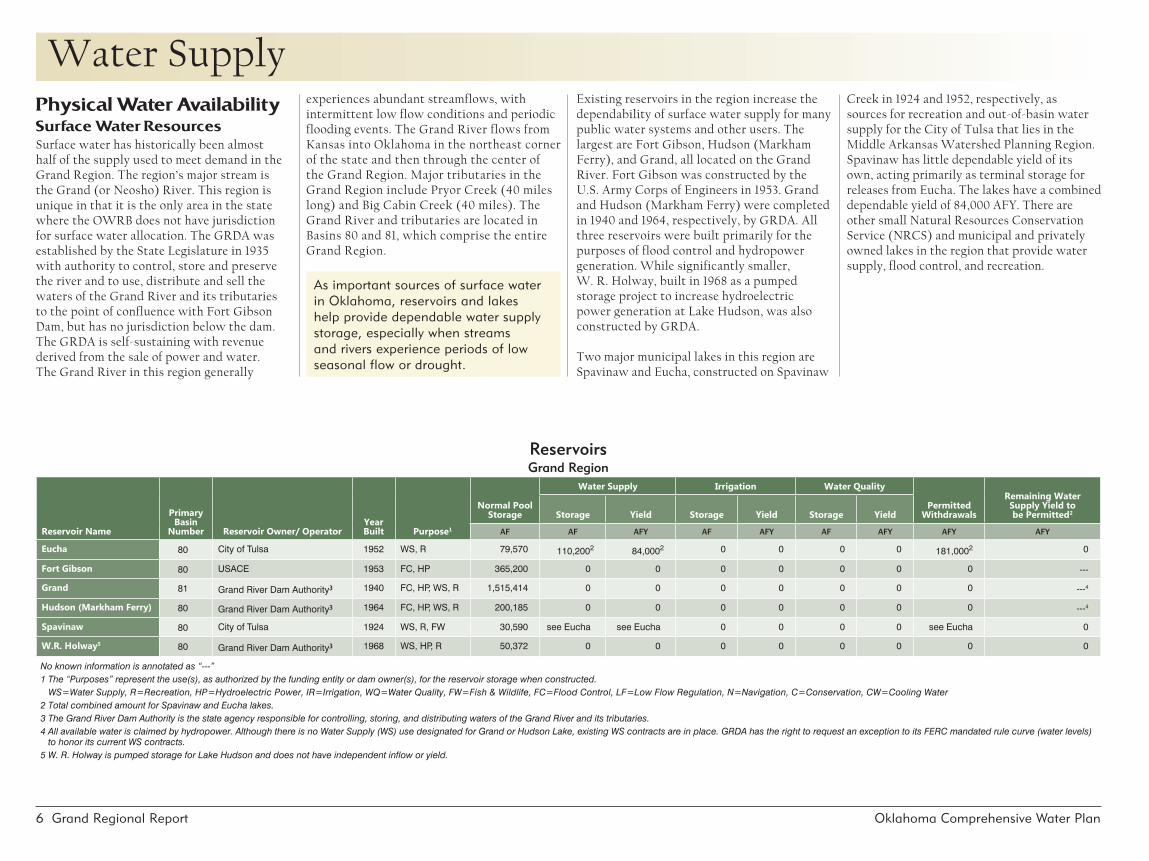
Water Supply Physical Water AvailabilitySurface Water ResourcesSurface water has historically been almost half of the supply used to meet demand in the GrandRegion.Theregion’smajorstreamistheGrand(orNeosho)River.ThisregionisuniqueinthatitistheonlyareainthestatewheretheOWRBdoesnothavejurisdictionfor surface water allocation . The GRDA was established by the State Legislature in 1935 with authority to control, store and preserve the river and to use, distribute and sell the waters of the Grand River and its tributaries to the point of confluence with Fort Gibson Dam,buthasnojurisdictionbelowthedam.The GRDA is self-sustaining with revenue derived from the sale of power and water . The Grand River in this region generally
experiences abundant streamflows, with intermittent low flow conditions and periodic flooding events . The Grand River flows from Kansas into Oklahoma in the northeast corner of the state and then through the center of theGrandRegion.MajortributariesintheGrand Region include Pryor Creek (40 miles long) and Big Cabin Creek (40 miles) . The Grand River and tributaries are located in Basins 80 and 81, which comprise the entire Grand Region .
Existing reservoirs in the region increase the dependability of surface water supply for many public water systems and other users . The largest are Fort Gibson, Hudson (Markham Ferry), and Grand, all located on the Grand River . Fort Gibson was constructed by the U .S . Army Corps of Engineers in 1953 . Grand and Hudson (Markham Ferry) were completed in 1940 and 1964, respectively, by GRDA . All three reservoirs were built primarily for the purposes of flood control and hydropower generation . While significantly smaller, W . R . Holway, built in 1968 as a pumped storageprojecttoincreasehydroelectricpower generation at Lake Hudson, was also constructed by GRDA .
TwomajormunicipallakesinthisregionareSpavinaw and Eucha, constructed on Spavinaw
Creek in 1924 and 1952, respectively, as sources for recreation and out-of-basin water supply for the City of Tulsa that lies in the Middle Arkansas Watershed Planning Region . Spavinaw has little dependable yield of its own, acting primarily as terminal storage for releases from Eucha . The lakes have a combined dependable yield of 84,000 AFY . There are othersmallNaturalResourcesConservationService(NRCS)andmunicipalandprivatelyowned lakes in the region that provide water supply, flood control, and recreation .
As important sources of surface water in Oklahoma, reservoirs and lakes help provide dependable water supply storage, especially when streams and rivers experience periods of low seasonal flow or drought.
ReservoirsGrand Region
Reservoir Name
Primary Basin
Number Reservoir Owner/ OperatorYear Built Purpose1
Normal Pool Storage
Water Supply Irrigation Water Quality
Permitted Withdrawals
Remaining Water Supply Yield to be Permitted2 Storage Yield Storage Yield Storage Yield
AF AF AFY AF AFY AF AFY AFY AFY
Eucha 80 City of Tulsa 1952 WS, R 79,570 110,2002 84,0002 0 0 0 0 181,0002 0
Fort Gibson 80 USACE 1953 FC, HP 365,200 0 0 0 0 0 0 0 ---
Grand 81 Grand River Dam Authority3 1940 FC, HP, WS, R 1,515,414 0 0 0 0 0 0 0 ---4
Hudson (Markham Ferry) 80 Grand River Dam Authority3 1964 FC, HP, WS, R 200,185 0 0 0 0 0 0 0 ---4
Spavinaw 80 City of Tulsa 1924 WS, R, FW 30,590 see Eucha see Eucha 0 0 0 0 see Eucha 0
W.R. Holway5 80 Grand River Dam Authority3 1968 WS, HP, R 50,372 0 0 0 0 0 0 0 0
No known information is annotated as “---”1 The “Purposes” represent the use(s), as authorized by the funding entity or dam owner(s), for the reservoir storage when constructed. WS=Water Supply, R=Recreation, HP=Hydroelectric Power, IR=Irrigation, WQ=Water Quality, FW=Fish & Wildlife, FC=Flood Control, LF=Low Flow Regulation, N=Navigation, C=Conservation, CW=Cooling Water2 Total combined amount for Spavinaw and Eucha lakes.3 The Grand River Dam Authority is the state agency responsible for controlling, storing, and distributing waters of the Grand River and its tributaries.4 All available water is claimed by hydropower. Although there is no Water Supply (WS) use designated for Grand or Hudson Lake, existing WS contracts are in place. GRDA has the right to request an exception to its FERC mandated rule curve (water levels)
to honor its current WS contracts.5 W. R. Holway is pumped storage for Lake Hudson and does not have independent inflow or yield.

Grand Regional Report 7 Oklahoma Comprehensive Water Plan
Surface Water ResourcesGrand Region
Reservoirs may serve multiple purposes, such as water supply, irrigation, recreation, hydropower generation, and flood control. Reservoirs designed for multiple purposes typically possess a specific volume of water storage assigned for each purpose.

8 Grand Regional Report Oklahoma Comprehensive Water Plan
Estimated Annual Streamflow in 2060Grand Region
Streamflow Statistic
Basins
80 81
AFY
Average Annual Flow 3,678,800 2,639,200
Minimum Annual Flow 445,300 385,300
Annual streamflow in 2060 was estimated using historical gaged flow and projections of increased surface water use from 2010 to 2060.
Surface Water Flows (1950-2007)Grand Region
Surface water sources supply nearly half of the demand in the Grand Region. While the region’s average physical surface water supply exceeds projected surface water demand in the region, localized or intermittent shortages can occur due to variability in surface water flows. Reservoirs may reduce the impacts of drier periods on surface water users.
Water Supply Availability AnalysisFor OCWP physical water supply availability analysis, water supplies were divided into three categories: surface water, alluvial aquifers, and bedrock aquifers. Physically available surface water refers to water currently in streams, rivers, lakes, and reservoirs.
The range of historical surface water availability, including droughts, is well-represented in the Oklahoma H2O tool by 58 years of monthly streamflow data (1950 to 2007) recorded by the U.S. Geological Survey (USGS). Therefore, measured streamflow, which reflects current natural and human created conditions (runoff, diversions and use of water, and impoundments and reservoirs), is used to represent the physical water that may be available to meet projected demand.
The estimated average and minimum annual streamflow in 2060 were determined based on historic surface water flow measurements and projected baseline 2060 demand (see Water Demand section). The amount of streamflow in 2060 may vary from basin-level values, due to local variations in demands and local availability of supply sources. The estimated surface water supplies include changes in historical streamflow due to increased upstream demand, return flows, and increases in out-of-basin supplies from existing infrastructure. Permitting, water quality, infrastructure, non-consumptive demand, and potential climate change implications are considered in separate OCWP analyses. Past reservoir operations are reflected and accounted for in the measured historical streamflow downstream of a reservoir. For this analysis, streamflow was adjusted to reflect interstate compact provisions in accordance with existing administrative protocol.
The amount of water a reservoir can provide from storage is referred to as its yield. The yield is considered the maximum amount of water a reservoir can dependably supply during critical drought periods. The unused yield of existing reservoirs was considered for this analysis. Future potential reservoir storage was considered as a water supply option.
Groundwater supplies are quantified by the amount of water that an aquifer holds (“stored” water) and the rate of aquifer recharge. In Oklahoma, recharge to aquifers is generally from precipitation that falls on the aquifer and percolates to the water table. In some cases, where the altitude of the water table is below the altitude of the stream-water surface, surface water can seep into the aquifer.
For this analysis, alluvial aquifers are defined as aquifers comprised of river alluvium and terrace deposits, occurring along rivers and streams and consisting of unconsolidated deposits of sand, silt, and clay. Alluvial aquifers are generally thinner (less than 200 feet thick) than bedrock aquifers, feature shallow water tables, and are exposed at the land surface, where precipitation can readily percolate to the water table. Alluvial aquifers are considered to be more hydrologically connected with streams than are bedrock aquifers and are therefore treated separately.
Bedrock aquifers consist of consolidated (solid) or partially consolidated rocks, such as sandstone, limestone, dolomite, and gypsum. Most bedrock aquifers in Oklahoma are exposed at land surface either entirely or in part. Recharge from precipitation is limited in areas where bedrock aquifers are not exposed.
For both alluvial and bedrock aquifers, this analysis was used to predict potential groundwater depletions based on the difference between the groundwater demand and recharge rate. While potential storage depletions do not affect the permit availability of water, it is important to understand the extent of these depletions.
More information is available in the OCWP Physical Water Supply Availability Report on the OWRB website.
Grand Regional Report 9 Oklahoma Comprehensive Water Plan
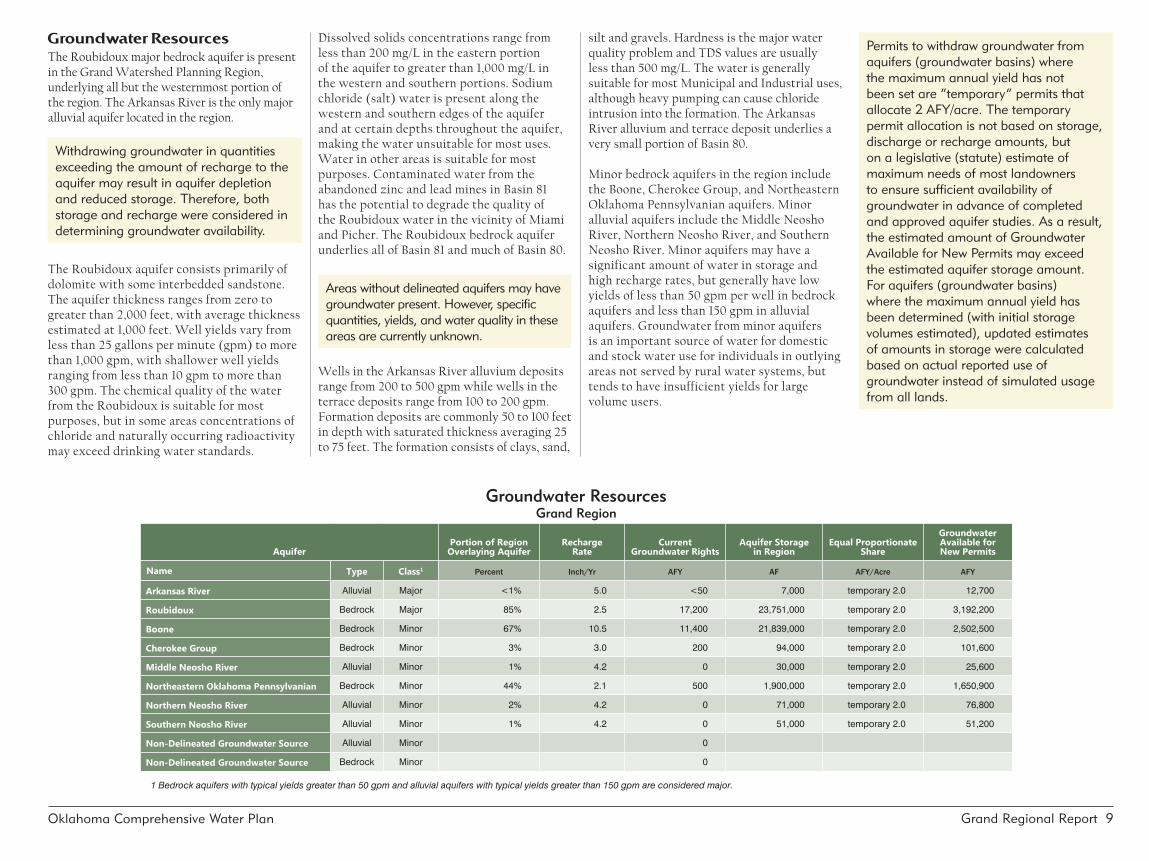
Groundwater ResourcesGrand Region
AquiferPortion of Region Overlaying Aquifer
Recharge Rate
Current Groundwater Rights
Aquifer Storage in Region
Equal Proportionate Share
Groundwater Available for New Permits
Name Type Class1 Percent Inch/Yr AFY AF AFY/Acre AFY
Arkansas River Alluvial Major <1% 5.0 <50 7,000 temporary 2.0 12,700
Roubidoux Bedrock Major 85% 2.5 17,200 23,751,000 temporary 2.0 3,192,200
Boone Bedrock Minor 67% 10.5 11,400 21,839,000 temporary 2.0 2,502,500
Cherokee Group Bedrock Minor 3% 3.0 200 94,000 temporary 2.0 101,600
Middle Neosho River Alluvial Minor 1% 4.2 0 30,000 temporary 2.0 25,600
Northeastern Oklahoma Pennsylvanian Bedrock Minor 44% 2.1 500 1,900,000 temporary 2.0 1,650,900
Northern Neosho River Alluvial Minor 2% 4.2 0 71,000 temporary 2.0 76,800
Southern Neosho River Alluvial Minor 1% 4.2 0 51,000 temporary 2.0 51,200
Non-Delineated Groundwater Source Alluvial Minor 0
Non-Delineated Groundwater Source Bedrock Minor 0
1 Bedrock aquifers with typical yields greater than 50 gpm and alluvial aquifers with typical yields greater than 150 gpm are considered major.
siltandgravels.HardnessisthemajorwaterqualityproblemandTDSvaluesareusuallyless than 500 mg/L . The water is generally suitable for most Municipal and Industrial uses, although heavy pumping can cause chloride intrusion into the formation . The Arkansas River alluvium and terrace deposit underlies a very small portion of Basin 80 .
MinorbedrockaquifersintheregionincludetheBoone,CherokeeGroup,andNortheasternOklahomaPennsylvanianaquifers.MinoralluvialaquifersincludetheMiddleNeoshoRiver,NorthernNeoshoRiver,andSouthernNeoshoRiver.Minoraquifersmayhaveasignificant amount of water in storage and high recharge rates, but generally have low yields of less than 50 gpm per well in bedrock aquifersandlessthan150gpminalluvialaquifers.Groundwaterfromminoraquifersis an important source of water for domestic and stock water use for individuals in outlying areas not served by rural water systems, but tends to have insufficient yields for large volume users .
Groundwater ResourcesTheRoubidouxmajorbedrockaquiferispresentin the Grand Watershed Planning Region, underlying all but the westernmost portion of theregion.TheArkansasRiveristheonlymajoralluvialaquiferlocatedintheregion.
TheRoubidouxaquiferconsistsprimarilyofdolomite with some interbedded sandstone . Theaquiferthicknessrangesfromzerotogreater than 2,000 feet, with average thickness estimated at 1,000 feet . Well yields vary from less than 25 gallons per minute (gpm) to more than 1,000 gpm, with shallower well yields ranging from less than 10 gpm to more than 300gpm.Thechemicalqualityofthewaterfrom the Roubidoux is suitable for most purposes, but in some areas concentrations of chloride and naturally occurring radioactivity may exceed drinking water standards .
Withdrawing groundwater in quantities exceeding the amount of recharge to the aquifer may result in aquifer depletion and reduced storage. Therefore, both storage and recharge were considered in determining groundwater availability.
Dissolved solids concentrations range from less than 200 mg/L in the eastern portion oftheaquifertogreaterthan1,000mg/Linthe western and southern portions . Sodium chloride (salt) water is present along the westernandsouthernedgesoftheaquiferandatcertaindepthsthroughouttheaquifer,making the water unsuitable for most uses . Water in other areas is suitable for most purposes . Contaminated water from the abandoned zinc and lead mines in Basin 81 hasthepotentialtodegradethequalityofthe Roubidoux water in the vicinity of Miami andPicher.TheRoubidouxbedrockaquiferunderlies all of Basin 81 and much of Basin 80 .
Wells in the Arkansas River alluvium deposits range from 200 to 500 gpm while wells in the terrace deposits range from 100 to 200 gpm . Formation deposits are commonly 50 to 100 feet in depth with saturated thickness averaging 25 to 75 feet . The formation consists of clays, sand,
Areas without delineated aquifers may have groundwater present. However, specific quantities, yields, and water quality in these areas are currently unknown.
Permits to withdraw groundwater from aquifers (groundwater basins) where the maximum annual yield has not been set are “temporary” permits that allocate 2 AFY/acre. The temporary permit allocation is not based on storage, discharge or recharge amounts, but on a legislative (statute) estimate of maximum needs of most landowners to ensure sufficient availability of groundwater in advance of completed and approved aquifer studies. As a result, the estimated amount of Groundwater Available for New Permits may exceed the estimated aquifer storage amount. For aquifers (groundwater basins) where the maximum annual yield has been determined (with initial storage volumes estimated), updated estimates of amounts in storage were calculated based on actual reported use of groundwater instead of simulated usage from all lands.

10 Grand Regional Report Oklahoma Comprehensive Water Plan
Groundwater ResourcesGrand Region
The only major bedrock aquifer in the Grand Region is the Roubidoux. The only major alluvial aquifer in the region is the Arkansas River. Major bedrock aquifers are defined as those that have an average water well yield of at least 50 gpm; major alluvial aquifers are those that yield, on average, at least 150 gpm.
Grand Regional Report 11 Oklahoma Comprehensive Water Plan
Groundwater Permit AvailabilityGrand Region
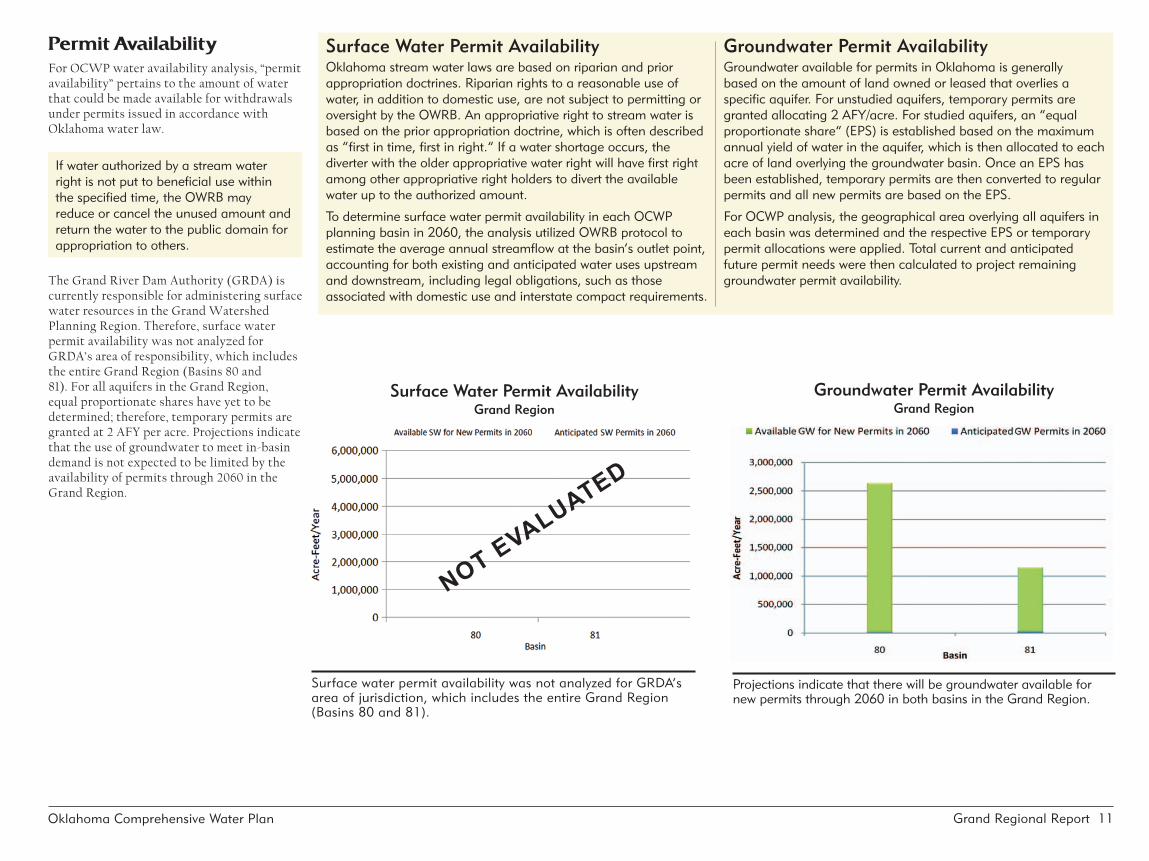
Projections indicate that there will be groundwater available for new permits through 2060 in both basins in the Grand Region.
Surface water permit availability was not analyzed for GRDA’s area of jurisdiction, which includes the entire Grand Region (Basins 80 and 81).
Surface Water Permit AvailabilityGrand Region
NOT EVALUATED
Surface Water Permit AvailabilityOklahoma stream water laws are based on riparian and prior appropriation doctrines. Riparian rights to a reasonable use of water, in addition to domestic use, are not subject to permitting or oversight by the OWRB. An appropriative right to stream water is based on the prior appropriation doctrine, which is often described as “first in time, first in right.” If a water shortage occurs, the diverter with the older appropriative water right will have first right among other appropriative right holders to divert the available water up to the authorized amount.
To determine surface water permit availability in each OCWP planning basin in 2060, the analysis utilized OWRB protocol to estimate the average annual streamflow at the basin’s outlet point, accounting for both existing and anticipated water uses upstream and downstream, including legal obligations, such as those associated with domestic use and interstate compact requirements.
Groundwater Permit AvailabilityGroundwater available for permits in Oklahoma is generally based on the amount of land owned or leased that overlies a specific aquifer. For unstudied aquifers, temporary permits are granted allocating 2 AFY/acre. For studied aquifers, an “equal proportionate share” (EPS) is established based on the maximum annual yield of water in the aquifer, which is then allocated to each acre of land overlying the groundwater basin. Once an EPS has been established, temporary permits are then converted to regular permits and all new permits are based on the EPS.
For OCWP analysis, the geographical area overlying all aquifers in each basin was determined and the respective EPS or temporary permit allocations were applied. Total current and anticipated future permit needs were then calculated to project remaining groundwater permit availability.
Permit AvailabilityFor OCWP water availability analysis, “permit availability” pertains to the amount of water that could be made available for withdrawals under permits issued in accordance with Oklahoma water law .
The Grand River Dam Authority (GRDA) is currently responsible for administering surface water resources in the Grand Watershed Planning Region . Therefore, surface water permit availability was not analyzed for GRDA’s area of responsibility, which includes the entire Grand Region (Basins 80 and 81).ForallaquifersintheGrandRegion,equalproportionateshareshaveyettobedetermined; therefore, temporary permits are grantedat2AFYperacre.Projectionsindicatethat the use of groundwater to meet in-basin demand is not expected to be limited by the availability of permits through 2060 in the Grand Region .
If water authorized by a stream water right is not put to beneficial use within the specified time, the OWRB may reduce or cancel the unused amount and return the water to the public domain for appropriation to others.

12 Grand Regional Report Oklahoma Comprehensive Water Plan
Water QualityWaterqualityoftheGrandWatershedPlanning Region is exemplified by the Grand (Neosho)Riveranditstributaries,andnumerousminorandmajorwatersupply/flood control reservoirs . It is contained nearly equallyintwoadjacentecoregions,theCentralIrregular Plains (CIP) in the west and the Ozark Highlands in the east . A small portion oftheBostonMountainsadjoinsalongthesouthern tip of the region .
The Osage Cuestas cover nearly a third of the region’s western geographical area and isdrainedbytheMiddletoLowerNeoshoRiver and tributaries, including Big Cabin and Pryor Creeks . The area is an irregular plain, underlain by sandstone, shale, and limestone . It is dominated by rangeland and some cropland, interspersed with native tall grass prairies and extensive, but disconnected oak-hickory forest . Typically, turbid and deep, streams meander in broad, low gradient valleys with incised banks . Habitat can be good, but in manyareasischokedbymud/silt.TheNeoshoRiverintersectstheareaattheconfluenceofBig Cabin Creek, below Grand Lake . Also, a majorityoftheHudson(MarkhamFerry)andFort Gibson Lake drainages are contained within the area . Salinity is moderate with mean conductivityrangingfrom270μS/cm(Neosho)to 530 μS/cm (Big Cabin) . Reservoir salinity ranges from than 200 μS/cm to greater than 300 μS/cm . Streams are eutrophic, and total nitrogen (TN)andphosphorus(TP)valuesaremoderate,with TP ranging from 0 .18 (Pryor) to 0 .30 ppm (Neosho)andTNfrom0.89(Pryor)to1.79
ppm (Big Cabin) . Reservoirs are phosphorus-limited, and Fort Gibson is eutrophic, while Hudson (Markham Ferry) is hyper-eutrophic . Instreams,waterclarityisgoodontheNeosho(turbidity=15NTU)tofair(BigCabin=30NTU)topoor(Pryor=75NTU).Lakeclarityisaverage to good, with average Secchi depths of 65 (Hudson) to 80 cm (Fort Gibson) . Ecological diversity varies throughout depending on habitat degradation and sedimentation and is typically lower than ecoregions to the east but higher than to the west .
The planning region is inundated in the north-central by the Cherokee Plains of the CIP . The area is much flatter than the Osage Cuestas and underlain mostly by poorly draining clay soils and hardpan . It is dominated by cropland, with interspersed native tall grass prairie and sparse oak-hickory stands . In the northern part of the ecoregion, the Tar Creek superfund site is located in the Miami area . Streams are diverse through the ecoregion . They are wider and shallower and sand/clay dominated with some cobble/gravel . The area is typified bytheupperNeoshoRiver,andtributariessuch as Tar Creek . Salinity is moderate with a typical conductivity mean of 358 μS/cm on theNeosho.Streamsaretypicallyeutrophic/hyper-eutrophic.TheTPandTNmeansontheNeoshoare0.17-0.21and1.30-1.38ppm,respectively . Stream water clarity is fair to poor, with turbidity means ranging from 37-52NTU.Ecologicaldiversityisaverageandimpacted by poor habitat, sedimentation, and toxicity related to mine tailings .
The Ozark Highlands covers the eastern two-thirds of the area and is represented by two intermingled ecoregions—the Springfield Plateau (Plateau) and the Dissected Springfield Plateau-Elk River Hills (Dissected-Elk Hills) . The Ozarks are comprised of a dissected plateau underlain by flat, cherty limestone, shale, and dolomite, and intersected by numerous level valleys . With much greater relief than the plains ecoregions to the west, it is much less rugged than the Boston and Ouachita Mountains to the south . Sub-surface flow is karst and
EcoregionsGrand Region
The Grand Planning Region is dominated by the Ozark Highlands to the east and the Central Irregular Plains to the west. Water quality is highly influenced by both geology and land use practices and ranges from good to excellent depending on drainage and location.
Lake Trophic StatusA lake’s trophic state, essentially a measure of its biological productivity, is a major determinant of water quality.
Oligotrophic: Low primary productivity and/or low nutrient levels.
Mesotrophic: Moderate primary productivity with moderate nutrient levels.
Eutrophic: High primary productivity and nutrient rich.
Hypereutrophic: Excessive primary productivity and excessive nutrients.

Grand Regional Report 13 Oklahoma Comprehensive Water Plan
Water Quality Standards ImplementationGrand Region
numerous springs feed typically perennials streams . Dense oak-hickory-pine forests cover uplands, while native grasslands, hay fields, and pasture land are common in the low-lying valleys . Poultry feeding operations and intense sub-urbanization have become more prevalent and have negatively affected waterquality.Increasingbankerosionhasincreased gravel loads to streams and created braided systems, with unstable pool habitats and extensive sub-surface flow . Despite extensive riparian disturbance, habitat degradation, and increasing nutrient loads, ecological diversity remains high, with several species of fish distinctive to the Ozarks in Oklahoma, including the shadow bass and northern hogsucker . The main differences between the two ecoregions are greater forest density, more intense relief and dissection, and narrower valleys in the Dissected-Elk Hills . Representative Plateau streams include themiddleHoneyCreek,Neosho,Spring,and Elk Rivers . Grand and Hudson Lakes are representative Plateau lakes . Spring Creek exemplifies the Dissected-Elk Hills, as well as Eucha and Spavinaw Lakes and W . R . Holway Reservoir . Salinity is moderate in the Plateau with mean conductivity ranging from 200 (Spring River) to 545 μS/cm (Honey Creek), while lower in the Dissected-Elk Hills (Spring Creek = 154 μS/cm) . Lakes typically range from 170 to nearly 400 μS/cm . In streams, nutrient concentrations range from lows of TP = 0 .02 andTN=0.63ppmatSpringCreek,tohighsof0 .21 (Spring River TP) and 2 .86 ppm (Honey CreekTN).Trophicstatusinstreamsvariesfrom oligotrophic (Spring and Honey Creeks) tomesotrophic(NeoshoandElkRivers)toeutrophic (Spring River) . Lakes are typically phosphorus limited and on the high end of mesotrophic to nearly hyper-eutrophic . Stream clarity ranges from good (Spring River = 18 NTU)toexcellent,withturbiditymeanslessthan 3 at Elk River and Spring and Honey
The Oklahoma Conservation Commission (OCC) has begun a demonstration and education project on the Grand Lake watershed focused on educating citizens about reducing nonpoint source runoff. The OCC has also begun a watershed implementation project on Honey Creek as well as Spavinaw/Beaty Creek. These projects are intended to reduce the amount of bacteria, phosphorus, and sediment entering the streams and lake. These projects have indicated that this region could benefit from additional nonpoint source restoration programs. The Oklahoma Department of Environmental Quality has completed a TMDL study on Lytle Creek.
Water Quality Standards and ImplementationThe Oklahoma Water Quality Standards (OWQS) are the cornerstone of the state’s water quality management programs. The OWQS are a set of rules promulgated under the federal Clean Water Act and state statutes, designed to maintain and protect the quality of the state’s waters. The OWQS designate beneficial uses for streams, lakes, other bodies of surface water, and groundwater that has a mean concentration of Total Dissolved Solids (TDS) of 10,000 milligrams per liter or less. Beneficial uses are the activities for which a waterbody can be used based on physical, chemical, and biological characteristics as well as geographic setting, scenic quality, and economic considerations. Beneficial uses include categories such as Fish and Wildlife Propagation, Public and Private Water Supply, Primary (or Secondary) Body Contact Recreation, Agriculture, and Aesthetics.
The OWQS also contain standards for maintaining and protecting these uses. The purpose of the OWQS is to promote and protect as many beneficial uses as are attainable and to assure that degradation of existing quality of waters of the state does not occur.
The OWQS are applicable to all activities which may affect the water quality of waters of the state, and are to be utilized by all state environmental agencies in implementing their programs to protect water quality. Some examples of these implementation programs are permits for point source (e.g. municipal and industrial) discharges into waters of the state; authorizations for waste disposal from concentrated animal feeding operations; regulation of runoff from nonpoint sources; and corrective actions to clean up polluted waters.
More information about OWQS and the latest revisions can be found on the OWRB website.

14 Grand Regional Report Oklahoma Comprehensive Water Plan
Water Quality ImpairmentsGrand Region
Regional water quality impairments based on the 2008 Oklahoma Integrated Water Quality Assessment Report. Many surface waters in this region have impacts from eutrophication, particularly in water supply reservoirs.
Tar Creek Superfund SiteThe Tar Creek Superfund Site is a 40-square mile former lead and zinc mining area. Located in northeastern Oklahoma, the site is part of a larger area known as the Tri-State Mining District. This 2,500-square-mile District in parts of Missouri, Kansas, and Oklahoma once ranked as one of the world’s largest producers of lead and zinc. The Tar Creek site includes the five towns of Picher, Cardin, Quapaw, Commerce, and North Miami, as well as other areas within Ottawa County. A significant amount of land at the site is allotted Tribal Land.
Underground mining for lead and zinc by the room-and-pillar method began in 1891 and lasted through early 1970. As water filled the mines, the native sulfide minerals dissolved creating acid mine water. Acid mine drainage containing high concentrations of heavy metals began discharging into Tar Creek in 1979 from natural springs, boreholes, and open mine shafts. It is estimated that seventy six thousand (76,000) acre-feet of shallow ground water is contaminated, approximately 75 million tons of mining waste piles (known as “chat”) remain on the surface of the ground, and flotation ponds (wet or dry ponds containing mine tailings) cover approximately 800 acres. The chat contains heavy metal pollutants, such as lead, cadmium, and zinc.
The principal groundwater-bearing units within the Site are the Mississippian Boone Formation and the Cambro-Ordovician Roubidoux Formation. The headwaters of Tar Creek are located in Cherokee County, Kansas; the creek flows southward through the site and into the Grand River. Lytle Creek is a major tributary of Tar Creek. The headwaters of Beaver Creek are located north of Quapaw; the creek flows through the Quapaw powwow grounds and into the Spring River. Tar Creek and Beaver Creek are impacted by contaminated mine drainage, and the entire site is located within the watershed of Grand Lake. Water impairments include surface water degradation by the discharge of acid mine water, and the threat of contamination of the Roubidoux aquifer by downward migration of acid mine water from the overlying Boone aquifer through abandoned wells connecting the two.
Creeks . Lake clarity is excellent at many lakes, with mean Secchi depths from 100 (Spavinaw) to 160 cm (Holway) . Grand Lake Secchi depths vary from excellent (110 cm) near the dam to average (35 cm) on the upper end .
The Grand region is underlain by several majorandminorbedrockandalluvialaquifers.Although a statewide groundwater water qualityprogramdoesnotexistinOklahoma,variousaquiferstudieshavebeencompleted,and data are available from municipal authorities and other sources . Water from theNorthern,Middle,andLowerNeoshoRiveralluvialaquifersyieldwaterthatisgenerally hard, typically of a sodium/calcium bicarbonate type and in some areas exceeds drinkingwaterstandards.Alluvialaquifersare highly vulnerable to contamination from surface activities due to their high porosities and permeability and shallow water tables . However, alluvial water is generally suitable formostpurposes.Themajorbedrockaquiferof the region is the Roubidoux . Part of the Ozarkaquifer,theRoubidouxunderliesnearly two-thirds of the region . Water is hard but generally has low total mineral content . However, in the far western portion of the aquifer,concentrationsofchloride,sulfate,and fluoride exceed drinking water standards, and there is naturally occurring radioactivity in some areas . Large concentrations of gross-alpha radioactivity and radium-226 occur near the western edge and appear to be correlated

Grand Regional Report 15 Oklahoma Comprehensive Water Plan
Surface Waters with Designated Beneficial Use for Agriculture
Grand Region
Surface Waters with Designated Beneficial Use for Public/Private Water Supply
Grand Region
Water Quality ImpairmentsA waterbody is considered to be impaired when its quality does not meet the standards prescribed for its beneficial uses. For example, impairment of the Public and Private Water Supply beneficial use means the use of the waterbody as a drinking water supply is hindered. Impairment of the Agricultural use means the use of the waterbody for livestock watering, irrigation or other agricultural uses is hindered. Impairments can exist for other uses such as Fish and Wildlife Propagation or Recreation.
The Beneficial Use Monitoring Program (BUMP), established in 1998 to document and quantify impairments of assigned beneficial uses of the state’s lakes and streams, provides information for supporting and updating the OWQS and prioritizing pollution control programs. A set of rules known as “use support assessment protocols” is also used to determine whether beneficial uses of waterbodies are being supported.
In an individual waterbody, after impairments have been identified, a Total Maximum Daily Load (TMDL) study is conducted to establish the sources of impairments—whether from point sources (discharges) or non-point sources (runoff). The study will then determine the amount of reduction necessary to meet the applicable water quality standards in that waterbody and allocate loads among the various contributors of pollution.
For more detailed review of the state’s water quality conditions, see the most recent versions of the OWRB’s BUMP Report, and the Oklahoma Integrated Water Quality Assessment Report, a comprehensive assessment of water quality in Oklahoma’s streams and lakes required by the federal Clean Water Act and developed by the ODEQ.
withchlorideconcentrations.Theaquiferisaconfinedaquiferandisnotvulnerabletocontamination from surface activities . Water fromtheadjacentminorBooneFormationisofgoodquality,butduetoitslithology,theaquiferissusceptibletocontaminationfrom surface sources . Sinkholes and fractures provide direct conduits for precipitation and runoff to transport contaminants to the water
table . Lead and zinc ores were mined from the Boone Formation in northeastern Oklahoma, southeastern Kansas, and southwestern Missouri from about 1890 to 1970 . Water in the abandoned zinc and lead mines is contaminated with acid mine water .

16 Grand Regional Report Oklahoma Comprehensive Water Plan
Surface Water Protection AreasGrand Region
Special OWQS provisions are in place to protect surface waters covering most of this region. These protections should limit new pollutant discharges. When new water supplies are established Sensitive Water Supply protection should be considered.
Surface Water ProtectionThe Oklahoma Water Quality Standards (OWQS) provide protection for surface waters in many ways.
Appendix B Areas are designated in the OWQS as containing waters of recreational and/or ecological significance. Discharges to waterbodies may be limited in these areas.
Source Water Protection Areas are derived from the state’s Source Water Protection Program, which analyzes existing and potential threats to the quality of public drinking water in Oklahoma.
The High Quality Waters designation in the OWQS refers to waters that exhibit water quality exceeding levels necessary to support the propagation of fishes, shellfishes, wildlife, and recreation in and on the water. This designation prohibits any new point source discharges or additional load or increased concentration of specified pollutants.
The Sensitive Water Supplies (SWS) designation applies to public and private water supplies possessing conditions making them more susceptible to pollution events, thus requiring additional protection. This designation restricts point source discharges in the watershed and institutes a 10 µg/L (micrograms per liter) chlorophyll-a criterion to protect against taste and odor problems and reduce water treatment costs.
Outstanding Resource Waters are those constituting outstanding resources or of exceptional recreational and/or ecological significance. This designation prohibits any new point source discharges or additional load or increased concentration of specified pollutants.
Waters designated as Scenic Rivers in Appendix A of the OWQS are protected through restrictions on point source discharges in the watershed. A 0.037 mg/L total phosphorus criterion is applied to all Scenic Rivers in Oklahoma.
Nutrient-Limited Watersheds are those containing a waterbody with a designated beneficial use that is adversely affected by excess nutrients.

Grand Regional Report 17 Oklahoma Comprehensive Water Plan
Various types of protection are in place to prevent degradation of groundwater and address vulnerability. The Arkansas River alluvial aquifer has been identified as very highly vulnerable.
Groundwater Protection AreasGrand Region
Groundwater ProtectionThe Oklahoma Water Quality Standards (OWQS) sets the criteria for protection of groundwater quality as follows: “If the concentration found in the test sample exceeds [detection limit], or if other substances in the groundwater are found in concentrations greater than those found in background conditions, that groundwater shall be deemed to be polluted and corrective action may be required.”
Wellhead Protection Areas are established by the Oklahoma Department of Environmental Quality (ODEQ) to improve drinking water quality through the protection of groundwater supplies. The primary goal is to minimize the risk of pollution by limiting potential pollution-related activities on land around public water supplies.
Oil and Gas Production Special Requirement Areas, enacted to protect groundwater and/or surface water, can consist of specially lined drilling mud pits (to prevent leaks and spills) or tanks whose contents are removed upon completion of drilling activities; well set-back distances from streams and lakes; restrictions on fluids and chemicals; or other related protective measures.
Nutrient-Vulnerable Groundwater is a designation given to certain hydrogeologic basins that are designated by the OWRB as having high or very high vulnerability to contamination from surface sources of pollution. This designation can impact land application of manure for regulated agriculture facilities.
Class 1 Special Source Groundwaters are those of exceptional quality and particularly vulnerable to contamination. This classification includes groundwaters located underneath watersheds of Scenic Rivers, within OWQS Appendix B areas, or underneath wellhead or source water protection areas.
Appendix H Limited Areas of Groundwater are localized areas where quality is unsuitable for default beneficial uses due to natural conditions or irreversible human-induced pollution.
NOTE: The State of Oklahoma has conducted a successful surface water quality monitoring program for more than fifteen years. A new comprehensive groundwater quality monitoring program is in the implementation phase and will soon provide a comparable long-term groundwater resource data set.

18 Grand Regional Report Oklahoma Comprehensive Water Plan
Water Quality Trends StudyAs part of the 2012 OCWP Update, OWRB monitoring staff compiled more than ten years of Beneficial Use Monitoring Program (BUMP) data and other resources to initiate an ongoing statewide comprehensive analysis of surface water quality trends.
Reservoir Trends: Water quality trends for reservoirs were analyzed for chlorophyll-a, conductivity, total nitrogen, total phosphorus, and turbidity at sixty-five reservoirs across the state. Data sets were of various lengths, depending on the station’s period of record. The direction and magnitude of trends varies throughout the state and within regions. However, when considered statewide, the final trend analysis revealed several notable details.
•Chlorophyll-a and nutrient concentrations continue to increase at a number of lakes. The proportions of lakes exhibiting a significant upward trend were 42% for chlorophyll-a, 45% for total nitrogen, and 12% for total phosphorus.
•Likewise, conductivity and turbidity have trended upward over time. Nearly 28% of lakes show a significant upward trend in turbidity, while nearly 45% demonstrate a significant upward trend for conductivity.
Stream Trends: Water quality trends for streams were analyzed for conductivity, total nitrogen, total phosphorus, and turbidity at sixty river stations across the state. Data sets were of various lengths, depending on the station’s period of record, but generally, data were divided into historical and recent datasets and analyzed separately and as a whole. The direction and magnitude of trends varies throughout the state and within regions. However, when considered statewide, the final trend analysis revealed several notable details.
•Total nitrogen and phosphorus are very different when comparing period of record to more recent data. When considering the entire period of record, approximately 80% of stations showed a downward trend in nutrients. However, if only the most recent data (approximately 10 years) are considered, the percentage of stations with a downward trend decreases to 13% for nitrogen and 30% for phosphorus. The drop is accounted for in stations with either significant upward trends or no detectable trend.
•Likewise, general turbidity trends have changed over time. Over the entire period of record, approximately 60% of stations demonstrated a significant upward trend. However, more recently, that proportion has dropped to less than 10%.
•Similarly, general conductivity trends have changed over time, albeit less dramatically. Over the entire period of record, approximately 45% of stations demonstrated a significant upward trend. However, more recently, that proportion has dropped to less than 30%.
Typical Impact of Trends Study ParametersChlorophyll-a is a measure of algae growth. When algae growth increases, there is an increased likelihood of taste and odor problems in drinking water as well as aesthetic issues.
Conductivity is a measure of the ability of water to pass electrical current. In water, conductivity is affected by the presence of inorganic dissolved solids, such as chloride, nitrate, sulfate, and phosphate anions (ions that carry a negative charge) or sodium, magnesium, calcium, iron, and aluminum cations (ions that carry a positive charge). Conductivity in streams and rivers is heavily dependent upon regional geology and discharges. High specific conductance indicates high concentrations of dissolved solids, which can affect the suitability of water for domestic, industrial, agricultural, and other uses. At higher conductivity levels, drinking water may have an unpleasant taste or odor or may even cause gastrointestinal distress. High concentration may also cause deterioration of plumbing fixtures and appliances. Relatively expensive water treatment processes, such as reverse osmosis, are required to remove excessive dissolved solids from water. Concerning agriculture, most crops cannot survive if the salinity of the water is too high.
Total Nitrogen is a measure of all dissolved and suspended nitrogen in a water sample. It includes kjeldahl nitrogen (ammonia + organic), nitrate, and nitrite nitrogen. It is naturally abundant in the environment and is a key element necessary for growth of plants and animals. Excess nitrogen from polluting sources can lead to significant water quality problems, including harmful algal blooms, hypoxia, and declines in wildlife and habitat.
Total Phosphorus is one of the key elements necessary for growth of plants and animals. Excess phosphorus leads to significant water quality problems, including harmful algal blooms, hypoxia, and declines in wildlife and habitat. Increases in total phosphorus can lead to excessive growth of algae, which can increase taste and odor problems in drinking water as well as increased costs for treatment.
Turbidity refers to the clarity of water. The greater the amount of total suspended solids (TSS) in the water, the murkier it appears and the higher the measured turbidity. Increases in turbidity can increase treatment costs and have negative effects on aquatic communities by reducing light penetration.

Grand Regional Report 19 Oklahoma Comprehensive Water Plan
Stream Water Quality TrendsGrand Region
Parameter
Big Cabin Creek near Big Cabin Neosho (Grand) River near Chouteau Neosho (Grand) River near Commerce Neosho (Grand) River near Langley Spring River near Quapaw
All Data Trend (1998-2009)1
Recent Trend (1998-2009)
All Data Trend (1975-1993, 1998-2009)1
Recent Trend (1998-2009)
All Data Trend (1944-1993, 2000-2009)1
Recent Trend (2000-2009)
All Data Trend (1975-1993, 1998-2009)1
Recent Trend (1998-2009)
All Data Trend (1975-1993, 1998-2009)1
Recent Trend (1998-2009)
Conductivity (us/cm) NT NT NT NT NT NT
Total Nitrogen (mg/L) NT NT NT NT
Total Phosphorus (mg/L) NT NT NT NT NT NT
Turbidity (NTU) NT NT NT
Increasing Trend Decreasing Trend NT = No significant trend detected
Trend magnitude and statistical confidence levels vary for each site. Site-specific information can be obtained from the OWRB Water Quality Division.
1 Date ranges for analyzed data represent the earliest site visit date and may not be representative of all parameters.
Notable concerns for stream water quality include the following:
•Significant upward trend for period of record turbidity and total phosphorus on Neosho River.
•Significant upward trend for period of record turbidity on Spring River.
Reservoir Water Quality TrendsGrand Region
Parameter
Lake Eucha Fort Gibson Lake Grand Lake Spavinaw Lake
(1995-2009) (1991-2007) (1995-2009) (1996-2009)
Chlorophyll-a (mg/m3) NT NT
Conductivity (us/cm) NT NT
Total Nitrogen (mg/L) NT NT NT
Total Phosphorus (mg/L) NT NT
Turbidity (NTU) NT
Increasing Trend Decreasing Trend NT = No significant trend detected
Trend magnitude and statistical confidence levels vary for each site. Site-specific information can be obtained from the OWRB Water Quality Division.
Notable concerns for reservoir water quality include the following:
•Significant upward trends for both chlorophyll-a and total phosphorus on Fort Gibson and Spavinaw reservoirs.
•Significant upward trends for turbidity on Eucha and Spavinaw reservoirs.
20 Grand Regional Report Oklahoma Comprehensive Water Plan
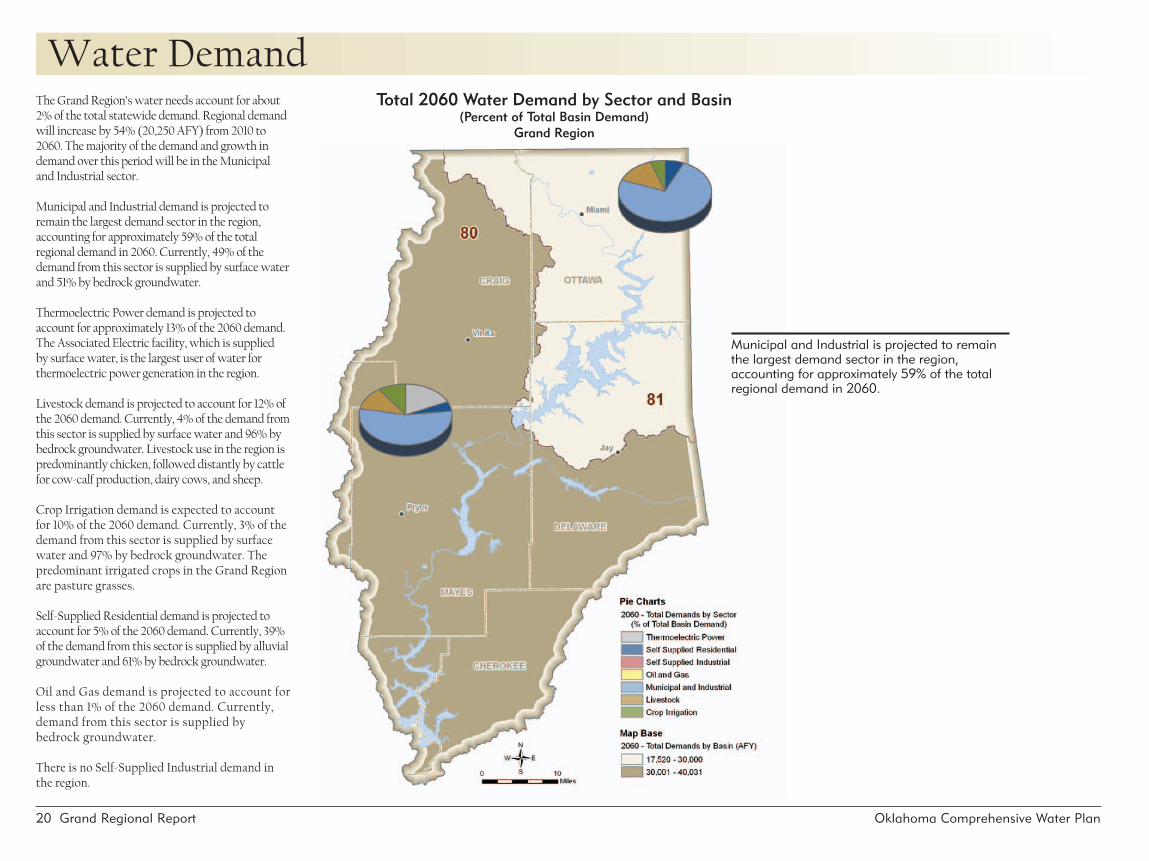
Total 2060 Water Demand by Sector and Basin (Percent of Total Basin Demand)
Grand Region
Municipal and Industrial is projected to remain the largest demand sector in the region, accounting for approximately 59% of the total regional demand in 2060.
Water Demand The Grand Region’s water needs account for about 2% of the total statewide demand . Regional demand will increase by 54% (20,250 AFY) from 2010 to 2060.Themajorityofthedemandandgrowthindemand over this period will be in the Municipal and Industrial sector .
MunicipalandIndustrialdemandisprojectedtoremain the largest demand sector in the region, accounting for approximately 59% of the total regional demand in 2060 . Currently, 49% of the demand from this sector is supplied by surface water and 51% by bedrock groundwater .
ThermoelectricPowerdemandisprojectedtoaccount for approximately 13% of the 2060 demand . The Associated Electric facility, which is supplied by surface water, is the largest user of water for thermoelectric power generation in the region .
Livestockdemandisprojectedtoaccountfor12%ofthe 2060 demand . Currently, 4% of the demand from this sector is supplied by surface water and 96% by bedrock groundwater . Livestock use in the region is predominantly chicken, followed distantly by cattle for cow-calf production, dairy cows, and sheep .
Crop Irrigation demand is expected to account for 10% of the 2060 demand . Currently, 3% of the demand from this sector is supplied by surface water and 97% by bedrock groundwater . The predominant irrigated crops in the Grand Region are pasture grasses .
Self-SuppliedResidentialdemandisprojectedtoaccount for 5% of the 2060 demand . Currently, 39% of the demand from this sector is supplied by alluvial groundwater and 61% by bedrock groundwater .
OilandGasdemandisprojectedtoaccountforless than 1% of the 2060 demand . Currently, demand from this sector is supplied by bedrock groundwater .
There is no Self-Supplied Industrial demand in the region .

Grand Regional Report 21 Oklahoma Comprehensive Water Plan
Supply Sources Used to MeetCurrent Demand (2010)
Grand Region
The Grand Region’s water needs account for about 2% of the total statewide demand. Regional demand will increase by 54% (20,250 AFY) from 2010 to 2060. The majority of the demand and growth in demand over this period will be in the Municipal and Industrial sector.
Total Water Demand by SectorGrand Region
Planning Horizon
Crop Irrigation Livestock
Municipal &
Industrial Oil & Gas
Self-Supplied Industrial
Self-Supplied
ResidentialThermoelectric
Power Total
AFY
2010 2,430 6,320 22,060 70 0 1,920 4,490 37,300
2020 3,110 6,400 24,270 100 0 2,150 5,010 41,040
2030 3,780 6,480 26,560 140 0 2,360 5,590 44,920
2040 4,460 6,560 28,930 190 0 2,590 6,240 48,970
2050 4,980 6,630 31,380 240 0 2,830 6,960 53,020
2060 5,810 6,710 33,890 290 0 3,080 7,760 57,550
Total Water Demand by Sector
Grand Region
Water DemandWater demand refers to the amount of water required to meet the needs of people, communities, industry, agriculture, and other users. Growth in water demand frequently corresponds to growth in population, agriculture, industry, or related economic activity. Demands have been projected from 2010 to 2060 in ten-year increments for seven distinct consumptive water demand sectors.
Water Demand Sectorsn Thermoelectric Power: Thermoelectric power producing plants, using both self-supplied water and
municipal-supplied water, are included in the thermoelectric power sector.
n Self-Supplied Residential: Households on private wells that are not connected to a public water supply system are included in the SSR sector.
n Self-Supplied Industrial: Demands from large industries that do not directly depend upon a public water supply system are included in the SSI sector. Water use data and employment counts were included in this sector, when available.
n Oil and Gas: Oil and gas drilling and exploration activities, excluding water used at oil and gas refineries (typically categorized as Self-Supplied Industrial users), are included in the oil and gas sector.
n Municipal and Industrial: These demands represent water that is provided by public water systems to homes, businesses, and industries throughout Oklahoma, excluding water supplied to thermoelectric power plants.
n Livestock: Livestock demands were evaluated by livestock group (beef, poultry, etc.) based on the 2007 Agriculture Census.
n Crop Irrigation: Water demands for crop irrigation were estimated using the 2007 Agriculture Census data for irrigated acres by crop type and county. Crop irrigation requirements were obtained primarily from the Natural Resource Conservation Service Irrigation Guide Reports.
OCWP demands were not projected for non-consumptive or instream water uses, such as hydroelectric power generation, fish and wildlife, recreation and instream flow maintenance. Projections, which were augmented through user/stakeholder input, are based on standard methods using data specific to each sector and OCWP planning basin.
Projections were initially developed for each county in the state, then allocated to each of the 82 basins. To provide regional context, demands were aggregated by Watershed Planning Region. Water shortages were calculated at the basin level to more accurately determine areas where shortages may occur. Therefore, gaps, depletions, and options are presented in detail in the Basin Summaries and subsequent sections. Future demand projections were developed independent of available supply, water quality, or infrastructure considerations. The impacts of climate change, increased water use efficiency, conservation, and non-consumptive uses, such as hydropower, are presented in supplemental OCWP reports.
Present and future demands were applied to supply source categories to facilitate an evaluation of potential surface water gaps and alluvial and bedrock aquifer storage depletions at the basin level. For this baseline analysis, the proportion of each supply source used to meet future demands for each sector was held constant at the proportion established through current, active water use permit allocations. For example, if the crop irrigation sector in a basin currently uses 80% bedrock groundwater, then 80% of the projected future crop irrigation demand is assumed to use bedrock groundwater. Existing out-of-basin supplies are represented as surface water supplies in the receiving basin.
22 Grand Regional Report Oklahoma Comprehensive Water Plan
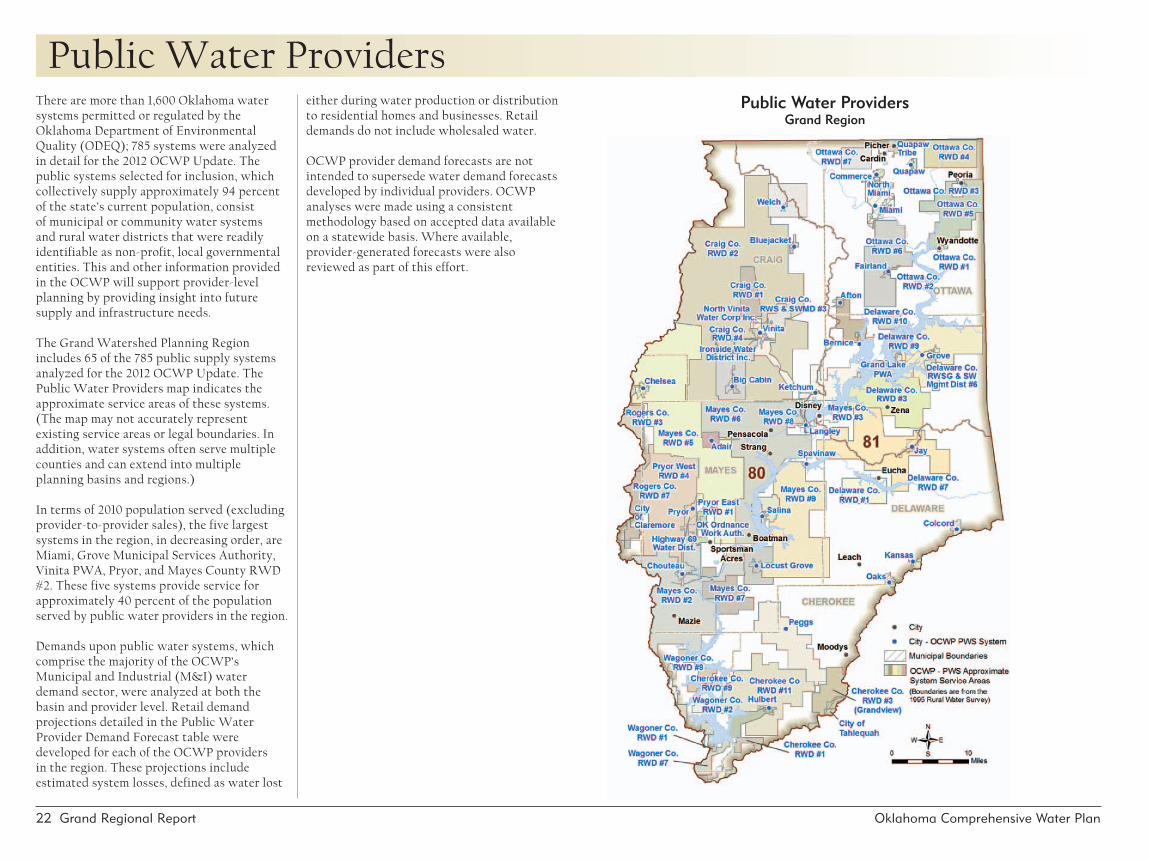
Public Water ProvidersGrand Region
There are more than 1,600 Oklahoma water systems permitted or regulated by the Oklahoma Department of Environmental Quality (ODEQ); 785 systems were analyzed in detail for the 2012 OCWP Update . The public systems selected for inclusion, which collectively supply approximately 94 percent of the state’s current population, consist of municipal or community water systems and rural water districts that were readily identifiable as non-profit, local governmental entities . This and other information provided in the OCWP will support provider-level planning by providing insight into future supply and infrastructure needs .
The Grand Watershed Planning Region includes 65 of the 785 public supply systems analyzed for the 2012 OCWP Update . The Public Water Providers map indicates the approximate service areas of these systems . (The map may not accurately represent existing service areas or legal boundaries . In addition, water systems often serve multiple counties and can extend into multiple planning basins and regions .)
In terms of 2010 population served (excluding provider-to-provider sales), the five largest systems in the region, in decreasing order, are Miami, Grove Municipal Services Authority, Vinita PWA, Pryor, and Mayes County RWD #2 . These five systems provide service for approximately 40 percent of the population served by public water providers in the region .
Demands upon public water systems, which comprisethemajorityoftheOCWP’sMunicipal and Industrial (M&I) water demand sector, were analyzed at both the basin and provider level . Retail demand projectionsdetailedinthePublicWaterProvider Demand Forecast table were developed for each of the OCWP providers intheregion.Theseprojectionsincludeestimated system losses, defined as water lost
either during water production or distribution to residential homes and businesses . Retail demands do not include wholesaled water .
OCWP provider demand forecasts are not intended to supersede water demand forecasts developed by individual providers . OCWP analyses were made using a consistent methodology based on accepted data available on a statewide basis . Where available, provider-generated forecasts were also reviewed as part of this effort .
Public Water Providers

Grand Regional Report 23 Oklahoma Comprehensive Water Plan
Public Water Providers/Retail Population Served (1 of 2)Grand Region
Provider SDWIS ID1 County
Retail Per Capita (GPD)2
Population Served
2010 2020 2030 2040 2050 2060
ADAIR OK1021613 Mayes 107 721 796 861 936 1,011 1,086
AFTON PWA OK1021696 Ottawa 98 1,422 1,518 1,602 1,699 1,807 1,916
BERNICE OK2002166 Delaware 70 2,606 3,004 3,357 3,754 4,152 4,594
BIG CABIN PWA OK3001805 Craig 215 318 358 388 427 457 497
BLUE JACKET PWA OK2001802 Craig 131 280 317 345 382 410 447
CHELSEA ECONOMIC DEV AUTH OK1021504 Rogers 211 2,597 2,918 3,197 3,455 3,712 3,991
CHEROKEE CO RWD #9 OK1021733 Cherokee 50 157 181 204 228 250 274
CHEROKEE CO RWD #11 OK1221637 Cherokee 109 3,507 4,029 4,543 5,066 5,573 6,095
CHOUTEAU OK3004615 Mayes 120 1,987 2,184 2,372 2,568 2,775 2,981
COLCORD PWA OK2002157 Delaware 82 856 981 1,106 1,231 1,374 1,517
COMMERCE OK2005810 Ottawa 80 3,704 3,957 4,210 4,477 4,757 5,023
CRAIG CO RWD #1 OK3001801 Craig 128 325 360 393 430 468 507
CRAIG CO RWD #2 OK3001802 Craig 101 4,070 4,510 4,930 5,396 5,868 6,361
CRAIG CO RWD #4 OK3001803 Craig 65 95 105 115 126 137 148
CRAIG CO RWS & SWMD #3 OK2001807 Craig 154 529 586 640 701 762 826
DELAWARE CO RWD #1 OK3002134 Delaware 224 94 108 122 136 151 167
DELAWARE CO RWD #3 OK1221615 Delaware 50 683 786 885 987 1,097 1,212
DELAWARE CO RWD #7 OK3002138 Delaware 87 419 481 542 605 672 743
DELAWARE CO RWD #10 OK6002158 Delaware 164 1,465 1,685 1,897 2,116 2,353 2,599
DELAWARE CO RWD #9 OK3002144 Delaware 63 879 1,011 1,138 1,270 1,412 1,560
DELAWARE RWSG & SW MGMT DIST #6 OK3002137 Delaware 55 452 520 585 653 726 802
FAIRLAND OK2005809 Ottawa 100 1,042 1,110 1,177 1,255 1,332 1,409
GRAND LAKE PWA OK1021691 Delaware 219 1,988 2,286 2,575 2,872 3,193 3,528
GROVE MUNICIPAL SERVICES AUTH. OK1021614 Delaware 214 11,517 13,242 14,909 16,634 18,493 20,429
HIGHWAY 69 WATER DIST OK3004610 Mayes 232 103 113 123 133 144 155
HULBERT PWA OK1021620 Cherokee 77 1,360 1,572 1,763 1,976 2,167 2,358
IRONSIDE WATER DIST INC OK3001804 Craig 148 309 343 374 410 446 483
JAY OK1021674 Delaware 403 2,600 2,984 3,359 3,744 4,163 4,601
KANSAS PWA OK2002135 Delaware 153 717 825 932 1,040 1,157 1,273
KETCHUM PWA OK1021612 Craig 179 4,046 4,425 4,804 5,310 5,689 6,195
KETCHUM PWA DELAWARE CO SYSTEM OK1221638 Delaware 348 2,099 2,414 2,718 3,033 3,371 3,725
LANGLEY OK1021604 Mayes 186 1,284 1,424 1,547 1,671 1,811 1,952
LOCUST GROVE OK1021668 Mayes 93 1,646 1,811 1,964 2,129 2,294 2,469
MAYES CO RWD #2 OK3004608 Mayes 146 7,721 8,490 9,223 9,992 10,781 11,589
MAYES CO RWD #3 OK1021640 Mayes 62 2,471 2,717 2,951 3,198 3,450 3,708
MAYES CO RWD #4 OK3004617 Mayes 176 4,220 4,642 5,042 5,464 5,895 6,334
MAYES CO RWD #5 OK3004616 Mayes 92 3,346 3,679 3,996 4,330 4,672 5,022
MAYES CO RWD #6 OK1021666 Mayes 124 4,303 4,732 5,140 5,569 6,009 6,459
Population and Demand Projection DataProvider level population and demand projection data, developed specifically for OCWP analyses, focus on retail customers for whom the system provides direct service. These estimates were generated from Oklahoma Department of Commerce population projections. In addition, the 2008 OCWP Provider Survey contributed critical information on water production and population served that was used to calculate per capita water use. Population for 2010 was estimated and may not reflect actual 2010 Census values. Exceptions to this methodology are noted.

24 Grand Regional Report Oklahoma Comprehensive Water Plan
Public Water Providers/Retail Population Served (2 of 2)Grand Region
Provider SDWIS ID1 County
Retail Per Capita (GPD)2
Population Served
2010 2020 2030 2040 2050 2060
MAYES CO RWD #7 OK3004627 Mayes 92 438 481 523 566 611 657
MAYES CO RWD #8 OK3004637 Mayes 50 463 509 553 600 647 695
MAYES CO RWD #9 OK1021678 Mayes 86 2,265 2,491 2,705 2,931 3,162 3,399
MIAMI OK2005813 Ottawa 130 13,914 14,870 15,788 16,782 17,825 18,858
NORTH MIAMI OK3005801 Ottawa 61 445 474 503 532 570 599
NORTH VINITA WATER COOP INC OK3001806 Craig 133 142 158 172 189 205 222
OAKS WATER WORKS INC OK2002159 Delaware 78 429 496 553 620 687 753
OKLAHOMA ORDNANCE WORKS AUTH OK1021602 Mayes 135 3,900 4,289 4,659 5,048 5,447 5,855
OTTAWA CO RWD #1 OK2005805 Ottawa 70 465 497 528 561 596 630
OTTAWA CO RWD #2 OK2005804 Ottawa 133 711 760 806 857 910 963
OTTAWA CO RWD #3 OK2005806 Ottawa 107 162 173 183 195 207 219
OTTAWA CO RWD #4 OK2005801 Ottawa 112 662 708 751 799 848 897
OTTAWA CO RWD #5 OK2005840 Ottawa 153 762 814 864 919 975 1,032
OTTAWA CO RWD #6 OK2005859 Ottawa 108 407 435 462 491 522 552
OTTAWA CO RWD #7 OK2005860 Ottawa 80 508 543 576 612 650 688
PEGGS WATER COMPANY OK1221630 Cherokee 85 2,021 2,322 2,619 2,920 3,212 3,513
PRYOR OK3004611 Mayes 149 8,954 9,847 10,697 11,589 12,504 13,441
PRYOR EAST RWD #1 OK3004609 Mayes 55 129 141 154 167 180 193
QUAPAW OK2005811 Ottawa 159 1,012 1,081 1,147 1,220 1,295 1,371
QUAPAW TRIBE OK2005812 Ottawa 77 1,933 2,064 2,190 2,326; 2,467 2,624
SALINA PWA OK1021603 Mayes 177 1,461 1,611 1,742 1,892 2,033 2,192
SPAVINAW OK1021616 Mayes 69 580 636 692 748 814 870
VINITA PWA OK1021611 Craig 181 11,491 12,747 13,938 15,257 16,593 17,977
WAGONER CO RWD #1 OK1021650 Wagoner 100 414 463 503 540 576 614
WAGONER CO RWD #2 OK1021643 Wagoner 70 2,072 2,314 2,515 2,700 2,881 3,072
WAGONER CO RWD #9 OK1021527 Wagoner 110 3,927 4,386 4,766 5,116 5,460 5,822
WELCH PWA OK2001801 Craig 87 1,285 1,421 1,558 1,713 1,850 2,005
1 SDWIS - Safe Drinking Water Information System2 RED ENTRY indicates data were taken from 2007 OWRB Water Rights Database. GPD=gallons per day.

Grand Regional Report 25 Oklahoma Comprehensive Water Plan
Provider SDWIS ID1 County
Demand
2010 2020 2030 2040 2050 2060
AFY
ADAIR OK1021613 Mayes 86 95 103 112 121 130
AFTON PWA OK1021696 Ottawa 156 166 176 186 198 210
BERNICE OK2002166 Delaware 204 236 263 294 326 360
BIG CABIN PWA OK3001805 Craig 76 86 93 103 110 120
BLUE JACKET PWA OK2001802 Craig 41 47 51 56 60 66
CHELSEA ECONOMIC DEV AUTH OK1021504 Rogers 613 689 755 816 877 942
CHEROKEE CO RWD #9 OK1021733 Cherokee 9 10 11 13 14 15
CHEROKEE CO RWD #11 OK1221637 Cherokee 429 493 556 620 682 746
CHOUTEAU OK3004615 Mayes 266 292 317 344 371 399
COLCORD PWA OK2002157 Delaware 79 90 102 113 126 139
COMMERCE OK2005810 Ottawa 331 353 376 400 425 448
CRAIG CO RWD #1 OK3001801 Craig 47 52 56 62 67 73
CRAIG CO RWD #2 OK3001802 Craig 462 512 559 612 666 722
CRAIG CO RWD #4 OK3001803 Craig 7 8 8 9 10 11
CRAIG CO RWS & SWMD #3 OK2001807 Craig 91 101 110 121 131 143
DELAWARE CO RWD #1 OK3002134 Delaware 24 27 31 34 38 42
DELAWARE CO RWD #3 OK1221615 Delaware 38 44 50 55 61 68
DELAWARE RWSG & SW MGMT DIST #6 OK3002137 Delaware 28 32 36 40 45 49
DELAWARE CO RWD #7 OK3002138 Delaware 41 47 53 59 66 72
DELAWARE CO RWD #9 OK3002144 Delaware 62 71 80 90 100 110
DELAWARE CO RWD #10 OK6002158 Delaware 269 309 349 389 432 478
FAIRLAND OK2005809 Ottawa 117 124 132 141 149 158
GRAND LAKE PWA OK1021691 Delaware 488 561 632 705 783 865
GROVE MUNICIPAL SERVICES AUTH OK1021614 Delaware 2,756 3,169 3,568 3,981 4,425 4,889
HIGHWAY 69 WATER DIST OK3004610 Mayes 27 29 32 35 37 40
HULBERT PWA OK1021620 Cherokee 118 136 152 171 187 204
IRONSIDE WATER DIST INC OK3001804 Craig 51 57 62 68 74 80
JAY OK1021674 Delaware 1,173 1,347 1,516 1,689 1,879 2,077
KANSAS PWA OK2002135 Delaware 123 142 160 179 199 219
KETCHUM PWA OK1021612 Craig 812 888 965 1,066 1,142 1,244
KETCHUM PWA DELAWARE CO SYSTEM OK1221638 Delaware 818 941 1,060 1,182 1,314 1,452
LANGLEY OK1021604 Mayes 267 297 322 348 377 407
LOCUST GROVE OK1021668 Mayes 171 188 204 221 238 256
Public Water Provider Demand Forecast (1 of 2)Grand Region
Projections of Retail Water DemandEach public water supply system has a “retail” demand, defined as the amount of water used by residential and non-residential customers within that provider’s service area. Public-supplied residential demand includes water provided to households for domestic uses both inside and outside the home. Non-residential demand includes customer uses at office buildings, shopping centers, industrial parks, schools, churches, hotels, and related locations served by a public water supply system. Retail demand doesn’t include wholesale water to other providers.
Municipal and Industrial (M&I) demand is driven by projected population growth and specific customer characteristics. Demand forecasts for each public system are estimated from average water use (in gallons per capita per day) multiplied by projected population. Oklahoma Department of Commerce 2002 population projections (unpublished special tabulation for the OWRB) were calibrated to 2007 Census estimates and used to establish population growth rates for cities, towns, and rural areas through 2060. Population growth rates were applied to 2007 population-served values for each provider to project future years’ service area (retail) populations.
The main source of data for per capita water use for each provider was the 2008 OCWP Provider Survey conducted by the OWRB in cooperation with the Oklahoma Rural Water Association and Oklahoma Municipal League. For each responding provider, data from the survey included population served, annual average daily demand, total water produced, wholesale purchases and sales between providers, and estimated system losses.
For missing or incomplete data, the weighted average per capita demand was used for the provider’s county. In some cases, provider survey data were supplemented with data from the OWRB water rights database. Per capita supplier demands can vary over time due to precipitation and service area characteristics, such as commercial and industrial activity, tourism, or conservation measures. For the baseline demand projections described here, the per capita demand was held constant through each of the future planning year scenarios. OCWP estimates of potential reductions in demand from conservation measures are analyzed on a basin and regional level, but not for individual provider systems.

26 Grand Regional Report Oklahoma Comprehensive Water Plan
Public Water Provider Demand Forecast (2 of 2)Grand Region
Provider SDWIS ID1 County
Demand
2010 2020 2030 2040 2050 2060
AFY
MAYES CO RWD #2 OK3004608 Mayes 1,264 1,390 1,510 1,636 1,765 1,897
MAYES CO RWD #3 OK1021640 Mayes 170 187 204 221 238 256
MAYES CO RWD #4 OK3004617 Mayes 831 914 993 1,076 1,161 1,248
MAYES CO RWD #5 OK3004616 Mayes 346 380 413 448 483 519
MAYES CO RWD #6 OK1021666 Mayes 596 656 712 772 832 895
MAYES CO RWD #7 OK3004627 Mayes 45 50 54 58 63 68
MAYES CO RWD #8 OK3004637 Mayes 26 28 31 33 36 39
MAYES CO RWD #9 OK1021678 Mayes 219 241 262 284 306 329
MIAMI OK2005813 Ottawa 2,026 2,165 2,299 2,444 2,596 2,746
NORTH MIAMI OK3005801 Ottawa 30 32 34 36 39 41
NORTH VINITA WATER COOP INC OK3001806 Craig 21 23 26 28 31 33
OAKS WATER WORKS INC OK2002159 Delaware 37 43 48 54 60 66
OKLAHOMA ORDNANCE WORKS AUTH OK1021602 Mayes 592 651 707 766 827 889
OTTAWA CO RWD #1 OK2005805 Ottawa 36 39 41 44 47 49
OTTAWA CO RWD #2 OK2005804 Ottawa 106 113 120 128 136 144
OTTAWA CO RWD #3 OK2005806 Ottawa 19 21 22 23 25 26
OTTAWA CO RWD #4 OK2005801 Ottawa 83 89 94 100 106 113
OTTAWA CO RWD #5 OK2005840 Ottawa 131 139 148 157 167 177
OTTAWA CO RWD #6 OK2005859 Ottawa 49 53 56 59 63 67
OTTAWA CO RWD #7 OK2005860 Ottawa 46 49 52 55 58 62
PEGGS WATER COMPANY OK1221630 Cherokee 192 220 248 277 305 333
PRYOR OK3004611 Mayes 1,499 1,648 1,790 1,940 2,093 2,250
PRYOR EAST RWD #1 OK3004609 Mayes 8 9 9 10 11 12
QUAPAW OK2005811 Ottawa 180 193 204 217 231 244
QUAPAW TRIBE OK2005812 Ottawa 167 178 189 201 213 227
SALINA PWA OK1021603 Mayes 290 320 346 376 404 435
SPAVINAW OK1021616 Mayes 44 49 53 57 62 67
VINITA PWA OK1021611 Craig 2,335 2,590 2,832 3,101 3,372 3,653
WAGONER CO RWD #1 OK1021650 Wagoner 46 52 56 60 65 69
WAGONER CO RWD #2 OK1021643 Wagoner 162 181 197 212 226 241
WAGONER CO RWD #9 OK1021527 Wagoner 483 539 586 629 671 716
WELCH PWA OK2001801 Craig 126 139 152 167 181 196
1 SDWIS - Safe Drinking Water Information System

Grand Regional Report 27 Oklahoma Comprehensive Water Plan
Provider SDWIS ID1
Sales Purchases
Sells To
Emergencyor
Ongoing
Treated or Raw or Both Purchases from
Emergency or
Ongoing
Treated or Raw or Both
AFTON PWA OK1021696 Bernice E T Bernice E T
BERNICE OK2002166 Afton PWA E T Afton PWA E T
BIG CABIN PWA OK3001805 Vinita PWA O T
CHELSEA ECONOMIC DEV AUTH OK1021504 Consolidated RWD #1 Nowata & Rogers CoMayes Co RWD #5
O E
TT
CHEROKEE CO RWD #11 OK1221637 Hulbert PWA E T Tahlequah PWA O T
CHOUTEAU OK3004615 Oklahoma Ordnance Works Auth
O T
CRAIG CO RWD #1 OK3001801 Vinita PWA O T
CRAIG CO RWD #2 OK3001802 Vinita PWAKetchum PWA
OO
TT
CRAIG CO RWD #4 OK3001803 Ironside Water Dist Inc
DELAWARE CO RWD #1 OK3002134 Jay O T
DELAWARE RWSG & SW MGMT DIST #6 OK3002137 Grove Municipal Services Auth O T
DELAWARE CO RWD #7 OK3002138 Ketchum PWA O T
DELAWARE CO RWD #9 OK3002144 Grove Municipal Services Auth O T
GROVE MUNICIPAL SERVICES AUTH OK1021614 Delaware Co RWD #9Delaware Co RWD #6
OO
TT
HIGHWAY 69 WATER DIST OK3004610 Pryor O T
HULBERT PWA OK1021620 Cherokee Co RWD #11 E T
IRONSIDE WATER DIST INC OK3001804 Craig Co RWD #4 Vinita PWA O T
JAY OK1021674 Delaware Co RWD #1 O T Tulsa (Lake Eucha) O R
KETCHUM PWA OK1021612 Delaware Co RWD 7Craig Co RWD 2
OO
TT
Langley E T
KETCHUM PWA DELAWARE CO SYSTEM
OK1221638 Delaware Co RWD #7Craig Co RWD #2
OO
TT
Langley E T
LANGLEY OK1021604 Mayes Co RWD #8Ketchum PWA Delaware Co SystemKetchum PWA
OEE
TTT
Ketchum PWA E T
LOCUST GROVE OK1021668 Mayes Co RWD #9 O T
MAYES CO RWD #2 OK3004608 Inola Water Works IncRogers Co RWD #6
O T Oklahoma Ordnance Works Auth
O T
MAYES CO RWD #4 OK3004617 Rogers Co RWD #7Mayes Co RWD #5
OO
TT
Oklahoma Ordnance Works Auth
O T
Wholesale Water Transfers (1 of 2)Grand Region
Wholesale Water TransfersSome providers sell water on a “wholesale” basis to other providers, effectively increasing the amount of water that the selling provider must deliver and reducing the amount that the purchasing provider diverts from surface and groundwater sources. Wholesale water transfers between public water providers are fairly common and can provide an economical way to meet demand. Wholesale quantities typically vary from year to year depending upon growth, precipitation, emergency conditions, and agreements between systems.
Water transfers between providers can help alleviate costs associated with developing or maintaining infrastructure, such as a reservoir or pipeline; allow access to higher quality or more reliable sources; or provide additional supplies only when required, such as in cases of supply emergencies. Utilizing the 2008 OCWP Provider Survey and OWRB water rights data, the Wholesale Water Transfers table presents a summary of known wholesale arrangements for providers in the region. Transfers can consist of treated or raw water and can occur on a regular basis or only during emergencies. Providers commonly sell to and purchase from multiple water providers.

28 Grand Regional Report Oklahoma Comprehensive Water Plan
Provider SDWIS ID1
Sales Purchases
Sells To
Emergencyor
Ongoing
Treated or Raw or Both Purchases from
Emergency or
Ongoing
Treated or Raw or Both
MAYES CO RWD #5 OK3004616 Mayes Co RWD #4Pryor West RWD #4Oklahoma Ordnance
Works AuthorityChelsea Economic Dev Auth
OO
E
TTT
MAYES CO RWD #7 OK3004627 Oklahoma Ordnance Works Auth
O T
MAYES CO RWD #8 OK3004637 LangleyMayes Co RWD #6
O T
MAYES CO RWD #9 OK1021678 Locust Grove O T
MIAMI OK2005813 North Miami T
NORTH MIAMI OK3005801 Miami T
NORTH VINITA WATER COOP INC OK3001806 Vinita PWA T
OKLAHOMA ORDNANCE WORKS AUTH
OK1021602 Broken Arrow WTPPryorChouteauMayes Co RWD #2Mayes Co RWD #4Mayes Co RWD #5Mayes Co RWD #7
OOOOOOO
TTTTTTT
PRYOR OK3004611 Highway 69 Water DistPryor East RWD #1
OO
TT
Oklahoma Ordnance Works Auth
O T
PRYOR EAST RWD #1 OK3004609 Pryor O T
VINITA PWA OK1021611 Big Cabin PWACraig Co RWD #2Craig Co RWD #1Ironside Water Dist IncNorth Vinita Water Co-op Inc
OO
TTTTT
1 SDWIS - Safe Drinking Water Information System
Wholesale Water Transfers (2 of 2)Grand Region

Grand Regional Report 29 Oklahoma Comprehensive Water Plan
Provider SDWIS ID1 County
Permitted Quantity
Source
Permitted Surface Water
Permitted Alluvial Groundwater
Permitted Bedrock Groundwater
AFY Percent
ADAIR OK1021613 Mayes --- --- --- ---
ADAIR CO RWS & SWMD #6 OK2000145 Adair --- --- --- ---
AFTON PWA OK1021696 Ottawa --- --- --- ---
BERNICE OK2002166 Delaware 146 0% 0% 100%
BIG CABIN PWA OK3001805 Craig --- --- --- ---
BLUE JACKET PWA OK2001802 Craig 70 0% 0% 100%
CHELSEA ECONOMIC DEV AUTH OK1021504 Rogers 1094 100% 0% 0%
CHEROKEE CO RWD #2 (KEYS) OK1021711 Cherokee 329 100% 0% 0%
CHEROKEE CO RWD #9 OK1021733 Cherokee --- --- --- ---
CHEROKEE CO RWD #11 OK1221637 Cherokee --- --- --- ---
CHOUTEAU OK3004615 Mayes --- --- --- ---
COLCORD PWA OK2002157 Delaware 320 0% 0% 100%
COMMERCE OK2005810 Ottawa 1170 --- --- 100
CRAIG CO RWD #1 OK3001801 Craig --- --- --- ---
CRAIG CO RWD #2 OK3001802 Craig 140 0% 0% 100%
CRAIG CO RWS & SWMD #3 OK2001807 Craig 620 0% 0% 100%
CRAIG CO RWD #4 OK3001803 Craig --- --- --- ---
DELAWARE CO RWD #1 OK3002134 Delaware 200 0% 0% 100%
DELAWARE CO RWD #3 OK1221615 Delaware --- --- --- ---
DELAWARE RWSG & SW MGMT DIST #6 OK3002137 Delaware --- --- --- ---
DELAWARE CO RWD #7 OK3002138 Delaware --- --- --- ---
DELAWARE CO RWD #9 OK3002144 Delaware --- --- --- ---
DELAWARE CO RWD #10 OK6002158 Delaware 169 --- --- 100
FAIRLAND OK2005809 Ottawa 81 0% 0% 100%
GRAND LAKE PWA OK1021691 Delaware --- --- --- ---
GROVE MUNICIPAL SERVICES AUTH OK1021614 Delaware --- --- --- ---
HIGHWAY 69 WATER DIST OK3004610 Mayes --- --- --- ---
HULBERT PWA OK1021620 Cherokee --- --- --- ---
IRONSIDE WATER DIST INC OK3001804 Craig --- --- --- ---
JAY OK1021674 Delaware --- --- --- ---
KANSAS PUBLIC WORKS AUTH OK2002135 Delaware 179 0% 0% 100%
KETCHUM PWA OK1021612 Craig --- --- --- ---
KETCHUM PWA DELAWARE CO SYSTEM OK1221638 Delaware --- --- --- ---
LANGLEY OK1021604 Mayes --- --- --- ---
LOCUST GROVE OK1021668 Mayes --- --- --- ---
MAYES CO RWD #2 OK3004608 Mayes --- --- --- ---
Public Water Provider Water Rights and Withdrawals - 2010 (1 of 2)Grand Region
Provider Water RightsPublic water providers using surface water or groundwater obtain water rights from the OWRB. Water providers purchasing water from other suppliers or sources are not required to obtain water rights as long as the furnishing entity has the appropriate water right or other source of authority. Each public water provider’s current water right(s) and source of supply have been summarized in this report. The percentage of each provider’s total 2007 water rights from surface water, alluvial groundwater, and bedrock groundwater supplies was also calculated, indicating the relative proportions of sources available to each provider.
A comparison of existing water rights to projected demands can show when additional water rights or other sources and in what amounts might be needed. Forecasts of conditions for the year 2060 indicate where additional water rights may be needed to satisfy demands by that time. However, in most cases, wholesale water transfers to other providers must also be addressed by the selling provider’s water rights. Thus, the amount of water rights required will exceed the retail demand for a selling provider and will be less than the retail demand for a purchasing provider.
In preparing to meet long-term needs, public water providers should consider strategic factors appropriate to their sources of water. For example, public water providers who use surface water can seek and obtain a “schedule of use” as part of their stream water right, which addresses projected growth and consequent increases in stream water use. Such schedules of use can be employed to address increases that are anticipated to occur over many years or even decades, as an alternative to the usual requirement to use the full authorized amount of stream water in a seven-year period. On the other hand, public water providers that utilize groundwater should consider the prospect that it may be necessary to purchase or lease additional land in order to increase their groundwater rights.

30 Grand Regional Report Oklahoma Comprehensive Water Plan
Public Water Provider Water Rights and Withdrawals - 2010 (2 of 2)Grand Region
Provider SDWIS ID1 County
Permitted Quantity
Source
Permitted Surface Water
Permitted Alluvial Groundwater
Permitted Bedrock Groundwater
AFY Percent
MAYES CO RWD #3 OK1021640 Mayes 262 --- --- 100
MAYES CO RWD #4 OK3004617 Mayes --- --- --- ---
MAYES CO RWD #5 OK3004616 Mayes --- --- --- ---
MAYES CO RWD #6 OK1021666 Mayes --- --- --- ---
MAYES CO RWD #7 OK3004627 Mayes --- --- --- ---
MAYES CO RWD #8 OK3004637 Mayes --- --- --- ---
MAYES CO RWD #9 OK1021678 Mayes --- --- --- ---
MIAMI OK2005813 Ottawa 5,336.4 0% 0% 100%
NORTH MIAMI OK3005801 Ottawa --- --- --- ---
NORTH VINITA WATER COOP INC OK3001806 Craig --- --- --- ---
OAKS WATER WORKS INC OK2002159 Delaware --- --- --- ---
OKLAHOMA ORDNANCE WORKS AUTH OK1021602 Mayes --- --- --- ---
OTTAWA CO RWD #1 OK2005805 Ottawa 322 0% 0% 100%
OTTAWA CO RWD #2 OK2005804 Ottawa 502 0% 0% 100%
OTTAWA CO RWD #3 OK2005806 Ottawa 322 0% 0% 100%
OTTAWA CO RWD #4 OK2005801 Ottawa 769.8 0% 0% 100%
OTTAWA CO RWD #5 OK2005840 Ottawa 50 0% 0% 100%
OTTAWA CO RWD #6 OK2005859 Ottawa 640 0% 0% 100%
OTTAWA CO RWD #7 OK2005860 Ottawa 320 0% 0% 100%
PEGGS WATER COMPANY OK1221630 Cherokee --- --- --- ---
PRYOR OK3004611 Mayes 2,382 100% 0% 0%
PRYOR EAST RWD #1 OK3004609 Mayes --- --- --- ---
QUAPAW OK2005811 Ottawa 2,368 0% 0% 100%
QUAPAW TRIBE OK2005812 Ottawa 1,225 --- --- 100%
SALINA PWA OK1021603 Mayes --- --- --- ---
VINITA PWA OK1021611 Craig 3,620 100% 0% 0%
SPAVINAW OK1021616 Mayes --- --- --- ---
WAGONER CO RWD #1 OK1021650 Wagoner --- --- --- ---
WAGONER CO RWD #2 OK1021643 Wagoner --- --- --- ---
WAGONER CO RWD #9 OK1021527 Wagoner --- --- --- ---
WELCH PWA OK2001801 Craig 78 0% 0% 100%
1 SDWIS - Safe Drinking Water Information System
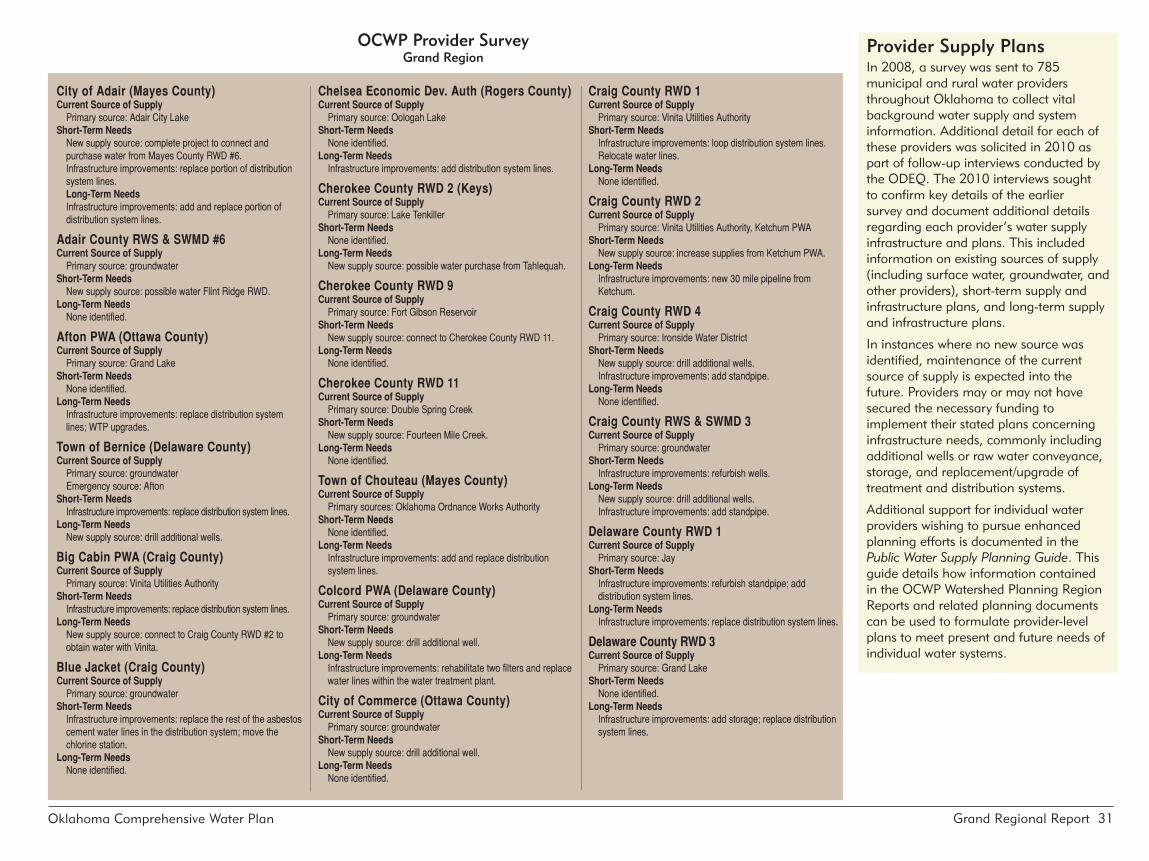
Grand Regional Report 31 Oklahoma Comprehensive Water Plan
OCWP Provider SurveyGrand Region
City of Adair (Mayes County)Current Source of Supply
Primary source: Adair City LakeShort-Term Needs
New supply source: complete project to connect and purchase water from Mayes County RWD #6.Infrastructure improvements: replace portion of distribution system lines.Long-Term NeedsInfrastructure improvements: add and replace portion of distribution system lines.
Adair County RWS & SWMD #6Current Source of Supply
Primary source: groundwaterShort-Term Needs
New supply source: possible water Flint Ridge RWD.Long-Term Needs
None identified.
Afton PWA (Ottawa County)Current Source of Supply
Primary source: Grand LakeShort-Term Needs
None identified.Long-Term Needs
Infrastructure improvements: replace distribution system lines; WTP upgrades.
Town of Bernice (Delaware County)Current Source of Supply
Primary source: groundwaterEmergency source: Afton
Short-Term NeedsInfrastructure improvements: replace distribution system lines.
Long-Term NeedsNew supply source: drill additional wells.
Big Cabin PWA (Craig County)Current Source of Supply
Primary source: Vinita Utilities AuthorityShort-Term Needs
Infrastructure improvements: replace distribution system lines.Long-Term Needs
New supply source: connect to Craig County RWD #2 to obtain water with Vinita.
Blue Jacket (Craig County)Current Source of Supply
Primary source: groundwaterShort-Term Needs
Infrastructure improvements: replace the rest of the asbestos cement water lines in the distribution system; move the chlorine station.
Long-Term NeedsNone identified.
Chelsea Economic Dev. Auth (Rogers County)Current Source of Supply
Primary source: Oologah LakeShort-Term Needs
None identified. Long-Term Needs
Infrastructure improvements: add distribution system lines.
Cherokee County RWD 2 (Keys)Current Source of Supply
Primary source: Lake TenkillerShort-Term Needs
None identified. Long-Term Needs
New supply source: possible water purchase from Tahlequah.
Cherokee County RWD 9Current Source of Supply
Primary source: Fort Gibson ReservoirShort-Term Needs
New supply source: connect to Cherokee County RWD 11.Long-Term Needs
None identified.
Cherokee County RWD 11Current Source of Supply
Primary source: Double Spring CreekShort-Term Needs
New supply source: Fourteen Mile Creek. Long-Term Needs
None identified.
Town of Chouteau (Mayes County)Current Source of Supply
Primary sources: Oklahoma Ordnance Works AuthorityShort-Term Needs
None identified. Long-Term Needs
Infrastructure improvements: add and replace distribution system lines.
Colcord PWA (Delaware County)Current Source of Supply
Primary source: groundwaterShort-Term Needs
New supply source: drill additional well. Long-Term Needs
Infrastructure improvements: rehabilitate two filters and replace water lines within the water treatment plant.
City of Commerce (Ottawa County)Current Source of Supply
Primary source: groundwaterShort-Term Needs
New supply source: drill additional well.Long-Term Needs
None identified.
Craig County RWD 1Current Source of Supply
Primary source: Vinita Utilities AuthorityShort-Term Needs
Infrastructure improvements: loop distribution system lines. Relocate water lines.
Long-Term NeedsNone identified.
Craig County RWD 2Current Source of Supply
Primary source: Vinita Utilities Authority, Ketchum PWAShort-Term Needs
New supply source: increase supplies from Ketchum PWA.Long-Term Needs
Infrastructure improvements: new 30 mile pipeline from Ketchum.
Craig County RWD 4Current Source of Supply
Primary source: Ironside Water DistrictShort-Term Needs
New supply source: drill additional wells. Infrastructure improvements: add standpipe.
Long-Term NeedsNone identified.
Craig County RWS & SWMD 3Current Source of Supply
Primary source: groundwaterShort-Term Needs
Infrastructure improvements: refurbish wells.Long-Term Needs
New supply source: drill additional wells.Infrastructure improvements: add standpipe.
Delaware County RWD 1Current Source of Supply
Primary source: JayShort-Term Needs
Infrastructure improvements: refurbish standpipe; add distribution system lines.
Long-Term NeedsInfrastructure improvements: replace distribution system lines.
Delaware County RWD 3Current Source of Supply
Primary source: Grand LakeShort-Term Needs
None identified. Long-Term Needs
Infrastructure improvements: add storage; replace distribution system lines.
Provider Supply PlansIn 2008, a survey was sent to 785 municipal and rural water providers throughout Oklahoma to collect vital background water supply and system information. Additional detail for each of these providers was solicited in 2010 as part of follow-up interviews conducted by the ODEQ. The 2010 interviews sought to confirm key details of the earlier survey and document additional details regarding each provider’s water supply infrastructure and plans. This included information on existing sources of supply (including surface water, groundwater, and other providers), short-term supply and infrastructure plans, and long-term supply and infrastructure plans.
In instances where no new source was identified, maintenance of the current source of supply is expected into the future. Providers may or may not have secured the necessary funding to implement their stated plans concerning infrastructure needs, commonly including additional wells or raw water conveyance, storage, and replacement/upgrade of treatment and distribution systems.
Additional support for individual water providers wishing to pursue enhanced planning efforts is documented in the Public Water Supply Planning Guide. This guide details how information contained in the OCWP Watershed Planning Region Reports and related planning documents can be used to formulate provider-level plans to meet present and future needs of individual water systems.
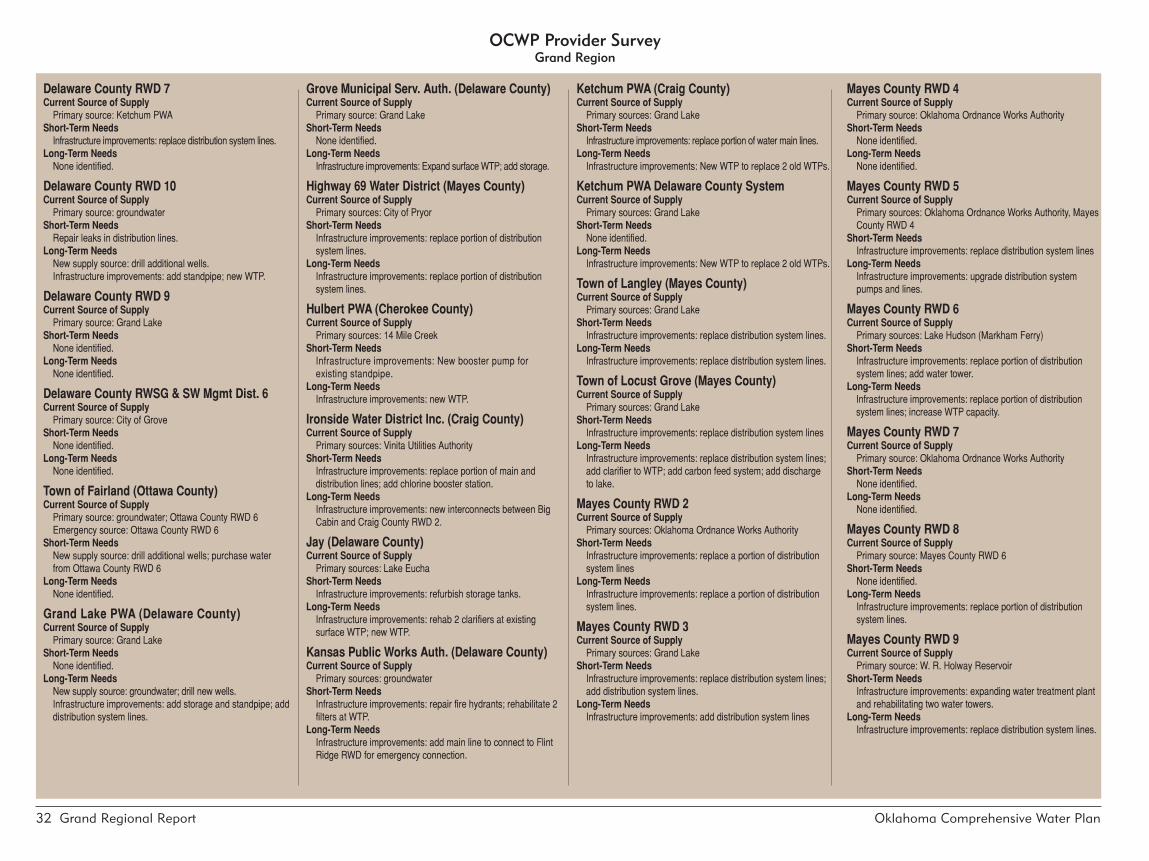
32 Grand Regional Report Oklahoma Comprehensive Water Plan
OCWP Provider SurveyGrand Region
Delaware County RWD 7Current Source of Supply
Primary source: Ketchum PWAShort-Term Needs
Infrastructure improvements: replace distribution system lines.Long-Term Needs
None identified.
Delaware County RWD 10Current Source of Supply
Primary source: groundwaterShort-Term Needs
Repair leaks in distribution lines.Long-Term Needs
New supply source: drill additional wells.Infrastructure improvements: add standpipe; new WTP.
Delaware County RWD 9Current Source of Supply
Primary source: Grand LakeShort-Term Needs
None identified.Long-Term Needs
None identified.
Delaware County RWSG & SW Mgmt Dist. 6Current Source of Supply
Primary source: City of GroveShort-Term Needs
None identified.Long-Term Needs
None identified.
Town of Fairland (Ottawa County)Current Source of Supply
Primary source: groundwater; Ottawa County RWD 6Emergency source: Ottawa County RWD 6
Short-Term NeedsNew supply source: drill additional wells; purchase water from Ottawa County RWD 6
Long-Term NeedsNone identified.
Grand Lake PWA (Delaware County)Current Source of Supply
Primary source: Grand LakeShort-Term Needs
None identified.Long-Term Needs
New supply source: groundwater; drill new wells. Infrastructure improvements: add storage and standpipe; add distribution system lines.
Grove Municipal Serv. Auth. (Delaware County)Current Source of Supply
Primary source: Grand LakeShort-Term Needs
None identified.Long-Term Needs
Infrastructure improvements: Expand surface WTP; add storage.
Highway 69 Water District (Mayes County)Current Source of Supply
Primary sources: City of PryorShort-Term Needs
Infrastructure improvements: replace portion of distribution system lines.
Long-Term NeedsInfrastructure improvements: replace portion of distribution system lines.
Hulbert PWA (Cherokee County)Current Source of Supply
Primary sources: 14 Mile CreekShort-Term Needs
Infrastructure improvements: New booster pump for existing standpipe.
Long-Term NeedsInfrastructure improvements: new WTP.
Ironside Water District Inc. (Craig County)Current Source of Supply
Primary sources: Vinita Utilities AuthorityShort-Term Needs
Infrastructure improvements: replace portion of main and distribution lines; add chlorine booster station.
Long-Term NeedsInfrastructure improvements: new interconnects between Big Cabin and Craig County RWD 2.
Jay (Delaware County)Current Source of Supply
Primary sources: Lake EuchaShort-Term Needs
Infrastructure improvements: refurbish storage tanks.Long-Term Needs
Infrastructure improvements: rehab 2 clarifiers at existing surface WTP; new WTP.
Kansas Public Works Auth. (Delaware County)Current Source of Supply
Primary sources: groundwaterShort-Term Needs
Infrastructure improvements: repair fire hydrants; rehabilitate 2 filters at WTP.
Long-Term NeedsInfrastructure improvements: add main line to connect to Flint Ridge RWD for emergency connection.
Ketchum PWA (Craig County)Current Source of Supply
Primary sources: Grand LakeShort-Term Needs
Infrastructure improvements: replace portion of water main lines.Long-Term Needs
Infrastructure improvements: New WTP to replace 2 old WTPs.
Ketchum PWA Delaware County SystemCurrent Source of Supply
Primary sources: Grand LakeShort-Term Needs
None identified.Long-Term Needs
Infrastructure improvements: New WTP to replace 2 old WTPs.
Town of Langley (Mayes County)Current Source of Supply
Primary sources: Grand Lake Short-Term Needs
Infrastructure improvements: replace distribution system lines.Long-Term Needs
Infrastructure improvements: replace distribution system lines.
Town of Locust Grove (Mayes County)Current Source of Supply
Primary sources: Grand LakeShort-Term Needs
Infrastructure improvements: replace distribution system linesLong-Term Needs
Infrastructure improvements: replace distribution system lines; add clarifier to WTP; add carbon feed system; add discharge to lake.
Mayes County RWD 2Current Source of Supply
Primary sources: Oklahoma Ordnance Works AuthorityShort-Term Needs
Infrastructure improvements: replace a portion of distribution system lines
Long-Term NeedsInfrastructure improvements: replace a portion of distribution system lines.
Mayes County RWD 3Current Source of Supply
Primary sources: Grand LakeShort-Term Needs
Infrastructure improvements: replace distribution system lines; add distribution system lines.
Long-Term NeedsInfrastructure improvements: add distribution system lines
Mayes County RWD 4Current Source of Supply
Primary source: Oklahoma Ordnance Works AuthorityShort-Term Needs
None identified. Long-Term Needs
None identified.
Mayes County RWD 5Current Source of Supply
Primary sources: Oklahoma Ordnance Works Authority, Mayes County RWD 4
Short-Term NeedsInfrastructure improvements: replace distribution system lines
Long-Term NeedsInfrastructure improvements: upgrade distribution system pumps and lines.
Mayes County RWD 6Current Source of Supply
Primary sources: Lake Hudson (Markham Ferry)Short-Term Needs
Infrastructure improvements: replace portion of distribution system lines; add water tower.
Long-Term Needs Infrastructure improvements: replace portion of distribution
system lines; increase WTP capacity.
Mayes County RWD 7Current Source of Supply
Primary source: Oklahoma Ordnance Works AuthorityShort-Term Needs
None identified.Long-Term Needs
None identified.
Mayes County RWD 8Current Source of Supply
Primary source: Mayes County RWD 6Short-Term Needs
None identified.Long-Term Needs
Infrastructure improvements: replace portion of distribution system lines.
Mayes County RWD 9Current Source of Supply
Primary source: W. R. Holway ReservoirShort-Term Needs
Infrastructure improvements: expanding water treatment plant and rehabilitating two water towers.
Long-Term NeedsInfrastructure improvements: replace distribution system lines.
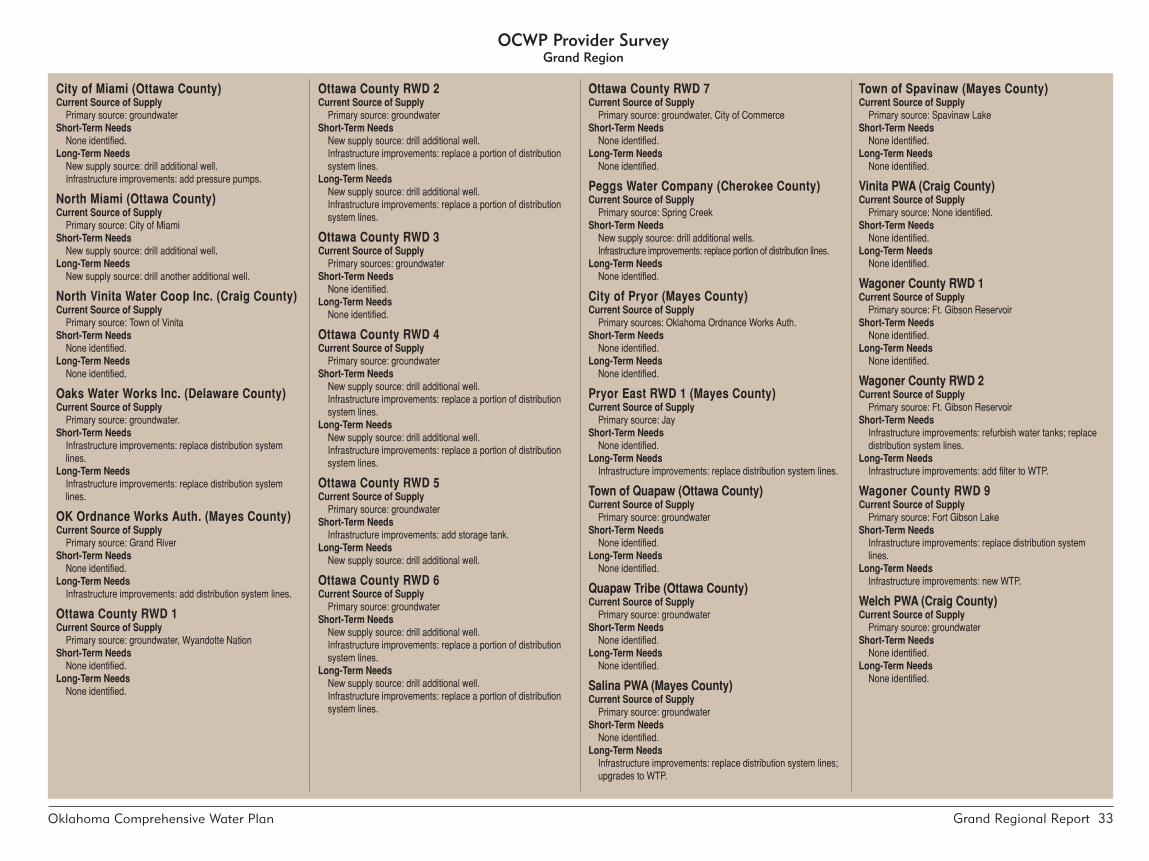
Grand Regional Report 33 Oklahoma Comprehensive Water Plan
Ottawa County RWD 7Current Source of Supply
Primary source: groundwater, City of CommerceShort-Term Needs
None identified.Long-Term Needs
None identified.
Peggs Water Company (Cherokee County)Current Source of Supply
Primary source: Spring CreekShort-Term Needs
New supply source: drill additional wells. Infrastructure improvements: replace portion of distribution lines.
Long-Term NeedsNone identified.
City of Pryor (Mayes County)Current Source of Supply
Primary sources: Oklahoma Ordnance Works Auth.Short-Term Needs
None identified.Long-Term Needs
None identified.
Pryor East RWD 1 (Mayes County)Current Source of Supply
Primary source: JayShort-Term Needs
None identified.Long-Term Needs
Infrastructure improvements: replace distribution system lines.
Town of Quapaw (Ottawa County)Current Source of Supply
Primary source: groundwaterShort-Term Needs
None identified.Long-Term Needs
None identified.
Quapaw Tribe (Ottawa County)Current Source of Supply
Primary source: groundwaterShort-Term Needs
None identified.Long-Term Needs
None identified.
Salina PWA (Mayes County)Current Source of Supply
Primary source: groundwaterShort-Term Needs
None identified.Long-Term Needs
Infrastructure improvements: replace distribution system lines; upgrades to WTP.
OCWP Provider SurveyGrand Region
City of Miami (Ottawa County)Current Source of Supply
Primary source: groundwaterShort-Term Needs
None identified.Long-Term Needs
New supply source: drill additional well.Infrastructure improvements: add pressure pumps.
North Miami (Ottawa County)Current Source of Supply
Primary source: City of MiamiShort-Term Needs
New supply source: drill additional well.Long-Term Needs
New supply source: drill another additional well.
North Vinita Water Coop Inc. (Craig County)Current Source of Supply
Primary source: Town of VinitaShort-Term Needs
None identified.Long-Term Needs
None identified.
Oaks Water Works Inc. (Delaware County)Current Source of Supply
Primary source: groundwater.Short-Term Needs
Infrastructure improvements: replace distribution system lines.
Long-Term NeedsInfrastructure improvements: replace distribution system lines.
OK Ordnance Works Auth. (Mayes County)Current Source of Supply
Primary source: Grand RiverShort-Term Needs
None identified. Long-Term Needs
Infrastructure improvements: add distribution system lines.
Ottawa County RWD 1Current Source of Supply
Primary source: groundwater, Wyandotte NationShort-Term Needs
None identified.Long-Term Needs
None identified.
Ottawa County RWD 2Current Source of Supply
Primary source: groundwaterShort-Term Needs
New supply source: drill additional well. Infrastructure improvements: replace a portion of distribution system lines.
Long-Term NeedsNew supply source: drill additional well. Infrastructure improvements: replace a portion of distribution system lines.
Ottawa County RWD 3Current Source of Supply
Primary sources: groundwaterShort-Term Needs
None identified. Long-Term Needs
None identified.
Ottawa County RWD 4Current Source of Supply
Primary source: groundwaterShort-Term Needs
New supply source: drill additional well. Infrastructure improvements: replace a portion of distribution system lines.
Long-Term NeedsNew supply source: drill additional well. Infrastructure improvements: replace a portion of distribution system lines.
Ottawa County RWD 5Current Source of Supply
Primary source: groundwaterShort-Term Needs
Infrastructure improvements: add storage tank.Long-Term Needs
New supply source: drill additional well.
Ottawa County RWD 6Current Source of Supply
Primary source: groundwaterShort-Term Needs
New supply source: drill additional well. Infrastructure improvements: replace a portion of distribution system lines.
Long-Term NeedsNew supply source: drill additional well. Infrastructure improvements: replace a portion of distribution system lines.
Town of Spavinaw (Mayes County)Current Source of Supply
Primary source: Spavinaw LakeShort-Term Needs
None identified.Long-Term Needs
None identified.
Vinita PWA (Craig County)Current Source of Supply
Primary source: None identified.Short-Term Needs
None identified.Long-Term Needs
None identified.
Wagoner County RWD 1Current Source of Supply
Primary source: Ft. Gibson ReservoirShort-Term Needs
None identified. Long-Term Needs
None identified.
Wagoner County RWD 2Current Source of Supply
Primary source: Ft. Gibson ReservoirShort-Term Needs
Infrastructure improvements: refurbish water tanks; replace distribution system lines.
Long-Term NeedsInfrastructure improvements: add filter to WTP.
Wagoner County RWD 9Current Source of Supply
Primary source: Fort Gibson LakeShort-Term Needs
Infrastructure improvements: replace distribution system lines.
Long-Term NeedsInfrastructure improvements: new WTP.
Welch PWA (Craig County)Current Source of Supply
Primary source: groundwaterShort-Term Needs
None identified.Long-Term Needs
None identified.

34 Grand Regional Report Oklahoma Comprehensive Water Plan
Infrastructure Cost SummaryGrand Region
Provider System Category1
Infrastructure Need (millions of 2007 dollars)
Present-2020 2021-2040 2041-2060 Total Period
Small $277 $450 $109 $836
Medium $237 $562 $383 $1,182
Large $0 $0 $0 $0
Reservoir2 $0 $26 $110 $136
Total $514 $1,038 $602 $2,154
1 Large providers are defined as those serving more than 100,000 people, medium systems as those serving between 3,301 and 100,000 people, and small systems as those serving 3,300 or fewer people.
2 The “reservoir” category refers specifically to rehabilitation projects.
•Approximately $2.2 billion is needed to meet the projected drinking water infrastructure needs of the Grand Region over the next 50 years. The largest infrastructure costs are expected to occur between 2021 and 2040.
•Distribution and transmission projects account for more than 90 percent of the providers’ estimated infrastructure costs, followed distantly by water treatment projects.
•Medium-sized providers have the largest overall drinking water infrastructure costs.
•Projects involving rehabilitation of existing reservoirs comprise approximately six percent of the total costs.
Drinking Water Infrastructure Cost SummaryAs part of the public water provider analysis, regional cost estimates to meet system drinking water infrastructure needs over the next 50 years were prepared. While it is difficult to account for changes that may occur within this extended time frame, it is beneficial to evaluate, at least on the order-of-magnitude level, the long-range costs of providing potable water.
Project cost estimates were developed for a selection of existing water providers, and then weighted to determine total regional costs. The OCWP method is similar to that utilized by the EPA to determine national drinking water infrastructure costs in 2007. However, the OCWP uses a 50-year planning horizon while the EPA uses a 20-year period. Also, the OCWP includes a broader spectrum of project types rather than limiting projects to those eligible for the Drinking Water State Revolving Fund program. While estimated costs for new reservoirs are not included, rehabilitation project costs for existing major reservoirs were applied at the regional level.
More information on the methodology and cost estimates is available in the OCWP Drinking Water Infrastructure Needs Assessment by Region report.

Grand Regional Report 35 Oklahoma Comprehensive Water Plan

36 Grand Regional Report Oklahoma Comprehensive Water Plan
Limitations AnalysisFor each of the state’s 82 OCWP basins, an analysis of water supply and demand was followed by an analysis of limitations for surface water, bedrock groundwater, and alluvial groundwater use . Physical availability limitations for surface water were referred to as gaps . Availability limitations for alluvial and bedrock groundwater were referred to as depletions .
For surface water, the most pertinent limiting characteristics considered were (1) physical availability of water, (2) permit availability, and(3)waterquality.Foralluvialandbedrockgroundwater, permit availability was not a limiting factor through 2060, and existing datawereinsufficienttoconductmeaningfulgroundwaterqualityanalyses.Therefore,limitationsformajoralluvialandbedrockaquiferswererelatedtophysicalavailabilityof water and included an analysis of both the amount of any forecasted depletion relative to the amount of water in storage and rate at which the depletion was predicted to occur .
Methodologies were developed to assess limitations and assign appropriate scores for each supply source in each basin . For surface water, scores were calculated weighting the characteristics as follows: 50% for physical availability, 30% for permit availability, and20%forwaterquality.Foralluvialandbedrock groundwater scores, the magnitude of depletion relative to amount of water in storage and rate of depletion were each weighted 50% .
The resulting supply limitation scores were used to rank all 82 basins for surface water, majoralluvialgroundwater,andmajorbedrockgroundwater sources (see Water Supply Limitations map in the regional summary) . For each source, basins ranking the highest were considered to be “significantly limited” in the ability of that source to meet forecasted
demands reliably . Basins with intermediate rankings were considered to be “potentially limited” for that source . For bedrock and alluvial groundwater rankings, “potentially limited” was also the baseline default given to basinslackingmajoraquifersduetotypicallylower yields and insufficient data . Basins with the lowest rankings were considered to be “minimally limited” for that source and not projectedtohaveanygapsordepletions.
Based on an analysis of all three sources of water, the basins with the most significant limitations ranking were identified as “Hot Spots .” A discussion of the methodologies used in identifying Hot Spots, results, and recommendations can be found in the OCWP Executive Report .
Primary Options To provide a range of potential solutions for mitigation of water supply shortages in each ofthe82OCWPbasins,fiveprimaryoptionswere evaluated for potential effectiveness: (1) demand management, (2) use of out-of-basin supplies, (3) reservoir use, (4) increasing reliance on surface water, and (5) increasing reliance on groundwater . For each basin, the potential effectiveness of each primary option was assigned one of three ratings: (1) typically effective, (2) potentially effective, and (3) likely ineffective (see Water Supply Option Effectiveness map in the regional summary) . Forbasinswhereshortagesarenotprojected,no options are necessary and thus none were evaluated .
Demand Management “Demand management” refers to the potential to reduce water demands and alleviate gaps or depletions by implementing conservation or drought management measures . Demand management is a vitally important tool that can be implemented either temporarily or permanently to decrease demand and increase
available supply . “Conservation measures” refer to long-term activities that result in consistent water savings throughout the year, while “drought management” refers to short-term measures, such as temporary restrictions on outdoor watering . Municipal and industrial conservationtechniquescanincludemodifyingcustomer behaviors, using more efficient plumbing fixtures, or eliminating water leaks . Agriculturalconservationtechniquescaninclude reducing water demand through more efficient irrigation systems and production of cropswithdecreasedwaterrequirements.
Two specific scenarios for conservation were analyzed for the OCWP—moderate and substantial—to assess the relative effectiveness in reducing statewide water demand in the two largest demand sectors, Municipal/Industrial and Crop Irrigation . For the Watershed Planning Region reports, only moderately expanded conservation activities were considered when assessing the overall effectiveness of the demand management option for each basin . A broader analysis of moderate and substantial conservation measures statewide is discussed below and summarized in the “Expanded Options” section of the OCWP Executive Report .
Demand management was considered to be “typically effective” in basins where it would likely eliminate both gaps and storage depletions and “potentially effective” in basins where it would likely either reduce gaps and depletions or eliminate either gaps or depletions (but not both) . There were no basins where demand management could not reduce gaps and/or storage depletions to at least some extent; therefore this option was not rated “likely ineffective” for any basin .
Out-of-Basin Supplies Use of “out-of-basin supplies” refers to the option of transferring water through pipelines from a source in one basin to another basin . This
option was considered a “potentially effective” solution in all basins due to its general potential in eliminating gaps and depletions . The option was not rated “typically effective” because complexity and cost make it only practical as a long-term solution . The effectiveness of this option for a basin was also assessed with the consideration of potential new reservoir sites withintherespectiveregionasidentifiedinthe Expanded Options section below and the OCWP Reservoir Viability Study .
Reservoir Use “Reservoir Use” refers to the development of additional in-basin reservoir storage . Reservoir storage can be provided through increased use of existing facilities, such as reallocation ofexistingpurposesatmajorfederalreservoirsitesorrehabilitationofsmallerNRCSprojectsto include municipal and/or industrial water supply, or the construction of new reservoirs .
The effectiveness rating of reservoir use for a basin was based on a hypothetical reservoir located at the furthest downstream basin outlet . Water transmission and legal or water qualityconstraintswerenotconsidered;however, potential constraints in permit availability were noted . A site located further upstreamcouldpotentiallyprovideadequateyield to meet demand, but would likely requiregreaterstoragethanasitelocatedatthe basin outlet . The effectiveness rating was also largely contingent upon the existence of previously studied reservoir sites (see the Expanded Options section below) and/or the ability of new streamflow diversions with storage to meet basin water demands .
Reservoir use was considered “typically effective” in basins containing one or more potentially viable reservoir sites unless the basin was fully allocated for surface water and had no permit availability . For basins with no permit availability, reservoir use was considered “potentially effective,” since
Water Supply Options
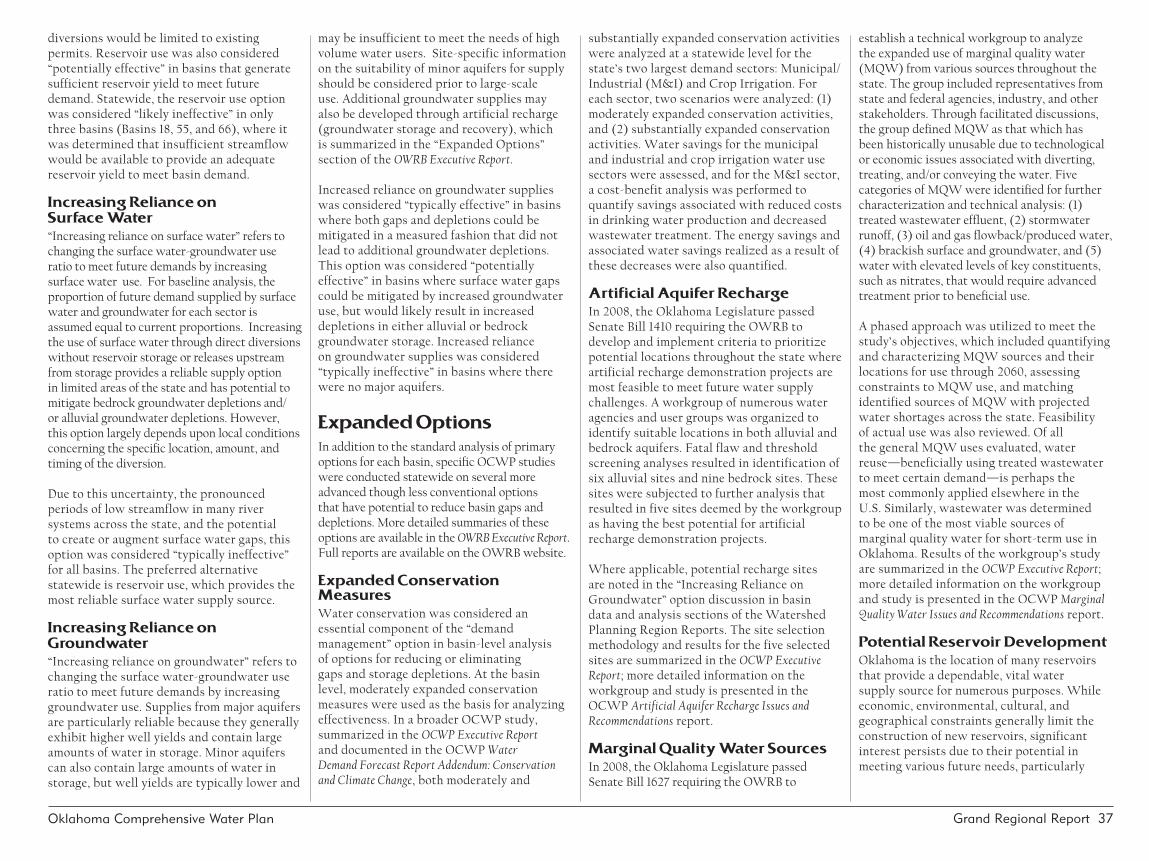
Grand Regional Report 37 Oklahoma Comprehensive Water Plan
diversions would be limited to existing permits . Reservoir use was also considered “potentially effective” in basins that generate sufficient reservoir yield to meet future demand . Statewide, the reservoir use option was considered “likely ineffective” in only three basins (Basins 18, 55, and 66), where it was determined that insufficient streamflow wouldbeavailabletoprovideanadequatereservoir yield to meet basin demand .
Increasing Reliance on Surface Water “Increasing reliance on surface water” refers to changing the surface water-groundwater use ratio to meet future demands by increasing surface water use . For baseline analysis, the proportion of future demand supplied by surface water and groundwater for each sector is assumedequaltocurrentproportions.Increasingthe use of surface water through direct diversions without reservoir storage or releases upstream from storage provides a reliable supply option in limited areas of the state and has potential to mitigate bedrock groundwater depletions and/or alluvial groundwater depletions . However, this option largely depends upon local conditions concerningthespecificlocation,amount,andtiming of the diversion .
Due to this uncertainty, the pronounced periods of low streamflow in many river systems across the state, and the potential to create or augment surface water gaps, this option was considered “typically ineffective” for all basins . The preferred alternative statewide is reservoir use, which provides the most reliable surface water supply source .
Increasing Reliance onGroundwater“Increasing reliance on groundwater” refers to changing the surface water-groundwater use ratio to meet future demands by increasing groundwateruse.Suppliesfrommajoraquifersare particularly reliable because they generally exhibit higher well yields and contain large amountsofwaterinstorage.Minoraquiferscan also contain large amounts of water in storage, but well yields are typically lower and
may be insufficient to meet the needs of high volume water users . Site-specific information onthesuitabilityofminoraquifersforsupplyshould be considered prior to large-scale use . Additional groundwater supplies may also be developed through artificial recharge (groundwater storage and recovery), which is summarized in the “Expanded Options” section of the OWRB Executive Report .
Increased reliance on groundwater supplies was considered “typically effective” in basins where both gaps and depletions could be mitigated in a measured fashion that did not lead to additional groundwater depletions . This option was considered “potentially effective” in basins where surface water gaps could be mitigated by increased groundwater use, but would likely result in increased depletions in either alluvial or bedrock groundwater storage . Increased reliance on groundwater supplies was considered “typically ineffective” in basins where there werenomajoraquifers.
Expanded Options In addition to the standard analysis of primary optionsforeachbasin,specificOCWPstudieswere conducted statewide on several more advanced though less conventional options that have potential to reduce basin gaps and depletions . More detailed summaries of these options are available in the OWRB Executive Report . Full reports are available on the OWRB website .
Expanded Conservation MeasuresWater conservation was considered an essential component of the “demand management” option in basin-level analysis of options for reducing or eliminating gaps and storage depletions . At the basin level, moderately expanded conservation measures were used as the basis for analyzing effectiveness . In a broader OCWP study, summarized in the OCWP Executive Report and documented in the OCWP Water Demand Forecast Report Addendum: Conservation and Climate Change, both moderately and
substantially expanded conservation activities were analyzed at a statewide level for the state’s two largest demand sectors: Municipal/ Industrial (M&I) and Crop Irrigation . For each sector, two scenarios were analyzed: (1) moderately expanded conservation activities, and (2) substantially expanded conservation activities . Water savings for the municipal and industrial and crop irrigation water use sectors were assessed, and for the M&I sector, a cost-benefit analysis was performed to quantifysavingsassociatedwithreducedcostsin drinking water production and decreased wastewater treatment . The energy savings and associated water savings realized as a result of thesedecreaseswerealsoquantified.
Artificial Aquifer RechargeIn 2008, the Oklahoma Legislature passed SenateBill1410requiringtheOWRBtodevelop and implement criteria to prioritize potential locations throughout the state where artificialrechargedemonstrationprojectsaremost feasible to meet future water supply challenges . A workgroup of numerous water agencies and user groups was organized to identify suitable locations in both alluvial and bedrockaquifers.Fatalflawandthresholdscreening analyses resulted in identification of six alluvial sites and nine bedrock sites . These sitesweresubjectedtofurtheranalysisthatresulted in five sites deemed by the workgroup as having the best potential for artificial rechargedemonstrationprojects.
Where applicable, potential recharge sites are noted in the “Increasing Reliance on Groundwater” option discussion in basin data and analysis sections of the Watershed Planning Region Reports . The site selection methodology and results for the five selected sites are summarized in the OCWP Executive Report; more detailed information on the workgroup and study is presented in the OCWP Artificial Aquifer Recharge Issues and Recommendations report .
Marginal Quality Water SourcesIn 2008, the Oklahoma Legislature passed SenateBill1627requiringtheOWRBto
establish a technical workgroup to analyze theexpandeduseofmarginalqualitywater(MQW) from various sources throughout the state . The group included representatives from state and federal agencies, industry, and other stakeholders . Through facilitated discussions, thegroupdefinedMQWasthatwhichhasbeen historically unusable due to technological or economic issues associated with diverting, treating, and/or conveying the water . Five categoriesofMQWwereidentifiedforfurthercharacterization and technical analysis: (1) treatedwastewatereffluent,(2)stormwaterrunoff,(3)oilandgasflowback/producedwater,(4) brackish surface and groundwater, and (5) water with elevated levels of key constituents, suchasnitrates,thatwouldrequireadvancedtreatmentpriortobeneficialuse.
A phased approach was utilized to meet the study’sobjectives,whichincludedquantifyingand characterizing MQW sources and their locations for use through 2060, assessing constraints to MQW use, and matching identifiedsourcesofMQWwithprojectedwater shortages across the state . Feasibility of actual use was also reviewed . Of all the general MQW uses evaluated, water reuse—beneficially using treated wastewater to meet certain demand—is perhaps the most commonly applied elsewhere in the U .S . Similarly, wastewater was determined to be one of the most viable sources of marginalqualitywaterforshort-termuseinOklahoma . Results of the workgroup’s study are summarized in the OCWP Executive Report; more detailed information on the workgroup and study is presented in the OCWP Marginal Quality Water Issues and Recommendations report .
Potential Reservoir DevelopmentOklahoma is the location of many reservoirs that provide a dependable, vital water supply source for numerous purposes . While economic, environmental, cultural, and geographical constraints generally limit the construction of new reservoirs, significant interest persists due to their potential in meeting various future needs, particularly

38 Grand Regional Report Oklahoma Comprehensive Water Plan
those associated with municipalities and regional public supply systems .
As another option to address Oklahoma’s long-range water needs, the OCWP Reservoir Viability Study was initiated to identify potential reservoir sites throughout the state that have been analyzed to various degrees by the OWRB, Bureau of Reclamation (BOR), U .S . Army Corps of Engineers (USACE), NaturalResourcesConservationService(NRCS),andotherpublicorprivateagencies.Principal elements of the study included extensive literature search; identification of criteria to determine a reservoir’s viability; creation of a database to store essential information for each site; evaluation of
sites; Geographic Information System (GIS) mapping of the most viable sites; aerial photograph and map reconnaissance; screening of environmental, cultural, and endangered species issues; estimates of updated construction costs; and categorical assessment of viability . The study revealed more than 100 sites statewide . Each was assigned a ranking, ranging from Category 4 (siteswithatleastadequateinformationthatare viable candidates for future development) to Category 0 (sites that exist only on a historical map and for which no study data can be verified) .
This analysis does not necessarily indicate an actual need or specific recommendation to
buildanypotentialproject.Rather,thesesitesare presented to provide local and regional decision-makers with additional tools as they anticipate future water supply needs and opportunities . Study results present only a cursory examination of the many factorsassociatedwithprojectfeasibilityorimplementation . Detailed investigations would berequiredinallcasestoverifyfeasibilityofconstruction and implementation . A summary of potential reservoir sites statewide is available in the OCWP Executive Report; more detailed information on the study is presented in the OCWP Reservoir Viability Study . Potential reservoir development sites for this Watershed Planning Region appear on the following table and map .
Potential Reservoir Sites (Categories 3 & 4)Grand Region
Name Category Stream Basin Purposes1
Total Storage
Conservation Pool
Primary StudyUpdated Cost
Estimate2
(2010 dollars)
Surface Area Storage Dependable Yield
Date AgencyAF Acres AF AFY
Chelsea 4 Prior Creek 80 FC, WS, R, FW 0 4,500 65,000 21,284 1986 USACE $160,317,000
1 WS=Water Supply, R=Recreation, HP=Hydroelectric Power, IR=Irrigation, WQ=Water Quality, FW=Fish & Wildlife, FC=Flood Control, LF=Low Flow Regulation, N=Navigation, C=Conservation, CW=Cooling Water2 The majority of cost estimates were updated using estimated costs from previous project reports combined with the U.S. Army Corps of Engineers Civil Works Construction Cost Index System (CWCCIS) annual
escalation figures to scale the original cost estimates to present-day cost estimates. These estimated costs may not accurately reflect current conditions at the proposed project site and are meant to be used for general comparative purposes only.
Reservoir Project Viability CategorizationCategory 4: Sites with at least adequate information that are viable candidates for future development.
Category 3: Sites with sufficient data for analysis, but less than desirable for current viability.
Category 2: Sites that may contain fatal flaws or other factors that could severely impede potential development.
Category 1: Sites with limited available data and lacking essential elements of information.
Category 0: Typically sites that exist only on an historical map. Study data cannot be located or verified.

Grand Regional Report 39 Oklahoma Comprehensive Water Plan
Expanded Water Supply OptionsGrand Region

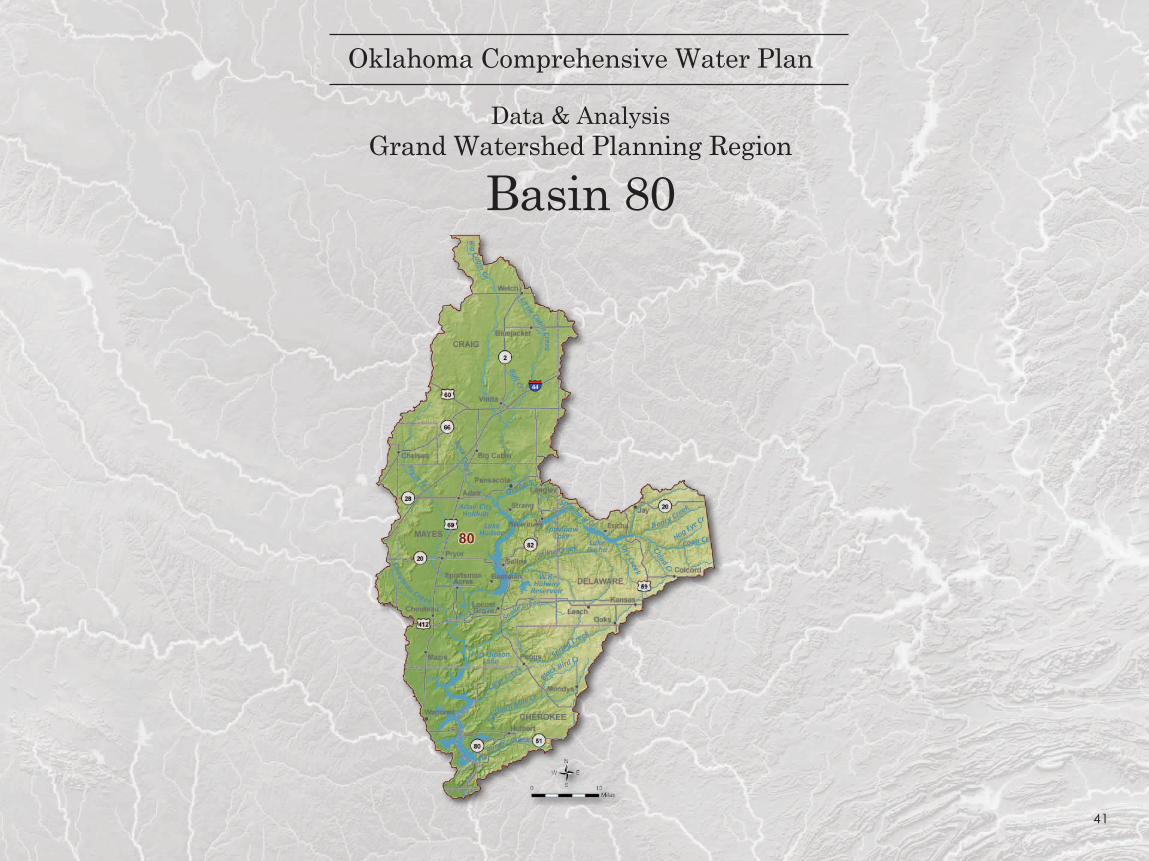
41
Oklahoma Comprehensive Water Plan
Data & AnalysisGrand Watershed Planning Region
Basin 80
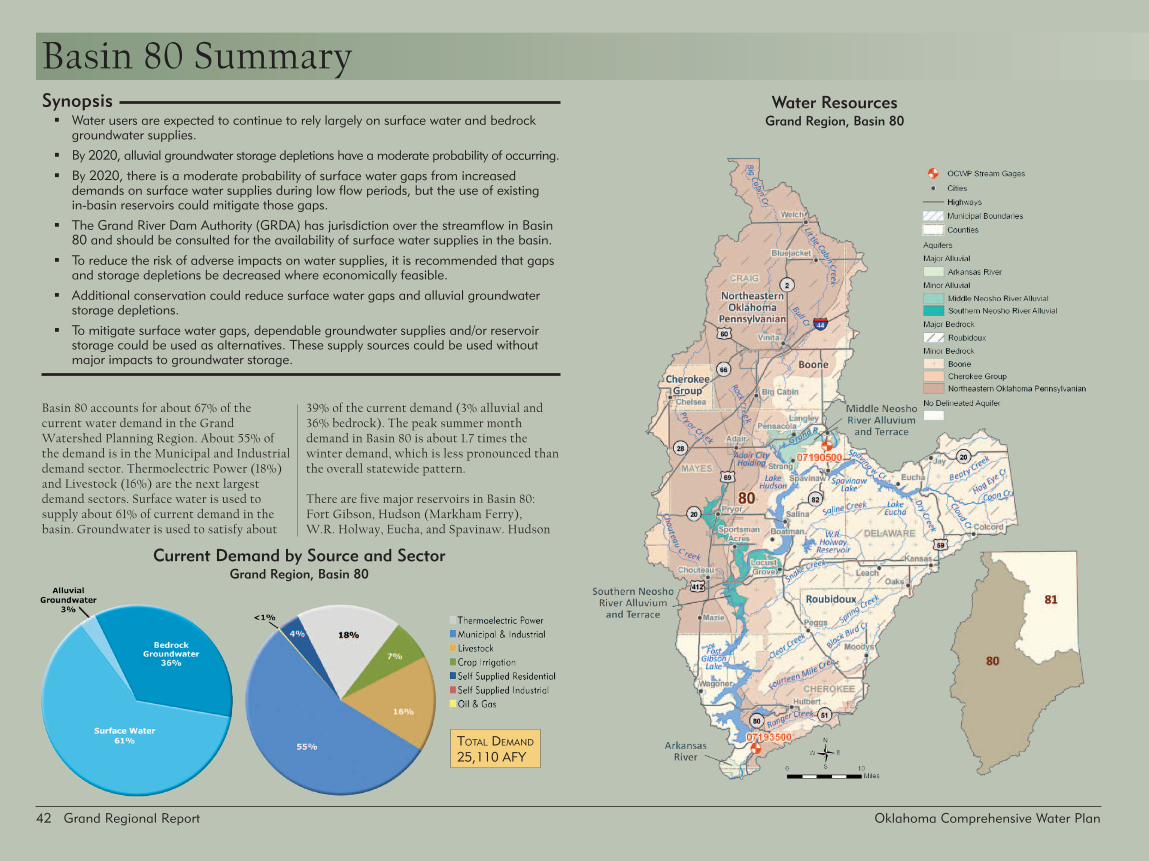
42 Grand Regional Report Oklahoma Comprehensive Water Plan
Water ResourcesGrand Region, Basin 80
Basin 80 Summary
Basin 80 accounts for about 67% of the current water demand in the Grand Watershed Planning Region . About 55% of the demand is in the Municipal and Industrial demand sector . Thermoelectric Power (18%) and Livestock (16%) are the next largest demand sectors . Surface water is used to supply about 61% of current demand in the basin . Groundwater is used to satisfy about
39% of the current demand (3% alluvial and 36% bedrock) . The peak summer month demand in Basin 80 is about 1 .7 times the winter demand, which is less pronounced than the overall statewide pattern .
TherearefivemajorreservoirsinBasin80:Fort Gibson, Hudson (Markham Ferry), W .R . Holway, Eucha, and Spavinaw . Hudson
Synopsis � Water users are expected to continue to rely largely on surface water and bedrock
groundwater supplies.
� By 2020, alluvial groundwater storage depletions have a moderate probability of occurring.
� By 2020, there is a moderate probability of surface water gaps from increased demands on surface water supplies during low flow periods, but the use of existing in-basin reservoirs could mitigate those gaps.
� The Grand River Dam Authority (GRDA) has jurisdiction over the streamflow in Basin 80 and should be consulted for the availability of surface water supplies in the basin.
� To reduce the risk of adverse impacts on water supplies, it is recommended that gaps and storage depletions be decreased where economically feasible.
� Additional conservation could reduce surface water gaps and alluvial groundwater storage depletions.
� To mitigate surface water gaps, dependable groundwater supplies and/or reservoir storage could be used as alternatives. These supply sources could be used without major impacts to groundwater storage.
Current Demand by Source and SectorGrand Region, Basin 80
ToTal DemanD
25,110 AFY
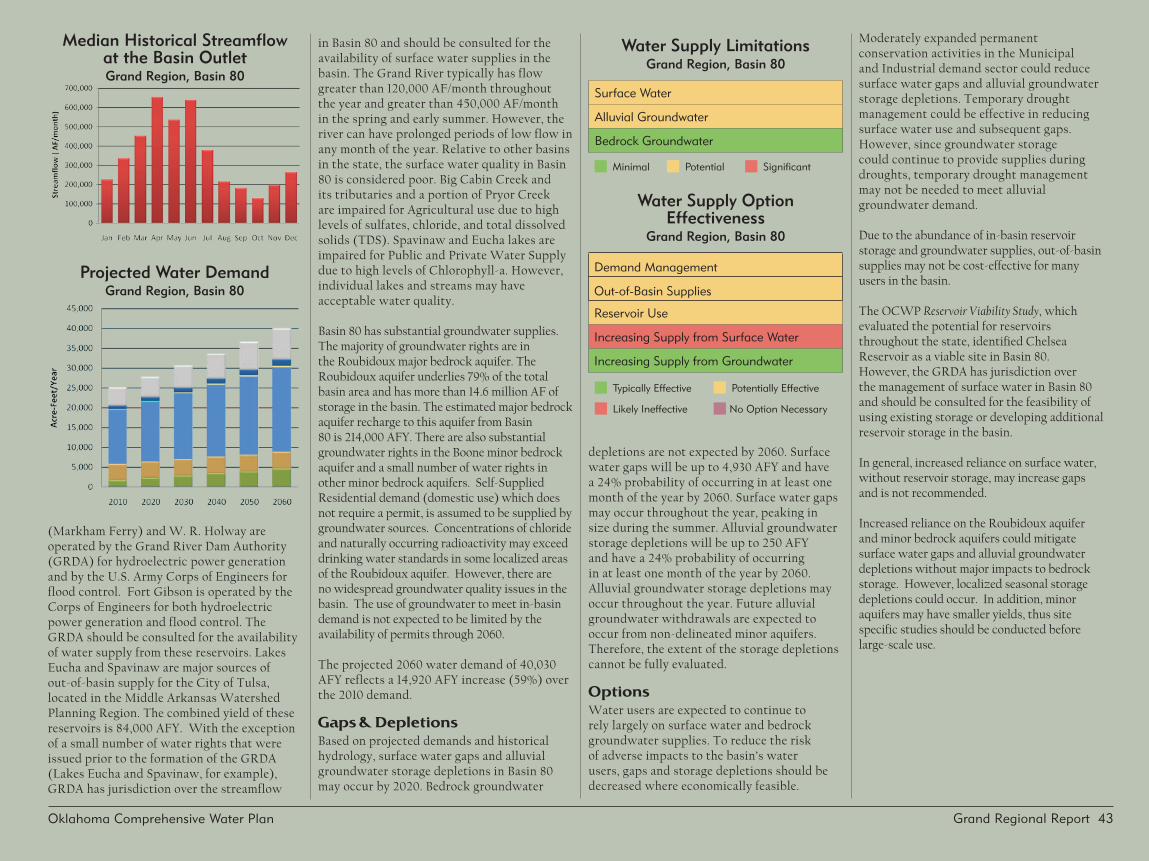
Grand Regional Report 43 Oklahoma Comprehensive Water Plan
in Basin 80 and should be consulted for the availability of surface water supplies in the basin . The Grand River typically has flow greater than 120,000 AF/month throughout the year and greater than 450,000 AF/month in the spring and early summer . However, the river can have prolonged periods of low flow in any month of the year . Relative to other basins inthestate,thesurfacewaterqualityinBasin80 is considered poor . Big Cabin Creek and its tributaries and a portion of Pryor Creek are impaired for Agricultural use due to high levels of sulfates, chloride, and total dissolved solids (TDS) . Spavinaw and Eucha lakes are impaired for Public and Private Water Supply due to high levels of Chlorophyll-a . However, individual lakes and streams may have acceptablewaterquality.
Basin 80 has substantial groundwater supplies . ThemajorityofgroundwaterrightsareintheRoubidouxmajorbedrockaquifer.TheRoubidouxaquiferunderlies79%ofthetotalbasin area and has more than 14 .6 million AF of storageinthebasin.TheestimatedmajorbedrockaquiferrechargetothisaquiferfromBasin80 is 214,000 AFY . There are also substantial groundwater rights in the Boone minor bedrock aquiferandasmallnumberofwaterrightsinotherminorbedrockaquifers.Self-SuppliedResidential demand (domestic use) which does notrequireapermit,isassumedtobesuppliedbygroundwater sources . Concentrations of chloride and naturally occurring radioactivity may exceed drinking water standards in some localized areas oftheRoubidouxaquifer.However,therearenowidespreadgroundwaterqualityissuesinthebasin . The use of groundwater to meet in-basin demand is not expected to be limited by the availability of permits through 2060 .
Theprojected2060waterdemandof40,030AFY reflects a 14,920 AFY increase (59%) over the 2010 demand .
Gaps & DepletionsBasedonprojecteddemandsandhistoricalhydrology, surface water gaps and alluvial groundwater storage depletions in Basin 80 may occur by 2020 . Bedrock groundwater
(Markham Ferry) and W . R . Holway are operated by the Grand River Dam Authority (GRDA) for hydroelectric power generation and by the U .S . Army Corps of Engineers for flood control . Fort Gibson is operated by the Corps of Engineers for both hydroelectric power generation and flood control . The GRDA should be consulted for the availability of water supply from these reservoirs . Lakes EuchaandSpavinawaremajorsourcesofout-of-basin supply for the City of Tulsa, located in the Middle Arkansas Watershed Planning Region . The combined yield of these reservoirs is 84,000 AFY . With the exception of a small number of water rights that were issued prior to the formation of the GRDA (Lakes Eucha and Spavinaw, for example), GRDAhasjurisdictionoverthestreamflow
depletions are not expected by 2060 . Surface water gaps will be up to 4,930 AFY and have a 24% probability of occurring in at least one month of the year by 2060 . Surface water gaps may occur throughout the year, peaking in size during the summer . Alluvial groundwater storage depletions will be up to 250 AFY and have a 24% probability of occurring in at least one month of the year by 2060 . Alluvial groundwater storage depletions may occur throughout the year . Future alluvial groundwater withdrawals are expected to occurfromnon-delineatedminoraquifers.Therefore, the extent of the storage depletions cannot be fully evaluated .
OptionsWater users are expected to continue to rely largely on surface water and bedrock groundwater supplies . To reduce the risk of adverse impacts to the basin’s water users, gaps and storage depletions should be decreased where economically feasible .
Median Historical Streamflow at the Basin OutletGrand Region, Basin 80
Projected Water Demand Grand Region, Basin 80
Moderately expanded permanent conservation activities in the Municipal and Industrial demand sector could reduce surface water gaps and alluvial groundwater storage depletions . Temporary drought management could be effective in reducing surfacewateruseandsubsequentgaps.However, since groundwater storage could continue to provide supplies during droughts, temporary drought management may not be needed to meet alluvial groundwater demand .
Due to the abundance of in-basin reservoir storage and groundwater supplies, out-of-basin supplies may not be cost-effective for many users in the basin .
The OCWP Reservoir Viability Study, which evaluated the potential for reservoirs throughoutthestate,identifiedChelseaReservoir as a viable site in Basin 80 . However,theGRDAhasjurisdictionoverthe management of surface water in Basin 80 and should be consulted for the feasibility of using existing storage or developing additional reservoir storage in the basin .
In general, increased reliance on surface water, without reservoir storage, may increase gaps and is not recommended .
IncreasedrelianceontheRoubidouxaquiferandminorbedrockaquiferscouldmitigatesurface water gaps and alluvial groundwater depletionswithoutmajorimpactstobedrockstorage . However, localized seasonal storage depletions could occur . In addition, minor aquifersmayhavesmalleryields,thussitespecificstudiesshouldbeconductedbeforelarge-scale use .
Water Supply LimitationsGrand Region, Basin 80
Surface Water
Alluvial Groundwater
Bedrock Groundwater
n Minimal n Potential n Significant
Water Supply Option Effectiveness
Grand Region, Basin 80
Demand Management
Out-of-Basin Supplies
Reservoir Use
Increasing Supply from Surface Water
Increasing Supply from Groundwater
n Typically Effective n Potentially Effective
n Likely Ineffective n No Option Necessary

44 Grand Regional Report, Basin Data & Analysis Oklahoma Comprehensive Water Plan
Surface Water Resources•Historical streamflow from 1950 through
2007 was used to estimate the potential range of future surface water supplies. The basin had a prolonged period of below-average streamflow between the early 1960s and the early 1970s, corresponding to a period of below-average precipitation. From the late 1990s to the late 2000s, the basin went through a prolonged period of above-average streamflow and precipitation, demonstrating hydrologic variability in the basin.
•The median streamflow in the Grand River upstream of the Arkansas River is greater than 130,000 AF/month throughout the year. However, the river can have prolonged periods of low flow in the fall and winter months.
•Relative to other basins in the state, the surface water quality in Basin 80 is considered poor. However, individual lakes and streams may have acceptable water quality.
•There are five major reservoirs in Basin 80. Hudson, W. R. Holway, and Fort Gibson are operated primarily for hydroelectric power generation and for flood control. Lakes Eucha and Spavinaw are major sources of supply for the City of Tulsa. With the exception of a small number of water rights that were issued prior to the formation of the GRDA (Lakes Eucha and Spavinaw, for example), GRDA has jurisdiction for the administration of surface water in this basin and should be consulted for the availability of water supplies from their reservoirs.
Monthly Historical Streamflow at the Basin OutletGrand Region, Basin 80
Historical Streamflow at the Basin OutletGrand Region, Basin 80
Historical PrecipitationRegional Climate Division
Basin 80 Data & Analysis

Grand Regional Report, Basin Data & Analysis 45Oklahoma Comprehensive Water Plan
Groundwater Resources•Basin 80 has substantial groundwater
supplies. The majority of groundwater rights are in the Roubidoux major bedrock aquifer. The estimated major bedrock aquifer recharge to this aquifer from Basin 80 is 214,000 AFY. There are also substantial groundwater rights in the Boone minor bedrock aquifer and smaller amounts in other minor bedrock aquifers.
•There are no significant widespread groundwater quality issues in the basin. However, concentrations of chloride and naturally occurring radioactivity may exceed drinking water standards in some localized areas of the Roubidoux aquifer.
Groundwater Resources - Aquifer Summary (2010)Grand Region, Basin 80
AquiferPortion of Basin
Overlaying AquiferCurrent
Groundwater RightsAquifer Storage
in BasinEqual Proportionate
Share
Groundwater Available for New Permits
Name Type Class1 Percent AFY AF AFY/Acre AFY
Arkansas River Alluvial Major <1% <50 7,000 temporary 2.0 12,700
Roubidoux Bedrock Major 79% 5,800 14,669,000 temporary 2.0 2,072,100
Boone Bedrock Minor 57% 3,900 13,015,000 temporary 2.0 1,488,000
Cherokee Group Bedrock Minor 4% 200 94,000 temporary 2.0 101,600
Middle Neosho River Alluvial Minor 1% 0 30,000 temporary 2.0 25,600
Northeastern Oklahoma Pennsylvanian Bedrock Minor 49% 400 1,473,000 temporary 2.0 1,279,700
Southern Neosho River Alluvial Minor 2% 0 51,000 temporary 2.0 51,200
Non-Delineated Groundwater Source Bedrock Minor N/A 0 N/A temporary 2.0 N/A
Non-Delineated Groundwater Source Alluvial Minor N/A 0 N/A temporary 2.0 N/A
1 Bedrock aquifers with typical yields greater than 50 gpm and alluvial aquifers with typical yields greater than 150 gpm are considered major.

46 Grand Regional Report, Basin Data & Analysis Oklahoma Comprehensive Water Plan
Water Demand•The water needs of Basin 80 account
for about 67% of the total demand in the Grand Watershed Planning Region and will increase by 59% (14,920 AFY) from 2010 to 2060. The demand and growth in demand during this period will be in the Municipal and Industrial and Thermoelectric Power demand sectors.
• Surface water is used to meet 61% of the total demand in Basin 80 and its use will increase by 61% (9,330 AFY) from 2010 to 2060. All surface water use and growth in surface water use during this period is from the Municipal and Industrial and Thermoelectric Power demand sectors.
•Alluvial groundwater is used to meet 3% of total demand in the basin. Alluvial groundwater use will increase by 73% (550 AFY) from 2010 to 2060. All alluvial demand and growth in alluvial demand is from the Self-Supplied Residential demand sector.
•Bedrock groundwater is used to meet 36% of total demand in Basin 80 and its use will increase by 56% (5,040 AFY) from 2010 to 2060. The majority of bedrock groundwater demand will come from the Livestock demand sector. However the highest growth in demand will be from the Crop Irrigation and Municipal and Industrial demand sectors.
Total Demand by SectorGrand Region, Basin 80
Planning Horizon
Crop Irrigation LivestockMunicipal &
Industrial Oil & GasSelf-Supplied
IndustrialSelf-Supplied
ResidentialThermoelectric
Power Total
AFY
2010 1,770 4,100 13,740 70 0 940 4,490 25,110
2020 2,350 4,140 15,150 100 0 1,070 5,010 27,820
2030 2,930 4,180 16,660 140 0 1,200 5,590 30,700
2040 3,510 4,210 18,210 190 0 1,340 6,240 33,700
2050 3,960 4,250 19,780 240 0 1,480 6,960 36,670
2060 4,670 4,290 21,390 290 0 1,630 7,760 40,030
Surface Water Demand by Sector
Grand Region, Basin 80
Alluvial Groundwater Demand by Sector
Grand Region, Basin 80
Bedrock Groundwater Demand by Sector
Grand Region, Basin 80
nThermoelectric Power nSelf-Supplied Residential nSelf-Supplied Industrial nOil & Gas nMunicipal & Industrial nLivestock nCrop Irrigation

Grand Regional Report, Basin Data & Analysis 47Oklahoma Comprehensive Water Plan
Current Monthly Demand Distribution by Sector•The Municipal and Industrial and Self-
Supplied Residential demand sectors use 52% more water in summer months than in winter months. Crop Irrigation has a high demand in summer months and little or no demand in winter months. Thermoelectric Power demand is highest in August and October and lowest in March and November. Other demand sectors have a more consistent demand throughout the year.
Current Monthly Demand Distribution by Source•The peak summer month total demand
in Basin 80 is about 1.7 times the peak winter demand, which is less pronounced than the overall statewide pattern. Surface water use in the peak summer month is about 1.4 times the peak winter month demand. Bedrock groundwater use in the peak summer month is about 2.3 times the monthly winter demand. Alluvial groundwater demand in the peak summer month is about 1.6 times the winter demand.
Monthly Demand Distribution by Source (2010)Grand Region, Basin 80
Monthly Demand Distribution by Sector (2010)Grand Region, Basin 80
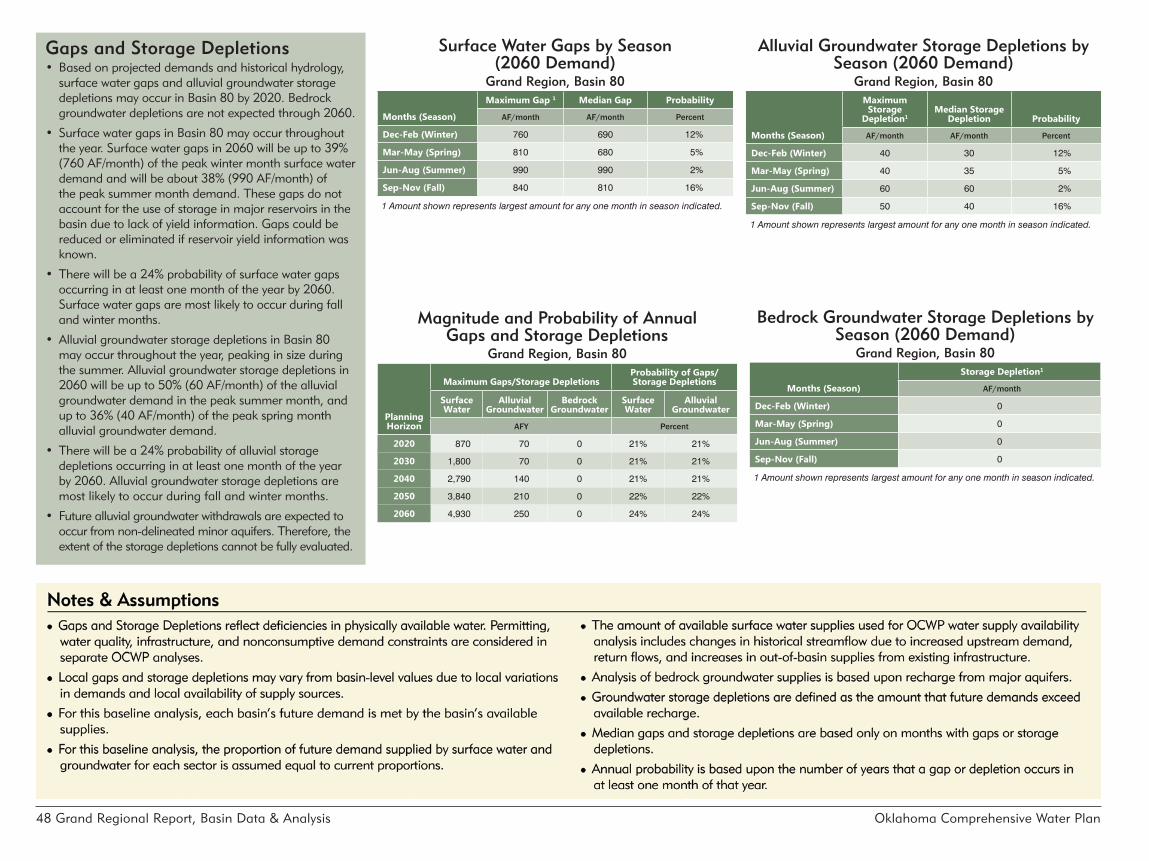
48 Grand Regional Report, Basin Data & Analysis Oklahoma Comprehensive Water Plan
Gaps and Storage Depletions•Based on projected demands and historical hydrology,
surface water gaps and alluvial groundwater storage depletions may occur in Basin 80 by 2020. Bedrock groundwater depletions are not expected through 2060.
• Surface water gaps in Basin 80 may occur throughout the year. Surface water gaps in 2060 will be up to 39% (760 AF/month) of the peak winter month surface water demand and will be about 38% (990 AF/month) of the peak summer month demand. These gaps do not account for the use of storage in major reservoirs in the basin due to lack of yield information. Gaps could be reduced or eliminated if reservoir yield information was known.
• There will be a 24% probability of surface water gaps occurring in at least one month of the year by 2060. Surface water gaps are most likely to occur during fall and winter months.
•Alluvial groundwater storage depletions in Basin 80 may occur throughout the year, peaking in size during the summer. Alluvial groundwater storage depletions in 2060 will be up to 50% (60 AF/month) of the alluvial groundwater demand in the peak summer month, and up to 36% (40 AF/month) of the peak spring month alluvial groundwater demand.
• There will be a 24% probability of alluvial storage depletions occurring in at least one month of the year by 2060. Alluvial groundwater storage depletions are most likely to occur during fall and winter months.
• Future alluvial groundwater withdrawals are expected to occur from non-delineated minor aquifers. Therefore, the extent of the storage depletions cannot be fully evaluated.
Magnitude and Probability of Annual Gaps and Storage Depletions
Grand Region, Basin 80
Planning Horizon
Maximum Gaps/Storage DepletionsProbability of Gaps/Storage Depletions
Surface Water
Alluvial Groundwater
Bedrock Groundwater
Surface Water
Alluvial Groundwater
AFY Percent
2020 870 70 0 21% 21%
2030 1,800 70 0 21% 21%
2040 2,790 140 0 21% 21%
2050 3,840 210 0 22% 22%
2060 4,930 250 0 24% 24%
Alluvial Groundwater Storage Depletions by Season (2060 Demand)
Grand Region, Basin 80
Months (Season)
Maximum Storage
Depletion1Median Storage
Depletion Probability
AF/month AF/month Percent
Dec-Feb (Winter) 40 30 12%
Mar-May (Spring) 40 35 5%
Jun-Aug (Summer) 60 60 2%
Sep-Nov (Fall) 50 40 16%
1 Amount shown represents largest amount for any one month in season indicated.
Surface Water Gaps by Season (2060 Demand)
Grand Region, Basin 80
Months (Season)
Maximum Gap 1 Median Gap Probability
AF/month AF/month Percent
Dec-Feb (Winter) 760 690 12%
Mar-May (Spring) 810 680 5%
Jun-Aug (Summer) 990 990 2%
Sep-Nov (Fall) 840 810 16%
1 Amount shown represents largest amount for any one month in season indicated.
Bedrock Groundwater Storage Depletions by Season (2060 Demand)
Grand Region, Basin 80
Months (Season)
Storage Depletion1
AF/month
Dec-Feb (Winter) 0
Mar-May (Spring) 0
Jun-Aug (Summer) 0
Sep-Nov (Fall) 0
1 Amount shown represents largest amount for any one month in season indicated.

Grand Regional Report, Basin Data & Analysis 49Oklahoma Comprehensive Water Plan
Water Supply Options & Effectiveness
Demand Managementn Moderately expanded permanent conservation activities in the Municipal and Industrial demand sector could
reduce surface water gaps by about 34% and could reduce alluvial groundwater storage depletions by about 40%. Temporary drought management could be effective to reduce surface water use and subsequent gaps. However, since groundwater storage could continue to provide supplies during droughts, temporary drought management may not be needed to meet alluvial groundwater demand.
Out-of-Basin Suppliesn Due to the abundance of in-basin reservoir storage and groundwater supplies, out-of-basin supplies may not
be cost-effective for many users in the basin.
Reservoir Usen The OCWP Reservoir Viability Study, which evaluated the potential for reservoirs throughout the state,
identified Chelsea Reservoir as a potentially viable site in Basin 80. The GRDA should be consulted for the feasibility of using existing storage or developing additional reservoir storage in the basin. The Grand River Dam Authority has jurisdiction over the administration of surface water in Basin 80. Instead of actual appropriation of waters, the agency enters into repayment contracts for the use of surface water resources in the basin. Several public water providers contract with GRDA for water supply from its lakes, and GRDA should be consulted for the availability of surface water supplies in the basin.
Increasing Reliance on Surface Watern In general, increased reliance on surface water through direct diversions, without reservoir storage, may
increase gaps and is not recommended.
Increasing Reliance on Groundwatern Increased reliance on the Roubidoux aquifer and minor bedrock aquifers could mitigate surface water gaps
and alluvial groundwater depletions without major impacts to bedrock storage. However, localized seasonal storage depletions could occur. In addition, minor aquifers may have smaller yields, thus site specific studies should be conducted before large-scale use.
n Typically Effective n Potentially Effective
n Likely Ineffective n No Option Necessary
Reducing Water Needs Through Conservation
Grand Region, Basin 80
Conservation Activities1
2060 Gap/Storage Depletion
2060 Gap/Storage Depletion
Probability
Surface Water
Alluvial GW
Bedrock GW
Surface Water
Alluvial GW
AFY Percent
Existing Conditions 4,930 250 0 24% 24%
Moderately Expanded Conservation in Crop Irrigation Water Use 4,930 250 0 24% 24%
Moderately Expanded Conservation in M&I Water Use 3,270 150 0 22% 22%
Moderately Expanded Conservation in Crop Irrigation and M&I Water Use
3,270 150 0 22% 22%
Substantially Expanded Conservation in Crop Irrigation and M&I Water Use
2,300 110 0 21% 21%
1 Conservation Activities are documented in the OCWP Water Demand Forecast Report.
Reliable Diversions Based on Available Streamflow and New Reservoir Storage
Grand Region, Basin 80Reservoir Storage Diversion
AF AFY
100 NA
500 NA
1,000 NA
2,500 NA
5,000 NA
Required Storage to Meet Growth in Demand (AF) +NA
Required Storage to Meet Growth in Surface Water Demand (AF) NA
NOT EVALUATED


51
Oklahoma Comprehensive Water Plan
Data & AnalysisGrand Watershed Planning Region
Basin 81

52 Grand Regional Report Oklahoma Comprehensive Water Plan
Basin 81 accounts for about 33% of the current demand in the Grand Watershed Planning Region . About 68% of the demand is in the Municipal and Industrial demand sector . Livestock (18%) is the second-largest demand sector . Surface water is used to satisfy only about 3% of the current demand in the basin . Bedrock groundwater satisfies about 97% of the current demand in the basin . The peak summer month demand in Basin 81 is about 1 .7 times the winter demand, which is less pronounced than the overall statewide pattern .
Grand Lake is operated by the Grand River Dam Authority (GRDA) for hydroelectric power generation and flood control . The GRDAhasjurisdictionoverthestreamflow
in Basin 81 and should be consulted for the availability of surface water supplies in the basin . The Grand River near Langley typically has flows greater than 130,000 AF/month throughout the year and greater than 400,000 AF/month in the spring and early summer . Peak flows generally occur during May and June each year . However, the river can have prolonged periods of low flow in any month of the year . Relative to other basins in the state,thesurfacewaterqualityinBasin81isconsidered fair . Horse Creek, Russell Creek, and Cave Springs Branch are impaired for Agricultural use due to high levels of sulfates, chloride, and total dissolved solids (TDS) .
ThemajorityofgroundwaterrightsinBasin81areintheRoubidouxmajorbedrock
Synopsis � Water users are expected to continue to rely primarily on bedrock groundwater
supplies.
� Based on projected demand and historical hydrology, surface water gaps and groundwater storage depletions are not are expected to occur in this basin through 2060. Therefore, no supply options are necessary. However, localized gaps and storage depletions may occur.
Water ResourcesGrand Region, Basin 81
Basin 81 Summary
Current Demand by Source and SectorGrand Region, Basin 81
ToTal DemanD
12,180 AFY

Grand Regional Report 53 Oklahoma Comprehensive Water Plan
aquifer.TheRoubidouxaquiferreceivesanestimated 119,000 AFY of recharge in Basin 81 and has over 9 million AF of storage in the basin . There are also substantial groundwater rightsintheBooneminorbedrockaquiferand a small number of water rights in the NortheasternOklahomaPennsylvanianminorbedrockaquifer.Self-SuppliedResidentialdemand (domestic use), which does not requireapermit,isassumedtobesuppliedbygroundwater sources . There are no significant widespreadgroundwaterqualityissuesinthebasin . However, concentrations of chloride and naturally occurring radioactivity may exceed drinking water standards in some localizedareasoftheRoubidouxaquifer.Theuse of groundwater to meet in-basin demand is
not expected to be limited by the availability of permits through 2060 .
Theprojected2060waterdemandof17,510AFY in Basin 81 reflects a 5,330 AFY increase (44%) over the 2010 demand .
Gaps & DepletionsBasedonprojecteddemandandhistoricalhydrology, surface water gaps and groundwater storage depletions are not expected to occur in this basin through 2060 . However, localized gaps and storage depletions may occur .
OptionsSurface water gaps and groundwater storage depletions are not expected through 2060; therefore, no supply options are necessary .
Water Supply LimitationsGrand Region, Basin 81
Surface Water
Alluvial Groundwater
Bedrock Groundwater
n Minimal n Potential n Significant
Water Supply Option Effectiveness
Grand Region, Basin 81
Demand Management
Out-of-Basin Supplies
Reservoir Use
Increasing Supply from Surface Water
Increasing Supply from Groundwater
n Typically Effective n Potentially Effective
n Likely Ineffective n No Option Necessary
Median Historical Streamflow at the Basin OutletGrand Region, Basin 81
Projected Water DemandGrand Region, Basin 81

54 Grand Regional Report, Basin Data & Analysis Oklahoma Comprehensive Water Plan
Historical Streamflow at the Basin OutletGrand Region, Basin 81
Historical PrecipitationRegional Climate Division
Surface Water Resources•Historical streamflow from 1950 through
2007 was used to estimate the range of future surface water supplies. Basin 81 had a prolonged period of below-average streamflow from the early 1960s and early 1970s, corresponding to a period of below-average precipitation. From the early 1990s to the early 2000s, the basin went through a prolonged period of above-average streamflow and precipitation, demonstrating hydrologic variability in the basin.
•The median streamflow in the Grand River upstream of the Arkansas River is greater than 130,000 AF/month throughout the year and greater than 400,000 AF/month in the spring and early summer. However, the river can have prolonged periods of low flow in any month of the year.
•Relative to other basins in the state, the surface water quality in Basin 81 is considered fair.
•Grand Lake is operated by the Grand River Dam Authority (GRDA) for hydroelectric power generation and by the Corps of Engineers for flood control. The GRDA should be consulted for the availability of water supply from this reservoir.
Monthly Historical Streamflow at the Basin OutletGrand Region, Basin 81
Basin 81 Data & Analysis

Grand Regional Report, Basin Data & Analysis 55Oklahoma Comprehensive Water Plan
Groundwater Resources - Aquifer Summary (2010)Grand Region, Basin 81
AquiferPortion of Basin
Overlaying Aquifer
Current Groundwater
RightsAquifer Storage
in Basin
Equal Proportionate
Share
Groundwater Available for New Permits
Name Type Class1 Percent AFY AF AFY/Acre AFY
Roubidoux Bedrock Major 99% 11,400 9,082,000 temporary 2.0 1,120,100
Boone Bedrock Minor 89% 7,500 8,824,000 temporary 2.0 1,014,500
Northeastern Oklahoma Pennsylvanian Bedrock Minor 32% 100 427,000 temporary 2.0 371,200
Northern Neosho River Alluvial Minor 7% 0 71,000 temporary 2.0 76,800
Non-Delineated Groundwater Source Bedrock Minor N/A 0 N/A temporary 2.0 N/A
Non-Delineated Groundwater Source Alluvial Minor N/A 0 N/A temporary 2.0 N/A
1 Bedrock aquifers with typical yields greater than 50 gpm and alluvial aquifers with typical yields greater than 150 gpm are considered major.
Groundwater Resources•Basin 81 has substantial groundwater
supplies. The majority of groundwater rights are in the Roubidoux major bedrock aquifer. The estimated major bedrock aquifer recharge to this aquifer from Basin 81 is 119,000 AFY. There are also substantial groundwater rights in the Boone minor bedrock aquifer and a small number of water rights in the Northeastern Oklahoma Pennsylvanian minor bedrock aquifer.
•There are no significant widespread groundwater quality issues in the basin. However, concentrations of chloride and naturally occurring radioactivity may exceed drinking water standards in some localized areas of the Roubidoux aquifer.

56 Grand Regional Report, Basin Data & Analysis Oklahoma Comprehensive Water Plan
nThermoelectric Power nSelf-Supplied Residential nSelf-Supplied Industrial nOil & Gas nMunicipal & Industrial nLivestock nCrop Irrigation
Total Demand by SectorGrand Region, Basin 81
Planning Horizon
Crop Irrigation LivestockMunicipal &
Industrial Oil & GasSelf-Supplied
IndustrialSelf-Supplied
ResidentialThermoelectric
Power Total
AFY
2010 660 2,220 8,320 0 0 980 0 12,180
2020 760 2,260 9,120 0 0 1,070 0 13,210
2030 850 2,300 9,900 0 0 1,160 0 14,210
2040 950 2,340 10,730 0 0 1,250 0 15,270
2050 1,020 2,380 11,600 0 0 1,350 0 16,350
2060 1,140 2,430 12,490 0 0 1,450 0 17,510
Water Demand•Basin 81 accounts for about 33% of the
total water demand in the Grand Region and will increase by 44% (5,330 AFY) from 2010 to 2060. The majority of the demand and growth in demand during this period will be in the Municipal and Industrial demand sector.
• Surface water is used to meet 3% of the total demand in Basin 81 and its use will increase by 25% (90 AFY) from 2010 to 2060. The majority of surface water use and growth in surface water use during this period will be in the Crop Irrigation and Livestock demand sectors.
•Alluvial groundwater demands are projected to be less than 3 AFY in 2060, which is minimal on a basin scale. All alluvial groundwater use is from the Self-Supplied Residential demand sector.
•Bedrock groundwater is used to meet 97% of total demand in Basin 81 and its use will increase by 44% (5,250 AFY) from 2010 to 2060. The majority of bedrock groundwater use and increase in bedrock groundwater use during this period will be in the Municipal and Industrial demand sector.
Bedrock Groundwater Demand by Sector
Grand Region, Basin 81
Surface Water Demand by Sector
Grand Region, Basin 81
Alluvial Groundwater Demand by Sector
Grand Region, Basin 81

Grand Regional Report, Basin Data & Analysis 57Oklahoma Comprehensive Water Plan
Current Monthly Demand Distribution by Sector•The Municipal and Industrial and Self-
Supplied Residential demand sectors use 52% more water in summer months than in winter months. Crop Irrigation has a high demand in summer months and little or no demand in winter months. Other demand sectors have a more consistent demand throughout the year.
Current Monthly Demand Distribution by Source•The peak summer month total water
demand in Basin 81 is about 1.7 times the peak winter month demand, which is less pronounced than the overall statewide pattern. Surface water use in the peak summer month is about 2.2 times the peak winter month demand. Alluvial groundwater use in the peak summer month is about 1.6 times the peak winter month demand. Bedrock groundwater use in the peak summer month is about 1.7 times the peak winter month demand.
Monthly Demand Distribution by Source (2010)Grand Region, Basin 81
Monthly Demand Distribution by Sector (2010)Grand Region, Basin 81
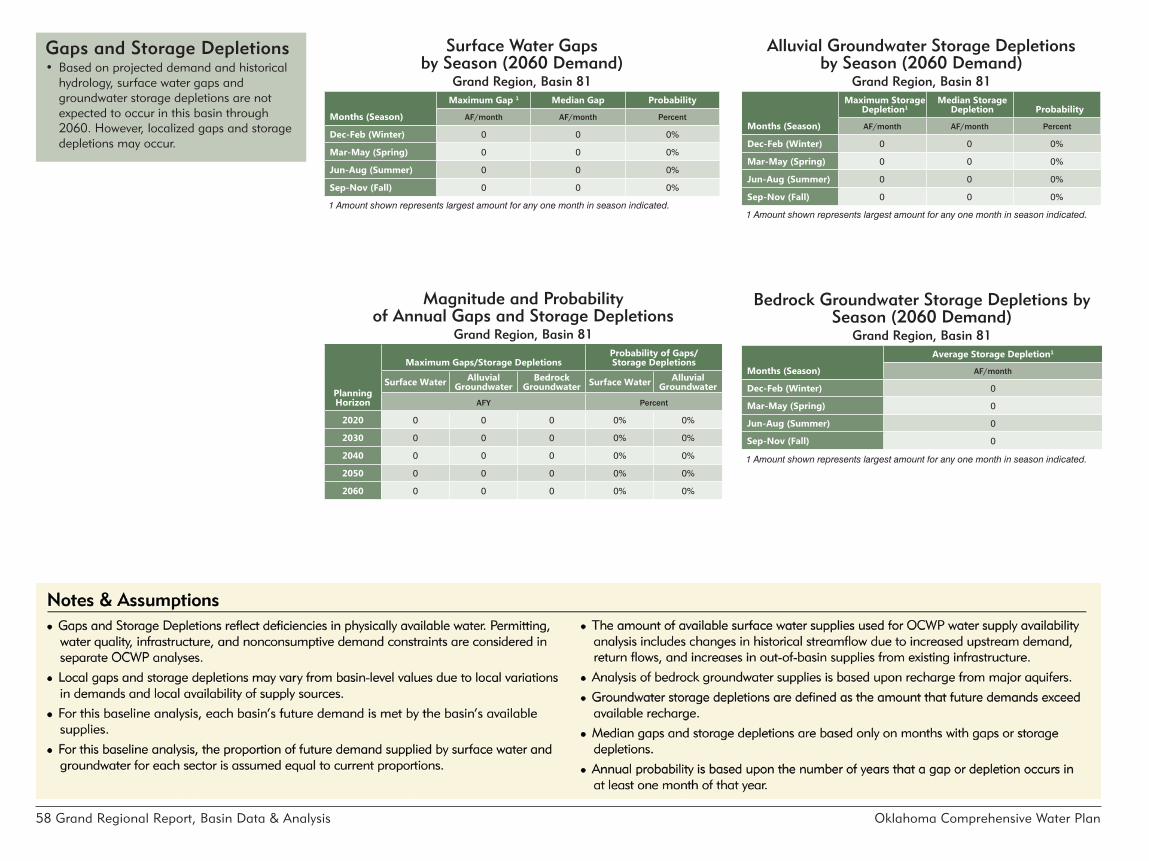
58 Grand Regional Report, Basin Data & Analysis Oklahoma Comprehensive Water Plan
Gaps and Storage Depletions•Based on projected demand and historical
hydrology, surface water gaps and groundwater storage depletions are not expected to occur in this basin through 2060. However, localized gaps and storage depletions may occur.
Magnitude and Probability of Annual Gaps and Storage Depletions
Grand Region, Basin 81
Planning Horizon
Maximum Gaps/Storage DepletionsProbability of Gaps/Storage Depletions
Surface Water Alluvial Groundwater
Bedrock Groundwater Surface Water Alluvial
GroundwaterAFY Percent
2020 0 0 0 0% 0%
2030 0 0 0 0% 0%
2040 0 0 0 0% 0%
2050 0 0 0 0% 0%
2060 0 0 0 0% 0%
Alluvial Groundwater Storage Depletions by Season (2060 Demand)
Grand Region, Basin 81
Months (Season)
Maximum Storage Depletion1
Median Storage Depletion Probability
AF/month AF/month Percent
Dec-Feb (Winter) 0 0 0%
Mar-May (Spring) 0 0 0%
Jun-Aug (Summer) 0 0 0%
Sep-Nov (Fall) 0 0 0%
1 Amount shown represents largest amount for any one month in season indicated.
Surface Water Gaps by Season (2060 Demand)
Grand Region, Basin 81
Months (Season)
Maximum Gap 1 Median Gap Probability
AF/month AF/month Percent
Dec-Feb (Winter) 0 0 0%
Mar-May (Spring) 0 0 0%
Jun-Aug (Summer) 0 0 0%
Sep-Nov (Fall) 0 0 0%
1 Amount shown represents largest amount for any one month in season indicated.
Bedrock Groundwater Storage Depletions by Season (2060 Demand)
Grand Region, Basin 81
Months (Season)
Average Storage Depletion1
AF/month
Dec-Feb (Winter) 0
Mar-May (Spring) 0
Jun-Aug (Summer) 0
Sep-Nov (Fall) 0
1 Amount shown represents largest amount for any one month in season indicated.

Grand Regional Report, Basin Data & Analysis 59Oklahoma Comprehensive Water Plan
Reducing Water NeedsThrough Conservation
Grand Region, Basin 81
Conservation Activities1
2060 Gap/Storage Depletion 2060 Gap/Storage
Depletion Probability
Surface Water
Alluvial GW
Bedrock GW
Surface Water
Alluvial GW
AFY Percent
Existing Conditions 0 0 0 0% 0%
Moderately Expanded Conservation in Crop Irrigation Water Use 0 0 0 0% 0%
Moderately Expanded Conservation in M&I Water Use 0 0 0 0% 0%
Moderately Expanded Conservation in Crop Irrigation and M&I Water Use
0 0 0 0% 0%
Substantially Expanded Conservation in Crop Irrigation and M&I Water Use
0 0 0 0% 0%
1 Conservation Activities are documented in the OCWP Water Demand Forecast Report.
Water Supply Options & Effectiveness•Analyses of current and projected water use patterns
indicate that no surface water gaps or groundwater storage depletions should occur through 2060.
Demand Managementn No option necessary.
Out-of-Basin Suppliesn No option necessary.
Reservoir Usen No option necessary.
Increasing Reliance on Surface Watern No option necessary.
Increasing Reliance on Groundwatern No option necessary.
n Typically Effective n Potentially Effective
n Likely Ineffective n No Option Necessary
Reliable Diversions Based on Available Streamflow and New Reservoir Storage
Grand Region, Basin 81Reservoir Storage Diversion
AF AFY
100 NA
500 NA
1,000 NA
2,500 NA
5,000 NA
Required Storage to Meet Growth in Demand (AF) +NA
Required Storage to Meet Growth in Surface Water Demand (AF) NA
NOT EVALUATED
60 Grand Regional Report Oklahoma Comprehensive Water Plan
Glossary Acre-foot: volume of water that would cover oneacreoflandtoadepthofonefoot;equivalentto 43,560 cubic feet or 325,851 gallons .
Alkalinity: measurement of the water’s ability to neutralize acids . High alkalinity usually indicates the presence of carbonate, bicarbonates, or hydroxides . Waters that have high alkalinity values are often considered undesirable because of excessive hardness and high concentrations of sodium salts . Waters with low alkalinity have little capacity to buffer acidic inputs and are susceptible to acidification (low pH) .
Alluvial aquifer:aquiferwithporousmediaconsisting of loose, unconsolidated sediments deposited by fluvial (river) or aeolian (wind) processes, typical of river beds, floodplains, dunes, and terraces .
Alluvial groundwater: water found in an alluvialaquifer.
Alluvium: sediments of clay, silt, gravel, or other unconsolidated material deposited over time by a flowing stream on its floodplain or delta; frequentlyassociatedwithhigher-lyingterracedeposits of groundwater .
Appendix B areas: waters of the state into which discharges may be limited and that are located within the boundaries of areas listed in Appendix B of OWRB rules Chapter 45 on Oklahoma’s Water Quality Standards (OWQS);includingbutnotlimitedtoNationaland State parks, forests, wilderness areas, wildlife management areas, and wildlife refuges . Appendix B may include areas inhabited by federally listed threatened or endangered species and other appropriate areas .
Appropriative right:rightacquiredunderthe procedure provided by law to take a specific quantityofwaterbydirectdiversionfromastream, an impoundment thereon, or a playa lake,
and to apply such water to a specific beneficial use or uses .
Aquifer: geologic unit or formation that contains sufficient saturated, permeable material toyieldeconomicallysignificantquantitiesofwater to wells and springs .
Artificial recharge: any man-made process specifically designed for the primary purpose of increasing the amount of water entering into an aquifer.
Attainable uses: best uses achievable for a particularwaterbodygivenwaterofadequatequality.
Background: ambient condition upstream or upgradient from a facility, practice, or activity that has not been affected by that facility, practice or activity .
Basin: see Surface water basin .
Basin outlet: the furthest downstream geographic point in an OCWP planning basin .
Bedrock aquifer:aquiferwithporousmediaconsisting of lithified (semi-consolidated or consolidated) sediments, such as limestone, sandstone, siltstone, or fractured crystalline rock .
Bedrock groundwater: water found in a bedrockaquifer.
Beneficial use: (1) The use of stream or groundwater when reasonable intelligence and diligence are exercised in its application for a lawful purpose and as is economically necessary for that purpose . Beneficial uses include but are not limited to municipal, industrial, agricultural, irrigation, recreation, fish and wildlife, etc ., as defined in OWRB rules Chapter 20 on stream water use and Chapter 30 on groundwater use . (2) A classification in OWQS of the waters of the State, according to their best uses in the interest
of the public set forth in OWRB rules Chapter 45 on OWQS .
Board: Oklahoma Water Resources Board .
Chlorophyll-a: primary photosynthetic plant pigmentusedinwaterqualityanalysisasameasure of algae growth .
Conductivity: a measure of the ability of water to pass electrical current . High specific conductance indicates high concentrations of dissolved solids .
Conjunctive management: water management approach that takes into account the interactions between groundwaters and surface waters and how those interactions may affect water availability .
Conservation: protection from loss and waste . Conservation of water may mean to save or store water for later use or to use water more efficiently .
Conservation pool: reservoir storage of water fortheproject’sauthorizedpurposeotherthanflood control .
Consumptive use: a use of water that diverts it from a water supply .
Cultural eutrophication: condition occurring in lakes and streams whereby normal processes of eutrophication are accelerated by human activities .
Dam: any artificial barrier, together with appurtenant works, which does or may impound or divert water .
Degradation: any condition caused by the activities of humans resulting in the prolonged impairmentofanyconstituentofanaquaticenvironment .
Demand:amountofwaterrequiredtomeetthe needs of people, communities, industry, agriculture, and other users .
Demand forecast: estimate of expected water demands for a given planning horizon .
Demand management:adjustinguseof water through temporary or permanent conservation measures to meet the water needs of a basin or region .
Demand sectors: distinct consumptive users of the state’s waters . For OCWP analysis, seven demand sectors were identified: thermoelectric power, self-supplied residential, self-supplied industrial, oil and gas, municipal and industrial, livestock, and crop irrigation .
Dependable yield: the maximum amount of water a reservoir can dependably supply from storage during a drought of record .
Depletion: a condition that occurs when the amount of existing and future demand for groundwater exceeds available recharge .
Dissolved oxygen: amount of oxygen gas dissolved in a given volume of water at a particular temperature and pressure, often expressed as a concentration in parts of oxygen per million parts of water . Low levels of dissolved oxygen facilitate the release of nutrients from sediments .
Diversion: to take water from a stream or waterbody into a pipe, canal, or other conduit, either by pumping or gravity flow .
Domestic use: in relation to OWRB permitting, the use of water by a natural individual or by a family or household for household purposes, for farm and domestic animals up to the normal grazing capacity of the land whether or not the animals are actually owned by such natural individual or family,

Grand Regional Report 61 Oklahoma Comprehensive Water Plan
and for the irrigation of land not exceeding a total of three acres in area for the growing of gardens, orchards, and lawns . Domestic use also includes: (1) the use of water for agriculture purposes by natural individuals, (2) use of water for fire protection, and (3) use of water by non-household entities for drinking water purposes, restroom use, and the watering of lawns, provided that the amount of water used for any such purposes does not exceed five acre-feet per year .
Drainage area: total area above the discharge point drained by a receiving stream .
DWSRF: see State Revolving Fund (SRF) .
Drought management: short-term measures to conserve water to sustain a basin’s or region’s needs during times of below normal rainfall .
Ecoregion (ecological region): an ecologically and geographically defined area; sometimes referred to as a bioregion .
Effluent: any fluid emitted by a source to a stream, reservoir, or basin, including a partially or completely treated waste fluid that is produced by and flows out of an industrial or wastewater treatment plant or sewer .
Elevation: elevation in feet in relation to mean sea level (MSL) .
Equal proportionate share (EPS): portion of the maximum annual yield of water from a groundwater basin that is allocated to each acre of land overlying the basin or subbasin .
Eutrophic:awaterqualitycharacterization,or “trophic status,” that indicates abundant nutrients and high rates of productivity in a lake, frequentlyresultinginoxygendepletionbelowthe surface .
Eutrophication: the process whereby the condition of a waterbody changes from one of low biologic productivity and clear water to one of high productivity and water made turbid by the accelerated growth of algae .
Flood control pool: reservoir storage of excess runoff above the conservation pool storage capacity that is discharged at a regulated rate to reduce potential downstream flood damage .
Floodplain:thelandadjacenttoabodyofwaterwhich has been or may be covered by flooding, including, but not limited to, the one-hundred yearflood(thefloodexpectedtobeequaledorexceeded every 100 years on average) .
Fresh water: water that has less than five thousand (5,000) parts per million total dissolved solids .
Gap: an anticipated shortage in supply of surface water due to a deficiency of physical water supply or the inability or failure to obtain necessary water rights .
Groundwater: fresh water under the surface of the earth regardless of the geologic structure in which it is standing or moving outside the cut bank of a definite stream .
Groundwater basin: a distinct underground body of water overlain by contiguous land having substantially the same geological and hydrological characteristics and yield capabilities.Theareaboundariesofamajoror minor basin can be determined by political boundaries, geological, hydrological, or other reasonable physical boundaries .
Groundwater recharge: see Recharge .
Hardness: a measure of the mineral content of water . Water containing high concentrations (usually greater than 60 ppm) of iron, calcium, magnesium, and hydrogen ions is usually considered “hard water .”
High Quality Waters (HQW): a designation in the OWQS referring to waters that exhibit waterqualityexceedinglevelsnecessarytosupport the propagation of fishes, shellfishes, wildlife, and recreation in and on the water . This designation prohibits any new point source discharge or additional load or increased concentration of specified pollutants .
Hydraulic conductivity: the capacity of rock to transmit groundwater under pressure .
Hydrologic unit code: a numerical designation utilized by the United States Geologic Survey and other federal and state agencies as a way of identifying all drainage basins in the U .S . in a nested arrangement from largest to smallest, consisting of a multi-digit code that identifies each of the levels of classification within two-digit fields .
Hypereutrophic:asurfacewaterqualitycharacterization, or “trophic status,” that indicates excessive primary productivity and excessive nutrient levels in a lake .
Impaired water: waterbody in which the qualityfailstomeetthestandardsprescribedforits beneficial uses .
Impoundment: body of water, such as a pond or lake, confined by a dam, dike, floodgate, or other barrier established to collect and store water .
Infiltration: the gradual downward flow of water from the surface of the earth into the subsurface .
Instream flow:aquantityofwatertobesetaside in a stream or river to ensure downstream environmental, social, and economic benefits are met (further defined in the OCWP Instream Flow Issues & Recommendations report) .
Interbasin transfer: the physical conveyance of water from one basin to another .
Levee: a man-made structure, usually an earthen embankment, designed and constructed to contain, control, or divert the flow of water so as to provide protection from temporary flooding .
Major groundwater basin: a distinct underground body of water overlain by contiguous land and having essentially the same geological and hydrological characteristics and from which groundwater wells yield at least fifty (50) gallons per minute on the average
basinwideiffromabedrockaquifer,andatleastone hundred fifty (150) gallons per minute on the average basinwide if from an alluvium and terraceaquifer,orasotherwisedesignatedbythe OWRB .
Marginal quality water: waters that have been historically unusable due to technological or economic issues associated with diversion, treatment, or conveyance .
Maximum annual yield (MAY): determination by the OWRB of the total amount of fresh groundwater that can be produced from each basin or subbasin allowing a minimum twenty-year life of such basin or subbasin .
Mesotrophic:asurfacewaterqualitycharacterization, or “trophic status,” describing those lakes with moderate primary productivity and moderate nutrient levels .
Million gallons per day (mgd): a rate of flow equalto1.54723cubicfeetpersecondor3.0689acre-feet per day .
Minor groundwater basin: a distinct underground body of water overlain by contiguous land and having substantially the same geological and hydrological characteristics andwhichisnotamajorgroundwaterbasin.
Nitrogen limited: in reference to water chemistry, where growth or amount of primary producers (e .g ., algae) is restricted in a waterbody due in large part to available nitrogen .
Non-consumptive use: use of water in a manner that does not reduce the amount of supply, such as navigation, hydropower production, protection of habitat for hunting, maintaining water levels for boating recreation, or maintaining flow, level and/or temperature for fishing, swimming, habitat, etc .
Non-delineated groundwater source: anareawherenomajororminoraquiferhasbeen studied that may or may not supply a well yield; also referred to as a “non-delineated minoraquifer.”
62 Grand Regional Report Oklahoma Comprehensive Water Plan
Nonpoint source (NPS): a source of pollution without a well-defined point of origin . Nonpointsourcepollutioniscommonlycausedby sediment, nutrients, and organic or toxic substances originating from land use activities . It occurs when the rate of material entering a waterbody exceeds its natural level .
Normal pool elevation: the target lake elevation at which a reservoir was designed to impound water to create a dependable water supply; sometimes referred to as the top of the conservation pool .
Normal pool storage: volume of water held in a reservoir when it is at normal pool elevation .
Numerical criteria: concentrations or other quantitativemeasuresofchemical,physicalorbiological parameters that are assigned to protect the beneficial use of a waterbody .
Numerical standard: the most stringent of the OWQS numerical criteria assigned to the beneficial uses for a given stream .
Nutrient-impaired reservoir: reservoir with a beneficial use or uses impaired by human-induced eutrophication as determined by a Nutrient-Limited Watershed Impairment Study .
Nutrient-Limited Watershed (NLW): watershed of a waterbody with a designated beneficial use that is adversely affected by excess nutrients as determined by a Carlson’s Trophic State Index (using chlorophyll-a) of 62 or greater, orisotherwiselistedas“NLW”inAppendixAofthe OWQS .
Nutrients: elements or compounds essential as raw materials for an organism’s growth and development; these include carbon, oxygen, nitrogen, and phosphorus .
Oklahoma Water Quality Standards (OWQS): rules promulgated by the OWRB in Oklahoma Administrative Code Title 785, Chapter 45, which establish classifications of uses of waters of the state, criteria to maintain and protect such classifications, and other
standardsorpoliciespertainingtothequalityofsuch waters .
Oligotrophic:asurfacewaterqualitycharacterization, or “trophic status,” describing those lakes with low primary productivity and/or low nutrient levels .
Outfall: a point source that contains the effluent being discharged to the receiving water .
Percolation: the movement of water through unsaturated subsurface soil layers, usually continuing downward to the groundwater or water table (distinguished from Seepage) .
Permit availability: the amount of water that could be made available for withdrawals under permits issued in accordance with Oklahoma water law .
pH: the measurement of the hydrogen-ion concentration in water . A pH below 7 is acidic (the lower the number, the more acidic the water, with a decrease of one full unit representing an increase in acidity of ten times) and a pH above 7 (to a maximum of 14) is basic (the higher the number, the more basic the water) . In Oklahoma, fresh waters typically exhibit a pH range from 5 .5 in the southeast to almost 9 .0 in central areas .
Phosphorus limited: in reference to water chemistry, where growth or amount of primary producers (e .g ., algae) is restricted in a waterbody due in large part to the amount of available phosphorus .
Physical water availability: amount of water currently in streams, rivers, lakes, reservoirs, and aquifers;sometimesreferredtoas“wetwater.”
Point source: any discernible, confined and discrete conveyance, including any pipe, ditch, channel, tunnel, well, discrete fissure, container, rolling stock or concentrated animal feeding operation from which pollutants are or may be discharged . This term does not include return flows from irrigation agriculture .
Potable: describing water suitable for drinking .
Primary Body Contact Recreation (PBCR): a classification in OWQS of a waterbody’s use; involves direct body contact with the water where a possibility of ingestion exists . In these cases, the water shall not contain chemical, physical or biological substances in concentrations that irritate the skin or sense organs or are toxic or cause illness upon ingestion by human beings .
Primary productivity: the production of chemical energy in organic compounds by living organisms . In lakes and streams, this is essentially the lowest denominator of the food chain (phytoplankton) bringing energy into the system via photosynthesis .
Prior groundwater right: comparable to a permit, a right to use groundwater recognized by the OWRB as having been established by compliance with state groundwater laws in effect prior to 1973 .
Provider: private or public entity that supplies water to end users or other providers . For OCWP analyses, “public water providers” included approximately 785 non-profit, local governmental municipal or community water systems and rural water districts .
Recharge: the inflow of water to an alluvial or bedrockaquifer.
Reservoir: a surface depression containing water impounded by a dam .
Return water or return flow: the portion of water diverted from a water supply that returns to a watercourse .
Reverse osmosis: a process that removes salts and other substances from water . Pressure isplacedonthestrongeroftwounequalconcentrations separated by a semi-permeable membrane; a common method of desalination .
Riparian water right (riparian right): the rightofanowneroflandadjoiningastreamorwatercourse to use water from that stream for reasonable purposes .
Riverine: relating to, formed by, or resembling a river (including tributaries), stream, etc .
Salinity: the concentration of salt in water measured in milligrams per liter (mg/L) or parts per million (ppm) .
Salt water: any water containing more than five thousand (5,000) parts per million total dissolved solids .
Saturated thickness: thickness below the zone of the water table in which the interstices are filled with groundwater .
Scenic Rivers: streams in “Scenic River” areas designated by the Oklahoma Legislature thatpossessuniquenaturalscenicbeauty,water conservation, fish, wildlife and outdoor recreational values . These areas are listed and described in Title 82 of Oklahoma Statutes, Section 1451 .
Sediment: particles transported and deposited by water deriving from rocks, soil, or biological material .
Seepage: the movement of water through saturated material often indicated by the appearance or disappearance of water at the ground surface, as in the loss of water from a reservoir through an earthen dam (distinguished from Percolation) .
Sensitive sole source groundwater basin or subbasin:amajorgroundwaterbasinorsubbasin all or a portion of which has been designated by the U .S . Environmental Protection Agency(EPA)asa“SoleSourceAquifer”andserves as a mechanism to protect drinking water supplies in areas with limited water supply alternatives . It includes any portion of a contiguousaquiferlocatedwithinfivemilesofthe known areal extent of the surface outcrop of the designated groundwater basin or subbasin .
Sensitive Water Supplies (SWS): designation that applies to public and private water supplies possessing conditions that make them more susceptible to pollution events . This

Grand Regional Report 63 Oklahoma Comprehensive Water Plan
designation restricts point source discharges in the watershed and institutes a 10 μg/L (micrograms per liter) chlorophyll-a criterion to protect against taste and odor problems and reduce water treatment costs .
Soft water: water that contains little to no magnesium or calcium salts .
State Revolving Fund (SRF): fund or program used to provide loans to eligible entitiesforqualifiedprojectsinaccordancewithFederal law, rules and guidelines administered by the EPA and state . Two separate SRF programs are administered in Oklahoma: the Clean Water SRF is intended to control water pollution and is administered by OWRB; the Drinking Water SRF was created to provide safe drinkingwaterandisadministeredjointlybythe OWRB and ODEQ .
Storm sewer: a sewer specifically designed to control and convey stormwater, surface runoff, and related drainage .
Stream system: drainage area of a watercourse or series of watercourses that converges in a large watercourse with defined boundaries .
Stream water: water in a definite stream that includes water in ponds, lakes, reservoirs, and playa lakes .
Streamflow: the rate of water discharged from a source indicated in volume with respect to time .
Surface water: water in streams and waterbodies as well as diffused over the land surface .
Surface water basin: geographic area drained by a single stream system . For OCWP analysis, Oklahoma has been divided into 82 surface water basins (also referenced as “planning basins”) .
Temporary permit: for groundwater basins or subbasins for which a maximum annual yield has not been determined, temporary permits are granted to users allocating two acre-feet of water per acre of land per year .
Temporary permits are for one-year terms that can be revalidated annually by the permittee . Whenthemaximumannualyieldandequalproportionate share are approved by the OWRB, all temporary permits overlying the studied basin are converted to regular permits at the new approved allocation amount .
Terrace deposits: fluvial or wind-blown deposits occurring along the margin and above the level of a body of water and representing the former floodplain of a stream or river .
Total dissolved solids (TDS): a measure of the amount of dissolved material in the water column, reported in mg/L, with values in fresh water naturally ranging from 0-1000 mg/L . High concentrations of TDS limit the suitability of water as a drinking and livestock watering source as well as irrigation supply .
Total maximum daily load (TMDL): sum of individual wasteload allocations for point sources, safety reserves, and loads from nonpoint source and natural backgrounds .
Total nitrogen:forwaterqualityanalysis,ameasure of all forms of nitrogen (organic and inorganic) . Excess nitrogen can lead to harmful algae blooms, hypoxia, and declines in wildlife and habitat .
Total phosphorus:forwaterqualityanalysis, a measure of all forms of phosphorus, often used as an indicator of eutrophication and excessive productivity .
Transmissivity: measure of how much water can be transmitted horizontally through anaquifer.Transmissivityistheproductofhydraulic conductivity of the rock and saturated thicknessoftheaquifer.
Tributary: stream or other body of water, surface or underground, that contributes to another larger stream or body of water .
Trophic State Index (TSI): one of the most commonly used measurements to compare lake trophic status, based on algal biomass . Carlson’s
TSI uses chlorophyll-a concentrations to define the level of eutrophication on a scale of 1 to 100, thus indicating the general biological condition of the waterbody .
Trophic status: a lake’s trophic state, essentially a measure of its biological productivity . The various trophic status levels (Oligotrophic, Mesotrophic, Eutrophic, and Hypereutrophic) provide a relative measure of overallwaterqualityconditionsinalake.
Turbidity: a combination of suspended and colloidal materials (e .g ., silt, clay, or plankton) that reduce the transmission of light through scattering or absorption . Turbidity values are generallyreportedinNephelometricTurbidityUnits(NTUs).
Vested stream water right (vested right): comparable to a permit, a right to use stream water recognized by the OWRB as having been established by compliance with state stream water laws in effect prior to 1963 .
Waste by depletion: unauthorized use of wells or groundwater; drilling a well, taking, or using fresh groundwater without a permit, except for domestic use; taking more fresh groundwater than is authorized by permit; taking or using fresh groundwater so that the water is lost for beneficial use; transporting fresh groundwater from a well to the place of use in such a manner that there is an excessive loss in transit; allowing fresh groundwater to reach a pervious stratum and be lost into cavernous or otherwise pervious materials encountered in a well; drilling wells and producing fresh groundwater there from except inaccordancewithwellspacingrequirements;orusing fresh groundwater for air conditioning or cooling purposes without providing facilities to aerate and reuse such water .
Waste by pollution: permitting or causing the pollution of a fresh water strata or basin through any act that will permit fresh groundwater polluted by minerals or other waste to filter or intrude into a basin or subbasin, or failure to properly plug abandoned fresh water wells .
Water quality: physical, chemical, and biological characteristics of water that determine diversity, stability, and productivity of the climax biotic community or affect human health .
Water right: right to the use of stream or groundwater for beneficial use reflected by permits or vested rights for stream water or permits or prior rights for groundwater .
Wastewater reuse: treated municipal and industrial wastewater captured and reused commonly for non-potable irrigation and industrial applications to reduce demand upon potable water systems .
Water supply: a body of water, whether static or moving on or under the surface of the ground, or in a man-made reservoir, available for beneficial use on a dependable basis .
Water supply availability: for OCWP analysis, the consideration of whether or not water is available that meets three necessary requirements:physicalwaterispresent,thewaterisofausablequality,andawaterrightor permit to use the water has been or can be obtained .
Water supply options: alternatives that a basin or region may implement to meet changing water demands . For OCWP analysis, “primary options“ include demand management, use of out-of-basin supplies, reservoir use, increasing reliance on surface water, and increasing reliance on groundwater; “expanded options” include expanding conservation measures, artificial aquiferrecharge,useofmarginalqualitywatersources, and potential reservoir development .
Water table: The upper surface of a zone of saturation; the upper surface of the groundwater .
Waterbody: any specified segment or body of waters of the state, including but not limited to an entire stream or lake or a portion thereof .
Watercourse: the channel or area that conveys a flow of water .

64 Grand Regional Report Oklahoma Comprehensive Water Plan
Waters of the state: all streams, lakes, ponds, marshes, watercourses, waterways, wells, springs, irrigation systems, drainage systems, and other bodies or accumulations of water, surface and underground, natural or artificial, public or private, which are contained within, flow through, or border upon the state .
Watershed: the boundaries of a drainage area of a watercourse or series of watercourses that diverge above a designated location or diversion point determined by the OWRB .
Well: any type of excavation for the purpose of obtaining groundwater or to monitor or observe conditions under the surface of the earth; does not include oil and gas wells .
Well yield: amount of water that a water supply well can produce (usually in gpm), which generally depends on the geologic formation and well construction .
Wholesale: for purposes of OCWP Public Water Provider analyses, water sold from one public water provider to another .
Withdrawal: water removed from a supply source .

Grand Regional Report 65 Oklahoma Comprehensive Water Plan
AF: acre-foot or acre-feet
AFD: acre-feet per day
AFY: acre-feet per year
BMPs: best management practices
BOD: biochemical oxygen demand
cfs: cubic feet per second
CWAC:CoolWaterAquaticCommunity
CWSRF: Clean Water State Revolving Fund
DO: dissolved oxygen
DWSRF: Drinking Water State Revolving Fund
EPS:equalproportionateshare
FACT: Funding Agency Coordinating Team
gpm: gallons per minute
HLAC:HabitatLimitedAquaticCommunity
HQW: High Quality Waters
HUC: hydrologic unit code
M&I: municipal and industrial
MAY: maximum annual yield
mgd: million gallons per day
μS/cm: microsiemens per centimeter (see specific conductivity)
mg/L: milligrams per liter
NLW: nutrient-limited watershed
NPS: nonpoint source
NPDES:NationalPollutantDischargeElimination System
NRCS:NaturalResourcesConservationService
NTU:NephelometricTurbidityUnit(see “Turbidity”)
OCWP: Oklahoma Comprehensive Water Plan
ODEQ: Oklahoma Department of Environmental Quality
O&G: Oil and Gas
ORW: Outstanding Resource Water
OWQS: Oklahoma Water Quality Standards
OWRB: Oklahoma Water Resources Board
PBCR: Primary Body Contact Recreation
pH: hydrogen ion activity
ppm: parts per million
RD: Rural Development
REAP: Rural Economic Action Plan
SBCR: Secondary Body Contact Recreation
SDWIS: Safe Drinking Water Information System
SRF: State Revolving Fund
SSI: Self-Supplied Industrial
SSR: Self-Supplied Residential
SWS: Sensitive Water Supply
TDS: total dissolved solids
TMDL: total maximum daily load
TSI: Trophic State Index
TSS: total suspended solids
USACE: United States Army Corps of Engineers
USEPA: United States Environmental Protection Agency
USGS: United States Geological Survey
WLA: wasteload allocation
WWAC:WarmWaterAquaticCommunity
Water Quantity Conversion Factors
Desired Unit
CFS GPM MGD AFY AFD
Init
ial U
nit
CFS ----- 450 .646 724 1 .98
GPM .00222 ----- .00144 1 .61 .00442
MGD 1 .55 695 ----- 1120 3 .07
AFY .0014 .62 .00089 ----- .00274
AFD .504 226 .326 365 -----
EXAMPLE: Converting from MGD to CFS . To convert from an initial value of 140 MGD to CFS, multiply 140 times 1 .55 to come up with the desired conversion, which would be 217 CFS (140 X 1 .55 = 217) .
CFS: cubic feet per secondGPM: gallons per minuteMGD: millions gallons per day
AFY: acre-feet per yearAFD: acre-feet per day
1 acre-foot: 325,851 gallons

66 Grand Regional Report Oklahoma Comprehensive Water Plan
Sources AMEC Earth & Environmental . (2011) . Climate Impacts to Streamf low. Commissioned by the Oklahoma
Water Resources Board as a supplement to the 2012 Update of the Oklahoma Comprehensive Water Plan . Available online at http://www .owrb .ok .gov/ocwp (October 2011) .
CDM . (2009) . Programmatic Work Plan. Published through a cooperative agreement with the Oklahoma Water Resources Board and U .S . Army Corps of Engineers as a supplement to the 2012 Update of the Oklahoma Comprehensive Water Plan . Available online at http://www .owrb .ok .gov/ocwp (October 2011) .
CDM . (2009) . Provider Survey Summary Report. Published through a cooperative agreement with the Oklahoma Water Resources Board and U .S . Army Corps of Engineers as a supplement to the 2012 Update of the Oklahoma Comprehensive Water Plan . Available online at http://www .owrb .ok .gov/ocwp (October 2011) .
CDM . (2010) . Artificial Aquifer Recharge Issues and Recommendations. Data and technical input provided bytheOCWPArtificialAquiferRechargeWorkgroup.CommissionedbytheOklahomaStateLegislature in 2008 and published through an agreement with the Oklahoma Water Resources Board as a supplement to the 2012 Update of the Oklahoma Comprehensive Water Plan . Available online at http://www .owrb .ok .gov/ocwp (October 2011) .
CDM . (2010) . Conjunctive Water Management in Oklahoma and Other States. Published through a cooperative agreement with the Oklahoma Water Resources Board and U .S . Army Corps of Engineers as a supplement to the 2012 Update of the Oklahoma Comprehensive Water Plan. Available online at http://www .owrb .ok .gov/ocwp (October 2011) .
CDM . (2010) . Marginal Quality Water Issues and Recommendations. Data and technical input provided by the OCWP Marginal Quality Water Workgroup . Commissioned by the Oklahoma State Legislature in 2008 and published through an agreement with the Oklahoma Water Resources Board as a supplement to the 2012 Update of the Oklahoma Comprehensive Water Plan . Available online at http://www .owrb .ok .gov/ocwp (October 2011) .
CDM . (2011) . Conservation and Climate Change (Water Demand Addendum). Published through a cooperative agreement with the Oklahoma Water Resources Board and U .S . Army Corps of Engineers as a supplement to the 2012 Update of the Oklahoma Comprehensive Water Plan . Available online at http://www .owrb .ok .gov/ocwp (October 2011) .
CDM . (2011) . Drinking Water Infrastructure Needs Assessment by Region. Published through a cooperative agreement with the Oklahoma Water Resources Board and U .S . Army Corps of Engineers as a supplement to the 2012 Update of the Oklahoma Comprehensive Water Plan . Available online at http://www .owrb .ok .gov/ocwp (October 2011) .
CDM . (2011) . Physical Water Supply Availability Report. Published through a cooperative agreement with the Oklahoma Water Resources Board and U .S . Army Corps of Engineers as a supplement to the 2012 Update of the Oklahoma Comprehensive Water Plan . Available online at http://www .owrb .ok .gov/ocwp (October 2011) .
CDM . (2011) . Public Water Supply Planning Guide. Published through a cooperative agreement with the Oklahoma Water Resources Board and U .S . Army Corps of Engineers as a supplement to the 2012 Update of the Oklahoma Comprehensive Water Plan . Available online at http://www .owrb .ok .gov/ocwp (October 2011) .
CDM . (2011) . Water Demand Forecast Report. Published through a cooperative agreement with the Oklahoma Water Resources Board and U .S . Army Corps of Engineers as a supplement to the 2012 Update of the Oklahoma Comprehensive Water Plan . Available online at http://www .owrb .ok .gov/ocwp (October 2011) .
CDM . (2011) . Water Supply Hot Spot Report. Published through a cooperative agreement with the Oklahoma Water Resources Board and U .S . Army Corps of Engineers as a supplement to the 2012 Update of the Oklahoma Comprehensive Water Plan . Available online at http://www .owrb .ok .gov/ocwp (October 2011) .
CDM . (2011) . Water Supply Permit Availability Report. Published through a cooperative agreement with the Oklahoma Water Resources Board and U .S . Army Corps of Engineers as a supplement to the 2012 Update of the Oklahoma Comprehensive Water Plan . Available online at http://www .owrb .ok .gov/ocwp (October 2011) .
C .H . Guernsey & Company . (2010) . Reservoir Viability Study. Commissioned by the Oklahoma Water Resources Board as a supplement to the 2012 Update of the Oklahoma Comprehensive Water Plan . Available online at http://www .owrb .ok .gov/ocwp (October 2011) .
C .H . Guernsey & Company . (2011) . Water Conveyance Study . Commissioned by the Oklahoma Water Resources Board as a supplement to the 2012 Update of the Oklahoma Comprehensive Water Plan . Available online at http://www .owrb .ok .gov/ocwp (October 2011) .
FirstSouthwest Bank . (2011) . Infrastructure Financing Needs and Opportunities. Commissioned by the Oklahoma Water Resources Board as a supplement to the 2012 Update of the Oklahoma Comprehensive Water Plan . Available online at http://www .owrb .ok .gov/ocwp (October 2011) .
INTERA.(2011).Instream Flow Issues and Recommendations . Data and technical input provided by the OCWP Instream Flow Workgroup . Published through an agreement with the Oklahoma Water Resources Board as a supplement to the 2012 Update of the Oklahoma Comprehensive Water Plan . Available online at http://www .owrb .ok .gov/ocwp (October 2011) .
Oklahoma Climatological Survey . (2010) . Climate Issues and Recommendations. Published through an agreement with the Oklahoma Water Resources Board as a supplement to the 2012 Update of the Oklahoma Comprehensive Water Plan . Available online at http://www .owrb .ok .gov/ocwp (October 2011) .
Oklahoma Department of Environmental Quality . (2008) . Integrated Water Quality Assessment Report . Published by the Oklahoma Department of Environmental Quality . Available online at http://www.deq.state.ok.us/wqdnew/305b_303d/ (October 2011) .
OklahomaStateUniversityDivisionofAgricultureSciencesandNaturalResources(DASNR).(2011).Agricultural Water Issues and Recommendations. Commissioned by the Oklahoma Water Resources Board and the Oklahoma Department of Agriculture Food and Forestry as a supplement to the 2012 Update of the Oklahoma Comprehensive Water Plan . Available online at http://www .owrb .ok .gov/ocwp (October 2011) .
Oklahoma Water Resources Board . (1980) . 1980 Update of the Oklahoma Comprehensive Water Plan. Published by the Oklahoma Water Resources Board . Available online at http://www .owrb .ok .gov/ocwp (October 2011) .
Grand Regional Report 67 Oklahoma Comprehensive Water Plan
Oklahoma Water Resources Board . (1995) . 1995 Update of the Oklahoma Comprehensive Water Plan. Published by the Oklahoma Water Resources Board . Available online at http://www .owrb .ok .gov/ocwp (October 2011) .
Oklahoma Water Resources Board . (2007) . Oklahoma Water Atlas. Published by the Oklahoma Water Resources Board .
Oklahoma Water Resources Board . (2011) . 2012 OCWP Executive Report. Published by the Oklahoma Water Resources Board under the authority of the Oklahoma State Legislature as the principal report for the official update of the Oklahoma Comprehensive Water Plan . Available online at http://www .owrb .ok .gov/ocwp (October 2011) .
Oklahoma Water Resources Board . (2011) . Beaver-Cache Watershed Planning Region Report. Published by the Oklahoma Water Resources Board under the authority of the Oklahoma State Legislature as an ancillary report for the official update of the Oklahoma Comprehensive Water Plan . Available online at http://www .owrb .ok .gov/ocwp (October 2011) .
Oklahoma Water Resources Board . (2009) . Beneficial Use Monitoring Program Report. Published by the Oklahoma Water Resources Board . Available online at http://www.owrb.ok.gov/quality/monitoring/bump .php (October 2011) .
Oklahoma Water Resources Board . (2011) . Blue-Boggy Watershed Planning Region Report. Published by the Oklahoma Water Resources Board under the authority of the Oklahoma State Legislature as an ancillary report for the official update of the Oklahoma Comprehensive Water Plan . Available online at http://www .owrb .ok .gov/ocwp (October 2011) .
Oklahoma Water Resources Board . (2011) . Central Watershed Planning Region Report. Published by the Oklahoma Water Resources Board under the authority of the Oklahoma State Legislature as an ancillary report for the official update of the Oklahoma Comprehensive Water Plan . Available online at http://www .owrb .ok .gov/ocwp (October 2011) .
Oklahoma Water Resources Board . (2011) . Eufaula Watershed Planning Region Report. Published by the Oklahoma Water Resources Board under the authority of the Oklahoma State Legislature as an ancillary report for the official update of the Oklahoma Comprehensive Water Plan . Available online at http://www .owrb .ok .gov/ocwp (October 2011) .
Oklahoma Water Resources Board . (2011) . Grand Watershed Planning Region Report. Published by the Oklahoma Water Resources Board under the authority of the Oklahoma State Legislature as an ancillary report for the official update of the Oklahoma Comprehensive Water Plan . Available online at http://www .owrb .ok .gov/ocwp (October 2011) .
Oklahoma Water Resources Board . (2011) . Lower Arkansas Watershed Planning Region Report. Published by the Oklahoma Water Resources Board under the authority of the Oklahoma State Legislature as an ancillary report for the official update of the Oklahoma Comprehensive Water Plan . Available online at http://www .owrb .ok .gov/ocwp (October 2011) .
Oklahoma Water Resources Board . (2011) . Lower Washita Watershed Planning Region Report. Published by the Oklahoma Water Resources Board under the authority of the Oklahoma State Legislature as an ancillary report for the official update of the Oklahoma Comprehensive Water Plan . Available online at http://www .owrb .ok .gov/ocwp (October 2011) .
Oklahoma Water Resources Board . (2011) . Middle Arkansas Watershed Planning Region Report. Published by the Oklahoma Water Resources Board under the authority of the Oklahoma State Legislature as an ancillary report for the official update of the Oklahoma Comprehensive Water Plan . Available online at http://www .owrb .ok .gov/ocwp (October 2011) .
Oklahoma Water Resources Board . (2011) . Oklahoma Statewide Water Quality Trends Analysis. Published by the Oklahoma Water Resources Board as a supplement to the 2012 Update of the Oklahoma Comprehensive Water Plan . Available online at http://www .owrb .ok .gov/ocwp (October 2011) .
Oklahoma Water Resources Board . (2011) . Panhandle Watershed Planning Region Report. Published by the Oklahoma Water Resources Board under the authority of the Oklahoma State Legislature as an ancillary report for the official update of the Oklahoma Comprehensive Water Plan . Available online at http://www .owrb .ok .gov/ocwp (October 2011) .
Oklahoma Water Resources Board . (2011) . Southeast Watershed Planning Region Report. Published by the Oklahoma Water Resources Board under the authority of the Oklahoma State Legislature as an ancillary report for the official update of the Oklahoma Comprehensive Water Plan . Available online at http://www .owrb .ok .gov/ocwp (October 2011) .
Oklahoma Water Resources Board . (2011) . Southwest Watershed Planning Region Report. Published by the Oklahoma Water Resources Board under the authority of the Oklahoma State Legislature as an ancillary report for the official update of the Oklahoma Comprehensive Water Plan . Available online at http://www .owrb .ok .gov/ocwp (October 2011) .
Oklahoma Water Resources Board . (2011) . Upper Arkansas Watershed Planning Region Report. Published by the Oklahoma Water Resources Board under the authority of the Oklahoma State Legislature as an ancillary report for the official update of the Oklahoma Comprehensive Water Plan . Available online at http://www .owrb .ok .gov/ocwp (October 2011) .
Oklahoma Water Resources Board . (2011) . Water Policy and Related Recommendations for Oklahoma. Published by the Oklahoma Water Resources Board as a supplement to the 2012 Update of the Oklahoma Comprehensive Water Plan . Available online at http://www .owrb .ok .gov/ocwp (October 2011) .
Oklahoma Water Resources Board . (2011) . Water Quality Issues and Recommendations. Analysis provided by the OCWP Water Quality Workgroup . Published by the Oklahoma Water Resources Board as a supplement to the 2012 Update of the Oklahoma Comprehensive Water Plan. Available online at http://www .owrb .ok .gov/ocwp (October 2011) .
Oklahoma Water Resources Board . (2011) . West Central Watershed Planning Region Report. Published by the Oklahoma Water Resources Board under the authority of the Oklahoma State Legislature as an ancillary report for the official update of the Oklahoma Comprehensive Water Plan . Available online at http://www .owrb .ok .gov/ocwp (October 2011) .
Robertson, Lindsay . Tribal Water Issues and Recommendations. (2011) . Commissioned through an agreement with the Oklahoma Water Resources Board as a supplement to the 2012 Update of the Oklahoma Comprehensive Water Plan . Available online at http://www .owrb .ok .gov/ocwp (October 2011) .
Wahl, Kenneth L .; Tortorelli, Robert L . Changes in Flow in the Beaver-North Canadian River Basin Upstream from Canton Lake, Western Oklahoma. (1997) . WRI; 96-4304 Published by the United States Geological Survey . Available online at http://pubs .usgs .gov/wri/wri964304/ .